Introduction
Despite the advent of effective vaccines and
antiviral therapy, hepatitis B virus (HBV) infection remains one of
the most important risk factors for the development of
hepatocellular carcinoma (HCC), accounting for at least 50% of
cases of primary liver tumors (1,2). HCC
is the most common malignant disease and is associated with a poor
5-year survival rate (<20%) in most patients (3). Therefore, there still is a great need
for exploring the molecular mechanisms and developing more
effective therapeutic strategies for HBV-related HCC.
It is reported that in addition to ~20,000
protein-coding genes, ~90% of the human genome is
non-protein-coding RNAs, including microRNAs (miRNAs, 21 nt) and
long noncoding RNAs (lncRNAs, 200 nt in length) (4). Thus, aberrant expression of miRNAs
(5,6) and lncRNAs (7,8) may
be potential mechanisms for the progression of HBV-related HCC.
miRNAs have been extensively studied to play important roles in
HBV-related HCC by negatively regulating protein-coding mRNAs by
directly binding to their 3′-untranslated region (3′UTR). For
example, Du et al utilized miRNA microarray to reveal that
miR-382-5p was upregulated in hepatitis B virus core (HBc)
protein-expressed HCC cells. Transfection of miR-382-5p inhibitors
abrogated the enhanced effects of HBc on cell migration and
invasion by regulating the expression of deleted in liver cancer 1
(DCL-1) (9). Li et al
revealed that miR-125a-5p was evidently downregulated in
HBV-related HCC. Overexpression of miR-125a-5p markedly inhibited
cell proliferation and induced cell apoptosis by reducing both the
mRNA and protein levels of its target gene erb-b2 receptor tyrosine
kinase 3 (ErbB3) (10).
The understanding of the lncRNA functions in
HBV-related HCC remains limited except for a few studies that have
elucidated their influence on the expression of related mRNAs. For
example, Liu et al used RNA deep sequencing to demonstrate
that lnc-HUR1 was significantly upregulated in HBV transgenic
HepG2-4D14 cells (11). lnc-HUR1
could enhance cell proliferation by interacting with p53 to block
the transcription of the pro-apoptotic gene B cell lymphoma
2-associated X (Bax) (11). A
study by Jin et al revealed that hepatitis B virus × protein
(HBx) induced upregulation of ZEB2-AS1 by 3.55-fold. Inhibition of
ZEB2-AS1 could reverse the expression of epithelial-mesenchymal
transition (EMT) markers regulated by HBx and then prevent
migration and invasion of HCC cells (12). Recently, accumulating evidence has
indicated that lncRNAs may also suppress miRNA functions by acting
as competing endogenous RNAs (ceRNAs) in HCC (13,14).
Lv et al revealed that lnRNA Unigene56159 promoted the
migration and invasion of HCC cells by acting as a ceRNA for
miR-140-5p to de-repress the expression of Slug and induce EMT
(15). Fan et al observed
that lncRNA n335586 accelerated HCC cell migration and invasion by
facilitating the expression of its host gene CKMT1A by
competitively binding miR-924 (16). Therefore, identification of the
lncRNA-associated ceRNA axes may provide further insights into the
development of HBV-HCC, which to date remains rarely reported.
The aim of the present study was to specifically
identify HBV-HCC related lncRNA ceRNA axes by using microarray or
sequencing data collected from the public database. The study
results may provide potential diagnostic, prognostic and
therapeutic biomarkers for HBV-associated HCC.
Materials and methods
Data collection and preprocessing
The HBV-HCC datasets were downloaded from the Gene
Expression Omnibus (GEO) database (http://www.ncbi.nlm.nih.gov/geo/) on November 2018,
including: i) GSE27462 (17) which
analyzed the lncRNA expression profiling in 5 HBV-HCC and 5 matched
adjacent normal tissues using microarray (Platform: GPL11269,
Arraystar Human lncRNA array version 1); ii) GSE76903 (18) which explored the miRNA expression
profiling in 20 HBV-HCC and 20 matched adjacent normal tissues
using high throughput sequencing (Platform: GPL16791, Illumina
HiSeq 2500, Homo sapiens); and iii) GSE121248 which investigated
the mRNA expression profiling in 70 HBV-HCC and 37 matched adjacent
normal tissues using a microarray technique [Platform: GPL570,
(HG-U133_Plus_2) Affymetrix Human Genome U133 Plus 2.0 Array].
The raw data were respectively preprocessed using
the Linear Models for Microarray Data (LIMMA) package (version
3.34.0; http://bioconductor.org/packages/release/bioc/html/limma.html)
in R (version 3.4.1; http://www.R-project.org/) (19) and oligo package (version 1.41.1;
http://www.bioconductor.org/packages/release/bioc/html/oligo.html)
(20) in R for the GSE27462 and
GSE121248 microarray datasets. The downloaded data had been saved
using the normalized_count function for GSE76903 and preprocessing
was not necessary.
Differential expression analysis
The differentially expressed genes (DEGs) and
lncRNAs (DELs) between HBV-HCC and adjacent normal tissues were
identified using the LIMMA package (19). The differentially expressed miRNAs
(DEMs) between HBV-HCC and adjacent normal tissues were screened
using the EdgeR package of R software (version 3.22.3; http://www.bioconductor.org/packages/release/bioc/html/edgeR.html)
(21). The |logFC(fold change)|
>0.5 and false discovery rate (FDR) <0.05 were considered as
the threshold value. The pheatmap package (version: 1.0.8;
http://cran.r-project.org/web/packages/pheatmap)
in R was used to perform hierarchical clustering based on Euclidean
distance.
lncRNA-miRNA-mRNA ceRNA regulatory
network construction
The DIANA-LncBase database (version 2.0; http://carolina.imis.athena-innovation.gr/diana_tools/web/index.php?r=lncbasev2%2Findex-experimental)
(22) was used to screen the
interactions between DELs and DEMs. Only the DEL-DEM interactions
with opposite expression trend were retained. The target genes of
DEMs were predicted using starBase (version 2.0; http://starbase.sysu.edu.cn/index.php)
which provided the prediction information from five frequently used
algorithms [TargetScan (http://www.targetscan.org/vert_72/), picTar
(https://pictar.mdc-berlin.de), RNA22
(https://cm.jefferson.edu/rna22/), PITA
(https://genie.weizmann.ac.il/pubs/mir07/mir07_prediction.html)
and miRanda (http://www.microrna.org/microrna/home.do)]. The target
genes of DEMs were selected if they were predicted by at least one
algorithm, and were then overlapped with the DEGs to obtain the
DEM-DEG interactions. In addition, only the negative interaction
pairs between DEMs and DEGs were retained. The DEL-DEM and DEM-DEG
interaction pairs were integrated to obtain the DEL-DEM-DEG ceRNA
axes which were used to construct the ceRNA network and visualized
using the Cytoscape software (version 3.6.1; www.cytoscape.org/) (23).
The Database for Annotation, Visualization and
Integrated Discovery (DAVID) online tool (version 6.8; http://david.abcc.ncifcrf.gov) (24) was used for predicting the Kyoto
Encyclopedia of Genes and Genomes (KEGG) pathways and Gene Ontology
(GO) terms of DEGs in the ceRNA network. The pathways or terms with
P-value <0.05 were considered as statistically significant. In
addition, all known HCC related pathways updated to 2017 were also
downloaded from the Comparative Toxicogenomics Database (CTD;
http://ctd.mdibl.org/) using the key word
‘hepatocellular carcinoma’ (25),
which was then overlapped with the pathways enriched by the DEGs in
the ceRNA network to obtain an HCC-related ceRNA network.
Identification of prognosis-related
DELs, DEMs and DEGs in the ceRNA network
The miRNA and mRNA expression profile data of the
HBV-HCC samples were collected from the Cancer Genome Atlas (TCGA;
http://gdc-portal.nci.nih.gov/)
database. Univariate Cox regression analysis was performed to
screen overall survival (OS) and recurrence-free survival
(RFS)-related DELs, DEMs and DEGs using the survival package
(version 2.42.6; http://cran.r-project.org/package=survival). Then,
survival curves were drawn for the significant prognosis-related
DELs, DEMs and DEGs by the Kaplan-Meier method with the log-rank
test using the survival package. P<0.05 was considered to
indicate a statistically significant difference.
Results
Differential expression analysis
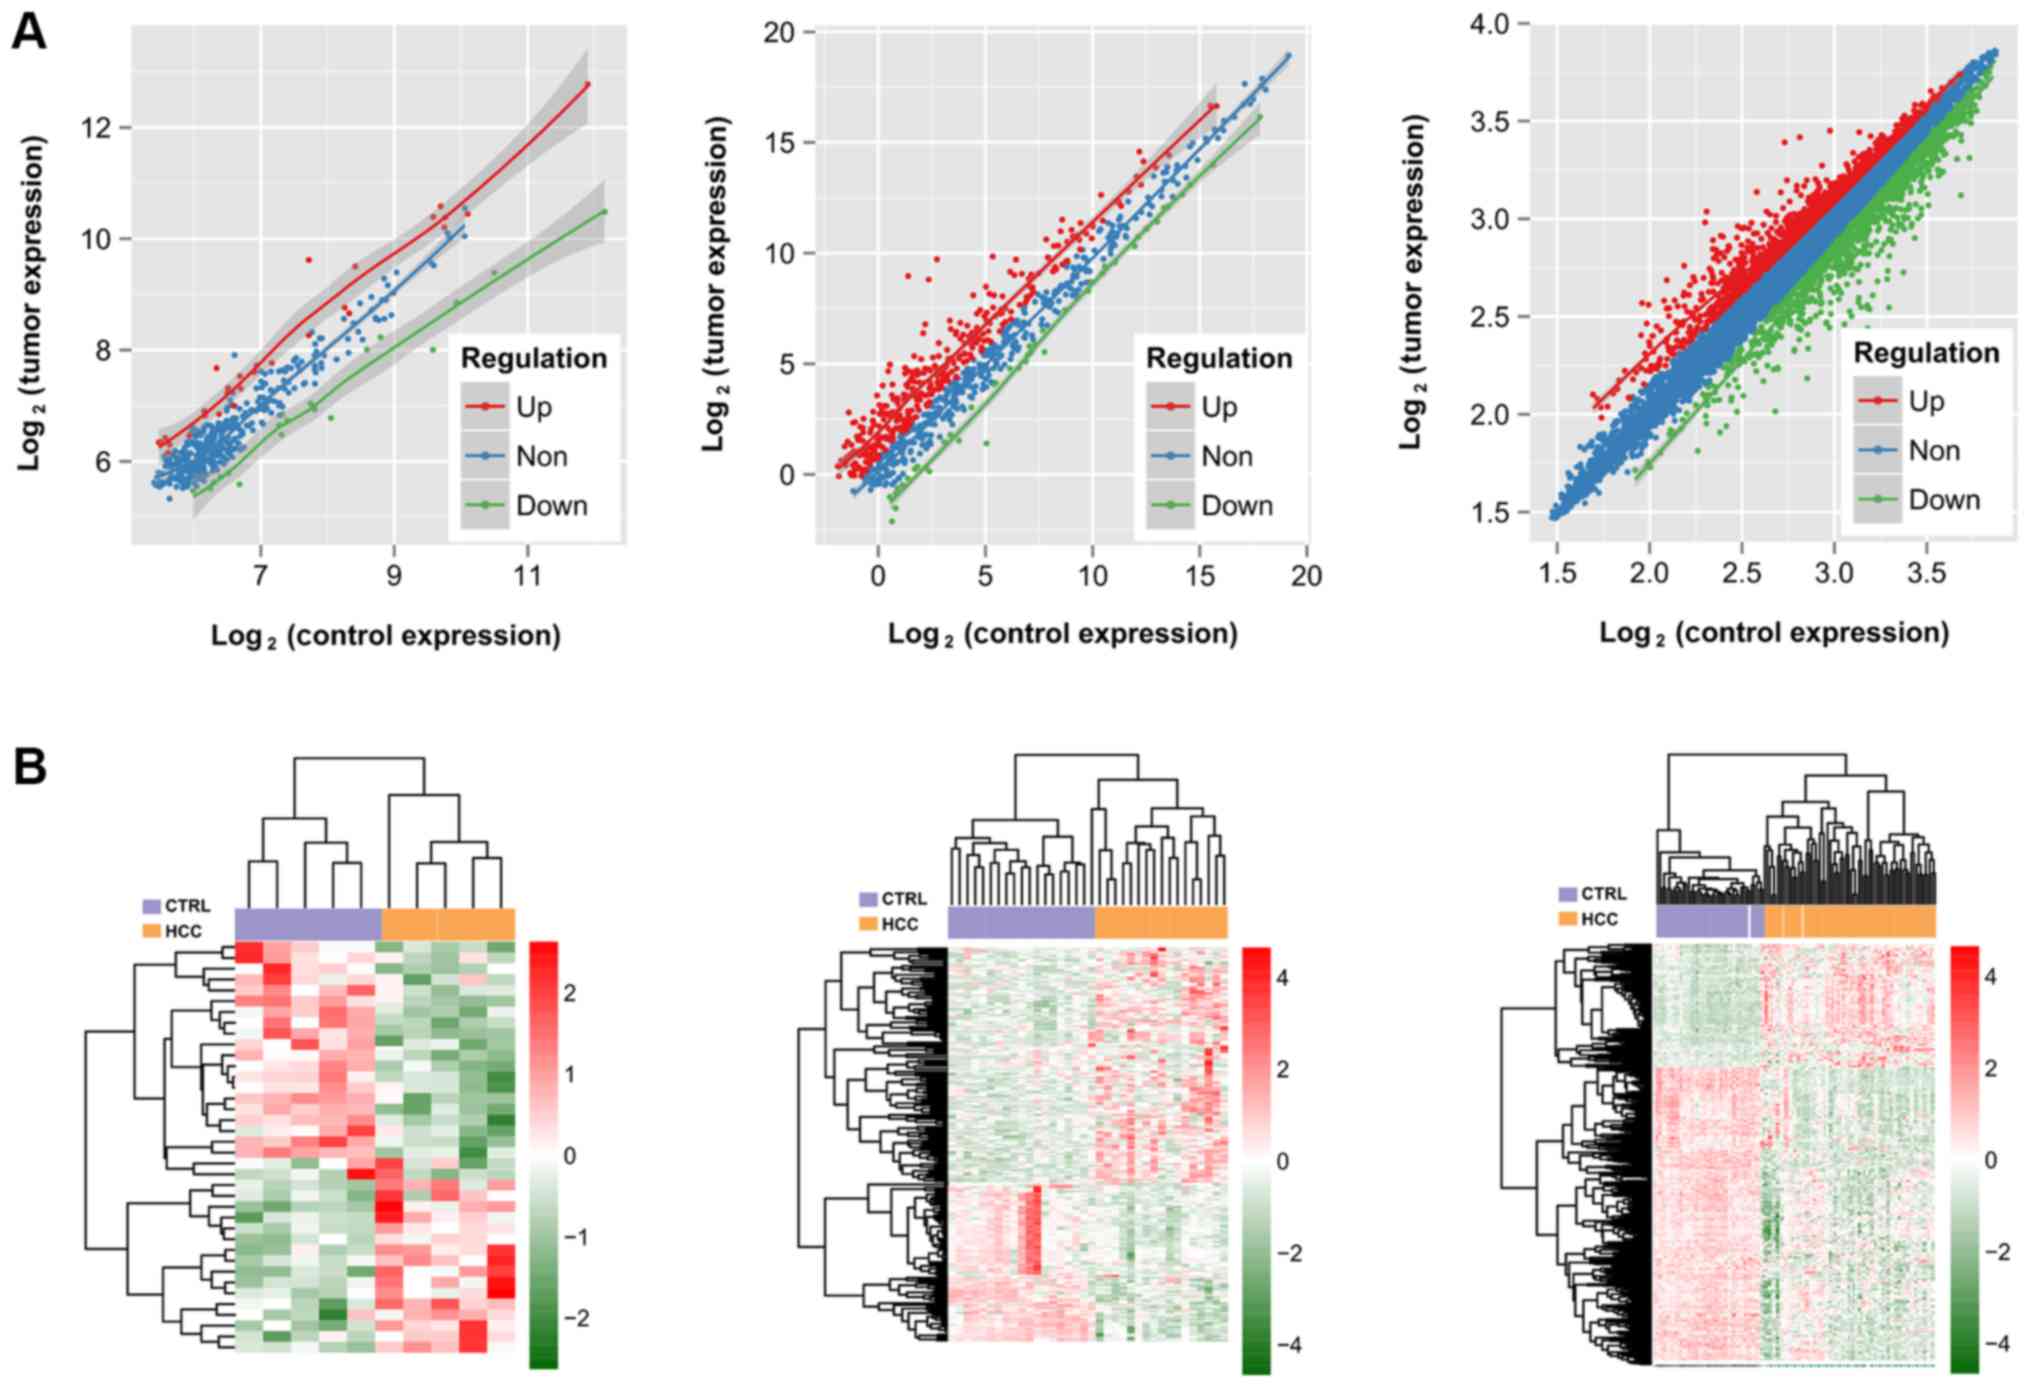
A total of 38 DELs (16 downregulated and 22
upregulated), 127 DEMs (17 downregulated and 110 upregulated) and
721 DEGs (506 downregulated and 215 upregulated) were identified
between HBV-HCC and adjacent normal tissues (Fig. 1A; Table I). The heat map analysis revealed
that the DELs, DEMs and DEGs could be used to distinguish the
HBV-HCC samples from normal samples completely (Fig. 1B).
 | Table I.Differentially expressed lncRNAs,
miRNAs and mRNAs between HCC and adjacent normal tissues. |
Table I.
Differentially expressed lncRNAs,
miRNAs and mRNAs between HCC and adjacent normal tissues.
| mRNA | miRNA | lncRNA |
|---|
|
|
|
|---|
| Symbol | FDR | logFC | Symbol | FDR | logFC | Symbol | FDR | logFC |
|---|
| HAMP | 3.03E-15 | −4.16 | hsa-miR-9-5p | 2.36E-15 | 4.35 | KIAA0087 | 6.00E-04 | 0.86 |
| KCNN2 | 4.13E-24 | −3.99 | hsa-miR-431-5p | 1.71E-13 | 4.02 | SNHG9 | 1.73E-03 | −1.44 |
| CXCL14 | 7.95E-28 | −3.98 | hsa-miR-301b | 8.99E-13 | 3.87 | LINC02203 | 2.01E-03 | 1.81 |
| CNDP1 | 1.25E-19 | −3.75 |
hsa-miR-216b-5p | 1.59E-12 | 3.87 | H19 | 3.55E-03 | 0.97 |
| FCN2 | 6.81E-23 | −3.64 | hsa-miR-483-3p | 1.51E-11 | 3.61 | WWC2-AS2 | 5.30E-03 | 0.82 |
| IGFBP3 | 1.61E-16 | −2.08 | hsa-miR-7974 | 1.45E-10 | 3.48 | HNF1A-AS1 | 1.00E-02 | 0.87 |
| RRM2 | 1.78E-15 | 2.25 |
hsa-miR-323a-3p | 3.79E-10 | 3.37 | TTTY6B | 1.10E-02 | 0.70 |
| STEAP3 | 4.73E-13 | −1.48 | hsa-miR-483-5p | 4.78E-10 | 3.29 | FAM138B | 1.27E-02 | 1.16 |
| ALDH1B1 | 9.83E-12 | −1.16 |
hsa-miR-200c-3p | 8.07E-10 | 3.25 | WEE2-AS1 | 1.30E-02 | 0.54 |
| ACSL4 | 1.83E-11 | 2.81 | hsa-miR-183-5p | 1.92E-09 | 3.15 | HLA-F-AS1 | 1.38E-02 | −0.90 |
| CCNE2 | 7.91E-10 | 1.42 | hsa-miR-410-3p | 2.90E-09 | 3.11 | LINC00284 | 1.80E-02 | −0.61 |
| GLS2 | 1.03E-09 | −2.40 | hsa-miR-182-5p | 8.38E-07 | 2.53 | SNHG15 | 1.83E-02 | −0.54 |
| CA2 | 6.67E-09 | −1.24 | hsa-miR-34c-5p | 3.03E-06 | 2.46 | DLGAP1-AS1 | 2.01E-02 | −0.71 |
| GADD45B | 7.04E-09 | −1.25 | hsa-miR-7-5p | 3.77E-05 | 2.14 | KMT2E-AS1 | 2.12E-02 | −0.68 |
| ACAA2 | 2.51E-08 | −1.01 | hsa-miR-299-3p | 4.17E-05 | 2.11 | LINC00339 | 2.14E-02 | −0.72 |
| FAS | 2.03E-07 | −1.03 | hsa-miR-15b-5p | 1.37E-04 | 1.94 | MAP3K14-AS1 | 2.19E-02 | 0.76 |
| ACSL1 | 6.24E-07 | −1.09 |
hsa-miR-30c-2-3p | 1.97E-03 | −1.61 | LINC00909 | 2.72E-02 | −0.60 |
| THBS1 | 1.46E-06 | −1.56 | hsa-miR-149-5p | 9.85E-03 | 1.35 | SRRM2-AS1 | 3.78E-02 | −0.99 |
| ACADSB | 1.30E-05 | −1.03 | hsa-miR-214-5p | 1.89E-02 | −1.22 | LINC00928 | 4.00E-02 | −0.75 |
| CPS1 | 1.75E-03 | −1.24 | hsa-miR-128-3p | 2.36E-02 | 1.17 | RUSC1-AS1 | 4.06E-02 | −1.03 |
Function enrichment for DEGs
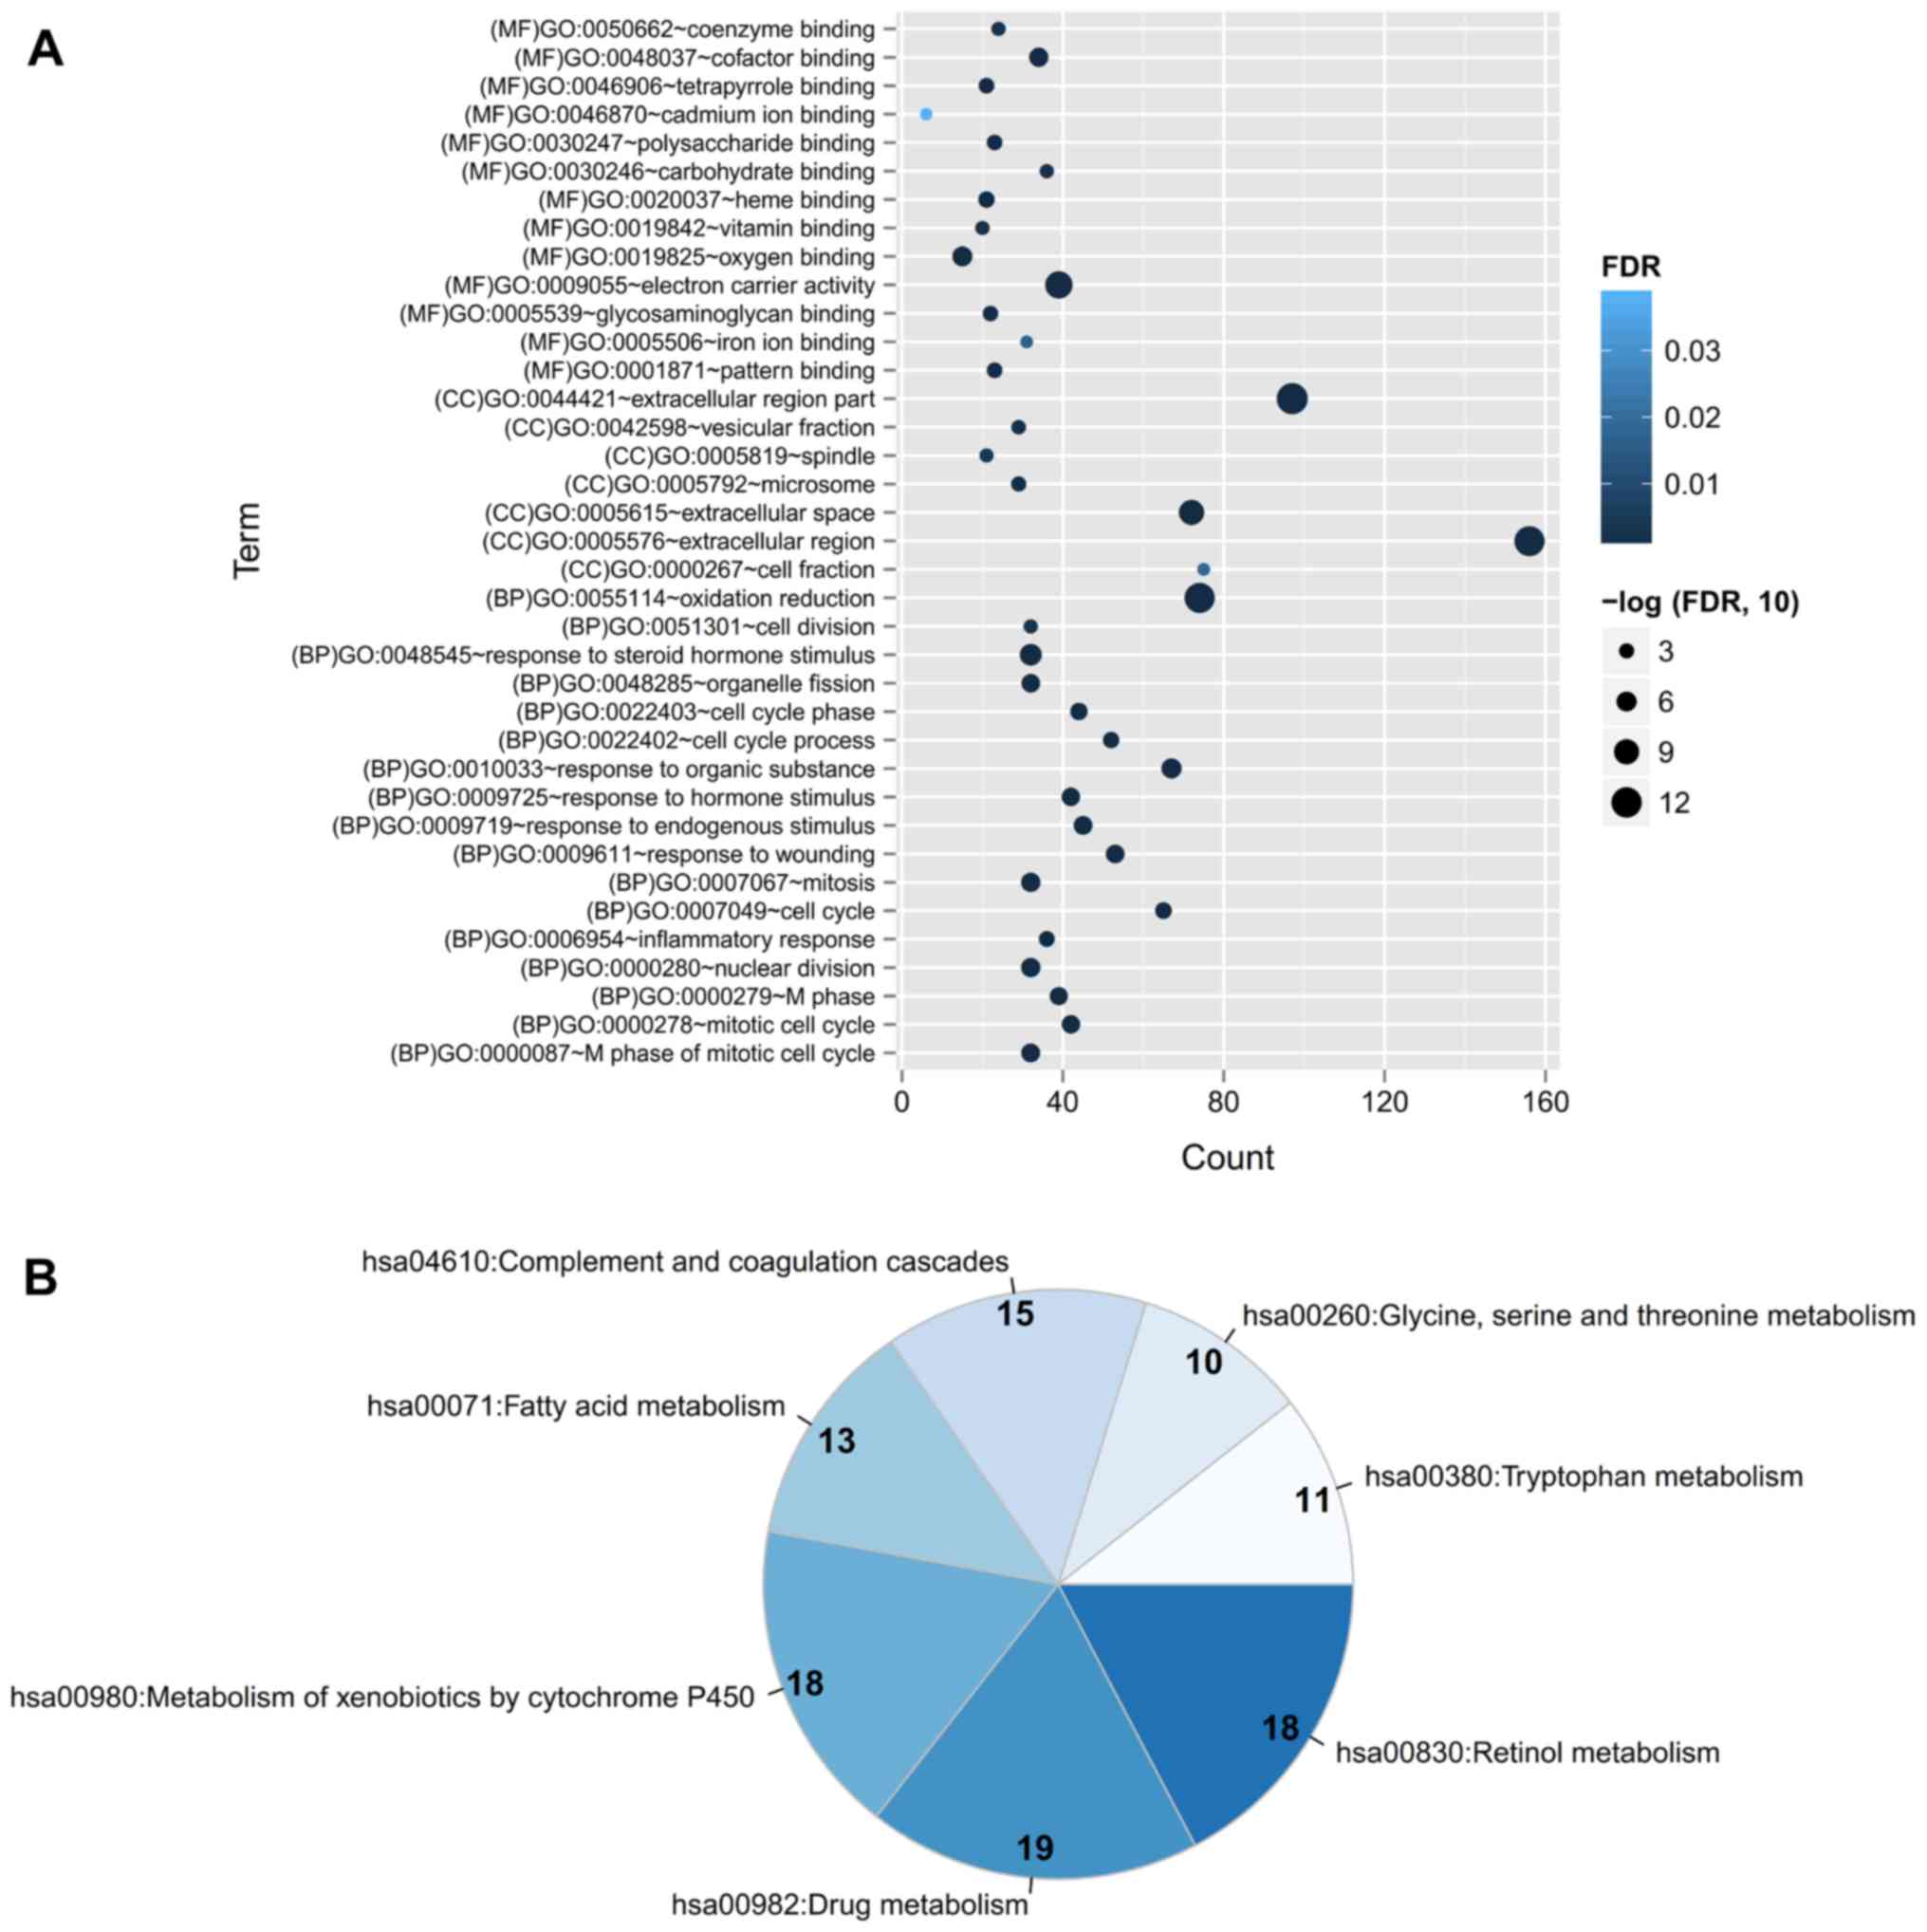
GO terms and KEGG pathway enrichment analyses were
performed for the DEGs to predict their functions by using DAVID
software. The results revealed that 37 GO terms (including 17
biological processes, 7 cellular components and 13 molecular
functions) were enriched for all the DEGs, mainly involving
GO:0055114~oxidation reduction [ribonucleotide reductase M2 subunit
(RRM2)], GO:0048545~response to steroid hormone stimulus [carbonic
anhydrase 2 (CA2)] and GO:0007049~cell cycle [cyclin E2 (CCNE2)]
(Fig. 2). Furthermore, 6 KEGG
pathways were also enriched, including hsa00830:Retinol metabolism,
hsa00982:Drug metabolism, hsa00980:Metabolism of xenobiotics by
cytochrome P450, hsa00071:Fatty acid metabolism,
hsa04610:Complement and coagulation cascades and hsa00260:Glycine,
serine and threonine metabolism (Fig.
2).
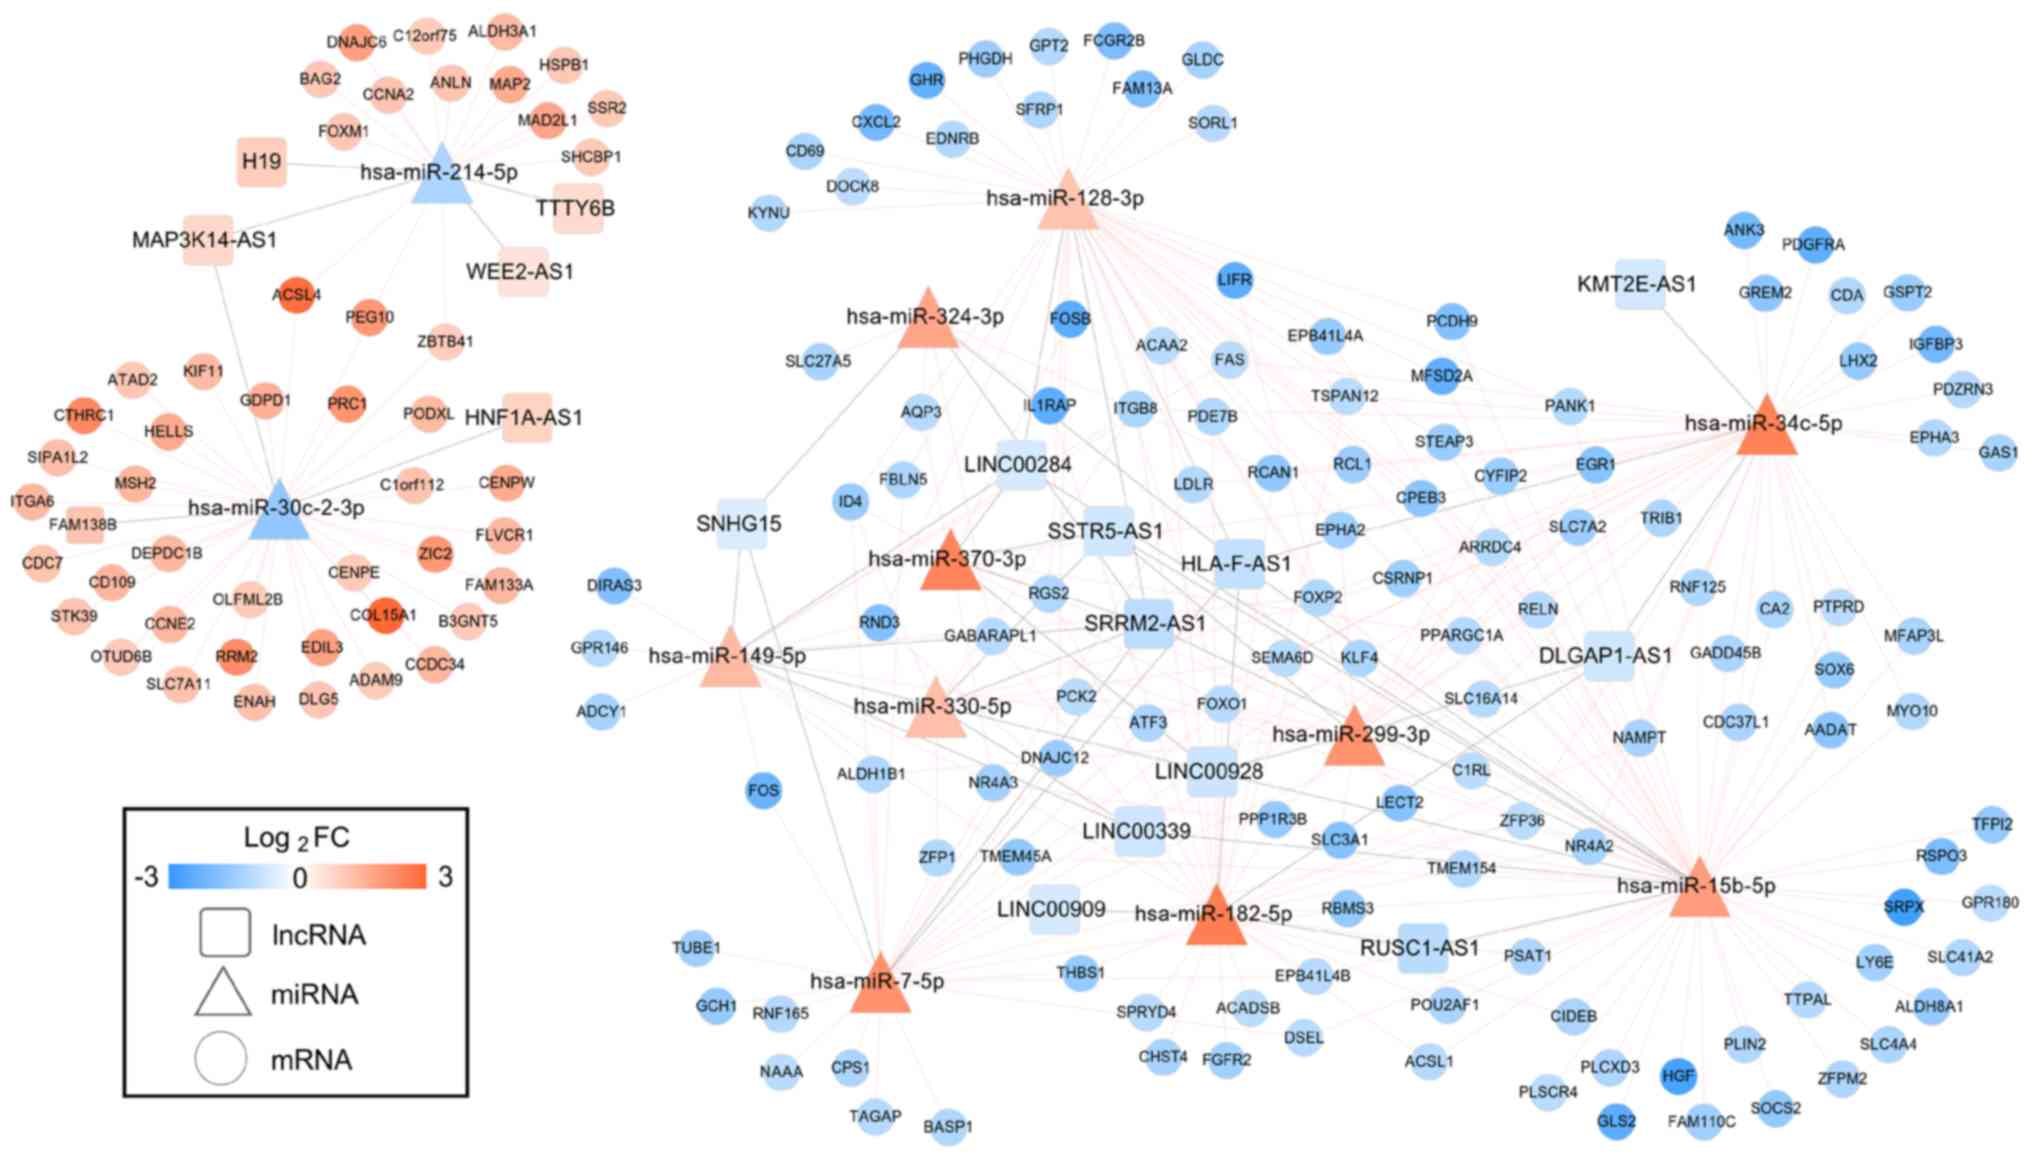
CeRNA network construction
By searching the DIANA-LncBasev2 database, 74
DEL-DEM interaction pairs with the opposite expression trend were
predicted between 18 DELs (12 downregulated and 6 upregulated) and
20 DEMs (2 downregulated and 18 upregulated). Subsequently, the
target genes of the aforementioned 20 DEMs were predicted with the
starBase database. After removing the DEMs and DEGs with the
consistent expression trend, 287 DEM-DEG interaction pairs between
12 DEMs (2 downregulated and 10 upregulated) and 173 DEGs (126
downregulated and 47 upregulated) were retained. By integrating the
DEL-DEM and DEM-DEG interaction pairs, a DEL-DEM-DEG ceRNA network
was constructed, which consisted of 202 nodes (17 DELs: 2
downregulated and 15 upregulated; 12 DEMs: 2 downregulated and 10
upregulated; 173 DEGs: 126 downregulated and 47 upregulated)
(Fig. 3). In this ceRNA network,
the FAM138B-hsa-miR-30c-CCNE2/RRM2 and SSTR5-AS1-has-miR-15b-5p-CA2
ceRNA axes were included.
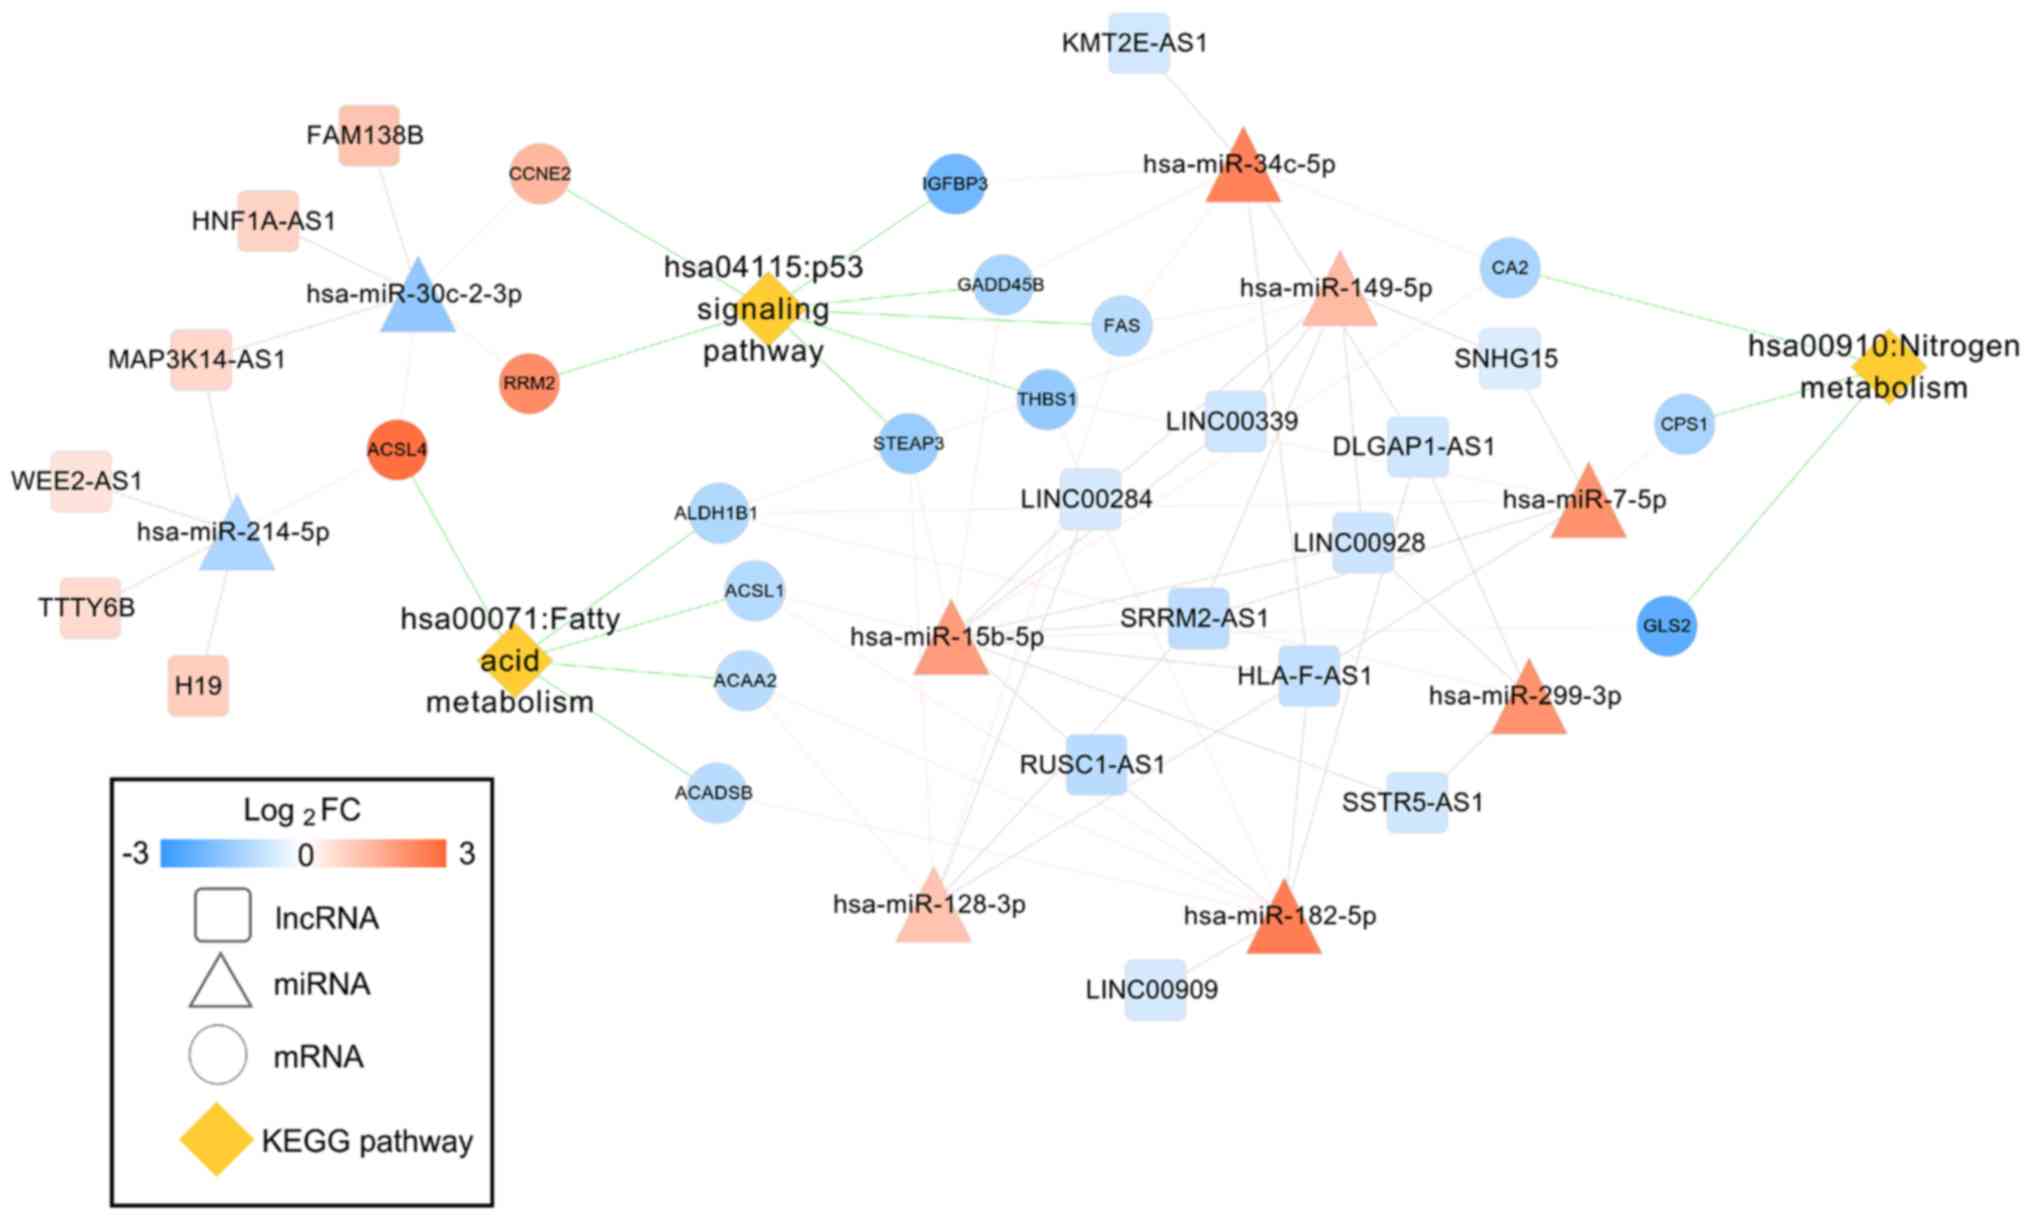
Function enrichment analysis with DAVID revealed
that the genes in the ceRNA network were involved in 3 significant
KEGG pathways, including the hsa04115:p53 signaling pathway (CCNE2,
RRM2), hsa00071:Fatty acid metabolism and hsa00910:Nitrogen
metabolism (CA2) (Table II).
These three pathways were also included in the 244 KEGG pathways
that had been demonstrated to be associated with HCC in the CTD
database. Thus, the DEL-DEM-DEG interaction pairs that were
associated with these three pathways were extracted to form the
HCC-related ceRNA network (Fig.
4).
| Table II.KEGG pathways enriched for the genes
in the ceRNA network. |
Table II.
KEGG pathways enriched for the genes
in the ceRNA network.
| Term | P-value | Genes |
|---|
| hsa04115:p53
signaling pathway | 2.83E-04 | STEAP3, CCNE2,
RRM2, FAS, GADD45B, THBS1, IGFBP3 |
| hsa00071:Fatty acid
metabolism | 1.96 E-03 | ACAA2, ACADSB,
ACSL1, ALDH1B1, ACSL4 |
| hsa00910:Nitrogen
metabolism | 3.82 E-02 | GLS2, CA2,
CPS1 |
Identification of prognosis-related
DELs, DEMs and DEGs in the ceRNA network
Eighty HBV-related HCC samples having OS and RFS
information were collected from TCGA database. Univariate Cox
regression analysis was used to screen OS- and RFS-related DELs,
DEMs and DEGs from the HCC-related ceRNA network in these samples.
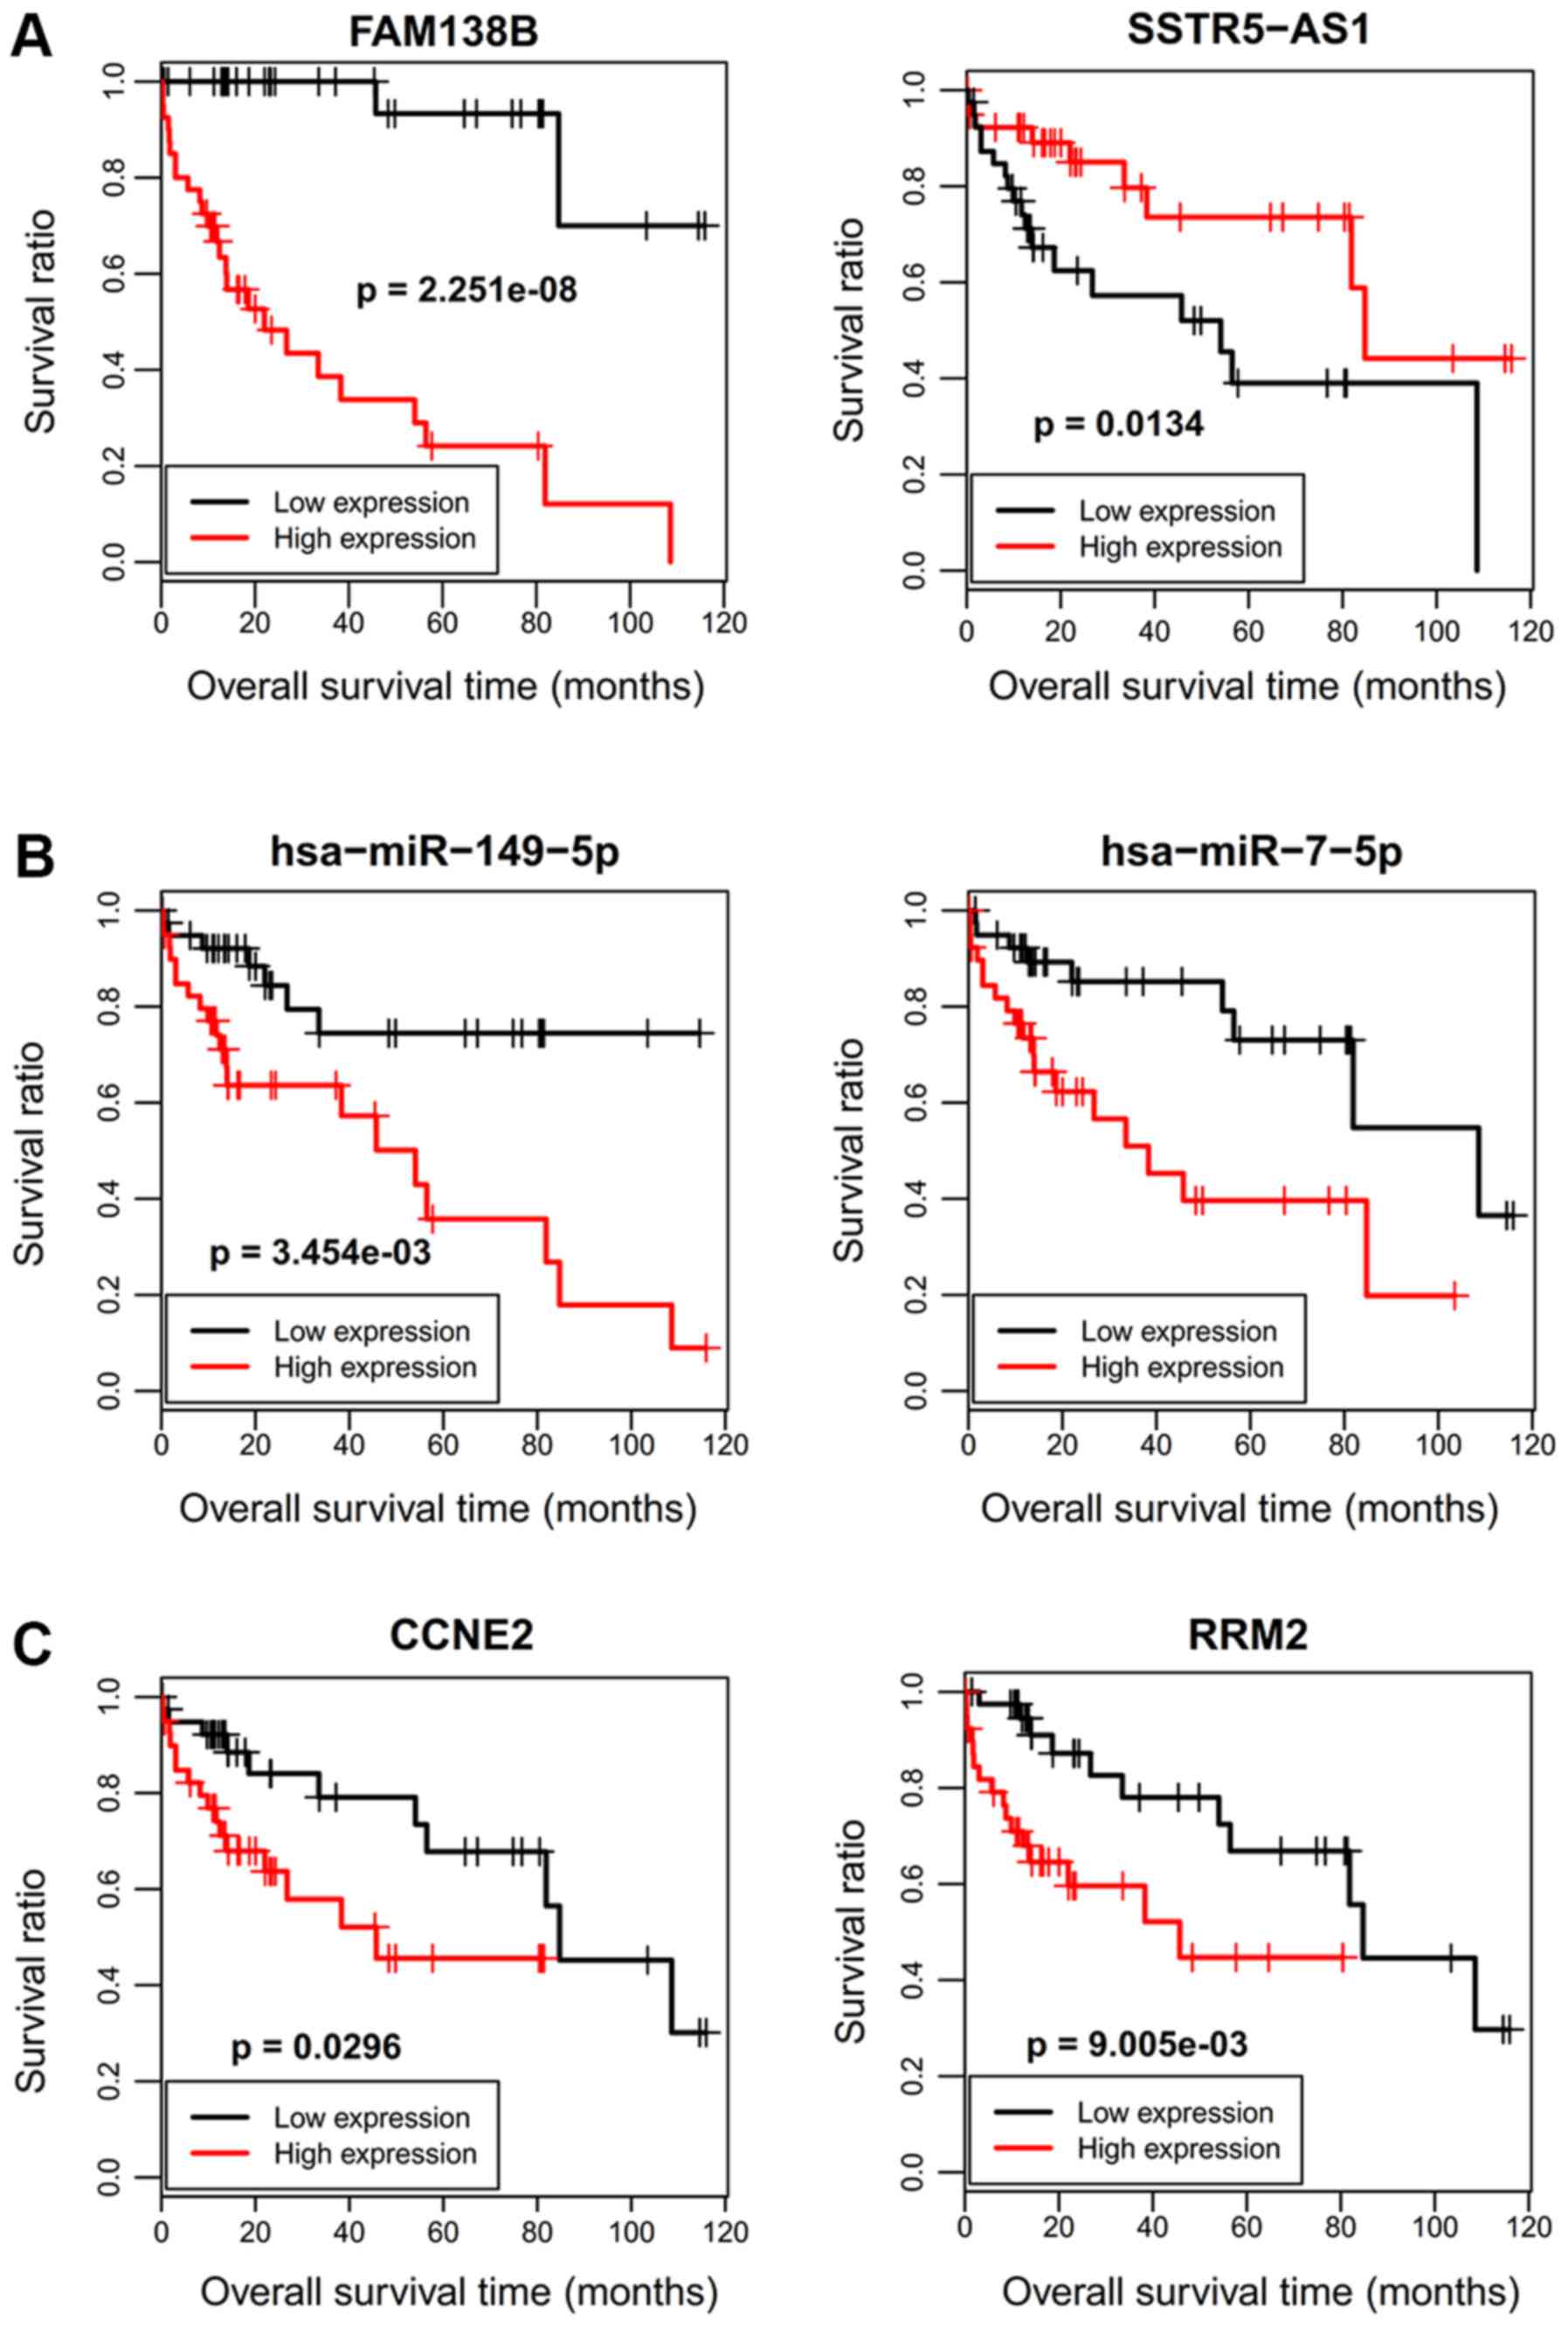
The results revealed that six RNAs (2 DELs: FAM138B and SSTR5-AS1;
2 DEMs: hsa-miR-149 and hsa-miR-7; 2 DEGs: CCNE2 and RRM2) were
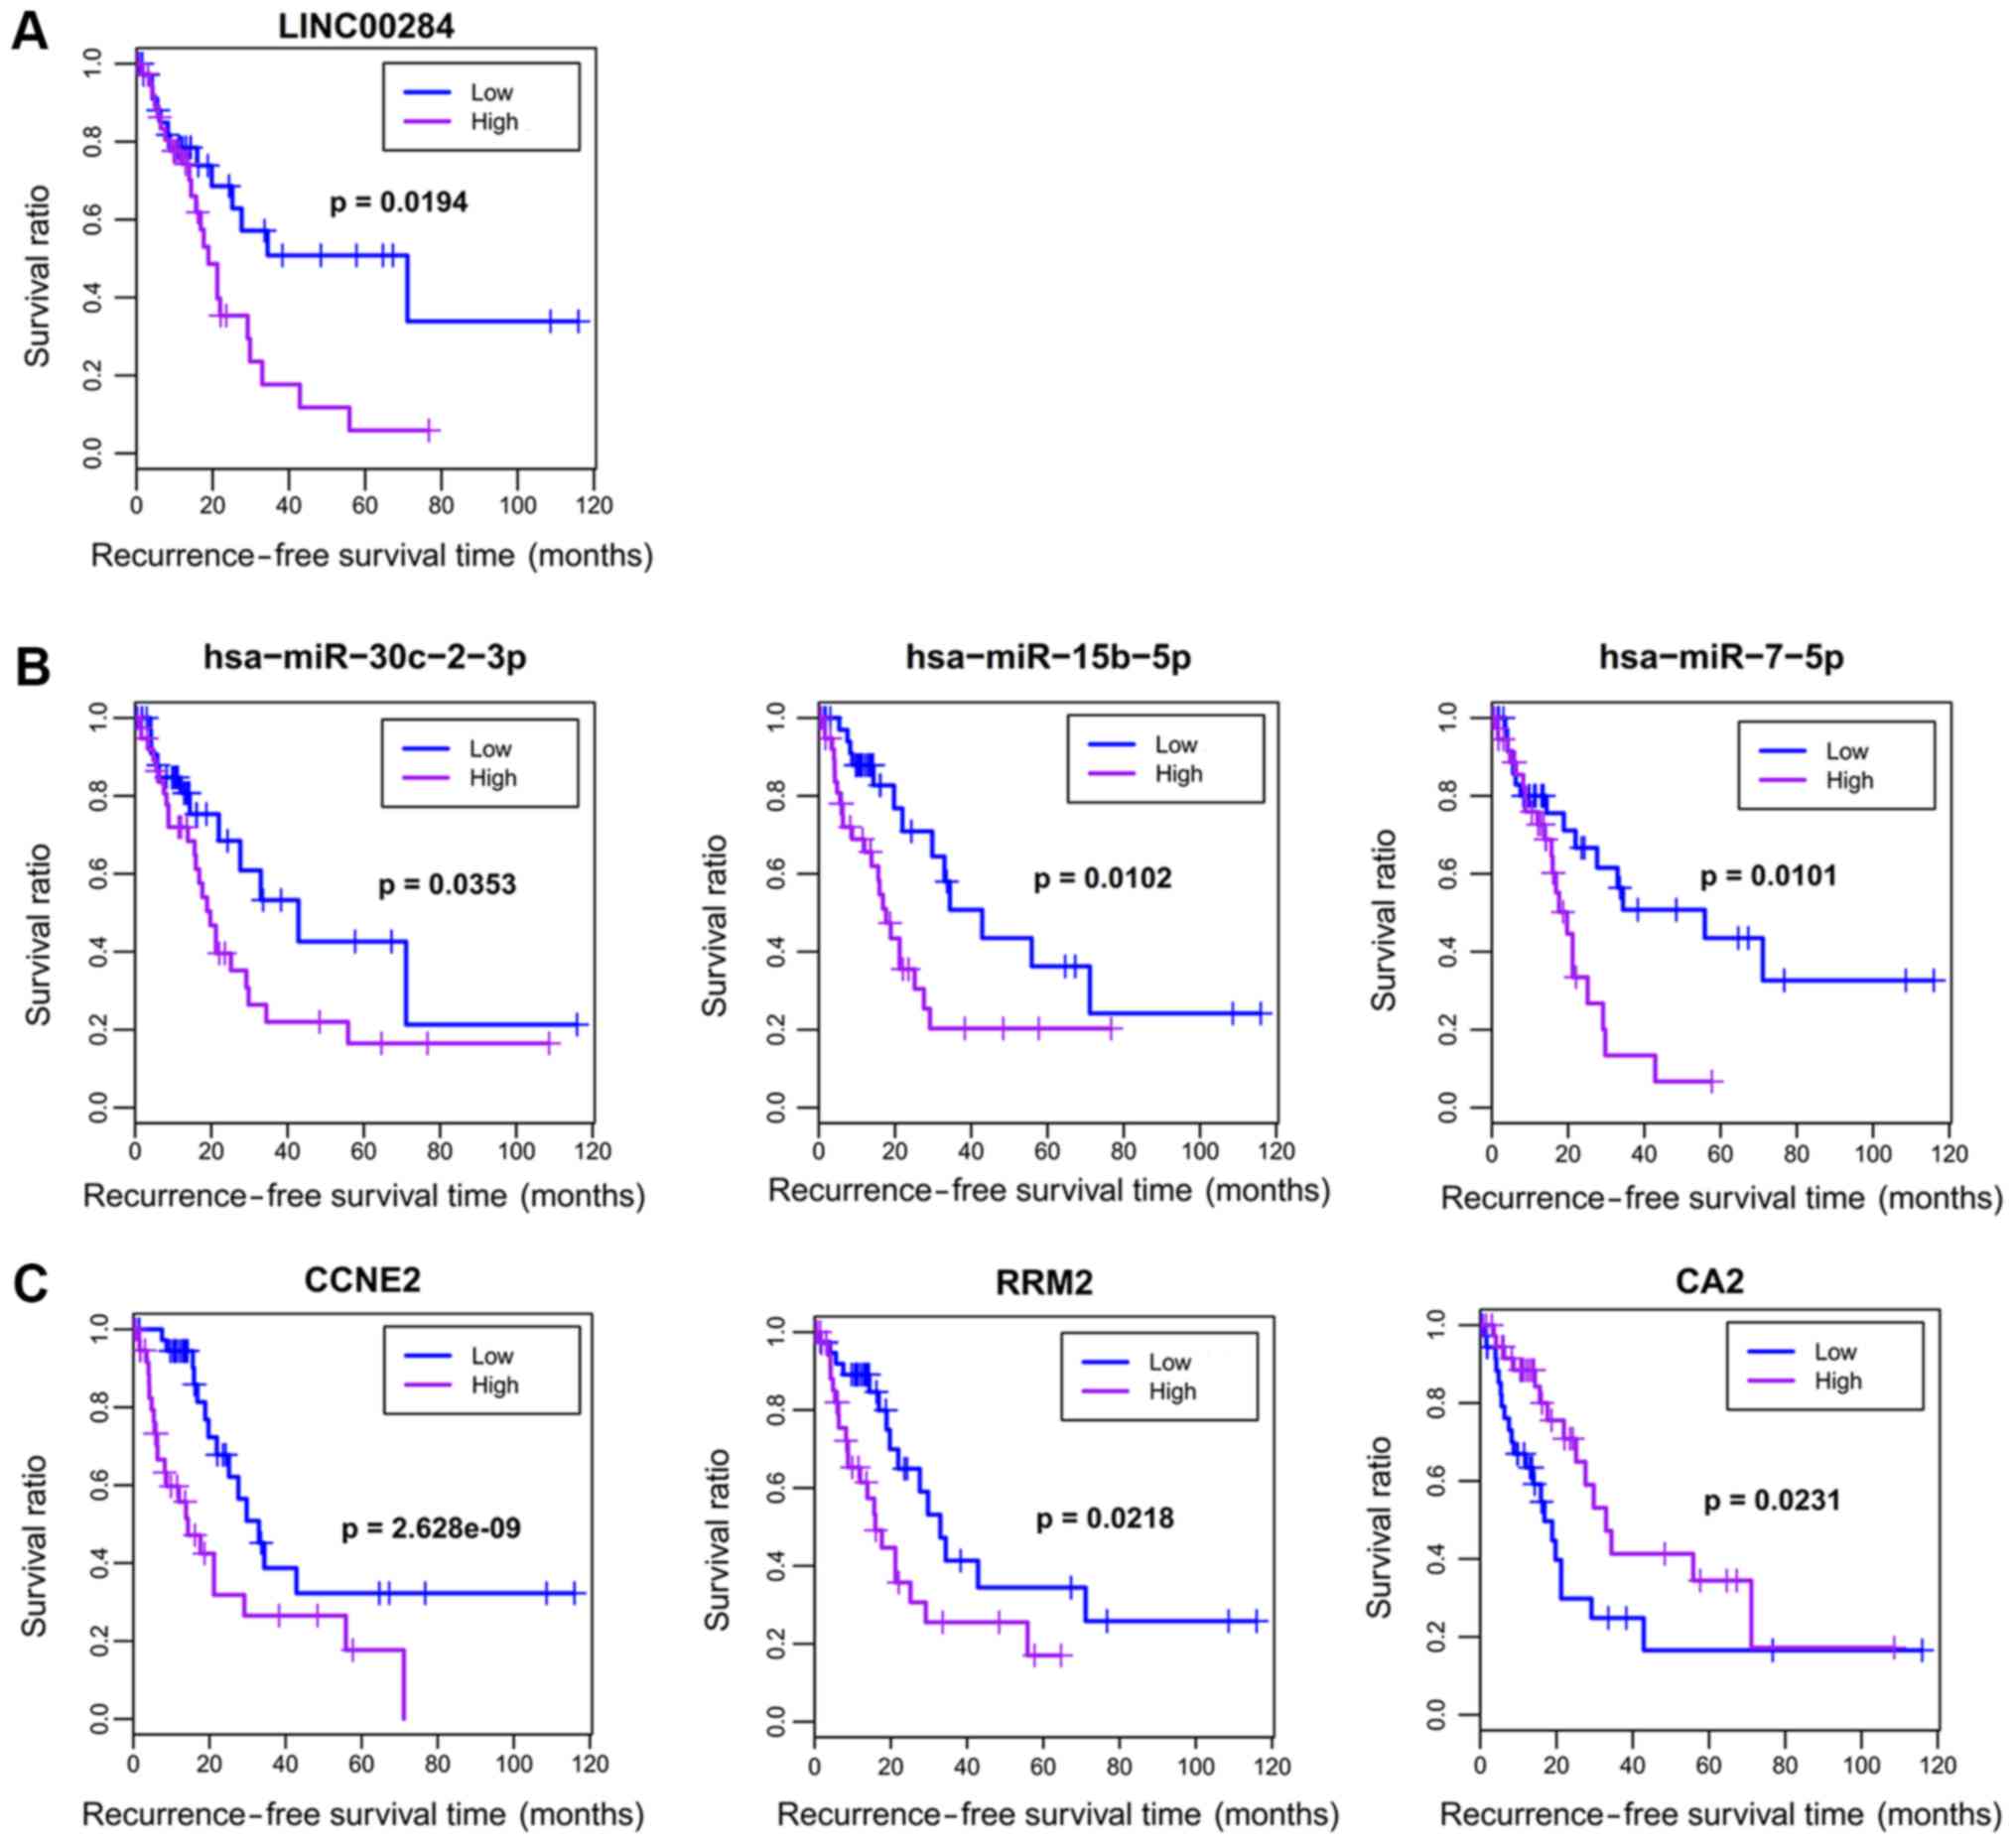
significantly associated with OS, and seven RNAs (1 DEL: LINC00284;
3 DEMs: hsa-miR-7, hsa-miR-15b, hsa-miR-30c-2; and 3 DEGs: RRM2,
CCNE2, CA2) were significantly associated with RFS (Table III). Survival curves were drawn
for these significant prognosis-related DELs, DEMs and DEGs by
Kaplan-Meier according to their expression levels in the sequencing
data. As anticipated, patients with a high expression of FAM138B,
hsa-miR-149-5p, hsa-miR-7-5p, hsa-miR-15b-5p, CCNE2 and RRM2 had
poor survival, while patients with low expression of SSTR5-AS1 and
CA2 possessed poor survival (Figs.
5 and 6). However, patients
with low expression of LINC00284 and hsa-miR-30c-2 had excellent
survival, which was not consistent with what we anticipated
(Fig. 6). Accordingly, our results
indicated the SSTR5-AS1-hsa-miR-15b-5p-CA2 ceRNA axis may be
especially important for the development and prognosis of
HBV-related HCC by influencing nitrogen metabolism.
| Table III.Univariate Cox regression analysis to
screen OS and RFS-related genes. |
Table III.
Univariate Cox regression analysis to
screen OS and RFS-related genes.
| OS | RFS |
|---|
|
|
|---|
| ID | Cox-p | ID | Cox-p |
|---|
| FAM138B | 0.0012 | LINC00284 | 0.011 |
| SSTR5-AS1 | 0.011 | hsa-miR-7-1 | 0.0019 |
| hsa-miR-149 | 5.00E-04 | hsa-miR-15b | 0.021 |
| hsa-miR-7-2 | 0.037 | hsa-miR-30c-1 | 0.0335 |
| CCNE2 | 0.017 | RRM2 | 0.025 |
| RRM2 | 0.042 | CA2 | 0.028 |
|
|
| CCNE2 | 0.046 |
Discussion
In the present study, the expression of lncRNAs,
miRNAs and mRNAs in HBV-related HCC was comprehensively analyzed
and two lncRNA-associated ceRNA axes were identified:
FAM138B-hsa-miR-30c-CCNE2/RRM2 and SSTR5-AS1-has-miR-15b-5p-CA2.
They were involved in HBV-related HCC by influencing the p53
signaling pathway, the cell cycle and nitrogen metabolism. In
addition, all the genes in these two axes were significantly
associated with the OS or RFS of patients. These findings indicated
that these genes may be important prognostic biomarkers and
therapeutic targets for HBV-related HCC.
Although there are studies that have demonstrated
the roles of lncRNAs in cancer development (including HCC)
(16,26), there are almost no studies focusing
on FAM138B except for one which confirmed its prognostic value in
lung adenocarcinoma (27).
However, in contrast to a study by Li et al (27), FAM138B was upregulated in HCC, not
downregulated. This indicates that it is necessary to verify the
specific roles of FAM138B in HCC. In present study, FAM138B was
predicted to possibly be involved in HBV-HCC by regulating cell
cycle-related genes (CCNE2 and RRM2) by sponging hsa-miR-30c,
resulting in poor prognosis. Cyclin E2 (CCNE2) is the second member
of the E-type cyclin family that forms a complex with
cyclin-dependent kinase 2 to promote G1/S cell cycle phase
transition (28). Thus,
upregulation of CCNE2 may facilitate cell cycle progression and
then excessive cell proliferation, ultimately leading to the
development of cancer. These hypotheses have been demonstrated by
previous studies. For example, Payton et al observed that
the level of CCNE2 was significantly increased in primary breast
tumor samples relative to normal breast tissue controls (29). Kumari et al demonstrated
that CCNE2 was frequently overexpressed in the early stages of
gastric carcinoma and its expression was significantly correlated
with histological type, tumor location, tumor differentiation,
tumor invasion and tumor metastasis (30). Xie et al demonstrated that
high CCNE2 expression was associated with worse OS (hazard ratio:
1.36, 95% confidence intervals: 1.15–1.6, P<0.01) (31). The CCNE2-CDK2 complex was also
reported to mediate SAMHD1 phosphorylation and abrogate the
inhibitory roles of SAMHD1 on HBV replication in hepatoma cells
(32). In line with these studies,
our study also revealed that CCNE2 was upregulated in tumor samples
of patients with HBV-related HCC and the high expression of CCNE2
predicted poor OS and RFS. Ribonucleotide reductase M2 subunit
(RRM2) is a subunit of the ribonucleotide reductase that is
responsible for the reduction of ribonucleotide 5′-diphosphates
into 2′-deoxyribonucleotides for DNA synthesis and replication. In
addition, RRM2 also plays an active role in tumor progression,
which has been confirmed in several cancers. For example, Morikawa
et al revealed that RRM2 was overexpressed in 72 cases
(64.3%), but rarely expressed in normal gastric mucosa. RRM2
overexpression was significantly associated with presence of
muscularis propria invasion and presence of Epstein-Barr virus
(33). Overexpression of RRM2
promoted their invasiveness (34),
while suppression of RRM2 inhibited the growth of gastric cancer
cells (33). A study by Wang et
al revealed that human papillomavirus E7 induced the
upregulation of RRM2 and promoted the development of cervical
cancer (35). In accordance with
these studies, in the present study RRM2 was predicted to be
induced by HBV to promote the development of HCC and the high
expression of RRM2 may serve as a poor prognostic factor.
Previously, overexpression of miR-30c was reported to significantly
inhibit cell proliferation and delay G1/S phase transition in
hepatoma cells by blocking the HBV replication and the expression
of HBV pgRNA, capsid-associated virus DNA and Hbx, indicating its
tumor suppressive roles (36). As
anticipated, miR-30c was also revealed to be downregulated in
HBV-HCC samples. However, its association with RFS was not in line
with what was anticipated, which may be attributed to the small
sample size. One study indicated that transfection with mimics of
the miR-30 family member, miR-30b, significantly downregulated
CCNE2 expression, while the miR-30b inhibitor upregulated CCNE2 in
breast cancer cell lines (37).
RRM2 was also predicted to be a direct target of miR-30d in lung
adenocarcinoma (38). However,
there was no direct evidence to demonstrate the interaction between
FAM138B and miR-30c as well as between miR-30c and CCNE2 and RRM2
in HCC.
A recent study by Ramnarine et al (39) revealed that SSTR5-AS1 was expressed
at a low level in treatment-induced neuroendocrine prostate cancer,
an aggressive variant of late-stage metastatic castrate-resistant
prostate cancer compared with prostate adenocarcinoma; SSTR5-AS1
was able to identify patients more likely to develop metastatic
disease from those that did not; its underlying mechanism was to
interact with KDM4B, a histone demethylase that could regulate and
epigenetically activate the N-Myc oncogene and lead to cancer
development (40). However, the
function of SSTR5-AS1 in cancer remains not fully elucidated. In
the present study, it was predicted that downregulated SSTR5-AS1
may be involved in HBV-HCC by regulating CA2 via sponging of
miR-15b-5p, resulting in poor prognosis. CA2 encodes one of
isozymes of carbonic anhydrase which catalyzes reversible hydration
of carbon dioxide and plays a pivotal role in tissue pH
homeostasis. Several studies have revealed that carbonic anhydrase
members (i.e., CA1, CA9 and CA12) may be upregulated to promote
cancer cell growth, survival and invasiveness (41–43).
The use of carbonic anhydrase inhibitors significantly inhibits the
malignant characteristics of cancers and improves chemotherapy
sensitivity (44,45). However, the expression of CA2
appears to be controversial in different cancers, such as
upregulated in urinary bladder cancers (46), but downregulated in esophageal
adenocarcinoma (47). A recent
study performed by Zhang et al also implied that
downregulation of CA2 promoted HCC metastasis and invasion
(48). Consistent with the study
by Zhang et al (48) and
Nortunen et al (47), the
present results also revealed that CA2 was significantly expressed
at a lower level in HBV-HCC samples compared with the normal
control, suggesting that CA2 may be a tumor suppressor gene for
HCC. Extensive studies have revealed that miR-15b-5p was
upregulated in cancer samples to promote tumorigenicity and
progression (49,50), including HCC (51). Consistently, it was also revealed
in the present study that miR-15b-5p was highly expressed in
HBV-HCC tissues. However, there was no direct evidence to
demonstrate the interaction between SSTR5-AS1 and miR-15b-5p as
well as between miR-15b-5p and CA2 in HCC.
Some limitations are present in the present study.
First, the sample size of our study was not large, which may be a
reason leading to the expression difference in some targets
(LINC00284 and hsa-miR-30c-2) with what was anticipated. Thus, more
clinical samples should be further collected to confirm their
expression (quantitative-polymerase chain reaction analysis) and
clinical values. Second, this study was only performed to
preliminarily identify the potential ceRNA mechanisms for
HBV-related HCC. Subsequent cells (RNA pull-down) and animal
(knockout or overexpression) experiments should be performed to
validate the interaction relationships between DEMs and DELs/DEGs
in HBV-related HCC.
In conclusion, the present study preliminarily
indicated that FAM138B and SSTR5-AS1 may be novel prognostic
biomarkers and therapeutic targets for HBV- associated HCC. They
function as ceRNAs to sponge hsa-miR-30c and miR-15b-5p to regulate
CCNE2/RRM2 and CA2.
Acknowledgements
Not applicable.
Funding
No funding was received.
Availability of data and materials
All the microarray data were downloaded from the GEO
database in NCBI (http://www.ncbi.nlm.nih.gov/geo/). The mRNA and miRNA
Seq-data were obtained from The Cancer Genome Atlas (TCGA;
http://tcga-data.nci.nih.gov/).
Authors' contributions
JX was involved in the conception and design of the
study, drafted and revised the manuscript. JX, JW and YW collected
and analyzed the data. JZ and FS contributed to the interpretation
of the data and revised the manuscript critically for important
intellectual content. All authors read and approved the manuscript
and agree to be accountable for all aspects of the research in
ensuring that the accuracy or integrity of any part of the work are
appropriately investigated and resolved.
Ethics approval and informed consent
Not applicable.
Patient consent for publication
Not applicable.
Competing interests
The authors declare that they have no competing
interests.
References
|
1
|
Chen JD, Yang HI, Iloeje UH, You SL, Lu
SN, Wang LY, Su J, Sun CA, Liaw YF and Chen CJ; Risk Evaluation of
Viral Load Elevation and Associated Liver Disease/Cancer in HBV
(REVEAL-HBV) Study Group, : Carriers of inactive hepatitis B virus
are still at risk for hepatocellular carcinoma and liver-related
death. Gastroenterology. 138:1747–1754. 2010. View Article : Google Scholar : PubMed/NCBI
|
|
2
|
Petruzziello A: Epidemiology of Hepatitis
B Virus (HBV) and Hepatitis C Virus (HCV) related hepatocellular
carcinoma. Open Virol J. 12:26–32. 2018. View Article : Google Scholar : PubMed/NCBI
|
|
3
|
Jing L, Liang H, Yan J, Qiu M and Yan Y:
Liver resection for hepatocellular carcinoma: Personal experiences
in a series of 1330 consecutive cases in China. ANZ J Surg.
88:E713–E717. 2018. View Article : Google Scholar : PubMed/NCBI
|
|
4
|
Costa FF: Non-coding RNAs: Meet thy
masters. Bioessays. 32:599–608. 2010. View Article : Google Scholar : PubMed/NCBI
|
|
5
|
Sagnelli E, Potenza N, Onorato L, Sagnelli
C, Coppola N and Russo A: Micro-RNAs in hepatitis B virus-related
chronic liver diseases and hepatocellular carcinoma. World J
Hepatol. 27:558–570. 2018. View Article : Google Scholar
|
|
6
|
Rana MA, Ijaz B, Daud M, Tariq S, Nadeem T
and Husnain T: Interplay of Wnt β-catenin pathway and miRNAs in HBV
pathogenesis leading to HCC. Clin Res Hepatol Gastroenterol.
43:373–386. 2019. View Article : Google Scholar : PubMed/NCBI
|
|
7
|
Gong X, Wei W, Chen L, Xia Z and Yu C:
Comprehensive analysis of long non-coding RNA expression profiles
in hepatitis B virus-related hepatocellular carcinoma. Oncotarget.
7:42422–42430. 2016. View Article : Google Scholar : PubMed/NCBI
|
|
8
|
Yu TT, Xu XM, Hu Y, Deng JJ, Ge W, Han NN
and Zhang MX: Long noncoding RNAs in hepatitis B
virus-relatedhepatocellular carcinoma. World J Gastroenterol.
21:7208–7217. 2015. View Article : Google Scholar : PubMed/NCBI
|
|
9
|
Du J, Bai F, Zhao P, Li X, Li X, Gao L, Ma
C and Liang X: Hepatitis B core protein promotes liver cancer
metastasis through miR-382-5p/DLC-1 axis. Biochim Biophys Acta Mol
Cell Res. 1865:1–11. 2018. View Article : Google Scholar : PubMed/NCBI
|
|
10
|
Li G, Zhang W, Gong L and Huang X:
MicroRNA-125a-5p Inhibits Cell Proliferation and Induces Apoptosis
in Hepatitis B Virus-Related Hepatocellular Carcinoma by
Downregulation of ErbB3. Oncol Res. 27:449–458. 2019. View Article : Google Scholar : PubMed/NCBI
|
|
11
|
Liu N, Liu Q, Yang X, Zhang F, Li X, Ma Y,
Guan F, Zhao X, Li Z, Zhang L and Ye X: Hepatitis B
virus-upregulated lnc-HUR1 promotes cell proliferation and
tumorigenesis by blocking p53 activity. Hepatology. 68:2130–2144.
2018. View Article : Google Scholar : PubMed/NCBI
|
|
12
|
Jin Y, Wu D, Yang W, Weng M, Li Y, Wang X,
Zhang X, Jin X and Wang T: Hepatitis B virus × protein induces
epithelial-mesenchymal transition of hepatocellular carcinoma cells
by regulating long non-coding RNA. Virol J. 14:2382017. View Article : Google Scholar : PubMed/NCBI
|
|
13
|
Li Y, Liu G, Li X, Dong H, Xiao W and Lu
S: Long non-coding RNA SBF2-AS1 promotes hepatocellular carcinoma
progression through regulation of miR-140-5p-TGFBR1 pathway.
Biochem Biophys Res Commun. 503:2826–2832. 2018. View Article : Google Scholar : PubMed/NCBI
|
|
14
|
Sui J, Yang X, Qi W, Guo K, Gao Z, Wang L
and Sun D: Long non-coding RNA linc-USP16 functions as a tumour
suppressor in hepatocellular carcinoma by regulating PTEN
expression. Cell Physiol Biochem. 44:1188–1198. 2017. View Article : Google Scholar : PubMed/NCBI
|
|
15
|
Lv J, Fan HX, Zhao XP, Lv P, Fan JY, Zhang
Y, Liu M and Tang H: Long non-coding RNA unigene56159 promotes
epithelial-mesenchymal transition by acting as a ceRNA of
miR-140-5p in hepatocellular carcinoma cells. Cancer Lett.
382:166–175. 2016. View Article : Google Scholar : PubMed/NCBI
|
|
16
|
Fan H, Lv P, Mu T, Zhao X, Liu Y, Feng Y,
Lv J, Liu M and Tang H: LncRNA n335586/miR-924/CKMT1A axis
contributes to cell migration and invasion in hepatocellular
carcinoma cells. Cancer Lett. 429:89–99. 2018. View Article : Google Scholar : PubMed/NCBI
|
|
17
|
Yang F, Zhang L, Huo XS, Yuan JH, Xu D,
Yuan SX, Zhu N, Zhou WP, Yang GS, Wang YZ, et al: Long noncoding
RNA high expression in hepatocellular carcinoma facilitates tumor
growth through enhancer of zeste homolog 2 in humans. Hepatology.
54:1679–1689. 2011. View Article : Google Scholar : PubMed/NCBI
|
|
18
|
Yang Y, Chen L, Gu J, Zhang H, Yuan J,
Lian Q, Lv G, Wang S, Wu Y, Yang YT, et al: Recurrently deregulated
lncRNAs in hepatocellular carcinoma. Nat Commun. 8:144212017.
View Article : Google Scholar : PubMed/NCBI
|
|
19
|
Diboun I, Wernisch L, Orengo CA and
Koltzenburg M: Microarray analysis after RNA amplification can
detect pronounced differences in gene expression using limma. BMC
Genomics. 7:2522006. View Article : Google Scholar : PubMed/NCBI
|
|
20
|
Carvalho B, Bengtsson H, Speed TP and
Irizarry RA: Exploration, normalization, and genotype calls of
high-density oligonucleotide SNP array data. Biostatistics.
8:485–499. 2007. View Article : Google Scholar : PubMed/NCBI
|
|
21
|
Nikolayeva O and Robinson MD: edgeR for
differential RNA-seq and ChIP-seq analysis: An application to stem
cell biology. Methods Mol Biol. 1150:45–79. 2014. View Article : Google Scholar : PubMed/NCBI
|
|
22
|
Paraskevopoulou MD, Georgakilas G,
Kostoulas N, Reczko M, Maragkakis M, Dalamagas TM and Hatzigeorgiou
AG: DIANA-LncBase: Experimentally verified and computationally
predicted microRNA targets on long non-coding RNAs. Nucleic Acids
Res. 41:D239–D245. 2013. View Article : Google Scholar : PubMed/NCBI
|
|
23
|
Kohl M, Wiese S and Warscheid B:
Cytoscape: Software for visualization and analysis of biological
networks. Methods Mol Biol. 696:291–303. 2011. View Article : Google Scholar : PubMed/NCBI
|
|
24
|
Huang da W, Sherman BT and Lempicki RA:
Systematic and integrative analysis of large gene lists using DAVID
bioinformatics resources. Nat Protoc. 4:44–57. 2009. View Article : Google Scholar : PubMed/NCBI
|
|
25
|
Davis AP, Grondin CJ, Johnson RJ, Sciaky
D, King BL, McMorran R, Wiegers J, Wiegers TC and Mattingly CJ: The
comparative toxicogenomics database: Update 2017. Nucleic Acids
Res. 45:D972–D978. 2017. View Article : Google Scholar : PubMed/NCBI
|
|
26
|
Lan T, Ma W, Hong Z, Wu L, Chen X and Yuan
Y: Long non-coding RNA small nucleolar RNA host gene 12 (SNHG12)
promotes tumorigenesis and metastasis by targeting miR-199a/b-5p in
hepatocellular carcinoma. J Exp Clin Cancer Res. 36:112017.
View Article : Google Scholar : PubMed/NCBI
|
|
27
|
Li X, Li B, Ran P and Wang L:
Identification of ceRNA network based on a RNA-seq shows prognostic
lncRNA biomarkers in human lung adenocarcinoma. Oncol Lett.
16:5697–5708. 2018.PubMed/NCBI
|
|
28
|
Lauper N, Beck AR, Cariou S, Richman L,
Hofmann K, Reith W, Slingerland JM and Amati B: Cyclin E2: A novel
CDK2 partner in the late G1 and S phases of the mammalian cell
cycle. Oncogene. 17:2637–2643. 1998. View Article : Google Scholar : PubMed/NCBI
|
|
29
|
Payton M, Scully S, Chung G and Coats S:
Deregulation of cyclin E2 expression and associated kinase activity
in primary breast tumors. Oncogene. 21:8529–8534. 2002. View Article : Google Scholar : PubMed/NCBI
|
|
30
|
Kumari S, Puneet, Prasad SB, Yadav SS,
Kumar M, Khanna A, Dixit VK, Nath G, Singh S and Narayan G: Cyclin
D1 and cyclin E2 are differentially expressed in gastric cancer.
Med Oncol. 33:402016. View Article : Google Scholar : PubMed/NCBI
|
|
31
|
Xie L, Li T and Yang LH: E2F2 induces
MCM4, CCNE2 and WHSC1 upregulation in ovarian cancer and predicts
poor overall survival. Eur Rev Med Pharmacol Sci. 21:2150–2156.
2017.PubMed/NCBI
|
|
32
|
Hu J, Qiao M, Chen Y, Tang H, Zhang W,
Tang D, Pi S, Dai J, Tang N, Huang A and Hu Y: Cyclin E2-CDK2
mediate SAMHD1 phosphorylation to abrogate its restriction of HBV
replication in hepatoma cells. FEBS Lett. 592:1893–1904. 2018.
View Article : Google Scholar : PubMed/NCBI
|
|
33
|
Morikawa T, Hino R, Uozaki H, Maeda D,
Ushiku T, Shinozaki A, Sakatani T and Fukayama M: Expression of
ribonucleotide reductase M2 subunit in gastric cancer and effects
of RRM2 inhibition in vitro. Hum Pathol. 41:1742–1748. 2010.
View Article : Google Scholar : PubMed/NCBI
|
|
34
|
Zhong Z, Cao Y, Yang S and Zhang S:
Overexpression of RRM2 in gastric cancer cell promotes their
invasiveness via AKT/NF-κB signaling pathway. Pharmazie.
71:280–284. 2016.PubMed/NCBI
|
|
35
|
Wang N, Zhan T, Ke T, Huang X, Ke D, Wang
Q and Li H: Increased expression of RRM2 by human papillomavirus E7
oncoprotein promotes angiogenesis in cervical cancer. Br J Cancer.
110:1034–1044. 2014. View Article : Google Scholar : PubMed/NCBI
|
|
36
|
Zhang J, Ma J, Wang H, Guo L and Li J:
Serum microRNA-30c levels are correlated with disease progression
in Xinjiang Uygur patients with chronic hepatitis B. Braz J Med
Biol Res. 50:e60502017. View Article : Google Scholar : PubMed/NCBI
|
|
37
|
Tormo E, Adam-Artigues A, Ballester S,
Pineda B, Zazo S, González-Alonso P, Albanell J, Rovira A, Rojo F,
Lluch A and Eroles P: The role of miR-26a and miR-30b in HER2 +
breast cancer trastuzumab resistance and regulation of the CCNE2
gene. Sci Rep. 7:413092017. View Article : Google Scholar : PubMed/NCBI
|
|
38
|
Arima C, Kajino T, Tamada Y, Imoto S,
Shimada Y, Nakatochi M, Suzuki M, Isomura H, Yatabe Y, Yamaguchi T,
et al: Lung adenocarcinoma subtypes definable by lung
development-related miRNA expression profiles in association with
clinicopathologic features. Carcinogenesis. 35:2224–2231. 2014.
View Article : Google Scholar : PubMed/NCBI
|
|
39
|
Ramnarine VR, Alshalalfa M, Mo F, Nabavi
N, Erho N, Takhar M, Shukin R, Brahmbhatt S, Gawronski A, Kobelev
M, et al: The long noncoding RNA landscape of neuroendocrine
prostate cancer and its clinical implications. Gigascience.
7:giy0502018. View Article : Google Scholar :
|
|
40
|
Yang J, AlTahan AM, Hu D, Wang Y, Cheng
PH, Morton CL, Qu C, Nathwani AC, Shohet JM, Fotsis T, et al: The
role of histone demethylase KDM4B in Myc signaling in
neuroblastoma. J Natl Cancer Inst. 107:djv0802015. View Article : Google Scholar : PubMed/NCBI
|
|
41
|
Ivanov S, Liao SY, Ivanova A,
Danilkovitch-Miagkova A, Tarasova N, Weirich G, Merrill MJ,
Proescholdt MA, Oldfield EH, Lee J, et al: Expression of
hypoxia-inducible cell-surface transmembrane carbonic anhydrases in
human cancer. Am J Pathol. 158:905–919. 2001. View Article : Google Scholar : PubMed/NCBI
|
|
42
|
Hussain SA, Ganesan R, Reynolds G, Gross
L, Stevens A, Pastorek J, Murray PG, Perunovic B, Anwar MS,
Billingham L, et al: Hypoxia-regulated carbonic anhydrase IX
expression is associated with poor survival in patients with
invasive breast cancer. Br J Cancer. 96:104–109. 2007. View Article : Google Scholar : PubMed/NCBI
|
|
43
|
Wang DB, Lu XK, Zhang X, Li ZG and Li CX:
Carbonic anhydrase 1 is a promising biomarker for early detection
of non-small cell lung cancer. Tumour Biol. 37:553–559. 2016.
View Article : Google Scholar : PubMed/NCBI
|
|
44
|
Kazokaitė J, Ames S, Becker HM, Deitmer JW
and Matulis D: Selective inhibition of human carbonic anhydrase IX
in Xenopus oocytes and MDA-MB-231 breast cancer cells. J Enzyme
Inhib Med Chem. 31:38–44. 2016. View Article : Google Scholar
|
|
45
|
Parkkila S, Rajaniemi H, Parkkila AK,
Kivela J, Waheed A, Pastorekova S, Pastorek J and Sly WS: Carbonic
anhydrase inhibitor suppresses invasion of renal cancer cells in
vitro. Proc Natl Acad Sci USA. 97:2220–2224. 2000. View Article : Google Scholar : PubMed/NCBI
|
|
46
|
Tachibana H, Gi M, Kato M, Yamano S,
Fujioka M, Kakehashi A, Hirayama Y, Koyama Y, Tamada S, Nakatani T
and Wanibuchi H: Carbonic anhydrase 2 is a novel
invasion-associated factor in urinary bladder cancers. Cancer Sci.
108:331–337. 2017. View Article : Google Scholar : PubMed/NCBI
|
|
47
|
Nortunen M, Huhta H, Helminen O, Parkkila
S, Kauppila JH, Karttunen TJ and Saarnio J: Carbonic anhydrases II,
IX, and XII in Barrett's esophagus and adenocarcinoma. Virchows
Arch. 473:567–575. 2018. View Article : Google Scholar : PubMed/NCBI
|
|
48
|
Zhang C, Wang H, Chen Z, Zhuang L, Xu L,
Ning Z, Zhu Z, Wang P and Meng Z: Carbonic anhydrase 2 inhibits
epithelial-mesenchymal transition and metastasis in hepatocellular
carcinoma. Carcinogenesis. 39:562–570. 2018. View Article : Google Scholar : PubMed/NCBI
|
|
49
|
Zhao C, Li Y, Chen G, Wang F, Shen Z and
Zhou R: Overexpression of miR-15b-5p promotes gastric cancer
metastasis by regulating PAQR3. Oncol Rep. 38:352–358. 2017.
View Article : Google Scholar : PubMed/NCBI
|
|
50
|
Chen R, Sheng L, Zhang HJ, Ji M and Qian
WQ: miR-15b-5p facilitates the tumorigenicity by targeting RECK and
predicts tumour recurrence in prostate cancer. J Cell Mol Med.
22:1855–1863. 2018. View Article : Google Scholar : PubMed/NCBI
|
|
51
|
Chen Y, Chen J, Liu Y, Li S and Huang P:
Plasma miR-15b-5p, miR-338-5p, and miR-764 as biomarkers for
hepatocellular carcinoma. Med Sci Monit. 21:1864–1871. 2015.
View Article : Google Scholar : PubMed/NCBI
|