Introduction
Ophthalmic functional disorders and blindness
significantly affect quality of life due to the importance of
vision in day-to-day activities. Diabetic retinopathy, glaucoma,
age-related macular degeneration, and retinitis pigmentosa are
diseases of the retina that can lead to blindness. The underlying
mechanisms are of global interest, though it is difficult to
prevent retinal dysfunction completely. Thus, it is important to
elucidate how retinal stimulation leads to retinal dysfunction.
Animal models of retinopathy include the
streptozotocin-induced diabetic rat (STZ rat), oxygen-induced
retinopathy, and laser-induced choroidal neovascularization models
(1–3). In particular, STZ rats serve as
models of diabetic retinopathy. In a previous study, we showed that
STZ rats have decreased retinal function using electroretinograms
(ERGs) (4,5). Moreover, STZ rats have altered
visually evoked potentials or ERG measures even in the absence of
observable retinopathy (6). Thus,
STZ rats are adaptable as a model of acute retinal dysfunction.
However, the differential retinal protein expression related to
acute retinal dysfunction after STZ administration needs to be
evaluated. A proteomic approach has been used for this purpose in
diabetic retinopathy (7), with
shotgun liquid chromatography (LC)/mass spectrometry (MS)-based
global proteomic analysis considered particularly useful (8–10).
We previously used this methodology to evaluate changes in protein
expression in the lens and cornea of STZ rats and found decreased
superoxide dismutase. This decrease contributed to the progression
of diabetic cataracts and overexpression of lumican, leading to
delayed corneal wound healing in diabetic keratopathy-affected
corneas (11,12).
In the present study, we used a shotgun LC/MS-based
global proteomic approach in retinas from STZ rats to investigate
factors relevant to and mechanisms underlying acute retinal
dysfunction. We also identified proteins up- and downregulated in
the retina and their association with retinal function.
Materials and methods
Materials
We purchased urea from GE Healthcare UK, Ltd. and
thiourea and Triton X-100 from NACALAI TESQUE, Inc.. All other
reagents and solvents were of analytical or HPLC grade.
Animals
Healthy male Wistar rats were provided by Kiwa
Laboratory Animals Co., Ltd. The 6-week-old animals were injected
with streptozotocin for 2 days (100 mg/kg/day, i.p.) (13) and housed for 2 weeks. Sodium
pentobarbital overdose (i.p.) was used to euthanize the rats, and
the retinas were excised. All experiments were performed in
compliance with regulations approved by the Ethics Committee of the
Kindai University Faculty of Pharmacy (approval code KAPS-25-001, 1
April 2013). The rats were housed in a room at 25°C under a 12-h
light-dark cycle (2–3 rats/cage). All rats had access to food and
water ad libitum.
Assay of glucose and insulin
levels
Blood (50 µl) was sampled from the tail vein of each
rat without anesthesia after the animal fasted for 12 h (10:00
a.m.). Plasma glucose level was measured using an Accutrend GCT
(Roche Diagnostics GmbH). Plasma insulin levels were assayed using
an ELISA insulin kit (Morinaga Institute of Biological Science,
Inc.) according to the manufacturer's protocol (14). The dynamic range of the ELISA
Insulin kit is 0.1 to 6.4 ng/ml.
ERG readings
ERG readings were recorded by PuREC (Mayo) at
baseline and 2 weeks after streptozotocin injection. Rats were
maintained in a completely dark room for 24 h, after which they
were anesthetized with isoflurane (concentration: 2.0 v/v%, flow
rate: 1.0 l/min). The pupils were dilated with 0.5% tropicamide and
0.5% phenylephrine (Santen). The golden-ring electrode, reference
electrode, and neutral electrode (Mayo) were set at the right eye,
tongue, and tail, respectively. A flash ERG was recorded in a dark
room and a-wave, b-wave, and oscillatory potential (OP) amplitudes
(OP1, OP2, and OP3) measured. The OPs were isolated by the
band-pass filter and amplitudes measured using all frequencies
(0.3–500 Hz).
Tryptic digestion of proteins
extracted from the retinas of normal and STZ rats
Normal and STZ rats were euthanized by
intraperitoneal injection of 150 mg/kg sodium pentobarbital.
Retinas were removed from normal and STZ rats and homogenized in
urea lysis buffer (7 M urea, 2 M thiourea, 5% CHAPS, and 1% Triton
X-100). We measured protein concentrations using a Bio-Rad Protein
Assay kit (Bio-Rad Laboratories, Inc.), followed by gel-free
trypsin treatment in accordance with the previously published
protocol (15). Briefly, 10 µg of
protein extract from each sample was reduced at 37°C for 30 min by
the addition of 45 mM dithiothreitol and 20 mM Tris
(2-carboxyethyl) phosphine in 50 mM ammonium bicarbonate buffer.
The proteins were then alkylated with 100 mM iodoacetamide in 50 mM
ammonium bicarbonate buffer at 37°C for 30 min. After alkylation,
the samples were digested at 37°C for 24 h using MS-grade trypsin
gold (Promega Corporation) at a trypsin/protein ratio of 1:100
(w:w). Finally, the digests were purified using PepClean C-18 Spin
Columns (Thermo Fisher Scientific, Inc.) following the
manufacturer's protocol.
LC-MS/MS identification of
proteins
Peptide samples (~2 µg) were injected into a peptide
L-trap column (Chemicals Evaluation and Research Institute, Tokyo,
Japan) with an HTC PAL autosampler (CTC Analytics, Zwingen,
Switzerland). They were further separated through a Paradigm MS4
(AMR Inc.) with a reverse-phase C18-column (L-column, 3-µm-diameter
gel particles, 120 Å pore size, 0.2×150 mm; Chemicals Evaluation
and Research Institute, Tokyo, Japan). The column flow rate was 1
µl/min. The mobile phase consisted of 0.1% formic acid in water
(solution A) and acetonitrile (solution B), with a concentration
gradient of 5% solution B to 40% solution B over 120 min.
Gradient-eluted peptides were introduced into the mass spectrometer
through the nanoelectrospray ionization (NSI) interface, which had
a separation column outlet directly connected to the NSI needle. We
analyzed the peptides using an LTQ ion-trap mass spectrometer
(Thermo Fisher Scientific, Inc.) with no sheath or auxiliary gas.
The MS scan sequence was full-scan MS in normal/centroid mode and
sequential MS/MS in normal/centroid mode. The positive ion mass
spectra were acquired in a data-dependent manner, with MS/MS
fragmentation performed on the two most intense peaks of every full
MS scan using an isolation width of m/z 1.0 and a collisional
activation amplitude of 35% in the m/z range of 300 to 2,000. All
MS/MS spectral data were searched against the SwissProt Rattus
database using Mascot version 2.4.01 (Matrix Science). The search
criteria were trypsin, with the following allowances: ≤2 missed
cleavage peptides; mass tolerance, ±2.0 Da; MS/MS tolerance, ±0.8
Da; cysteine carbamidomethylation for fixed modification; and
methionine oxidation modifications for variable modification.
Semiquantitative analysis of
identified proteins
The fold change in expression was calculated as the
log2 of the ratio of protein abundances (Rsc) evaluated by spectral
counting (16). The Rsc was
calculated using Equation 1:
Rsc=log2[(ns + f)/(nn + f)] +
log2[(tn - nn + f)/(ts -
ns + f)]
Here, nn and ns are spectral
counts for the proteins in the retinas of normal and STZ rats,
respectively, tn and ts are the total numbers
of spectra for all proteins in the two samples, and ƒ is a
correction factor set to 1.25.
For comparison, we calculated the relative amount of
proteins identified using the normalized spectral abundance factor
(NSAF) (17). The NSAF was
calculated using Equation 2:
NSAF=(SpCn/Ln)/SUM(SpCn/Ln)
Here, SpCn is the spectral count for the
protein in the retinas of normal or STZ rats, and Ln is the length
of the protein in the retinas of normal or STZ animals.
Differentially expressed proteins were selected when the Rsc was
>1 or <-1, which correspond to fold changes of >2 or
<0.5, respectively.
Bioinformatics
We also investigated the functions of proteins with
significantly altered expression in diabetes mellitus. Their
sequences were assigned to Gene Ontology (GO) molecular function,
GO cellular component, GO biological process, and Kyoto
Encyclopedia of Genes and Genomes signaling pathway terms to
examine their functional annotations in the Database for
Annotation, Visualization, and Integrated Discovery (DAVID) version
6.8 (http://david.abcc.ncifcrf.gov/home.jsp) (18–20).
Statistical analysis
Statistical analysis was performed using JMP 5.1
software (SAS Institute, Inc.). All data are presented as means ±
standard error of (SE). We applied the Student's t-test and set the
significance level at P<0.05.
Results
Measurement of body weight, glucose,
and insulin levels in STZ rats
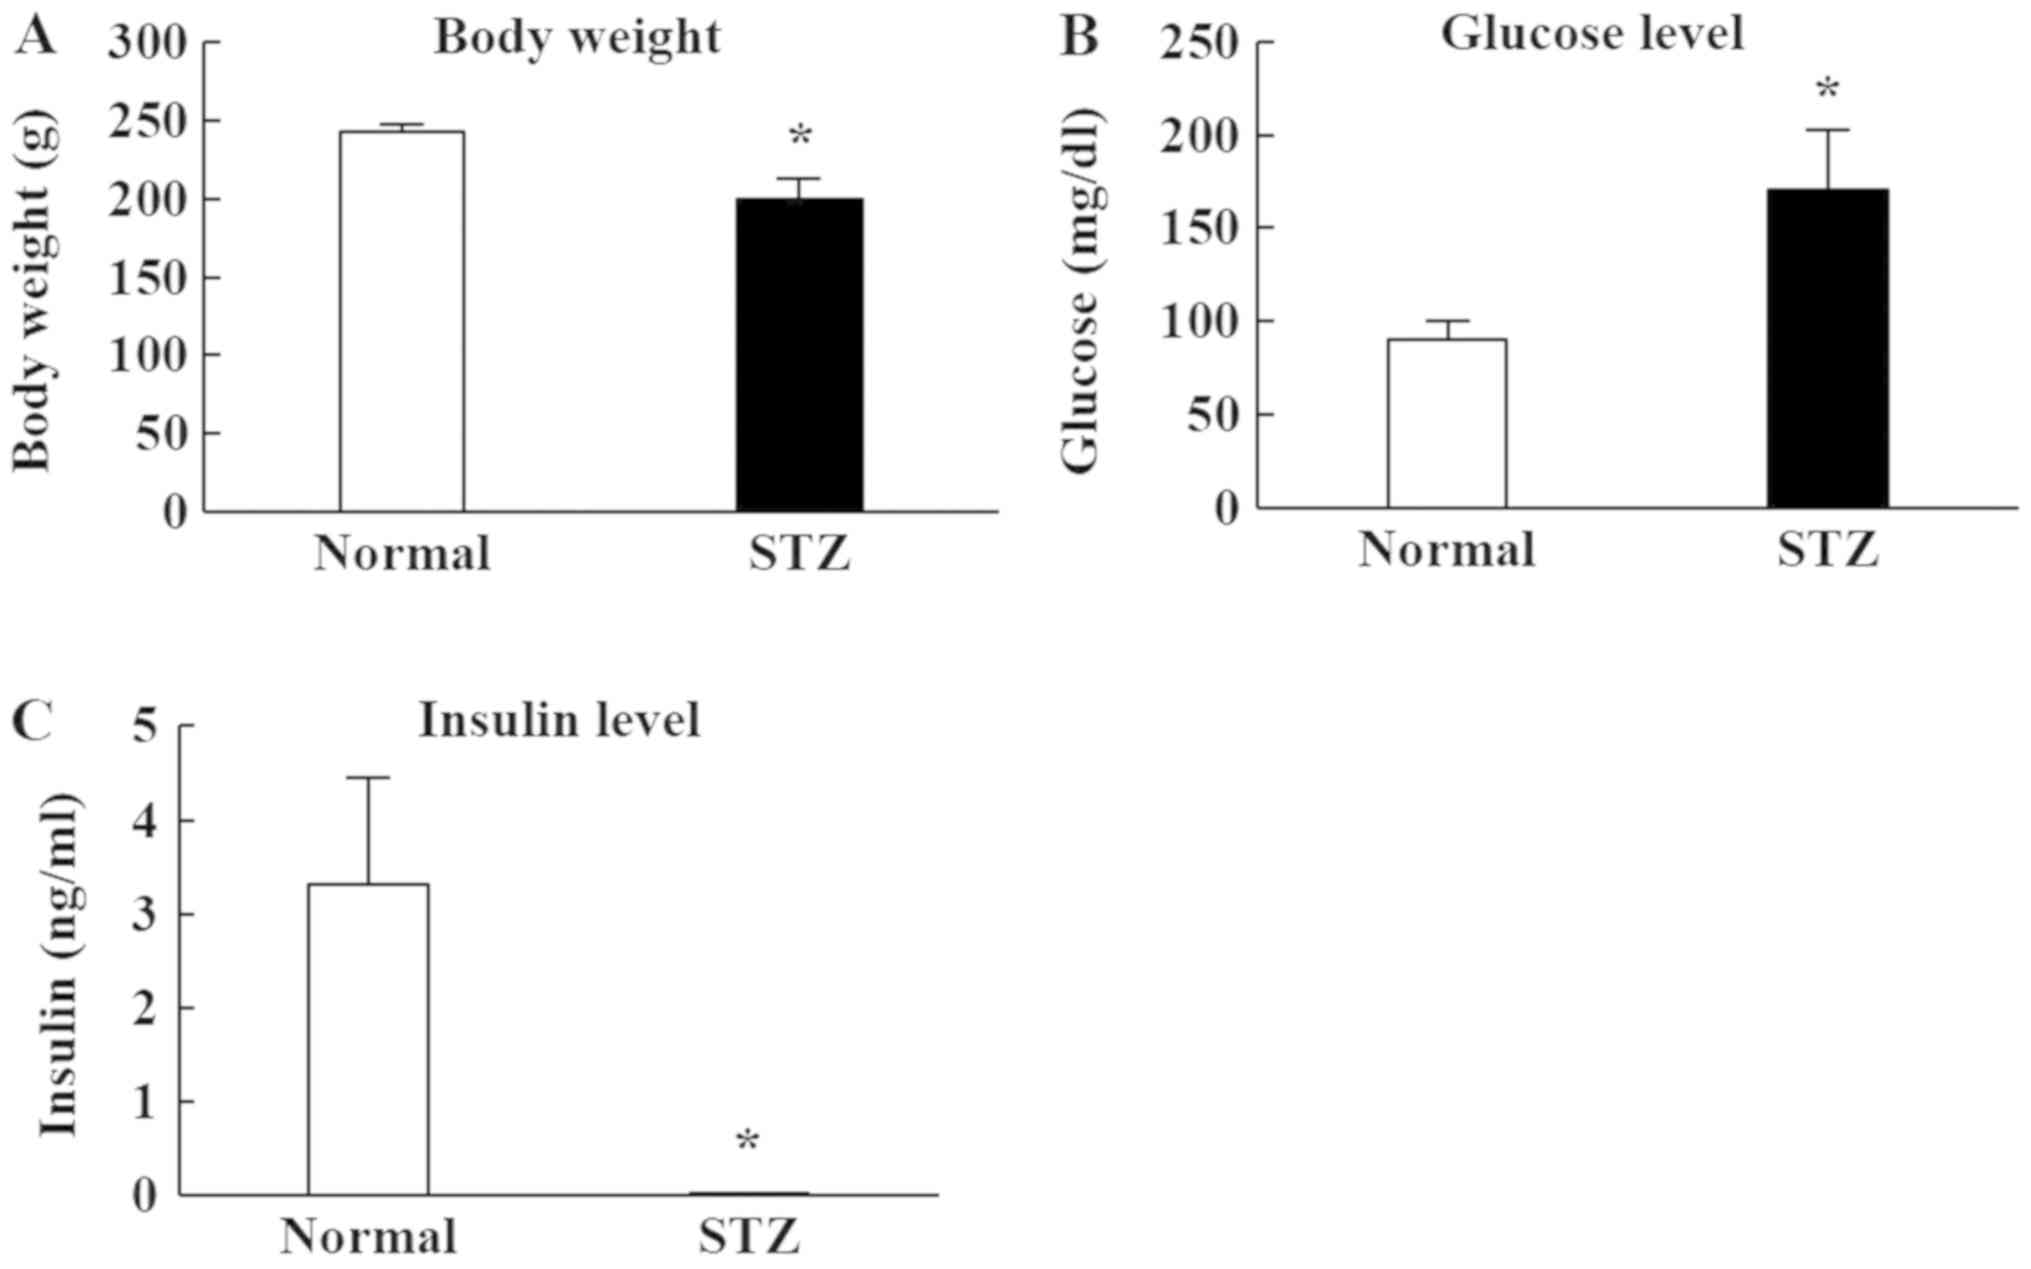
Fig. 1 shows the
changes in body weight, plasma glucose, and insulin levels in STZ
rats, which were all significantly lower than in normal rats
(Fig. 1A and C). The body weight
of STZ rats was 80% that of normal rats. The plasma insulin level
was below the detection sensitivity limit of the high sensitivity
ELISA Insulin Kit. Furthermore, plasma glucose in STZ rats was
markedly increased compared to normal rats (Fig. 1B).
Changes in retinal function in STZ
rats
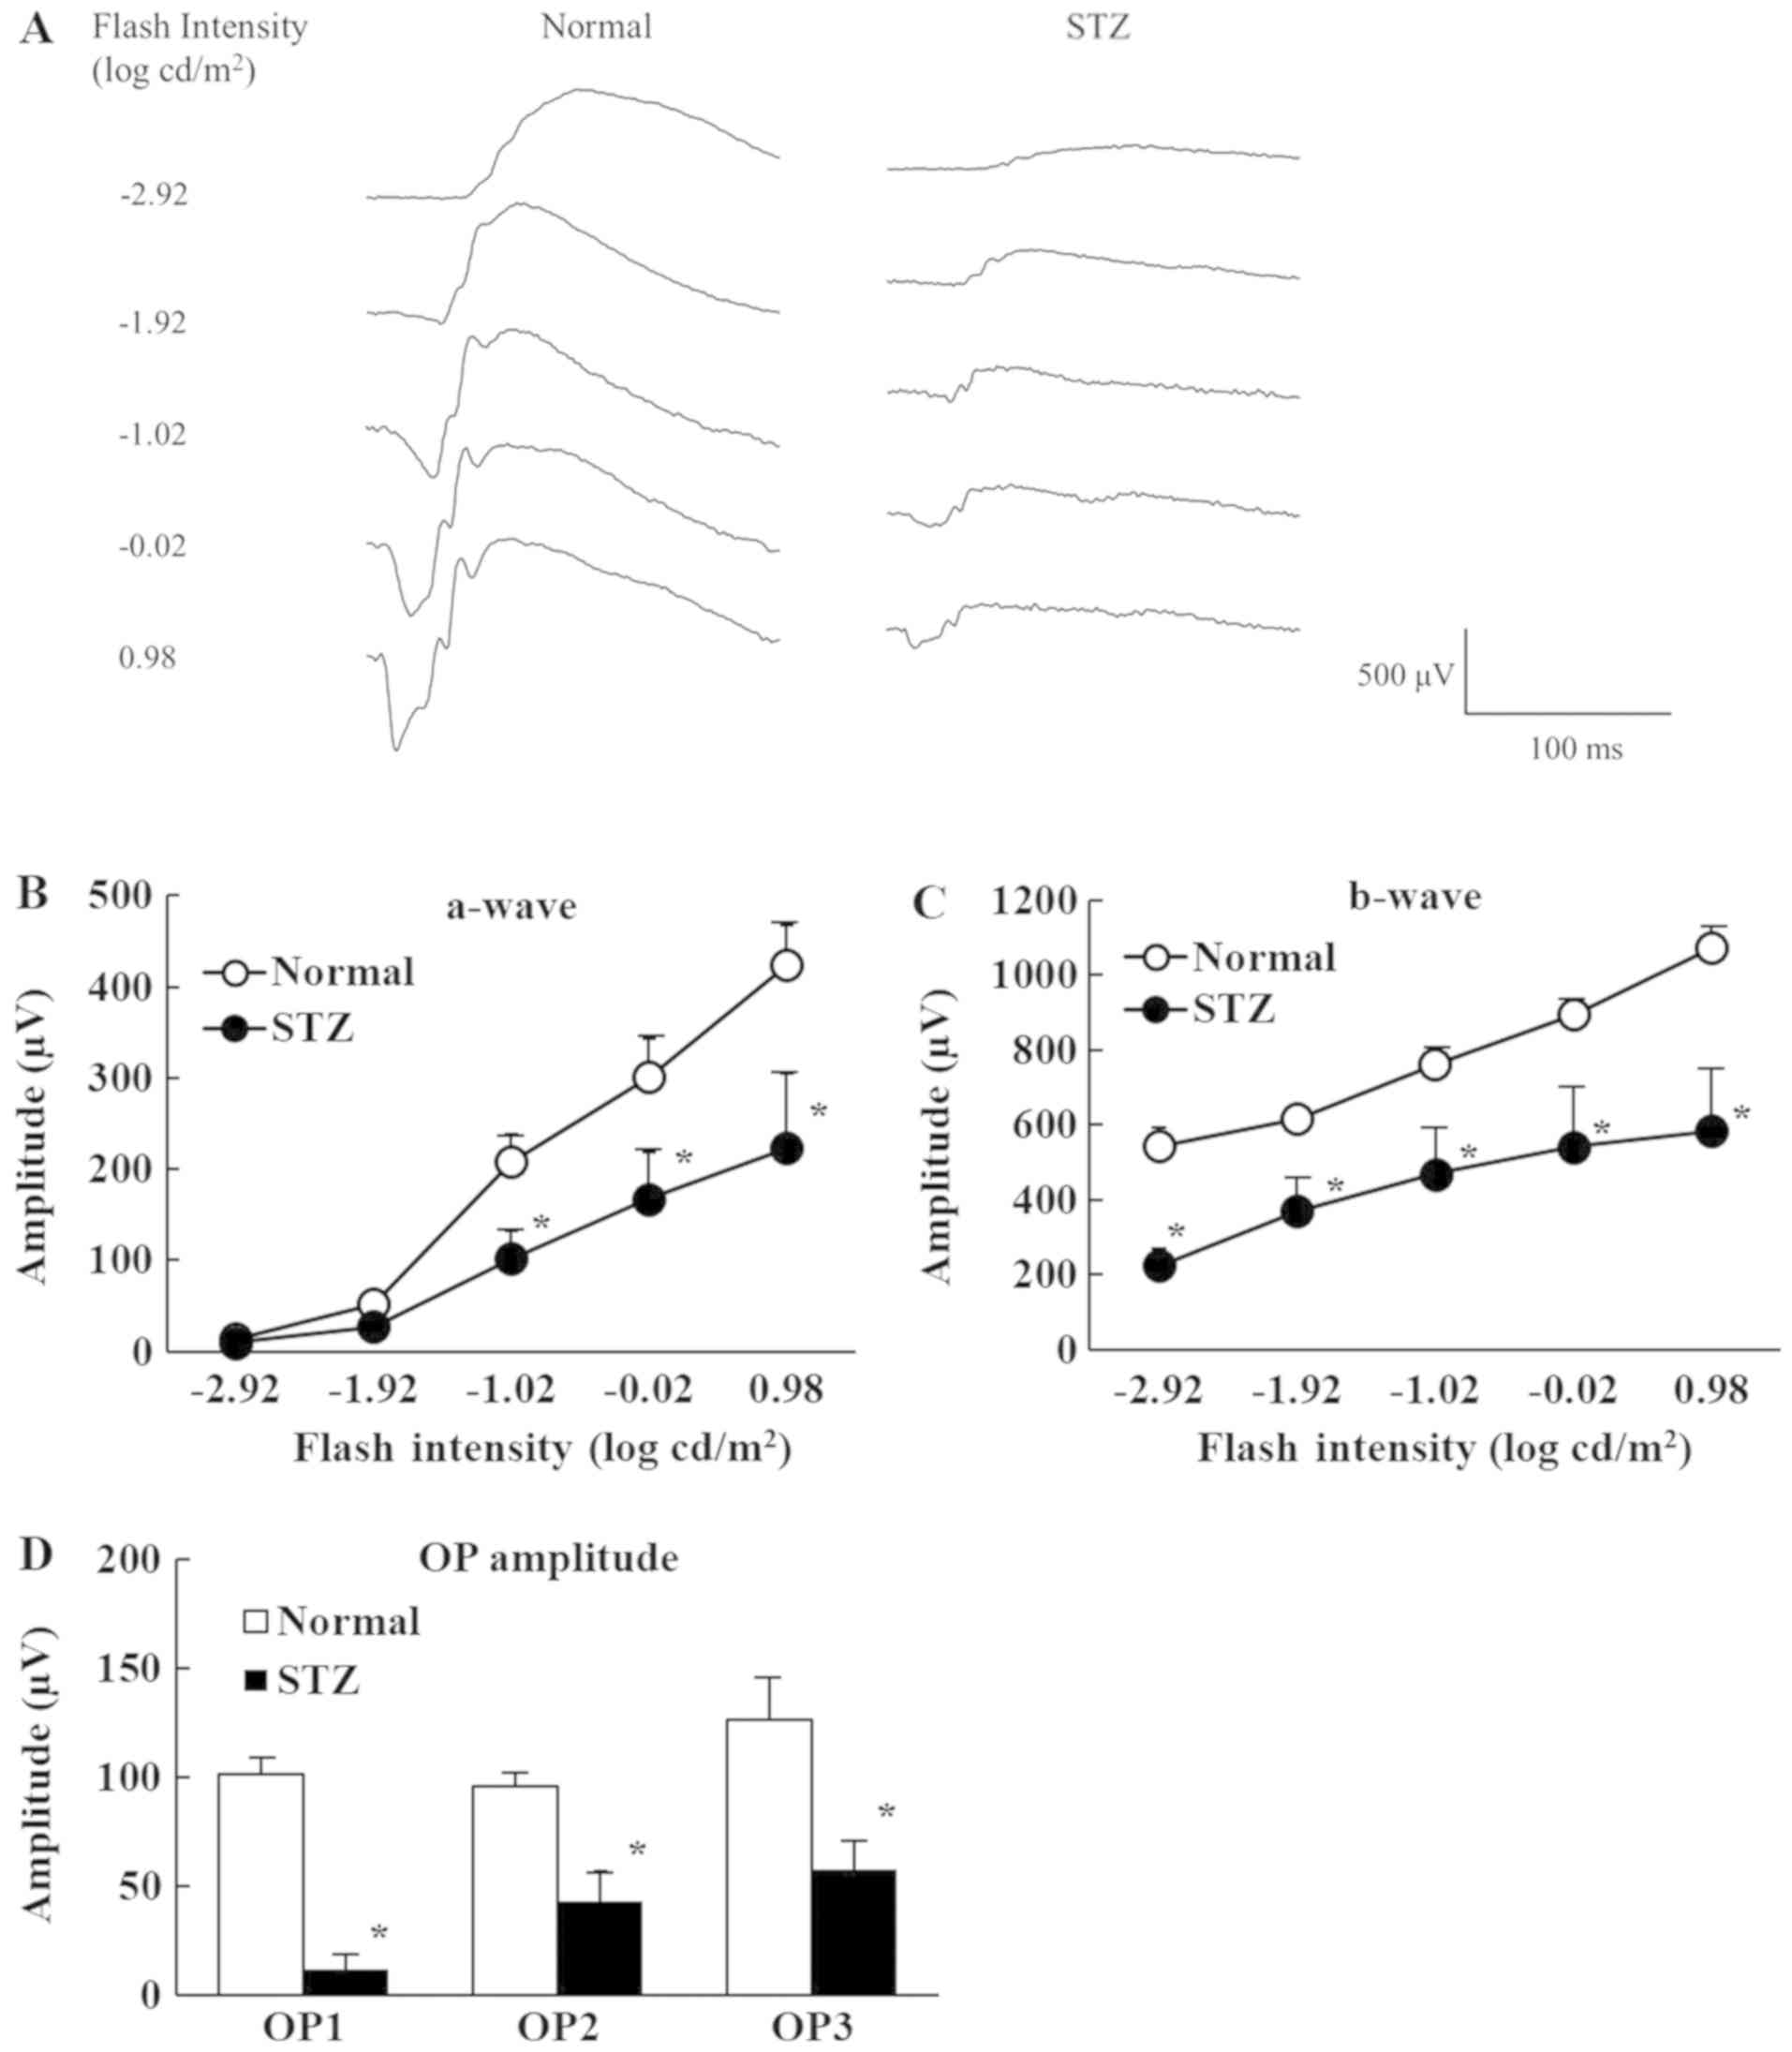
Fig. 2 shows the
retinal function of normal and STZ rats on the ERGs. The a-waves
reflect the function of photoreceptors, b-waves reflect bipolar
cell and Müller cell function, and OP amplitudes are dependent on
the hemodynamics in the central retinal artery. Retinal dysfunction
was evident 2 weeks after streptozotocin injection with the a-wave,
b-wave, and OP amplitudes lower in STZ rats than normal rats.
Changes in protein expression in the
retinas of STZ rats
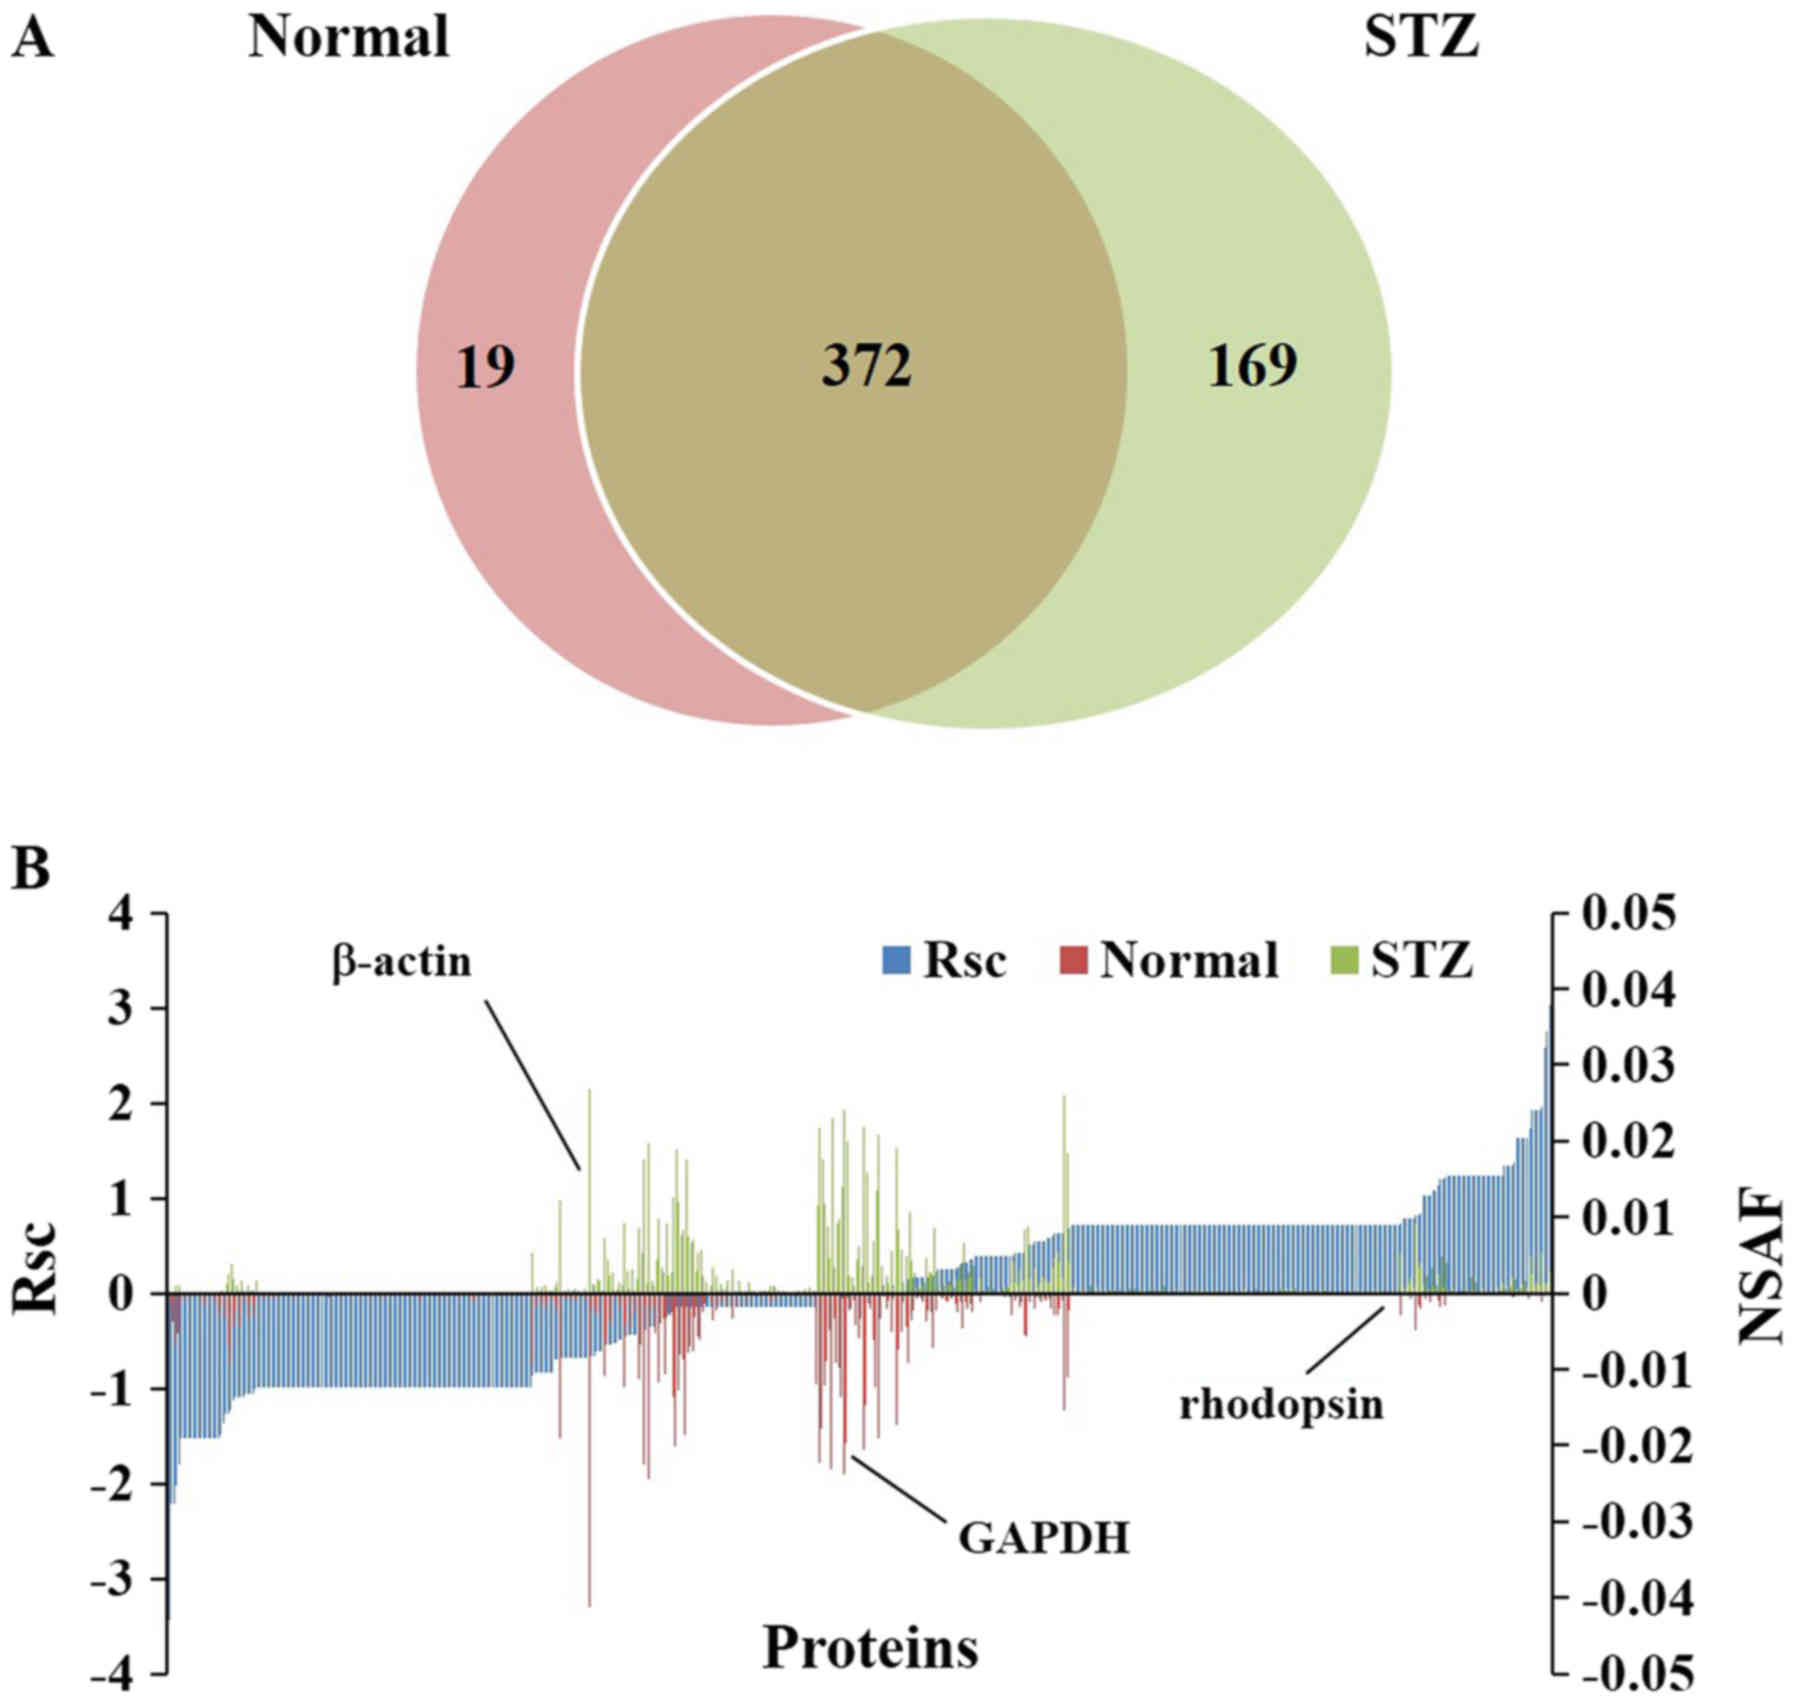
We identified 391 proteins in the retinas of normal
rats and 541 proteins in the retinas of STZ rats (Fig. 3A). A total of 560 proteins were
identified in the rat retina, including 372 (66.4%) present in both
normal and STZ animals, 19 (3.39%) unique to normal rats, and 169
(30.1%) unique to STZ rats (Fig.
3A). We also evaluated the proteins expressed in rat retinas
using a label-free semiquantitative method based on spectral
counting. Fig. 3B shows the Rsc
values for the proteins identified in the normal and STZ rats. A
positive Rsc indicated increased expression in the diabetic rat
retina, and a negative value indicated reduced expression.
Furthermore, the NSAF value was calculated for each protein
identified in the normal and STZ rats. Proteins with an Rsc >1
or <-1 were considered candidate proteins exhibiting
differential regulation with diabetic retinopathy. The expression
levels of housekeeping proteins, such as β-actin and
glyceraldehyde-3-phosphate dehydrogenase, did not change in the
retinas of STZ rats (Fig. 3B).
We performed GO analysis of the candidate proteins
regulated in the retinas of STZ rats. For this purpose, we searched
for GO terms related to ‘molecular function’ (Table I), ‘cellular component’ (Table II), ‘biological processes’
(Table III), and ‘Pathway’
(Table IV) in DAVID. Our focus
was on the nine proteins classified as ‘protein binding’, which
play important roles in retinal neurodegeneration in the GO
‘molecular function’ component (Table
V). Among these nine proteins, we homed in on the effect of
enhanced expression of retinol-binding protein 1 (RBP1) and
negative expression of rod outer segment membrane protein 1 (Rom-1)
in the retinas of STZ rats because both proteins are key factors in
acute retinal degeneration.
 | Table I.Gene Ontology analysis of identified
proteins in the molecular function category. |
Table I.
Gene Ontology analysis of identified
proteins in the molecular function category.
| Molecular function
category | Relative abundance
(%) |
|---|
| Protein
binding |
29.5 |
| Poly(A) RNA
binding |
13.6 |
| Structural molecule
activity |
13.6 |
| Identical protein
binding |
11.4 |
| Ubiquitin protein
ligase binding |
10.2 |
| ATPase
activity |
7.95 |
| RNA binding |
7.95 |
| GTP binding |
6.81 |
| Signal transducer
activity |
5.68 |
| Cytoskeletal
protein binding |
4.54 |
| Hydrogen ion
transmembrane transporter activity |
4.54 |
| Ion channel
binding |
4.54 |
| Unfolded protein
binding |
4.54 |
| Retinal
binding |
2.27 |
| Table II.Gene Ontology analysis of identified
proteins in the cellular component category. |
Table II.
Gene Ontology analysis of identified
proteins in the cellular component category.
| Cellular component
category | Relative abundance
(%) |
|---|
| Extracellular
exosome |
29.5 |
| Cytoplasm |
13.6 |
| Nucleus |
13.6 |
| Membrane |
11.4 |
| Cytosol |
10.2 |
| Extracellular
space |
17.0 |
| Mitochondrion |
15.9 |
| Myelin sheath |
14.8 |
| Golgi
apparatus |
12.5 |
| Perinuclear region
of cytoplasm |
12.5 |
| Neuron
projection |
11.4 |
| Protein
complex |
9.09 |
| Cell body |
7.95 |
| Focal adhesion |
7.95 |
| Synapse |
7.95 |
| Terminal
bouton |
7.95 |
| Extracellular
matrix |
6.81 |
| Intracellular
ribonucleoprotein complex |
6.81 |
| Postsynaptic
density |
6.81 |
| Cytoplasmic
vesicle |
5.68 |
| Intermediate
filament |
5.68 |
| Synaptic
vesicle |
5.68 |
| Blood
microparticle |
4.54 |
| Dendritic
spine |
4.54 |
| Melanosome |
4.54 |
| MPT-ATP SC,
coupling factor F (o) |
4.54 |
| MPT-ATP SC |
4.54 |
| Perikaryon |
4.54 |
| Clathrin-coated
vesicle |
3.41 |
| Intermediate
filament cytoskeleton |
3.41 |
| Photoreceptor outer
segment |
3.41 |
| Photoreceptor outer
segment membrane |
2.27 |
| Table III.Gene Ontology analysis of identified
proteins in the biological process category. |
Table III.
Gene Ontology analysis of identified
proteins in the biological process category.
| Biological process
category | Relative abundance
(%) |
|---|
| Response to
drug |
10.2 |
| Negative regulation
of apoptotic process |
9.10 |
| Aging |
6.82 |
| Protein
transport |
6.82 |
| Vesicle-mediated
transport |
6.82 |
| ATP metabolic
process |
5.68 |
| ATP synthesis
coupled protein transport |
5.68 |
| Endocytosis |
4.54 |
| ATP hydrolysis
coupled proton transport |
3.41 |
| Chromatin
silencing |
3.41 |
| Epidermis
development |
3.41 |
| Intermediate
filament organization |
3.41 |
| Regulation of
endocytosis |
3.41 |
| Response to axon
injury |
3.41 |
| Retina
homeostasis |
3.41 |
| RVMT, Golgi to
ER |
3.41 |
| Substantia nigra
development |
3.41 |
| Toxin
transport |
3.41 |
| Cellular response
to Thyroid stimulating hormone |
2.27 |
| Mucus
secretion |
2.27 |
| Negative regulation
of intracellular transport |
2.27 |
| Regulation of
histamine secretion by mast cell |
2.27 |
| Table IV.Gene Ontology analysis of identified
proteins in the pathway category. |
Table IV.
Gene Ontology analysis of identified
proteins in the pathway category.
| Pathway
category | Relative abundance
(%) |
|---|
| Oxidative
phosphorylation |
10.2 |
| Huntington's
disease |
9.10 |
| Endocytosis |
6.82 |
| Alcoholism |
5.68 |
| Alzheimer's
disease |
5.68 |
| Parkinson's
disease |
5.68 |
| Synaptic vesicle
cycle |
5.68 |
| Glutamatergic
synapse |
4.54 |
| Collecting duct
acid secretion |
3.41 |
| Table V.Proteins categorized as ‘protein
binding’ in Gene ontology analysis. |
Table V.
Proteins categorized as ‘protein
binding’ in Gene ontology analysis.
|
|
|
|
| Spectral
counting |
|---|
|
|
|
|
|
|
|---|
| ID | Accession number
and description | Number of amino
acids | Normal | STZ | Fold change
(Rsc) |
|---|
| ROM1_RAT | Q5PPM7 | Rod outer segment
membrane protein 1 |
351 | 4 | 0 |
−2.212260 |
| VAMP3_RAT | P63025 | Vesicle-associated
membrane protein 3 |
103 | 7 | 1 |
−2.017270 |
| PUF60_RAT | Q9WV25 |
Poly(U)-binding-splicing factor PUF60 |
564 | 2 | 0 |
−1.519500 |
| TBKB1_RAT | Q6DG50 | TANK-binding kinase
1-binding protein 1 |
613 | 2 | 0 |
−1.519500 |
| GNA12_RAT | Q63210 | Guanine
nucleotide-binding protein subunit alpha-12 |
379 | 2 | 0 |
−1.519500 |
| GBB4_RAT | O35353 | Guanine
nucleotide-binding protein subunit beta-4 |
340 | 3 | 9 |
1.132274 |
| GBB3_RAT | P52287 | Guanine
nucleotide-binding protein G(I)/G(S)/G(T) subunit beta-3 |
340 | 0 | 2 |
1.239212 |
| DDB1_RAT | Q9ESW0 | DNA damage-binding
protein 1 | 1,140 | 0 | 2 |
1.239212 |
| RET1_RA | P02696 | Retinol-binding
protein 1 |
135 | 1 | 7 |
1.736735 |
Discussion
In this study, we investigated the relationship
between retinal dysfunction and retinal protein expression using
shotgun proteomics in a model of diabetic retinopathy. Selection of
an appropriate model animal is essential for investigating this
relationship. Streptozotocin exposure damages pancreatic β-cells in
rats, leading to deficient insulin secretion (21,22).
In our previous work, we used STZ rats as a model of acute diabetic
retinopathy (6); here, we examined
glucose and insulin levels in the plasma of STZ rats. Plasma
glucose levels were significantly higher in STZ rats than in normal
rats. Furthermore, we could not detect plasma insulin in STZ rats,
which had significantly decreased body weight compared to normal
rats (Fig. 1). These results show
that STZ rats developed diabetes mellitus with hyperglycemia and
hypoinsulinemia.
Diabetic retinopathy is a common complication
associated with diabetes mellitus (23–25).
This disease is characterized by progressive alteration of the
retinal microvasculature derived from hyperglycemia (23), which leads to capillary closure and
areas of non-perfusion. This phenomenon causes retinal hypoxia and
pathological neovascularization, which leads to vision loss.
Next, we used ERGs to investigate changes in retinal
function after streptozotocin injection, measuring a-wave, b-wave,
and OP amplitude (Fig. 2). Retinal
neuron loss has been reported early in disease progression in STZ
rats, and this neuronal dysfunction was reflected in alterations in
the ERG findings (26–28). After streptozotocin injection, the
a-waves and b-waves of STZ rats decreased. OP amplitude, which
indicates the amplitude of the small wave between the a-wave and
b-wave peak, was also significantly lower in STZ rats than normal
rats. These reductions in a-wave, b-wave, and OP amplitude have
also been observed in human diabetic retinopathy (29,30).
Moreover, our previous study showed that, with increased thickening
of the retinal nerve cell layer, in particular, the gap between the
ganglion cell layer and inner granular layer was extended (6). These results suggest that the rat
retina is injured by streptozotocin injection, and that the
localized factor and cell layer distance are related to retinal
dysfunction.
Next, we applied LC/MS-based proteomics analysis to
elucidate factors and mechanisms of acute retinal dysfunction in
STZ rats. Although a quantitative value obtained using spectral
counting may not be accurate, it reflects differences in expression
and has been used in previous studies investigating novel
diagnostic biomarkers and biological mechanisms (11,12,31–35).
A total of 88 proteins had >2-fold change in expression in the
retinas of STZ rats, and we examined their roles in an analysis
against four GO terms. For this purpose, we focused on changes in
the expression of proteins classified into the ‘protein binding’
category in the ‘molecular function’ term because the relative
abundance of this category was highest among the ‘molecular
function’ terms. Proteins that are categorized into ‘protein
binding’ have the potential to interact with other proteins. Thus,
these molecules may play an important role in the decreased ERG
measures in STZ rats given the increased thickening of the retinal
nerve cell layer in these animals (6). The nine proteins were categorized,
and those showing the highest and lowest Rsc values were RBP1 and
Rom-1, respectively. Both proteins have been reported to be
involved in the retinoid cycle.
Visual pigment (11-cis-retinal + opsin
protein) is necessary for functioning photo receptors in the
retina, and the visual pigments are regenerated in the rod outer
segment and retinal pigment epithelium (retinoid cycle). In the
retinoid cycle, the visual pigment is isomerized to
all-trans-retinal by a light signal in the rod outer segment
disk. The isomerized all-trans-retinal is produced by the
reduction to all-trans-retinol via ABC cassette
transporter and all-trans-retinol dehydrogenase, and is
released into the gap between the photoreceptor outer segment and
retinal pigment epithelium. The released all-trans-retinol
is taken into the retinal pigment epithelium by RBP1, regenerated
into 11-cis-retinal, and reversed into the photoreceptor
outer segments via RBP1 (36–39).
Low RBP1 decreases the transport of 11-cis-retinal and
all-trans-retinol to the rod outer segment and retinal
pigment epithelium, respectively. Chen et al reported that
RBP1 not only transports 11-cis-retinal and
all-trans-retinol, but also efficiently releases
all-trans-retinol from rod photoreceptors in a
concentration-dependent manner (40). These effects prevent the production
of lipofuscin precursor, which is a factor in retinal dysfunction
(40). In this study, RBP1 levels
were significantly higher in the retinas of STZ rats than normal
rats. These findings suggest that the expression of RBP1 may be
increased by homeostatic mechanisms against the suppression of
lipofuscin production.
Rom-1 is a retina-specific integral membrane protein
localized to the rod outer segment disk rim (41,42).
Rom-1 has been reported to be involved in the stabilization and
compaction of outer segment disks and rim maintenance, which is
essential for morphogenesis in the rod outer segment disk (43). A previous study also showed that
Rom-1 knockout mice have recessive photoreceptor degeneration
(44). In the present study, Rom-1
levels were lower in the retinas of STZ rats than normal rats. As
the results of semi-quantitative analysis based on spectral counts
highly correlate with the results of quantification by Western blot
in previous studies (12,45,46),
the expression of RBP1 and Rom-1 are considered to have changed.
These results suggest that the decreased expression of Rom-1 is
related to retinal dysfunction via the destabilization of
morphogenesis in the rod outer segment disk. Further study is
needed to investigate whether RBP1 and Rom-1 protein levels
decreased in STZ rats via Western blotting and to elucidate the
mechanism underlying changes in Rom-1 and RBP1 in acute retinopathy
in STZ rats.
In conclusion, streptozotocin injury decreased
retinal function in rats. In association with this functional loss,
shotgun proteomics revealed altered expression of Rom-1 and RBP1,
which play important roles in maintaining the retinoid cycle.
Acknowledgements
Not applicable.
Funding
No funding was received.
Availability of data and materials
All data generated or analyzed during this study are
included in this published article.
Authors' contributions
HO, TY and NN performed the experiments and wrote
the manuscript. TY and SD analyzed and interpreted the data. AT
conceived and designed the current study. NN designed the
experiments and gave final approval for the version of the
manuscript to be published. All authors read and approved the final
manuscript.
Ethics approval and consent to
participate
All experiments were performed in compliance with
the regulations approved by the Ethics Committee of the Kindai
University Faculty of Pharmacy (Ethic Committee approval code,
KAPS-25-001; Date of approval, April 1, 2013).
Patient consent for publication
Not applicable.
Competing interests
The authors declare that they have no competing
interests.
Glossary
Abbreviations
Abbreviations:
|
ERGs
|
electroretinogram
|
|
GO
|
Gene Ontology
|
|
LC/MS
|
liquid chromatography/mass
spectroscopy
|
|
NSAF
|
normalized spectral abundance
factor
|
|
OP
|
oscillatory potential
|
|
RBP1
|
retinol-binding protein 1
|
|
Rom-1
|
rod outer segment membrane protein
1
|
|
SE
|
standard error
|
|
STZ rat
|
streptozotocin-induced diabetic
rat
|
References
|
1
|
Radenković M, Stojanović M and Prostan M:
Experimental diabetes induced by alloxan and streptozotocin: The
current state of the art. J Pharmacol Methods. 78:13–31. 2016.
View Article : Google Scholar
|
|
2
|
Goyal SN, Reddy NM, Patil KR, Nakhate KT,
Ojha S, Patil CR and Agrawal YO: Challenges and issues with
streptozotocin-induced diabetes-A clinically relevant animal model
to understand the diabetes pathogenesis and evaluate therapeutics.
Chem Biol Interact. 244:49–63. 2016. View Article : Google Scholar : PubMed/NCBI
|
|
3
|
Liu CH, Wang Z, Sun Y and Chen J: Animal
models of ocular angiogenesis: From development to pathologies.
FASEB J. 31:4665–4681. 2017. View Article : Google Scholar : PubMed/NCBI
|
|
4
|
Nagai N, Deguchi S, Otake H, Hiramatsu N
and Yamamoto N: Therapeutic effect of cilostazol ophthalmic
nanodispersions on retinal dysfunction in streptozotocin-induced
diabetic rats. Int J Mol Sci. 18(pii): E19712017. View Article : Google Scholar : PubMed/NCBI
|
|
5
|
Deguchi S, Otake H, Nakazawa Y, Hiramatsu
N, Yamamoto N and Nagai N: Ophthalmic formulation containing
nilvadipine nanoparticles prevents retinal dysfunction in rats
injected with streptozotocine. Int J Mol Sci. 18(pii): E27202017.
View Article : Google Scholar : PubMed/NCBI
|
|
6
|
Hiramatsu N, Deguchi S, Yoshioka C, Otake
H, Yamamoto N and Nagai N: Evaluation of retinal function in
streptozotocin-induced diabetic rats by using the
electroretinography and immunohistochemistry methods. Yakugaku
Zasshi. 137:1169–1175. 2017.(In Japanese). View Article : Google Scholar : PubMed/NCBI
|
|
7
|
Gopalakrishnan V, Purushothaman P and
Bhaskar A: Proteomic analysis of plasma proteins in diabetic
retinopathy patients by two dimensional electrophoresis and
MALDI-Tof-MS. J Diabetes Complications. 29:928–936. 2015.
View Article : Google Scholar : PubMed/NCBI
|
|
8
|
Joseph R, Srivastava OP and Pfister RR:
Differential epithelial and stromal protein profiles in keratoconus
and normal human corneas. Exp Eye Res. 92:282–298. 2011. View Article : Google Scholar : PubMed/NCBI
|
|
9
|
Yamamoto T, Kudo M, Peng WX and Naito Z:
Analysis of protein expression regulated by lumican in PANC-1 cells
using shotgun proteomics. Oncol Rep. 30:1609–1621. 2013. View Article : Google Scholar : PubMed/NCBI
|
|
10
|
Meade ML, Shiyanov P and Schlager JJ:
Enhanced detection method for corneal protein identification using
shotgun proteomics. Proteome Sci. 7:232009. View Article : Google Scholar : PubMed/NCBI
|
|
11
|
Nagai N, Yamamoto T, Mitamura K and Taga
A: Proteomic profile of the lens in a streptozotocin-induced
diabetic rat model using shotgun proteomics. Biomed Rep. 7:445–450.
2017. View Article : Google Scholar : PubMed/NCBI
|
|
12
|
Yammoto T, Otake H, Hiramatsu N, Yamamoto
N, Taga A and Nagai N: A proteomic approach for understanding the
mechanisms of delayed corneal wound healing in diabetic keratopathy
using diabetic model rat. Int J Mol Sci. 19(pii): E36352018.
View Article : Google Scholar : PubMed/NCBI
|
|
13
|
Ma DH, Lai JY, Yu ST, Liu JY, Yang U, Chen
HC, Yeh LK, Ho YJ, Chang G, Wang SF, et al: Up-regulation of heat
shock protein 70-1 (Hsp70-1) in human limbo-corneal epithelial
cells cultivated on amniotic membrane: A proteomic study. J Cell
Physiol. 227:2030–2039. 2012. View Article : Google Scholar : PubMed/NCBI
|
|
14
|
Nagai N, Ito Y and Sasaki H: Hyperglycemia
enhances the production of amyloid β1–42 in the lenses of otsuka
long-evans tokushima fatty rats, a model of human type 2 diabetes.
Invest Ophth Vis Sci. 57:1408–1417. 2016. View Article : Google Scholar
|
|
15
|
Bluemlein K and Ralser M: Monitoring
protein expression in whole-cell extracts by targeted label- and
standard-free LC-MS/MS. Nat Protoc. 6:859–869. 2011. View Article : Google Scholar : PubMed/NCBI
|
|
16
|
Old WM, Meyer-Arendt K, Aveline-Wolf L,
Pierce KG, Mendoza A, Sevinsky JR, Resing KA and Ahn NG: Comparison
of label-free methods for quantifying human proteins by shotgun
proteomics. Mol cell Proteom. 4:1487–1502. 2005. View Article : Google Scholar
|
|
17
|
Zybailov B, Coleman MK, Florens L and
Washburn MP: Correlation of relative adundance ratios derived from
peptide ion chromatograms and spectrum counting for quantitative
proteomic analysis using stable isotope labeling. Anal Chem.
77:6218–6224. 2005. View Article : Google Scholar : PubMed/NCBI
|
|
18
|
Dennis G Jr, Sherman BT, Hosack DA, Yang
J, Gao W, Lane HC and Lempicki RA: DAVID: Database for annotation,
visualization, and integrated discovery. Genome Biol. 4:P32003.
View Article : Google Scholar : PubMed/NCBI
|
|
19
|
Huang da W, Sherman BT and Lempicki RA:
Systematic and integrative analysis of large gene lists using DAVID
bioinformatics resources. Nat Protoc. 4:44–57. 2009. View Article : Google Scholar : PubMed/NCBI
|
|
20
|
Huang da W, Sherman BT, Zheng X, Yang J,
Inamichi T, Stephens R and Lempicki RA: Extracting biological
meaning from large gene lists with DAVID. Curr Protoc
Bioinformatics. Chapter 13: Unit 13.11. 2009, View Article : Google Scholar
|
|
21
|
Stephen Irudayaraj S, Sunil C,
Duraipandiyan V and Ignacimuthu S: Antidiabetic and antioxidant
activities of Toddalia asiatica (L.) Lam. Leaves in streptozotocin
induced diabetic rats. J Ethnopharmacol. 143:515–523. 2012.
View Article : Google Scholar : PubMed/NCBI
|
|
22
|
Nisha P and Mini S: Flavanoid rich ethyl
acetate fraction of Musa paradisiaca inflorescence down-regulates
the streptozotocin induced oxidative stress, hyperglycemia and mRNA
levels of selected inflammatory genes in rats. J Funct Food.
5:1838–1847. 2013. View Article : Google Scholar
|
|
23
|
Miller JW, Adamis AP and Aiello LP:
Vascular endothelial growth factor in ocular neovascularization and
proliferative diabetic retinopathy. Diabetes Metab Rev. 13:37–50.
1997. View Article : Google Scholar : PubMed/NCBI
|
|
24
|
Cheung N and Wong TY: Diabetic retinopathy
and systemic vascular complications. Prog Retin Eye Res.
27:161–176. 2008. View Article : Google Scholar : PubMed/NCBI
|
|
25
|
Cheung N, Mitchell P and Wong TY: Diabetic
retinopathy. Lancet. 376:124–136. 2010. View Article : Google Scholar : PubMed/NCBI
|
|
26
|
Barber AJ, Lieth E, Khin SA, Antonetti DA,
Buchanan AG and Gardner TW: Neural apoptosis in the retina during
experimental and human diabetes. J Clin Invest. 102:783–791. 1998.
View Article : Google Scholar : PubMed/NCBI
|
|
27
|
Lecleire-Collet A, Audo I, Aout M, Girmens
JF, Sofroni R, Erginary A, Gargasson JF, Mohand-Saïd S, Meas T,
Guillausseau PJ, et al: Evaluation of retinal function and flicker
light-induced retinal vascular response in normotensive patients
with diabetes without retinopathy. Invest Ophthalmol Vis Sci.
52:2861–2867. 2011. View Article : Google Scholar : PubMed/NCBI
|
|
28
|
Hancock HA and Kraft TW: Oscillatory
potential analysis and ERGs of normal and diabetic rats. Invest
Ophthalmol Vis Sci. 45:1002–1008. 2004. View Article : Google Scholar : PubMed/NCBI
|
|
29
|
Layton CJ, Safa R and Osbrme NN:
Oscillatory potentials and the b-wave: Partial masking and
interdependence in dark adaptation and diabetes in the rat. Graefes
Arch Clin Exp Ophthalmol. 245:1335–1345. 2007. View Article : Google Scholar : PubMed/NCBI
|
|
30
|
Samuels IS, Bell BA, Pereira A, Saxon J
and Peachey NS: Early retinal pigment epithelium dysfunction is
concomitant with hyperglycemia in mouse models of type 1 and type 2
diabetes. J Neurophysiol. 113:1085–1099. 2015. View Article : Google Scholar : PubMed/NCBI
|
|
31
|
Yamamoto T, Kudo M, Peng WX and Naito Z:
Analysis of protein expression regulated by lumican in PANCc-1
cells using shotgun proteomics. Oncol Rep. 30:1609–1621. 2013.
View Article : Google Scholar : PubMed/NCBI
|
|
32
|
Takaya A, Peng WX, Ishino K, Kudo M,
Yamamoto T, Wada R, Takeshita T and Naito Z: Cystatin B as a
potential diagnostic biomarker in ovarian clear cell carcinoma. Int
J Oncol. 46:1573–1581. 2015. View Article : Google Scholar : PubMed/NCBI
|
|
33
|
Kanzaki A, Kudo M, Ansai S, Peng WX,
Ishino K, Yamamoto T, Wada R, Fujii T, Teduka K, Kawahara K, et al:
Insulin-like growth factor 2 mRNA-binding protein-3 as a marker for
distinguishing between cutaneous squamous cell carcinoma and
keratoacanthoma. Int J Oncol. 48:1007–1015. 2016. View Article : Google Scholar : PubMed/NCBI
|
|
34
|
Yamamoto T, Kudo M, Peng WX, Takata H,
Takakura H, Teduka K, Fujii T, Mitamura K, Taga A, Uchida E and
Naito Z: Identification of aldolase A as a potential diagnostic
biomarker for colorectal cancer based on proteomic analysis using
formalin-fixed paraffin-embedded tissue. Tumor Biol.
37:13595–13606. 2016. View Article : Google Scholar
|
|
35
|
Takata H, Kudo M, Yamamoto T, Ueda J,
Ishino K, Peng WX, Wada R, Taniai N, Yoshida H, Uchida E and Naito
Z: Increased expression of PDIA3 and its association with cancer
cell proliferation and poor prognosis in hepatocellular carcinoma.
Oncol Lett. 12:4896–4904. 2016. View Article : Google Scholar : PubMed/NCBI
|
|
36
|
Saari JC: Biochemistry of visual pigment
regeneration: The Friedenwald lecture. Investig Ophthalmol Vis Sci.
41:337–348. 2000.
|
|
37
|
Maeda A, Golczak M, Chen Y, Okano K, Kohno
H, Shiose S, Ishikawa K, Harte W, Palczewska G, Maeda T and
Palczewski K: Primary amines protect against retinal degeneration
in mouse models of retinopathies. Nat Chem Biol. 8:170–178. 2011.
View Article : Google Scholar : PubMed/NCBI
|
|
38
|
Lai Y, Wiggert B, Liu Y and Chader G:
Interphotoreceptor retinol-binding proteins: Possible transport
vehicles between compartments of the retina. Nature. 26:848–849.
1982. View Article : Google Scholar
|
|
39
|
Lin ZS, Fong S and Bridges CD: Retinoids
bound to interstitial retinol-binding protein during light and
dark-adaptation. Vision Res. 29:1699–1709. 1989. View Article : Google Scholar : PubMed/NCBI
|
|
40
|
Chen C, Adler L IV, Goletz P,
Gonzalez-Femandez F, Thompson DA and Koutalos Y: Interphotoreceptor
retinoid-binding protein removes all-trans-retinol and retinal from
rod outer segments, preventing lipofscin precursor formation. J
Biol Chem. 292:19356–19365. 2017. View Article : Google Scholar : PubMed/NCBI
|
|
41
|
Bascom RA, Manara S, Collins L, Molday RS,
Kalnins VI and Mclnnes RR: Cloning of the cDNA for a novel
photoreceptor membrane protein (rom-1) identifies a disk rim
protein family implicated in human retinopathies. Neuron.
8:1171–1184. 1992. View Article : Google Scholar : PubMed/NCBI
|
|
42
|
Bascom RA, Liu L, Humphries P, Fishman GA,
Murray JC and Mclnnes RR: Polymorphisms and rare sequence variants
at the ROM1 locus. Hum Mol Genet. 2:1975–1977. 1993. View Article : Google Scholar : PubMed/NCBI
|
|
43
|
Loewen CJ and Molday RS:
Disulfide-mediated oligomerization of Peripherin/Rds and Rom-1 in
photoreceptor disk membranes. Implications for photoreceptor outer
segment morphogenesis and degeneration. J Biol Chem. 275:5370–5378.
2000. View Article : Google Scholar : PubMed/NCBI
|
|
44
|
Clarke G, Goldberg AF, Vidgen D, Collins
L, Ploder L, Schwarz L, Molday LL, Rossant J, Szél A, Molday RS, et
al: Rom-1 is required for rod photoreceptor viability and the
regulation of disk morphogenesis. Nat Genet. 25:67–73. 2000.
View Article : Google Scholar : PubMed/NCBI
|
|
45
|
Yamamoto T, Nishita T and Taga A:
Dark-colored maple syrup treatment induces S-phase cell cycle
arrest via reduced proliferating cell nuclear antigen expression in
colorectal cancer cells. Oncol Lett. 17:2713–2720. 2019.PubMed/NCBI
|
|
46
|
Yamamoto T, Nakanishi S, Mitamura K and
Taga A: Collagen peptides from soft-shelled turtle induce calpain-1
expression and regulate inflammatory cytokine expression in HaCaT
human skin keratinocytes. Int J Mol Med. 42:1168–1180.
2018.PubMed/NCBI
|