Introduction
Pancreatic ductal adenocarcinoma (PDAC) is among the
most chemoresistant and lethal types of cancer due to its multiple
mechanisms of pathogenesis and the heterogeneity of its genetic
mutations (1,2). Both PDAC and its treatment
significantly affect patient quality of life (2,3). The
only potentially curative treatment for patients with PDAC is
radical resection; however, only 15–20% of patients are candidate
for radical resection at the time of diagnosis due to the early
metastasis and late presentation of PDAC (3,4). If
a patient presents as borderline resectable, tumor cells have only
invaded the local blood vessels, and neoadjuvant therapy combined
with surgical resection is the main treatment (1). For patients with distant metastasis,
comprehensive treatment based on chemotherapy is the only viable
option (5). However, patients with
PDAC usually have a poor response to chemotherapy and radiotherapy
(5). In addition, targeted therapy
based on molecular pathways has significantly improved survival in
numerous types of cancer, but improved prognosis in patients with
PDAC is still limited (6). There
is an urgent need to understand the molecular mechanisms underlying
PDAC development, which may help identify new biomarkers for PDAC
detection and improve current treatment strategies.
Histone deacetylases (HDACs) are a class of enzymes
that control the transcription of histones and non-histones via
deacetylation (7). Dysregulated
expression and mutation of HDACs have been found in various
diseases and are related to carcinogenesis (8). Therefore, HDACs are potential
therapeutic targets for some neoplasms. Previous studies have
demonstrated that HDAC inhibitors can induce cell cycle arrest,
apoptosis and tumor cell differentiation (9,10).
Several HDAC inhibitors have been studied in patients with solid
neoplasms or other malignancies, and are considered potential
anticancer drug candidates (11,12).
HDAC is a unique family member of class IIa HDACs with
tissue-specific expression (13).
HDAC can regulate a variety of biological processes, including
T-regulatory cell function, muscle differentiation, neuronal
disorders, development and tumorigenesis (14). Due to its unique biological
function, HDAC9 can selectively encode multiple protein isoforms
(15). Recent studies have also
demonstrated that HDAC9 has differing oncogenic effects in various
malignancies, including oral squamous cell carcinoma, breast cancer
and retinoblastoma (10,15,16).
To the best of our knowledge, the role of HDAC9 in
the development and progression of the PDAC has not been previously
studied. The present study investigated the expression levels of
HDAC9 in PDAC using reverse transcription-quantitative PCR
(RT-qPCR), western blotting and immunohistochemistry (IHC). In
addition, the present study evaluated associations between HDAC9
expression levels, and the clinicopathologic parameters and
prognosis of patients with PDAC.
Materials and methods
Human tissue specimens and
clinicopathological information
A tissue microarray containing 97 PDAC specimens,
PDAC tumor tissue and paired adjacent tissue were collected from 97
patients with primary PDAC (age range, 21–77 years; sex, 60 males
and 37 females) who underwent surgical resection from September
2011 to December 2013 at The Second Affiliated Hospital of
Chongqing Medical University. All patients had been diagnosed with
typical PDAC by the pathologist after surgery. TNM stage and
clinical stage were evaluated according to the American Joint
Committee on Cancer manual (17).
The present study was approved by the Ethics Committee of The
Second Affiliated Hospital of Chongqing Medical University and was
conducted in accordance with the Declaration of Helsinki. An
informed consent document was signed by all patients.
Cell culture and transfection
PDAC cell lines (CFPAC-1, HPAC, SW1990 and Capan-2),
and pancreatic ductal epithelial cells (HPDE) were obtained from
the Institute of Biochemistry and Cell Biology (Chinese Academy of
Sciences). All cell lines were cultured in RPMI-1640 (Gibco; Thermo
Fisher Scientific, Inc.) containing 10% FBS (Gibco; Thermo Fisher
Scientific, Inc.), and were incubated at 37°C with 5%
CO2. A total of 3×10⁵ CFPAC-1 cells were
transfected with 50 nM/ul siRNA (si) against HDAC9 (si-HDAC9) or
negative control (si-NC). The sequences for the siRNAs were as
follows: si-HDAC9 forward, 5′-AACGCCGGAGCUUUCACGTAT-3′ and reverse,
5′-GCGTTCAAUCAUGGUGGCACUTT-3′; and si-NC forward,
5′-AACUCCAAATGUTTCUCGATT-3′ and reverse,
5′-GAAUCACGCCCUAAGTTAATT-3′. The cells were transiently transfected
using Lipofectamine® 2000 reagent (Invitrogen; Thermo
Fisher Scientific, Inc), and the transfection effect was maintained
for >72 h.
Western blotting
Total protein was extracted from 1×10⁶
CFPAC-1, HPAC, SW1990, Capan-2 and HPDE cell lines, and 100 mg PDAC
and adjacent tissues using RIPA lysis buffer (Beyotime Institute of
Biotechnology). Total protein was quantified using the Bradford
protein assay (Bio-Rad Laboratories, Inc.) with a Nanodrop
spectrophotometer and 25 µg protein/lane was separated by SDS-PAGE
on a 10% gel. After blocking with 5% non-fat powdered milk at room
temperature for 1 h, the PVDF membranes were probed at 4°C
overnight using the following primary antibodies: Anti-HDAC9
(1:1,000; cat. no. ab59718; Abcam), anti-Bax (1:5,000; cat. no.
ab32503; Abcam), anti-Bcl-2 (1:500, cat. no. ab182858; Abcam),
anti-KI67 (1:1,000; cat. no. ab15580; Abcam) and anti-GAPDH
(1:5,000; cat. no. ab181602; Abcam). Subsequently, the PVDF
membranes were incubated with a horseradish peroxidase-conjugated
secondary antibody (1:5,000; cat. no. ab6721; Abcam) at room
temperature for 1 h. Protein bands were visualized using enhanced
chemiluminescence solution (EMD Millipore) and a ChemiDoc Imaging
System (Bio-Rad Laboratories, Inc.). Protein expression was
quantified using Quantity One version 4.6.6 software (Bio-Rad
Laboratories, Inc.), with GAPDH as the loading control.
RT-qPCR
Total RNA from 1×10⁶ CFPAC-1, HPAC,
SW1990, Capan-2 and HPDE cell lines, and 70 mg PDAC and paired
adjacent tissues was extracted using TRIzol® reagent
(Invitrogen; Thermo Fisher Scientific, Inc.). A PrimeScript RT kit
(Takara Bio, Inc.) was used for RT of cDNA. The temperature
protocol for RT was as follows: 32°C for 10 min, followed by 42°C
for 30 min and 75°C for 10 min. qPCR was performed using
SYBR® Premix Ex Taq™ II (Takara Bio, Inc.)
using a LightCycler system (Roche Molecular Systems, Inc.). The
following primer sequences were used for the qPCR: HDAC9 forward,
5′-GAACTCTAAGCCAGATGGGG-3′ and reverse, 5′-GCCCACAGGAACTTCTGACT-3′;
and GAPDH forward, 5′-TTCCAGCCTTCCTTCCTGGG-3′ and reverse,
5′-TTGCGCTCAGGAGGAGCAAT-3′. The following thermocycling conditions
were used for the qPCR: Initial denaturation at 95°C for 2 min; 40
cycles of 95°C for 15 sec, 60°C for 34 sec and 72°C for 30 sec. The
mRNA expression levels of HDAC9 were quantified using the
2−ΔΔCq method (18) and
expression levels were normalized to the internal reference gene
GAPDH.
IHC
IHC of HDAC9 expression levels was performed using
PDAC tissue microarrays. PDAC and paired adjacent tissues were
fixed in 10% neutral formalin solution at room temperature for 24
h. Subsequently, paraffin-embedded tissue-array sections (4 µm)
were dried at 80°C for 24 h, de-paraffinized in xylene I for 15 min
and xylene II for 15 min, and then rehydrated in graded ethanol
(100% ethanol for 5 min, 95% ethanol for 5 min, 80% ethanol for 5
min and 75% ethanol for 5 min). To block the endogenous peroxidase
activity, the sections were incubated in 3%
H2O2 for 30 min at room temperature. After
washing with 0.01 M PBS three times, sections were incubated for 15
min at room temperature with 5% goat serum (OriGene Technologies,
Inc.) to block non-specific binding, followed by incubation with a
rabbit monoclonal anti-HDAC9 antibody (1:500; cat. no. ab109446;
Abcam) at 4°C overnight. The sections were then incubated with an
anti-rabbit secondary IgG antibody (1:5,000; cat. no. TA140003;
OriGene Technologies, Inc.) at 37°C for 30 min. After washing with
PBS, the signal was visualized using diaminobenzidine (Wuhan Boster
Biological Technology, Ltd.), and counterstaining was performed
with hematoxylin for 2 min at room temperature. The
histopathological examination was performed using an Olympus DP70
light microscope (magnification, ×200; Olympus Corporation).
Finally, HDAC9 immunostaining was scored and examined by two
independent assessors, who were blinded to the clinicopathological
data.
Scoring systems for IHC staining
The staining intensity score and the proportion of
HDAC9 positive cells were evaluated by the pathologist as follows:
Staining intensity, i) negative=0; ii) weakly stained=1; iii)
moderately stained=2; and iv) strongly stained=3. Staining extent:
i) none=0; ii) 1–20%=1; iii) 21–40%=2; iv) 41–60%=3; v) 61–80%=4;
and vi) 81–100%=5. The final immunoreactive score (IRS) of HDAC9
expression level was calculated by multiplying the staining
intensity score with the staining extent score. IRS was
dichotomised using X-tile software version 3.4.7 software (Yale
School of Medicine), which is a useful bio-informatics tool for
outcome-based cut-point optimization (19). IRS ≤7.5 was designated as low
expression, while IRS >7.5 was designated as high
expression.
Cell Counting Kit-8 assay (CCK-8)
A total of 2×10³ CFPAC-1 cells/well were
transfected with si-HDAC9 or si-NC for 48 h and cultured in a
96-well plate for 24, 48 and 72 h. Cell proliferation analysis was
performed using the CCK-8 assay (Dojindo Molecular Technologies,
Inc.) according to the manufacturer's protocol.
Wound healing assay
A total of 3×10⁵ CFPAC-1 cells were
transfected with si-HDAC9 or si-NC for 48 h and seeded into 6-well
plates. When the cell density reached 70–80%, all cell lines were
cultured in RPMI-1640 medium containing 0% FBS and were incubated
at 37°C with 5% CO2 for 24 h. The cell monolayer was
scratched with a pipette tip (size, 10 ml) to generate three
scratch wounds and then rinsed twice with PBS to remove
non-adherent cells. Cells were visualized and counted using a light
microscope (magnification, ×200). The distance between scratches
was measured at 0, 24 and 48 h. The cell migration rate (%) was
calculated using the following equation: [(Original gap
distance-current gap distance)/original gap distance] ×100.
5-Ethynyl-2′-deoxyuridine (EdU)
assay
A total of 1×10³ CFPAC-1 cells were
transfected for 48 h and cultured in a 96-well plate. Cells were
incubated with 50 µM EdU, 100 µl 1X ApolloR reaction cocktail (cat.
no. 100T; Guangzhou RiboBio Co., Ltd.) and 100 µl 1X Hoechst 33342
for 30 min at 37°C. Cell proliferation was analyzed by counting the
mean number of cells in three fields for each sample using a
fluorescence microscope (magnification, ×100).
Tumorigenesis assay
A total of 6 BALB/c-nu mice (age, 5 weeks; sex,
male; weight, 20–22 g) were purchased from The Shanghai
Experimental Animal Center and housed in a sterile room at The
Animal Center of Chongqing Medical University at 25°C and 40–70%
humidity, with a 12-h light/dark cycle and free access to food and
water. The study was approved by Ethics Committee of Chongqing
Medical University (approval no. IACUC-20180117021). All animal
experiments were performed in accordance with the institutional
guidelines, and the method of euthanasia was cervical dislocation
(when the heart stopped completely, the mouse was determined as
dead). Body weight loss >20% was assumed to be a humane endpoint
for euthanasia. Xenograft tumors were generated by subcutaneously
injecting 3×10⁶ PDAC cells into the left hip flanks of
the mice (n=3 per group; 2 groups; each mouse was inoculated with a
single tumor site of PDAC cells). Tumor volume was calculated
according to the following formula: Volume=(length ×
width2)/2. Then, 28 days after injection, the mice were
sacrificed, and tumors were collected for analysis. The tumor
experiments were ended when tumor diameters were <20 mm (the
maximum tumor volume was 523 mm3).
Statistical analysis
Data are presented as the mean ± SD and each cell
experiment was repeated three times. Statistical data were analyzed
using SPSS version 23.0 software (IBM Corp.) and GraphPad Prism
version 7.0 software (GraphPad Software, Inc.). A paired t-test was
used to evaluate the significance of HDAC9 expression level between
PDAC tissues and adjacent normal tissues. Association analyses of
clinicopathological factors was performed with Pearson's
χ2 test. The Kaplan-Meier method was used to plot
survival curves and calculate survival probabilities for overall
survival. The statistical significance of survival curves was
determined using the log-rank test. Univariate and multivariate
analyses (Cox regression analysis) were applied to identify the
clinicopathological features, and covariates with P<0.05 in
univariate analysis were further analyzed by multivariate analysis.
Statistical differences were analyzed by one-way ANOVA, followed by
Tukey's test. P<0.05 was considered to indicate a statistically
significant difference.
Results
Expression of HDAC9 protein in
PDAC
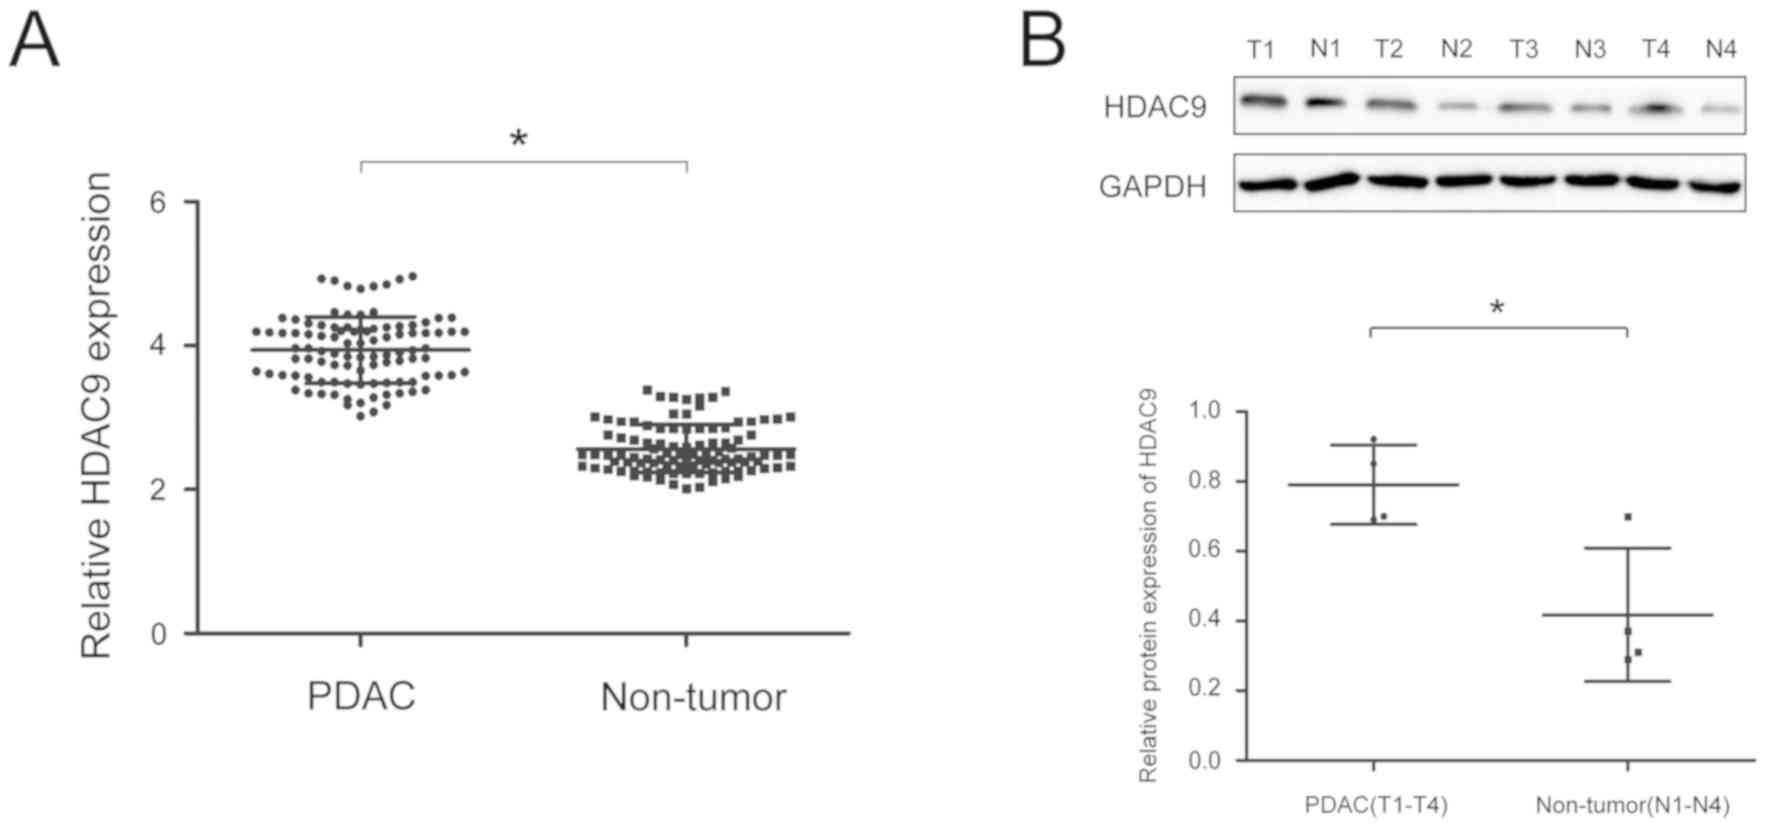
To analyze the expression of HDAC9 protein in PDAC,
RT-qPCR and western blot analyses were performed on PDAC and paired
adjacent tissue. The expression of HDAC9 was significantly higher
in PDAC tissues compared with paired adjacent tissues (Fig. 1A and B). Moreover, the expression
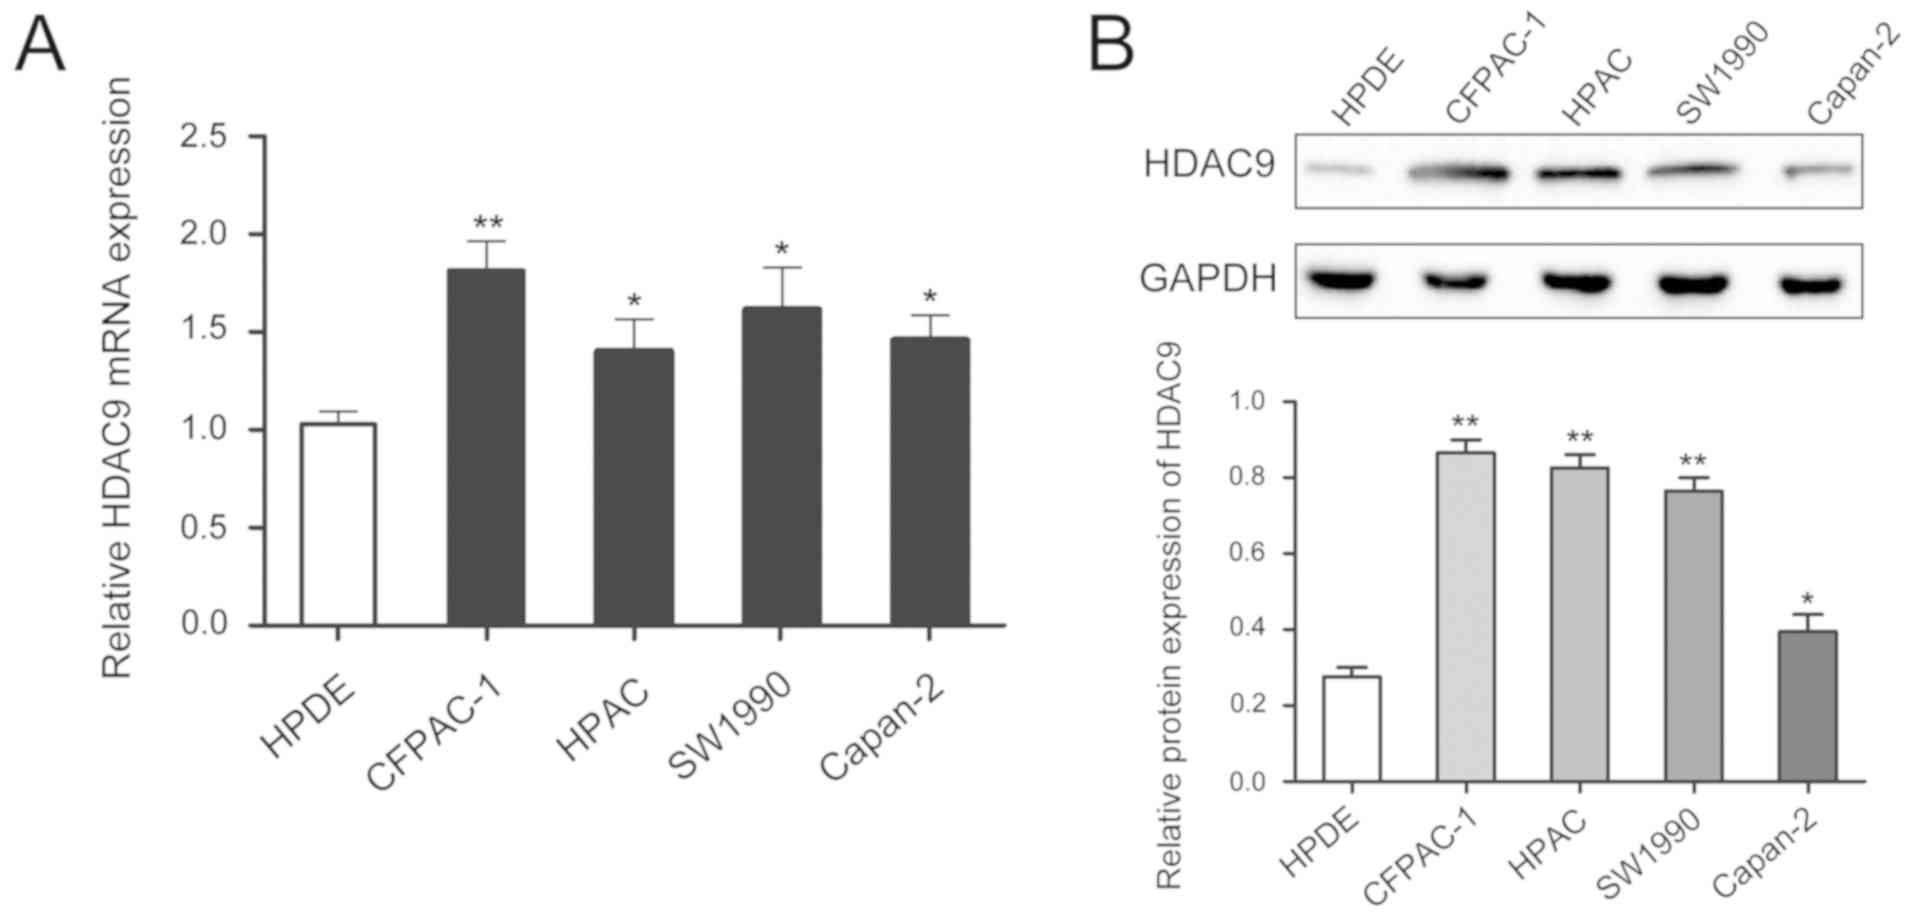
level of HDAC9 was higher in PDAC cell lines compared with a
pancreatic ductal epithelial cell line (Fig. 2).
HDAC9 is associated with
clinicopathological features of patients with PDAC
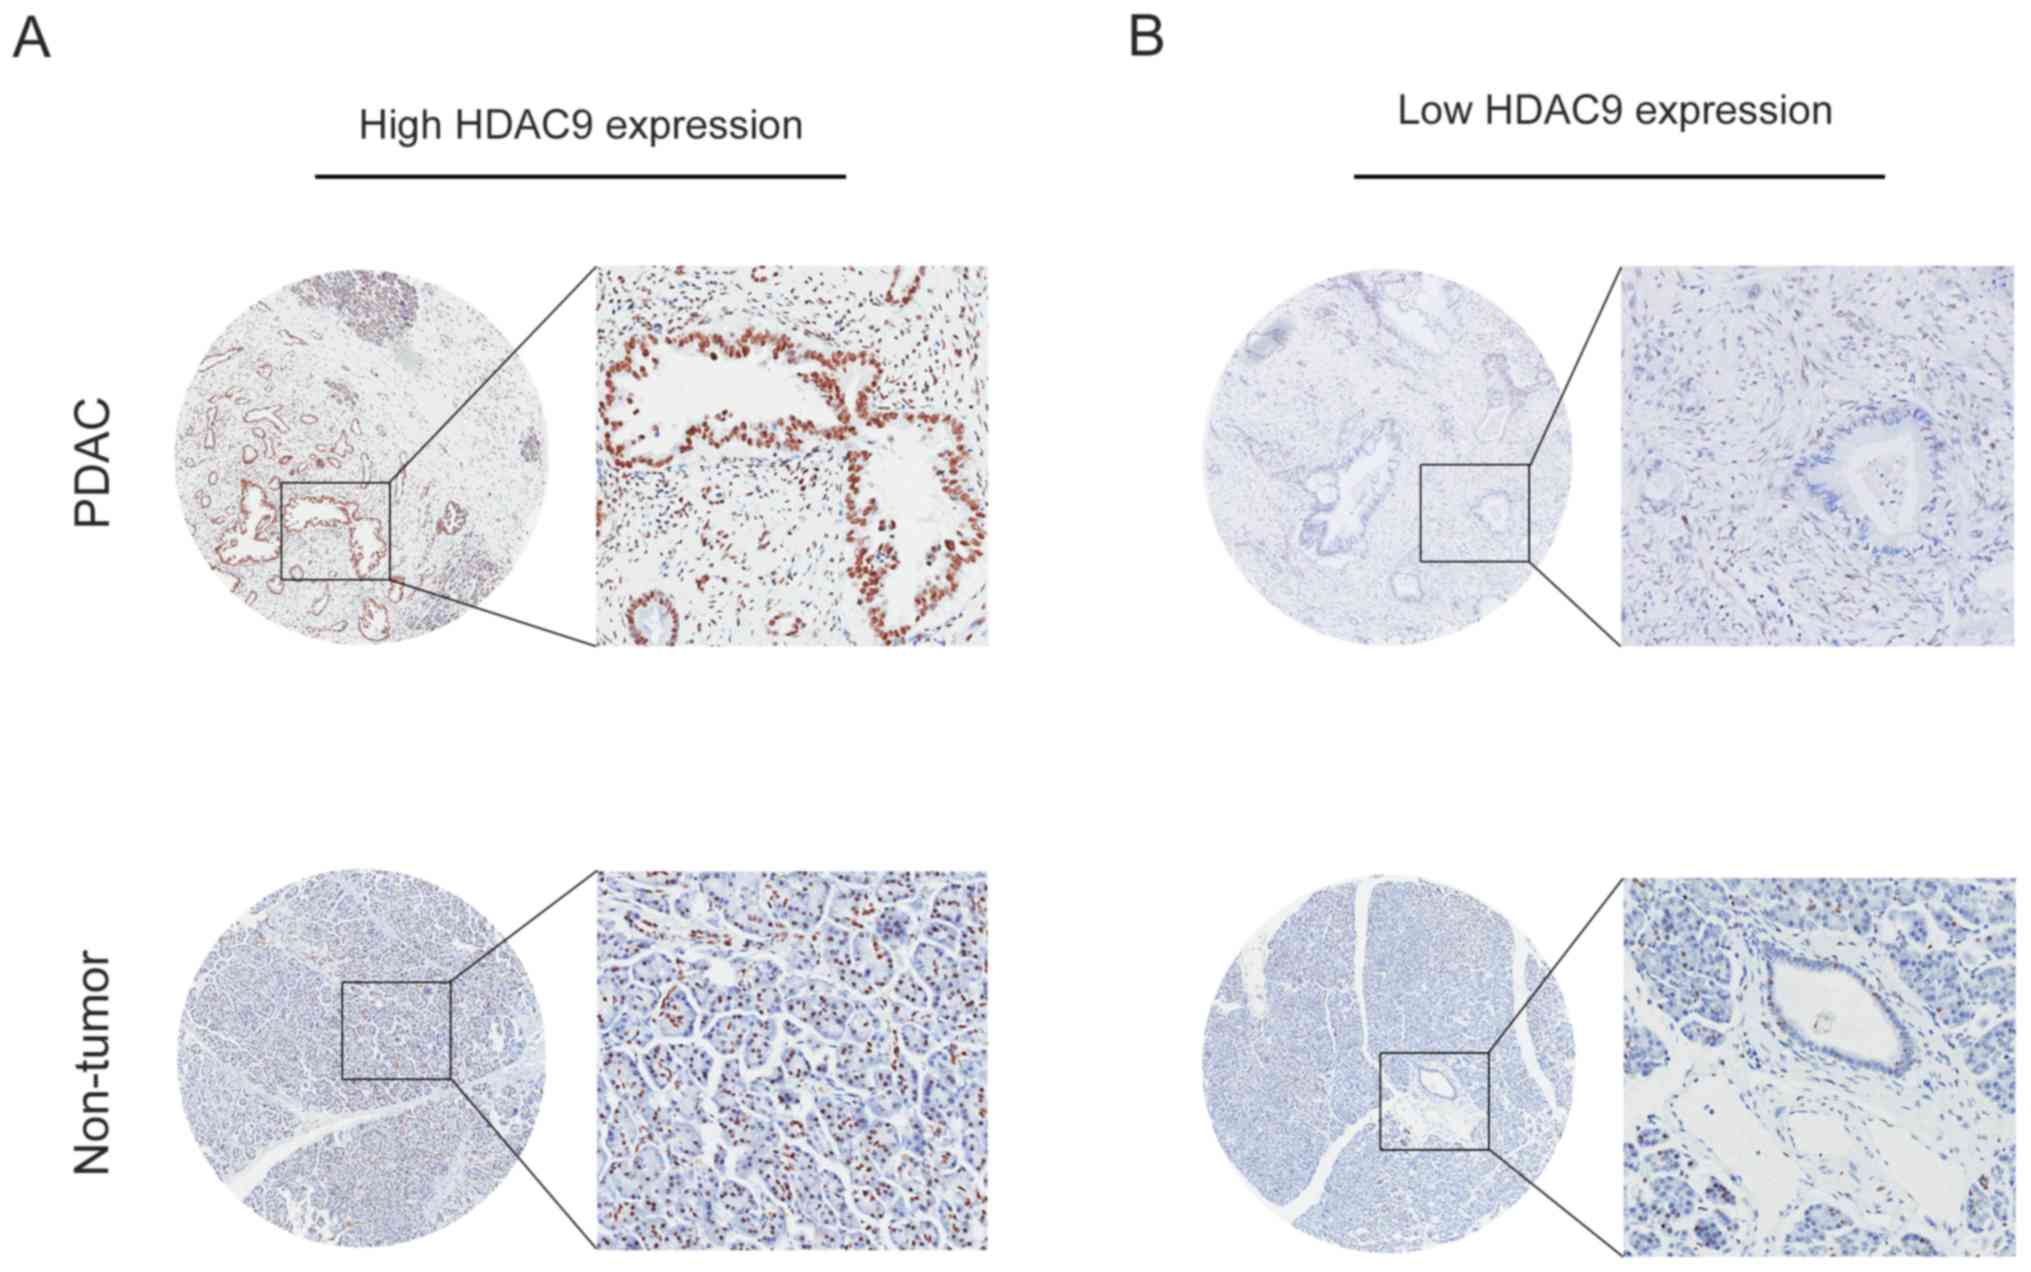
The expression level of HDAC9 in PDAC was analyzed
by IHC, and the results indicated that high HDAC9 expression was
observed in 64.0% of PDAC samples (62/97). Furthermore, positive
staining for HDAC9 was primarily localized in the nuclei of tumor
and normal pancreatic cells (Fig.
3).
The present study analyzed the association between
HDAC9 expression level and the clinicopathological characteristics
of patients with PDAC. High HDAC9 expression level was identified
to be positively associated with tumor size (P=0.026), T stage
(P=0.014) and N stage (P=0.004; Table
I). There was no significant association between HDAC9
expression level and age, sex, pathological grade, M stage,
clinical stage or diabetes.
 | Table I.Association of HDAC9 expression with
clinicopathological features of pancreatic ductal
adenocarcinoma. |
Table I.
Association of HDAC9 expression with
clinicopathological features of pancreatic ductal
adenocarcinoma.
|
|
| Histone deacetylase 9
expression |
|
|---|
|
|
|
|
|
|---|
| Variables | Cases | Low (n=35) | High (n=62) | P-value |
|---|
| Age, years |
|
|
| 0.295 |
|
<65 | 49 | 15 | 34 |
|
|
≥65 | 48 | 20 | 28 |
|
| Sex |
|
|
| 0.665 |
|
Male | 60 | 23 | 37 |
|
|
Female | 37 | 12 | 25 |
|
| Tumor size, cm |
|
|
| 0.026 |
| ≤5 | 74 | 22 | 52 |
|
|
>5 | 23 | 13 | 10 |
|
| Pathological
grade |
|
|
| 0.498 |
|
I–II | 66 | 22 | 44 |
|
|
III–IV | 31 | 13 | 18 |
|
| T stage |
|
|
| 0.014 |
| T1 | 14 | 10 | 4 |
|
| T2 | 64 | 15 | 49 |
|
| T3 | 19 | 10 | 9 |
|
| N stage |
|
|
| 0.004 |
| N0 | 36 | 20 | 16 |
|
| N1 | 61 | 15 | 46 |
|
| M stage |
|
|
| 0.551 |
| M0 | 94 | 35 | 59 |
|
| M1 | 3 | 0 | 3 |
|
| Clinical stage |
|
|
| 0.504 |
| 1 | 35 | 10 | 25 |
|
| 2 | 51 | 18 | 33 |
|
| 3 | 8 | 5 | 3 |
|
| 4 | 3 | 2 | 1 |
|
| Diabetes |
|
|
| 0.295 |
| No | 48 | 20 | 28 |
|
|
Yes | 49 | 15 | 34 |
|
Effect of HDAC9 expression on
recurrence-free survival (RFS) in PDAC
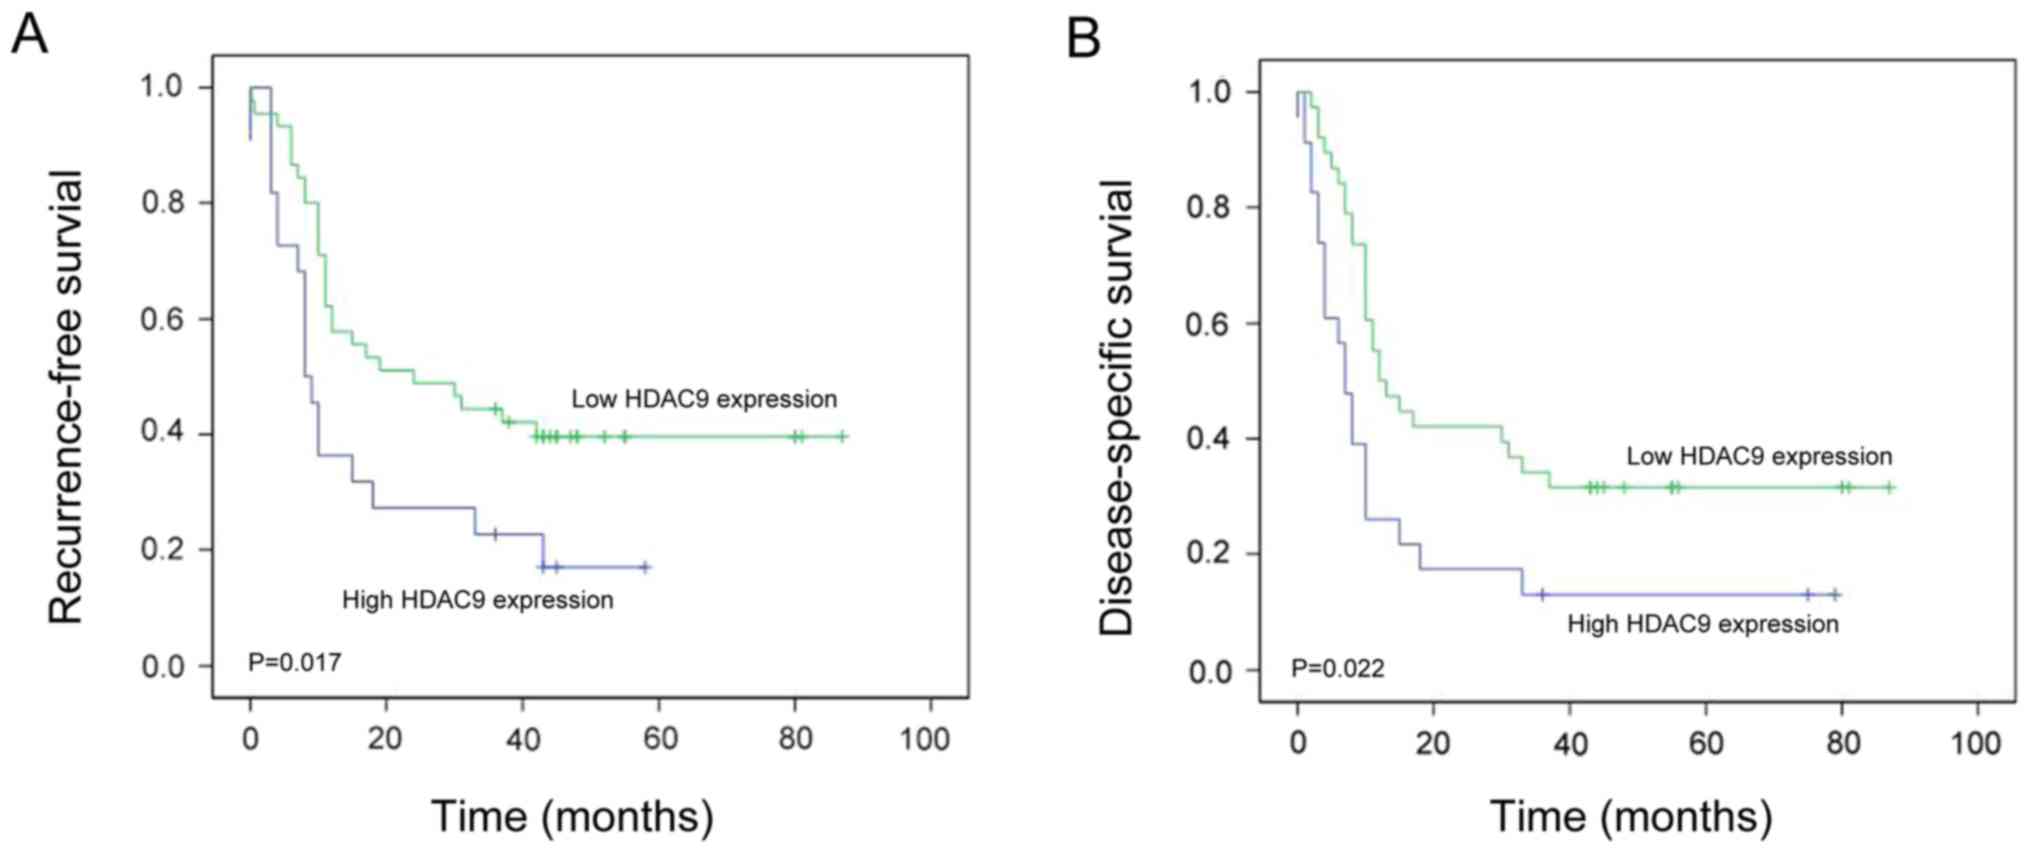
Kaplan-Meier survival analysis revealed that
patients with PDAC exhibiting high HDAC9 expression levels have
significantly shorter RFS compared with patients with low HDAC9
expression levels (P=0.017; Fig.
4A). To determine whether HDAC9 expression was an independent
predictive factor for RFS in PDAC, Cox proportional hazards
regression analysis was conducted. The univariate analysis
indicated that T stage (HR=1.684; P=0.029), N stage (HR=1.448;
P=0.013) and HDAC9 expression level (HR=1.647; P=0.018) were
significantly associated with RFS in PDAC (Table II). The multivariate analysis
suggested that T stage (HR=1.537; P=0.021), N stage (HR=1.597;
P=0.019) and HDAC9 expression (HR=1.739; P=0.011) were independent
prognostic factors for RFS in PDAC (Table II).
| Table II.Univariate and multivariate analysis
of different prognostic variables and recurrence-free survival in
pancreatic ductal adenocarcinoma. |
Table II.
Univariate and multivariate analysis
of different prognostic variables and recurrence-free survival in
pancreatic ductal adenocarcinoma.
|
|
| Univariate analysis
model | Multivariate
analysis model |
|---|
|
|
|
|
|
|---|
| Variables | n | HR (95% CI) | P-value | HR (95% CI) | P-value |
|---|
| Sex |
| 0.948
(0.540–1.684) | 0.308 |
|
|
|
Male | 60 |
|
|
|
|
|
Female | 37 |
|
|
|
|
| Age, years |
| 0.648
(0.608–1.840) | 0.584 |
|
|
|
<65 | 49 |
|
|
|
|
|
≥65 | 48 |
|
|
|
|
| Tumor size, cm |
| 0.608
(0.771–2.017) | 0.309 |
|
|
| ≤5 | 74 |
|
|
|
|
|
>5 | 23 |
|
|
|
|
| Pathological
grade |
| 1.308
(0.667–2.554) | 0.706 |
|
|
|
I/II | 66 |
|
|
|
|
|
III/IV | 31 |
|
|
|
|
| T stage |
| 1.684
(0.846–2.647) | 0.029 | 1.537
(0.647–2.394) | 0.021 |
| T1 | 14 |
|
|
|
|
| T2 | 64 |
|
|
|
|
| T3 | 19 |
|
|
|
|
| N stage |
| 1.448
(0.670–2.298) | 0.013 | 1.597
(0.849–2.937) | 0.019 |
| N0 | 36 |
|
|
|
|
| N1 | 61 |
|
|
|
|
| M stage |
| 1.075
(0.834–2.840) | 0.384 |
|
|
| M0 | 94 |
|
|
|
|
| M1 | 3 |
|
|
|
|
| Clinical stage |
| 0.572
(0.637–1.846) | 0.608 |
|
|
| 1 | 35 |
|
|
|
|
| 2 | 51 |
|
|
|
|
| 3 | 8 |
|
|
|
|
| 4 | 3 |
|
|
|
|
| Diabetes |
| 1.087
(1.557–2.947) | 0.284 |
|
|
|
Presence | 52 |
|
|
|
|
|
Absence | 53 |
|
|
|
|
| Histone deacetylase
9 expression |
| 1.647
(0.71–2.127) | 0.018 | 1.739
(1.067–3.337) | 0.011 |
|
High | 62 |
|
|
|
|
|
Low | 35 |
|
|
|
|
Effect of HDAC9 expression level on
disease-specific survival (DSS) in PDAC
Kaplan-Meier survival analysis revealed that
patients with PDAC exhibiting high HDAC9 expression levels had
significantly shorter DSS compared with those with low HDAC9
expression levels (P=0.022; Fig.
4B). The univariate analysis suggested that T stage (HR=1.509;
P=0.015), N stage (HR=1.493; P=0.025) and HDAC9 expression levels
(HR=1.210; P=0.010) were significantly associated with DSS in PDAC
(Table III). The multivariate
analysis indicated that T stage (HR=1.805; P=0.011), N stage
(HR=1.690; P=0.022) and HDAC9 expression levels (HR=1.394; P=0.008)
were independent prognostic factors for DSS in PDAC (Table III).
| Table III.Univariate and multivariate analysis
of different prognostic variables and disease-specific survival in
pancreatic ductal adenocarcinoma. |
Table III.
Univariate and multivariate analysis
of different prognostic variables and disease-specific survival in
pancreatic ductal adenocarcinoma.
|
|
| Univariate analysis
model | Multivariate
analysis model |
|---|
|
|
|
|
|
|---|
| Variables | n | HR (95% CI) | P-value | HR (95% CI) | P-value |
|---|
| Sex |
| 0.647
(0.428–1.553) | 0.648 |
|
|
|
Male | 60 |
|
|
|
|
|
Female | 37 |
|
|
|
|
| Age, years |
| 0.480
(0.571–1.669) | 0.806 |
|
|
|
<65 | 49 |
|
|
|
|
|
≥65 | 48 |
|
|
|
|
| Tumor size, cm |
| 0.940
(0.807–1.694) | 0.638 |
|
|
| ≤5 | 74 |
|
|
|
|
|
>5 | 23 |
|
|
|
|
| Pathological
grade |
| 1.249
(0.947–2.048) | 0.634 |
|
|
|
I/II | 66 |
|
|
|
|
|
III/IV | 31 |
|
|
|
|
| T stage |
| 1.509
(1.178–3.642) | 0.015 | 1.805
(1.049–2.648) | 0.011 |
| T1 | 14 |
|
|
|
|
| T2 | 64 |
|
|
|
|
| T3 | 19 |
|
|
|
|
| N stage |
| 1.493
(0.477–1.947) | 0.025 | 1.690
(0.644–2.684) | 0.022 |
| N0 | 36 |
|
|
|
|
| N1 | 61 |
|
|
|
|
| M stage |
| 0.948
(1.067–2.785) | 0.673 |
|
|
| M0 | 94 |
|
|
|
|
| M1 | 3 |
|
|
|
|
| Clinical stage |
| 1.545
(0.884–2.153) | 0.735 |
|
|
| 1 | 35 |
|
|
|
|
| 2 | 51 |
|
|
|
|
| 3 | 8 |
|
|
|
|
| 4 | 3 |
|
|
|
|
| Diabetes |
| 1.604
(1.241–3.517) | 0.570 |
|
|
|
Presence | 52 |
|
|
|
|
|
Absence | 53 |
|
|
|
|
| Histone deacetylase
9 expression |
| 1.210
(0.879–1.846) | 0.010 | 1.394
(0.957–2.047) | 0.008 |
|
High | 62 |
|
|
|
|
|
Low | 35 |
|
|
|
|
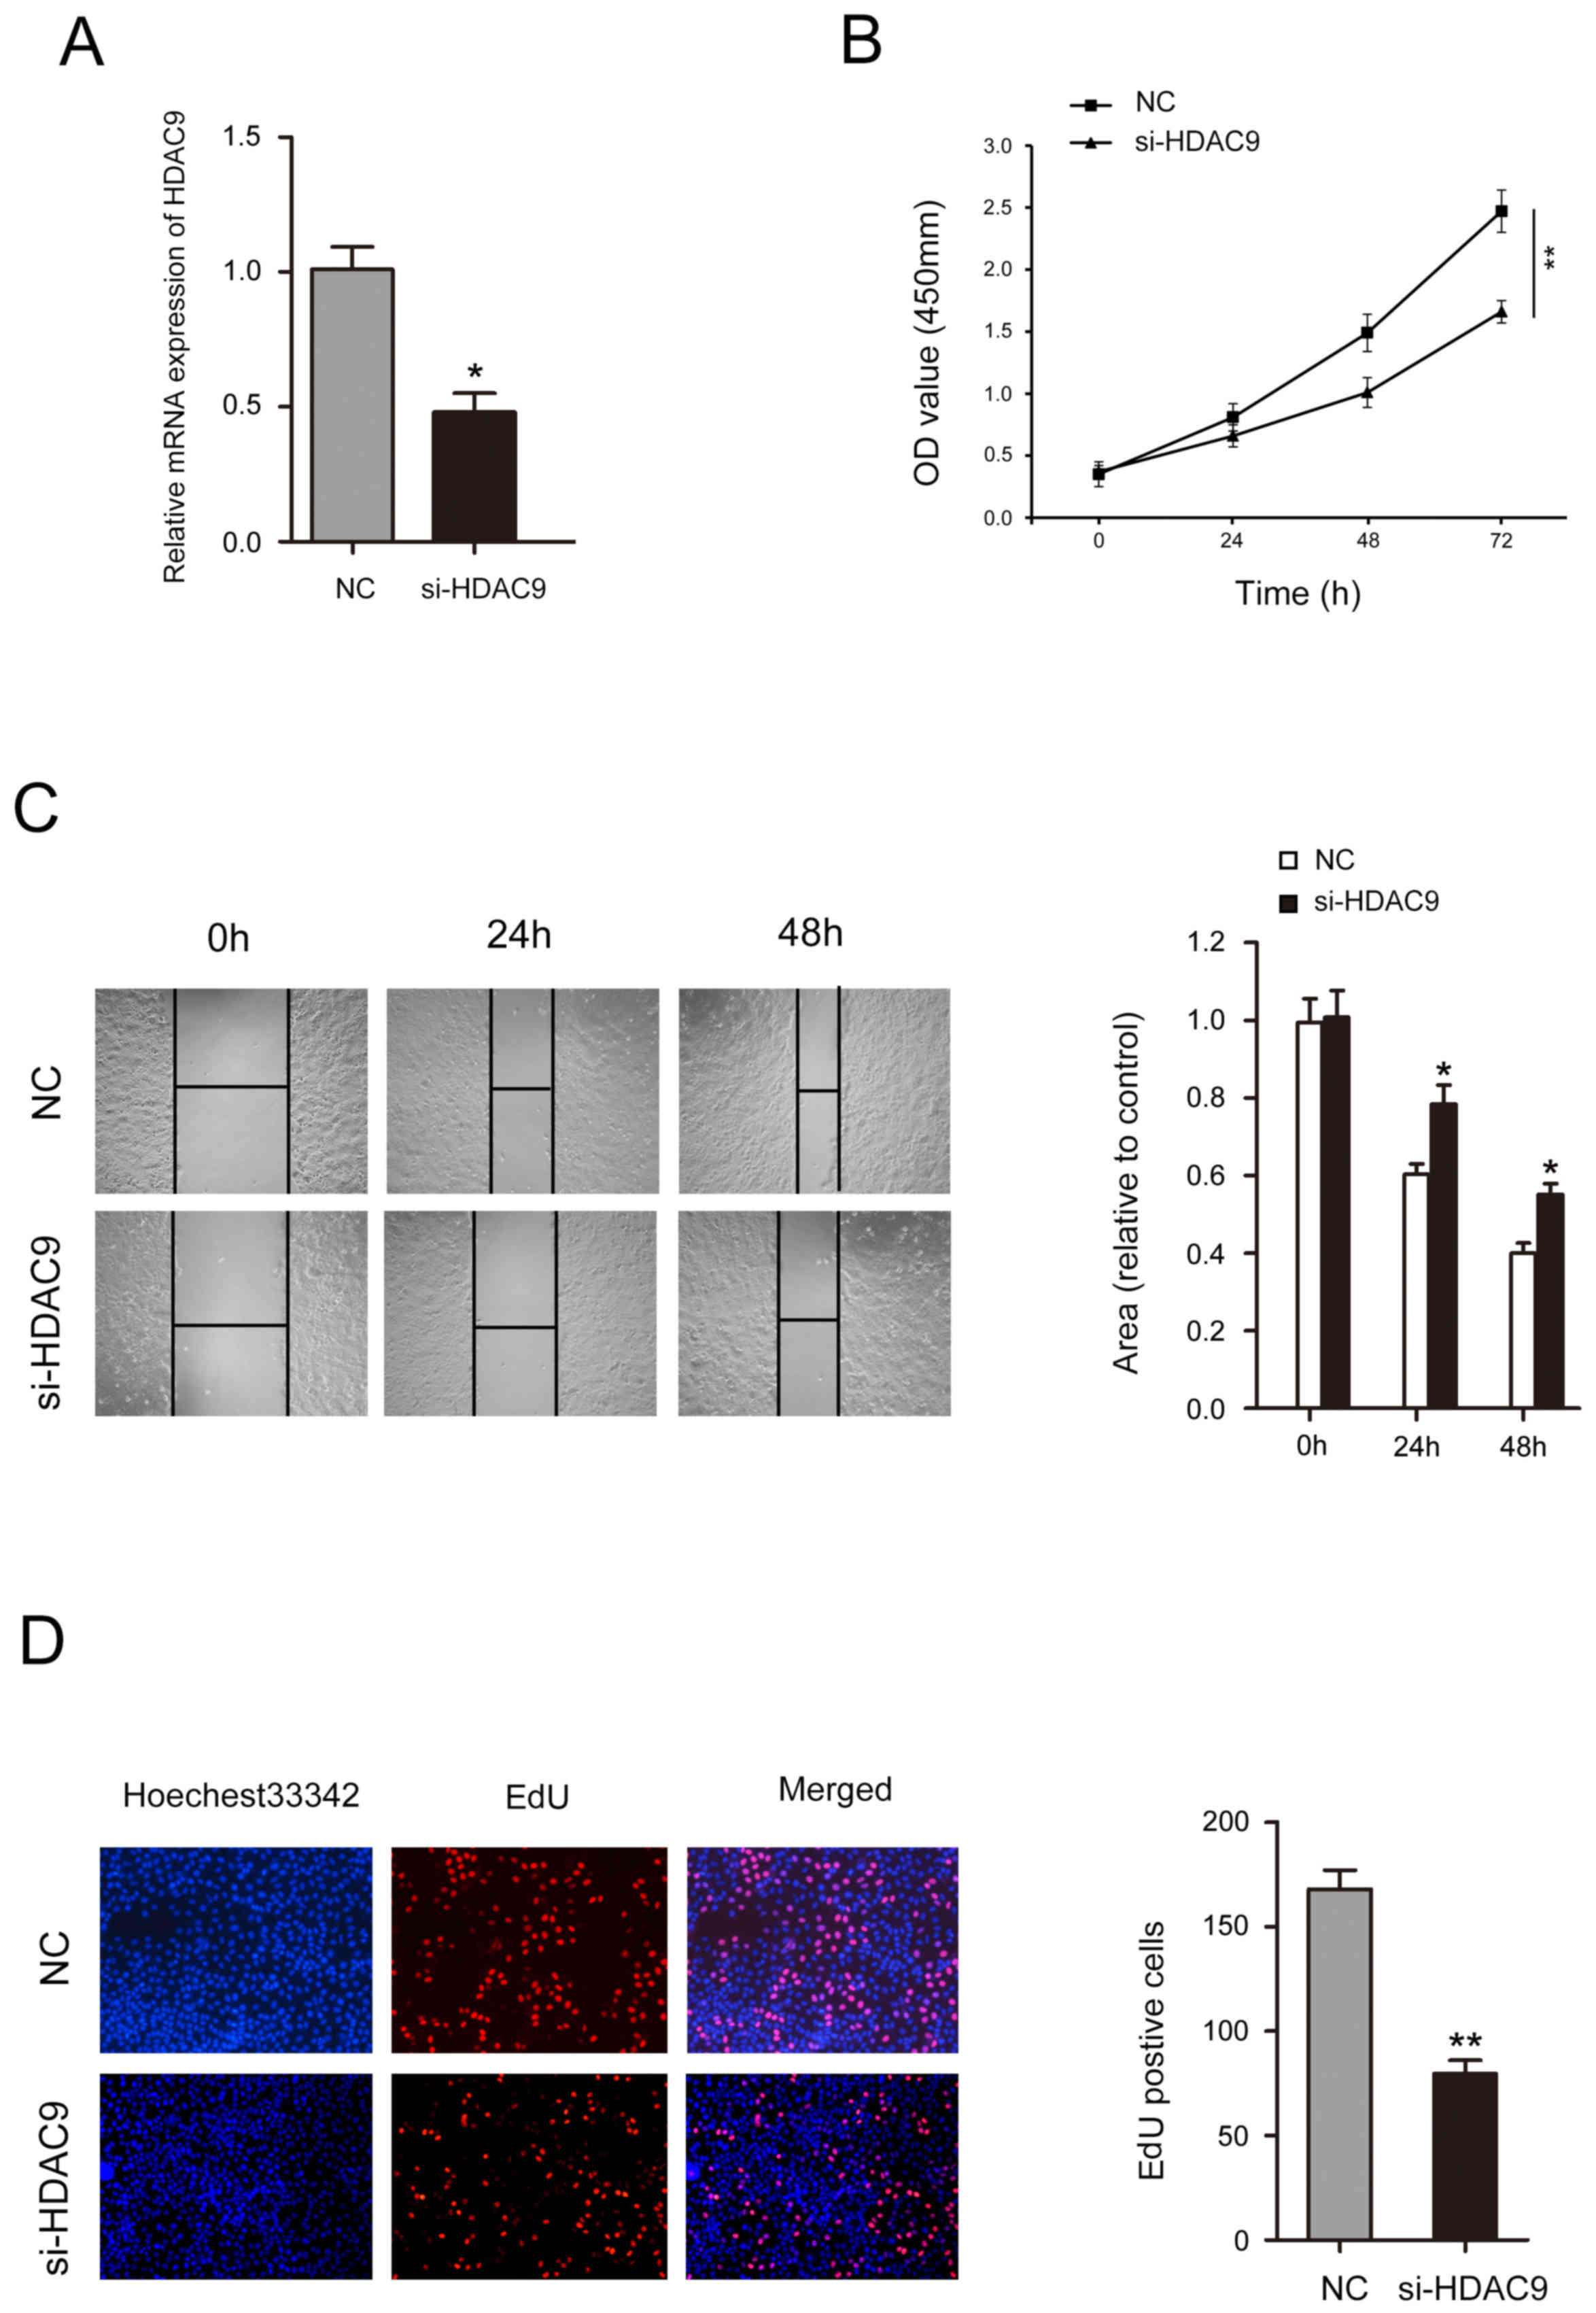
Decreased HDAC9 expression inhibits
the proliferation and migration of CFPAC-1 cells
After treatment with si-HDAC9, the expression level
of HDAC9 was significantly decreased (Fig. 5A). A CCK-8 assay identified that
decreased HDAC9 expression significantly inhibited cell
proliferation in CFPAC-1 cells (Fig.
5B). Wound healing assay results indicated that CFPAC-1 cell
mobility was significantly decreased following HDAC9 knockdown
(Fig. 5C). The number of CFPAC-1
cells incorporating EdU in the HDAC9 knockdown group was
significantly decreased compared with the control group (Fig. 5D).
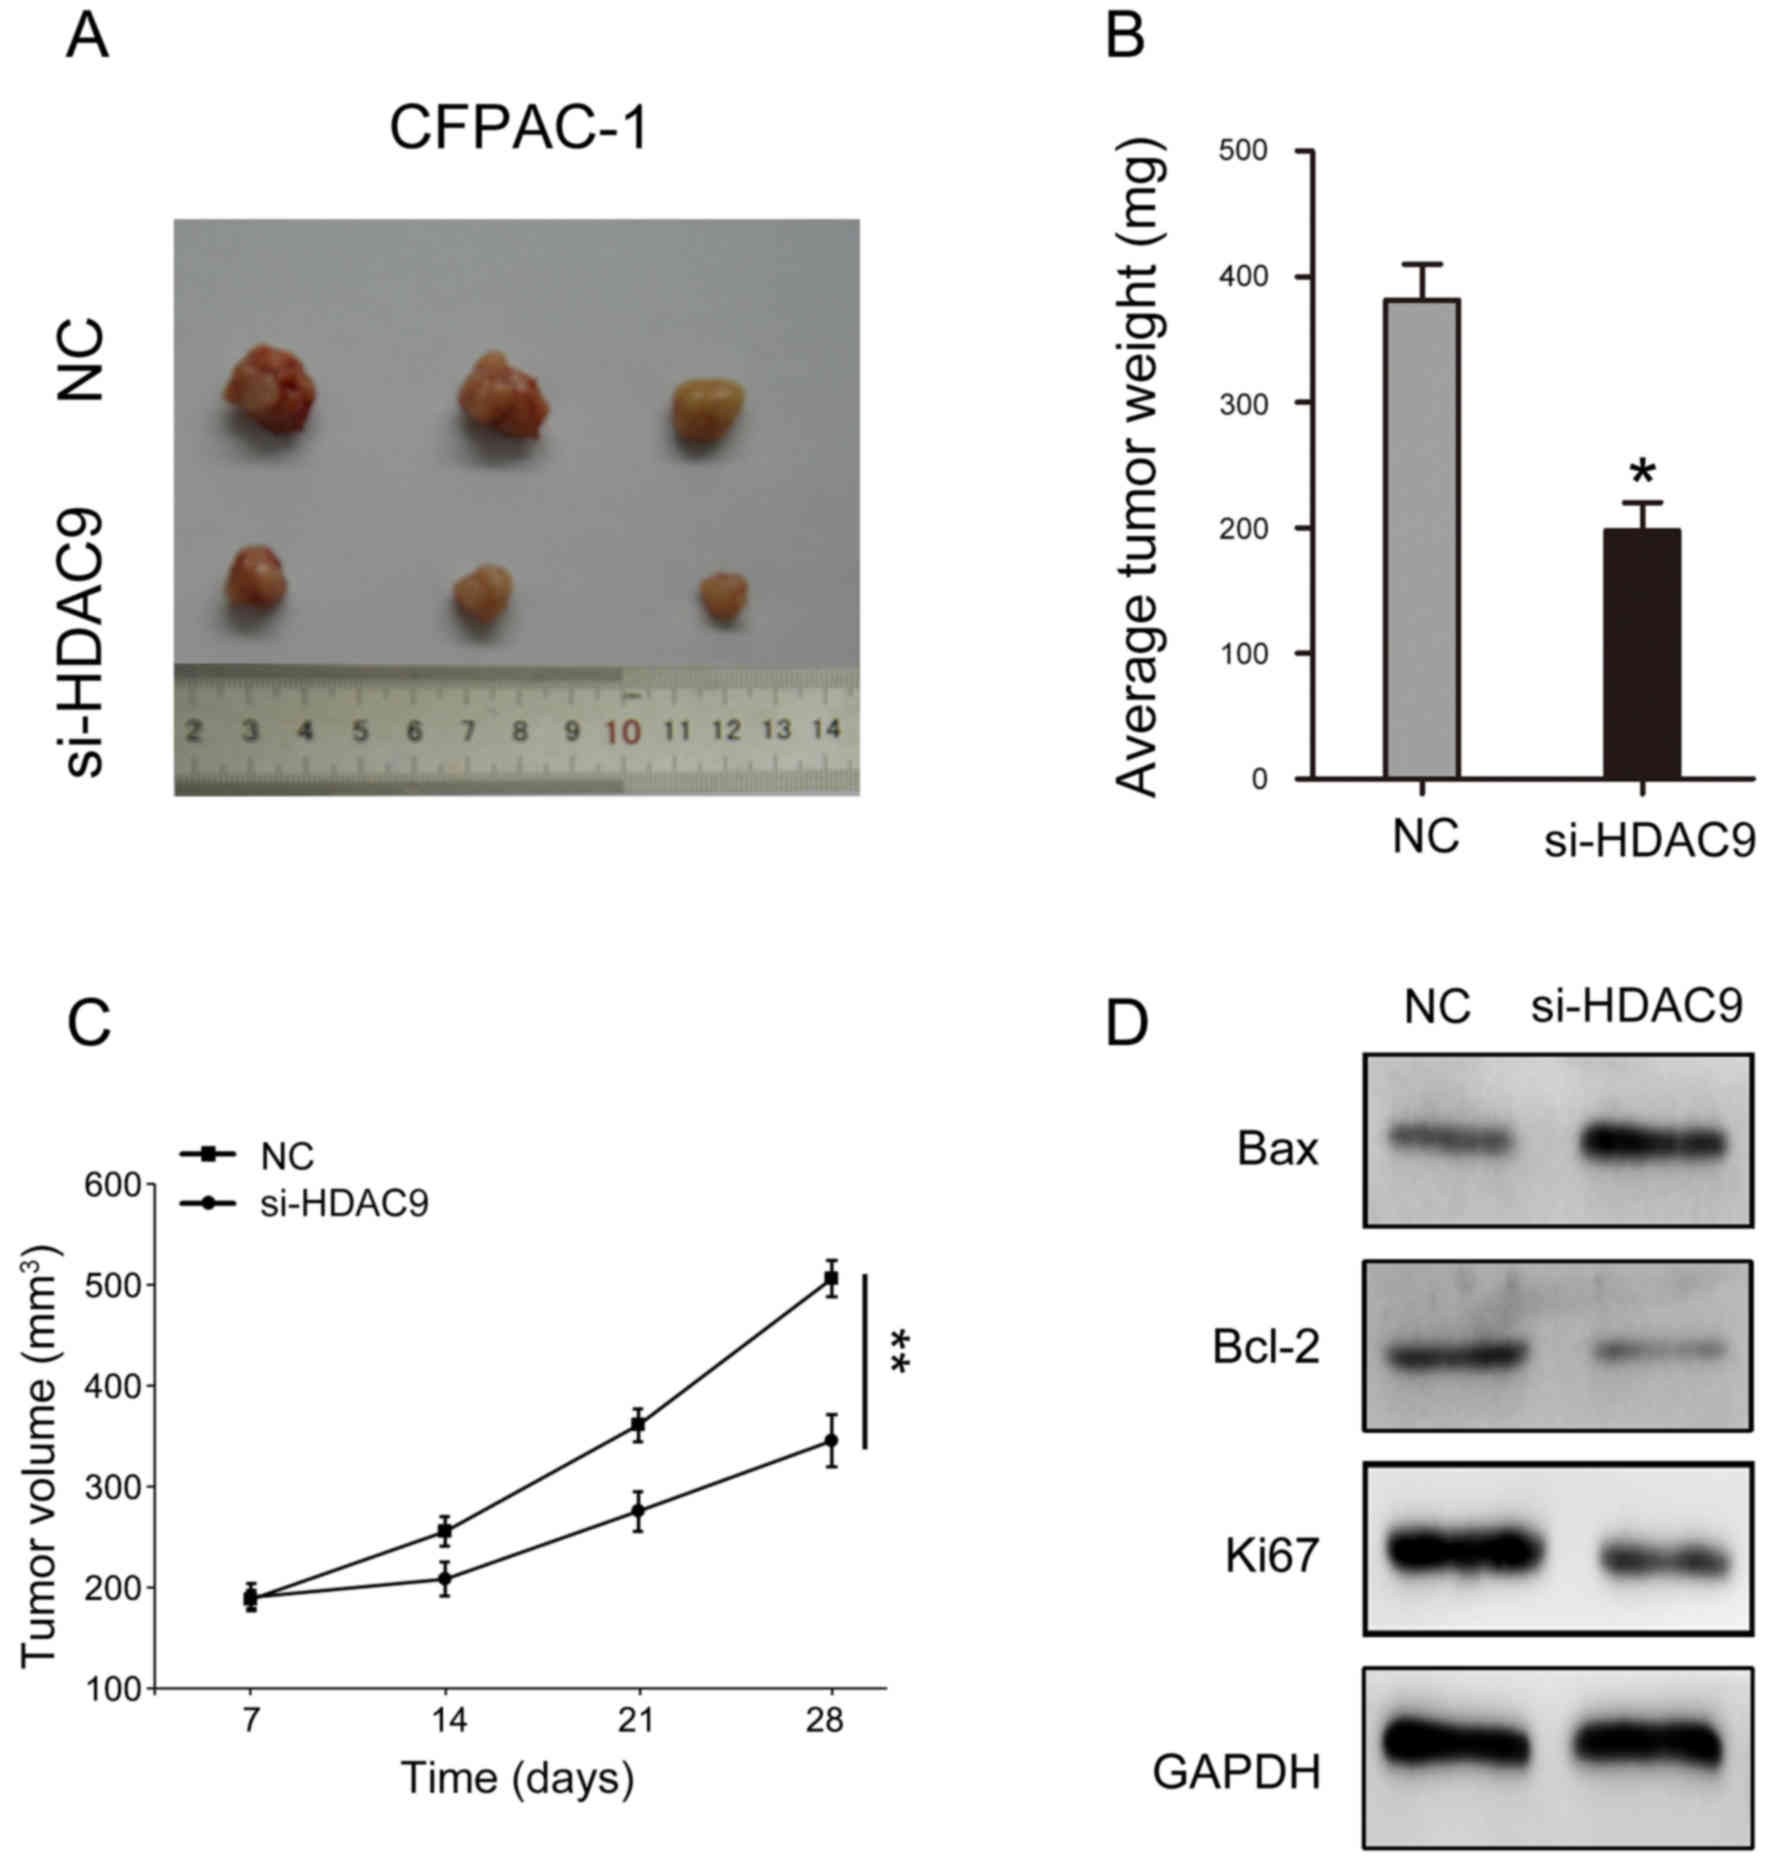
Decreased HDAC9 expression suppresses
tumorigenicity in PDAC
The present study investigated the influence of
HDAC9 in vivo. The results indicated that reducing the
expression of HDAC9 may significantly inhibit the volume and weight
of tumors formed by CFPAC-1 cells (Fig. 6A-C). In addition, key molecules
involved in cell proliferation and apoptosis were analyzed. The
present results suggested that HDAC9 silencing decreased Bcl-2 and
Ki67 expression levels, and increased Bax expression (Fig. 6D).
Discussion
HDACs are proteases that serve an important role in
the remodeling of chromatin structure and epigenetic regulation of
gene expression (20). HDACs can
repress transcription by deacetylating regulatory transcription
factors, and are involved in the development and progression of
various diseases, including cancer (10). As a class II HDAC, HDAC9 has been
studied in several malignancies, but its biological activities in
different tumors remain unclear (14). A previous study has shown that
HDAC9 is highly expressed in childhood acute lymphoblastic leukemia
and that its expression level is negatively associated with the
5-year disease-free survival of patients (21). The overexpression of HDAC9 in
breast cancer, retinoblastoma, medulloblastoma and oral squamous
cell carcinoma significantly promotes tumor cell proliferation and
reduces programmed cell death (9,22–24).
In contrast, a previous study of lung cancer found that the protein
expression levels of HDAC9 are markedly lower in lung cancer
compared with normal epithelial cells (25). This previous study also showed that
HDAC9 attenuates the growth of lung cancer cells in vitro
and may have tumor suppressor effects in lung cancer (25).
The role of HDAC9 in tumorigenesis is complex,
having dual roles in different malignancies (26). Previous studies have reported that
HDAC9 appears to be a pro-oncogenic factor in certain malignancies
including glioblastoma, leiomyosarcoma and rhabdoid sarcomas
(8,27,28).
However, HDAC9 appears to be a tumor suppressor in other cancer
types, such as non-small cell lung cancer (25). There have been few studies on the
role of HDAC9 in PDAC. To the best of our knowledge, the only study
on HDAC9 in PDAC showed that HDAC9 is highly expressed in subtypes
of PDAC with high microvessel density and endothelial cell
abundance (29); however, this
previous study only reported that the prognosis of patients with
high microvessel density was improved and did not investigate how
HDAC9 may influence these findings. The present study investigated
the expression of HDAC9 in PDAC and its effect on the malignant
progression of patients with PDAC. The present results suggested
that HDAC9 was highly expressed in PDAC, and patients with high
expression of HDAC9 had a worse prognosis. In addition, high
expression levels of HDAC9 were associated with tumor size, T stage
and N stage. Moreover, HDAC9 expression level and clinical stage
appeared to be independent risk factors for RFS and DSS in PDAC.
The present results indicated that silencing HDAC9 significantly
inhibited the proliferation and migration of PDAC cells. The
present study used si-HDAC9 to reduce the expression levels of
HDAC9. The present results suggested that after si-HDAC9
transfection, cell proliferation was inhibited at 48 h, and had a
significant effect on cell proliferation at 72 h. Moreover, in
vivo results suggested that key molecules Bax, Bcl-2 and Ki67,
which regulate cell proliferation and apoptosis, are affected by
HDAC9. Decreasing the expression level of HDAC9 can inhibit the
expression of Bcl-2 and Ki67, and promote the expression of Bax,
thereby inhibiting the proliferation and migration of pancreatic
cancer cells (30). Although the
present study has limitations, future research should investigate
the specific molecular mechanism of HDAC9 to understand the role of
HDAC9 in the malignant progression of PDAC.
In summary, the present study suggested that
expression levels of HDAC9 were higher in patients with PDAC. In
addition, HDAC9 may be associated with RFS and DSS in PDAC. The
present univariate and multivariate analysis suggested that high
HDAC9 expression level and clinical stage predicted poor prognosis,
and that HDAC9 expression level was an independent prognostic
factor for DSS in PDAC. Therefore, HDAC9 may serve as a new
diagnostic target and facilitate the treatment of PDAC.
Acknowledgements
Not applicable.
Funding
The present study was supported by the subject of
Yongchuan Hospital affiliated to Chongqing Medical University
(grant no. YJQN201422).
Availability of data and materials
The datasets used and/or analyzed during the present
study are available from the corresponding author on reasonable
request.
Authors' contributions
HL and JPG designed the study. HL and JPG conducted
the research. XCL and HPL collected and analyzed the data. HL, XCL
and HPL cultured cells, collected reference articles and wrote the
manuscript. All authors read and approved the final manuscript.
Ethics approval and consent to
participate
All patients provided informed consent and the study
was approved by the Ethics Committee of Chongqing Medical
University.
Patient consent for publication
Not applicable.
Competing interests
The authors declare that they have no competing
interests.
References
|
1
|
Adamska A, Elaskalani O, Emmanouilidi A,
Kim M, Abdol Razak NB, Metharom P and Falasca M: Molecular and
cellular mechanisms of chemoresistance in pancreatic cancer. Adv
Biol Regul. 68:77–87. 2018. View Article : Google Scholar : PubMed/NCBI
|
|
2
|
Kong F, Kong X, Du Y, Chen Y, Deng X, Zhu
J, Du J, Li L, Jia Z, Xie D, et al: STK33 promotes growth and
progression of pancreatic cancer as a critical downstream mediator
of HIF1a. Cancer Res. 77:6851–6862. 2017. View Article : Google Scholar : PubMed/NCBI
|
|
3
|
Raptis DA, Fessas C, Belasyse-Smith P and
Kurzawinski TR: Clinical presentation and waiting time targets do
not affect prognosis in patients with pancreatic cancer. Surgeon.
8:239–246. 2010. View Article : Google Scholar : PubMed/NCBI
|
|
4
|
Zhou B, Sun C, Hu X, Zhan H, Zou H, Feng
Y, Qiu F, Zhang S, Wu L and Zhang B: MicroRNA-195 suppresses the
progression of pancreatic cancer by targeting DCLK1. Cell Physiol
Biochem. 44:1867–1881. 2017. View Article : Google Scholar : PubMed/NCBI
|
|
5
|
Garrido-Laguna I and Hidalgo M: Pancreatic
cancer: From state-of-the-art treatments to promising novel
therapies. Nat Rev Clin Oncol. 12:319–334. 2015. View Article : Google Scholar : PubMed/NCBI
|
|
6
|
Adamska A, Domenichini A and Falasca M:
Pancreatic ductal adenocarcinoma: Current and evolving therapies.
Int J Mol Sci. 18(pii): E13382017. View Article : Google Scholar : PubMed/NCBI
|
|
7
|
de Ruijter AJ, van Gennip AH, Caron HN,
Kemp S and van Kuilenburg AB: Histone deacetylases (HDACs):
Characterization of the classical HDAC family. Biochem J.
370:737–749. 2003. View Article : Google Scholar : PubMed/NCBI
|
|
8
|
Yang R, Wu Y, Wang M, Sun Z, Zou J, Zhang
Y and Cui H: HDAC9 promotes glioblastoma growth via TAZ-mediated
EGFR pathway activation. Oncotarget. 6:7644–7656. 2015.PubMed/NCBI
|
|
9
|
Zhang Y, Wu D, Xia F, Xian H, Zhu X, Cui H
and Huang Z: Downregulation of HDAC9 inhibits cell proliferation
and tumor formation by inducing cell cycle arrest in
retinoblastoma. Biochem Biophys Res Commun. 473:600–606. 2016.
View Article : Google Scholar : PubMed/NCBI
|
|
10
|
Rastogi B, Raut SK, Panda NK, Rattan V,
Radotra BD and Khullar M: Overexpression of HDAC9 promotes oral
squamous cell carcinoma growth, regulates cell cycle progression,
and inhibits apoptosis. Mol Cell Biochem. 415:183–196. 2016.
View Article : Google Scholar : PubMed/NCBI
|
|
11
|
Lakshmaiah KC, Jacob LA, Aparna S,
Lokanatha D and Saldanha SC: Epigenetic therapy of cancer with
histone deacetylase inhibitors. J Cancer Res Ther. 10:469–478.
2014.PubMed/NCBI
|
|
12
|
Wang Y, Wallach J, Duane S, Wang Y, Wu J,
Wang J, Adejare A and Ma H: Developing selective histone
deacetylases (HDACs) inhibitors through ebselen and analogs. Drug
Des Devel Ther. 11:1369–1382. 2017. View Article : Google Scholar : PubMed/NCBI
|
|
13
|
Yuan Z, Peng L, Radhakrishnan R and Seto
E: Histone deacetylase 9 (HDAC9) regulates the functions of the
ATDC (TRIM29) protein. J Biol Chem. 285:39329–39338. 2010.
View Article : Google Scholar : PubMed/NCBI
|
|
14
|
Petrie K, Guidez F, Howell L, Healy L,
Waxman S, Greaves M and Zelent A: The histone deacetylase 9 gene
encodes multiple protein isoforms. J Biol Chem. 278:16059–16072.
2003. View Article : Google Scholar : PubMed/NCBI
|
|
15
|
Salgado E, Bian X, Feng A, Shim H and
Liang Z: HDAC9 overexpression confers invasive and angiogenic
potential to triple negative breast cancer cells via modulating
microRNA-206. Biochem Biophys Res Commun. 503:1087–1091. 2018.
View Article : Google Scholar : PubMed/NCBI
|
|
16
|
Jin Q, He W, Chen L, Yang Y, Shi K and You
Z: MicroRNA-101-3p inhibits proliferation in retinoblastoma cells
by targeting EZH2 and HDAC9. Exp Ther Med. 16:1663–1670.
2018.PubMed/NCBI
|
|
17
|
Edge SB and Compton CC: The American Joint
Committee on Cancer: The 7th edition of the AJCC cancer staging
manual and the future of TNM. Ann Surg Oncol. 17:1471–1474. 2010.
View Article : Google Scholar : PubMed/NCBI
|
|
18
|
Livak KJ and Schmittgen TD: Analysis of
relative gene expression data using real-time quantitative PCR and
the 2(-Delta Delta C(T)) method. Methods. 25:402–408. 2001.
View Article : Google Scholar : PubMed/NCBI
|
|
19
|
Camp RL, Dolled-Filhart M and Rimm DL:
X-tile: A new bio-informatics tool for biomarker assessment and
outcome-based cut-point optimization. Clin Cancer Res.
10:7252–7259. 2004. View Article : Google Scholar : PubMed/NCBI
|
|
20
|
Weichert W, Röske A, Gekeler V, Beckers T,
Ebert MP, Pross M, Dietel M, Denkert C and Röcken C: Association of
patterns of class I histone deacetylase expression with patient
prognosis in gastric cancer: A retrospective analysis. Lancet
Oncol. 9:139–148. 2008. View Article : Google Scholar : PubMed/NCBI
|
|
21
|
Moreno DA, Scrideli CA, Cortez MA, de
Paula Queiroz R, Valera ET, da Silva Silveira V, Yunes JA,
Brandalise SR and Tone LG: Differential expression of HDAC3, HDAC7
and HDAC9 is associated with prognosis and survival in childhood
acute lymphoblastic leukaemia. Br J Haematol. 150:665–673. 2010.
View Article : Google Scholar : PubMed/NCBI
|
|
22
|
Lapierre M, Linares A, Dalvai M,
Duraffourd C, Bonnet S, Boulahtouf A, Rodriguez C, Jalaguier S,
Assou S, Orsetti B, et al: Histone deacetylase 9 regulates breast
cancer cell proliferation and the response to histone deacetylase
inhibitors. Oncotarget. 7:19693–19708. 2016. View Article : Google Scholar : PubMed/NCBI
|
|
23
|
Milde T, Oehme I, Korshunov A,
Kopp-Schneider A, Remke M, Northcott P, Deubzer HE, Lodrini M,
Taylor MD, von Deimling A, et al: HDAC5 and HDAC9 in
medulloblastoma: Novel markers for risk stratification and role in
tumor cell growth. Clin Cancer Res. 16:3240–3252. 2010. View Article : Google Scholar : PubMed/NCBI
|
|
24
|
Cha JD, Kim HJ and Cha IH: Genetic
alterations in oral squamous cell carcinoma progression detected by
combining array-based comparative genomic hybridization and
multiplex ligation-dependent probe amplification. Oral Surg Oral
Med Oral Pathol Oral Radiol Endod. 111:594–607. 2011. View Article : Google Scholar : PubMed/NCBI
|
|
25
|
Okudela K, Mitsui H, Suzuki T, Woo T,
Tateishi Y, Umeda S, Saito Y, Tajiri M, Masuda M and Ohashi K:
Expression of HDAC9 in lung cancer-potential role in lung
carcinogenesis. Int J Clin Exp Pathol. 7:213–220. 2014.PubMed/NCBI
|
|
26
|
Gore J, Craven KE, Wilson JL, Cote GA,
Cheng M, Nguyen HV, Cramer HM, Sherman S and Korc M: TCGA data and
patient-derived orthotopic xenografts highlight pancreatic
cancer-associated angiogenesis. Oncotarget. 6:7504–7521. 2015.
View Article : Google Scholar : PubMed/NCBI
|
|
27
|
Di Giorgio E, Franforte E, Cefalu S, Rossi
S, Dei Tos AP, Brenca M, Polano M, Maestro R, Paluvai H, Picco R
and Brancolini C: The co-existence of transcriptional activator and
transcriptional repressor MEF2 complexes influences tumor
aggressiveness. PLoS Genet. 13:e10067522017. View Article : Google Scholar : PubMed/NCBI
|
|
28
|
Kahali B, Yu J, Marquez SB, Thompson KW,
Liang SY, Lu L and Reisman D: The silencing of the SWI/SNF subunit
and anticancer gene BRM in Rhabdoid tumors. Oncotarget.
5:3316–3332. 2014. View Article : Google Scholar : PubMed/NCBI
|
|
29
|
Craven KE, Gore J, Wilson JL and Korc M:
Angiogenic gene signature in human pancreatic cancer correlates
with TGF-beta and inflammatory transcriptomes. Oncotarget.
7:323–341. 2016. View Article : Google Scholar : PubMed/NCBI
|
|
30
|
Du H, Xu Q, Xiao S, Wu Z, Gong J, Liu C,
Ren G and Wu H: MicroRNA-424-5p acts as a potential biomarker and
inhibits proliferation and invasion in hepatocellular carcinoma by
targeting TRIM29. Life Sci. 224:1–11. 2019. View Article : Google Scholar : PubMed/NCBI
|