Introduction
As the most frequently diagnosed fatty liver disease
in developed countries, non-alcoholic fatty liver disease (NAFLD)
occurs when fat is enriched in the liver due to non-alcoholic
factors (1,2). The risk factors for NAFLD include
metabolic syndromes, for example combined hyperlipidemia, obesity,
high blood pressure and type II diabetes mellitus and insulin
resistance (3,4). Non-alcoholic steatohepatitis (NASH),
which is the most severe type of NAFLD, is considered to be the
primary cause of cirrhosis (4).
The incidence of NAFLD is 9–36.9% globally (5,6), and
~20% of people in the United States of America (75–100 million
people) are affected by the disease (7). Therefore, exploring the pathogenic
mechanisms of NAFLD and developing novel treatment protocols are
necessary.
Silencing of fatty acid transport protein 5 (FATP5)
may reverse NAFLD; therefore, the activity of hepatic FATP5 is
considered critical for maintaining fatty acid flux and caloric
uptake during high-fat feeding (8). Patatin-like phospholipase domain
containing 3 is an NAFLD-associated gene, which is closely
associated with metabolic changes in hepatocytes and lipogenesis
(9,10). Interleukin-17 is associated with
the proinflammatory response and hepatic steatosis in NAFLD and
contributes to the steatosis-steatohepatitis transition (11). Several microRNAs (miRNAs),
including miR-21, miR-122, miR-451 and miR-34a, are overexpressed
in patients with NAFLD; in particular, miR-122 levels are
associated with the grades of fatty liver disease and are a
potential marker of NAFLD (12).
By inhibiting the expression of
3-hydroxy-3-methylglutaryl-co-enzyme A reductase, miR-21 was
demonstrated to mediate cholesterol and triglyceride metabolism in
an NAFLD model and may be a promising diagnostic and therapeutic
marker for the disease (13).
miR-34a/Sirtuin 1/tumor protein p53 (p53) signaling, which is
correlated with liver cell apoptosis, is inhibited by
ursodeoxycholic acid and activated upon the aggravation of illness
in NAFLD (14). Despite these
studies, the molecular mechanisms of NAFLD are not fully
understood.
In 2015, Sun et al (15) investigated the role of long
non-coding RNAs (lncRNAs) in NAFLD through microarray data analysis
and identified that several differentially expressed lncRNAs
(DE-lncRNAs) function in the pathogenesis of NAFLD. However, the
molecular regulatory mechanisms in NAFLD have not been explored in
detail. Based on the expression profiles deposited by Sun et
al (15), the present study
additionally identified the DE-lncRNAs and differentially expressed
mRNAs (DE-mRNAs) between NAFLD and normal liver tissues. In
addition, key mRNAs, lncRNAs and miRNAs involved in NAFLD were also
identified through protein-protein interaction (PPI) network,
enrichment and miRNA-lncRNA-mRNA interaction network analyses. The
expression of key RNAs were detected by reverse transcription
quantitative polymerase chain reaction (RT-qPCR).
Materials and methods
Data source
The normalized expression data and annotation data
from the GSE72756 dataset were acquired from the Gene Expression
Omnibus (GEO) database (http://www.ncbi.nlm.nih.gov/geo/), which was generated
using a GPL16956 Agilent-045997 Arraystar human lncRNA microarray
V3 (Probe Name Version) platform. The sample set of GSE72756
included 5 NAFLD liver tissues (3 females and 2 males; mean
age=38.8 years) and 5 normal liver tissues (3 females and 2 males;
mean age=39.2 years). Samples used in this dataset were sourced
from patients with NAFLD without other metabolic complications that
were hospitalized in The Third Xiangya Hospital (Changsha, China)
from March 2014 to November 2014, and NAFLD was confirmed
independently by two senior pathologists by pathological
examination. Liver tissues (50–100 mg) were isolated from the
patients and then rapidly frozen in liquid nitrogen. Sun et
al (15) deposited the
microarray dataset GSE72756, and the study was approved by the
Ethics Committee of the Third Xiangya Hospital of Central South
University. Informed consent was obtained from all patients.
Differential expression analysis
Based on the normalized probe expression data, the R
package in Linear Models for Microarray Data (16) (http://www.bioconductor.org/packages/2.9/bioc/html/limma.html)
was utilized to identify and annotate the differentially expressed
probes between NAFLD and normal liver tissues. A false discovery
rate (FDR; adjusted P-value) <0.01 and |log fold-change
(FC)|>1 were set as thresholds. Using the R package pheatmap
(17) (http://cran.r-project.org/web/packages/pheatmap/index.html),
a clustering heatmap was drawn for differentially expressed probes.
According to the annotation information, the differentially
expressed probes were divided into DE-lncRNAs and DE-mRNAs.
Enrichment analysis and PPI network
analysis of DE-mRNAs
Using the R package clusterProfiler (18) (http://bioconductor.org/packages/release/bioc/html/clusterProfiler.html),
Gene Ontology (GO; http://www.geneontology.org) (19) functional and Kyoto Encyclopedia of
Genes and Genomes (KEGG; http://www.genome.ad.jp/kegg) (20) pathway enrichment analyses were
performed for the DE-mRNAs. The terms with FDR <0.05 were
considered to be significant. Based on the Search Tool for the
Retrieval of Interacting Genes (http://www.string-db.org/) (21) database, the interaction pairs among
the DE-mRNAs were predicted with the threshold of required
confidence >0.4. The PPI network was constructed using Cytoscape
software (version 3.0.1, http://www.cytoscape.org) (22). Using the CytoNCA plugin (http://apps.cytoscape.org/apps/cytonca)
(23) in Cytoscape, Closeness
centrality (CC) (24), Degree
Centrality (DC) (25), and
Betweenness centrality (BC) (26)
scores were calculated. The nodes with increased CC, DC and BC
scores compared with other nodes were identified as hub nodes
(27) in the PPI network.
Construction of the lncRNA-mRNA
regulatory network and functional prediction of DE-lncRNAs
Based on the Pearson product-moment correlation
coefficient (28), the target
genes of upregulated and downregulated lncRNAs were predicted using
a threshold of FDR <0.05 and correlation coefficient >0.995.
Next, Cytoscape software (22) was
utilized to draw lncRNA-mRNA regulatory networks. Additionally,
enrichment analysis was conducted for the target genes of each
DE-lncRNA using FDR <0.05 as a threshold. Using the R package
clusterProfiler (18), the
enriched pathways were compared to identify the significant
pathways of target genes for each DE-lncRNA. An FDR <0.05 was
used as the cut-off criterion.
Construction of miRNA-lncRNA-mRNA
interaction network
Combined with the WEB-based gene set analysis
toolkit (Webgestalt; http://www.webgestalt.org) (29), the miRNAs targeting DE-mRNAs
involved in the PPI network were predicted. A count (number of
target genes) ≥4 and FDR <0.05 were set as the thresholds.
According to the annotation information of the DE-lncRNAs, their
corresponding sequences were extracted from human reference genome
hg19 (30). The mature sequences
of the predicted miRNAs were downloaded from the miRbase database
(http://www.mirbase.org/) (31). Using MiRanda (http://www.microrna.org) (32) and RNAhybrid (http://bibiserv.techfak.uni-bielefeld.de/rnahybrid/)
(33) software, lncRNAs containing
significant binding sites for the aforementioned miRNAs were
predicted. The predicted results of the miRanda and RNAhybrid
analyses were compared to obtain the intersecting miRNA-lncRNA
pairs. Based on the obtained miRNA-lncRNA and miRNA-mRNA pairs, and
the associated lncRNA-mRNA and mRNA-mRNA pairs, an
miRNA-lncRNA-mRNA interaction network was constructed and subjected
to topological property analysis using Cytoscape software.
Sample information and RT-qPCR
A total of 2 normal liver tissues (2 females; age
range: 47–60 years; mean age=53.5 years; obtained from March to
June 2017 via surgical resection) and 2 NAFLD liver tissues (2
males; age range: 41–47 years; mean age=44 years; obtained from
April to May 2017 via surgical resection) were provided by Nanjing
First Hospital (Nanjing, China). The present study was approved by
the Ethics Committee of Nanjing First Hospital. Informed consent
was obtained from all patients.
Using TRIzol® reagent (Thermo Fisher
Scientific, Inc., Waltham, MA, USA), total RNA was extracted from
the samples. The PrimeScript RT Master MIX kit (Takara Bio, Inc.,
Otsu, Japan) was used to synthesize first-strand cDNA. RT-qPCR was
performed using Power SYBR Green PCR Master Mix (cat. no., 4367659;
Thermo Fisher Scientific, Inc.) on an ABI 7500 FAST real-time PCR
system (Applied Biosystems; Thermo Fisher Scientific, Inc.). The
thermocycler conditions for qPCR were as follows: Initial
denaturation (50°C, 3 min); 40 cycles of denaturation (95°C, 3
min), annealing (95°C, 10 sec), and extension (60°C, 30 sec). The
specificity of the primer amplicons was examined by melting curve
analysis. The comparative Cq method (34) was employed to quantify target mRNA
and miRNA expression. mRNA expression was normalized to that of
GAPDH. The primers used in the present study were as follows:
GAPDH-forward (F)-5′-TGACAACTTTGGTATCGTGGAAGG-3′; GAPDH-reverse
(R)-5′-AGGCAGGGATGATGTTCTGGAGAG-3′;
RP11-279F6.1-h-F-5′-CGGACATAGCCAACGCACCT-3′;
RP11-279F6.1-R-5′-TTCATACTTCTGCTGCGTCCA-3′;
AC004540.4-F-5′-TTCACAACACACTCAAAGCCT-3′;
AC004540.4-R-5′-CAACTGCACTCCAAATGGCTA-3′.
Statistical analysis
All data are expressed as the mean ± standard error
of the mean, and the differences between the two groups were
compared by Student's t-test. Statistical analyses were performed
using SPSS 22.0 software (IBM Corp., Armonk, NY, USA), and GraphPad
Prism 5 (GraphPad Software, Inc., La Jolla, CA, USA) was used to
visualize the results. P<0.05 was considered to indicate a
statistically significant difference.
Results
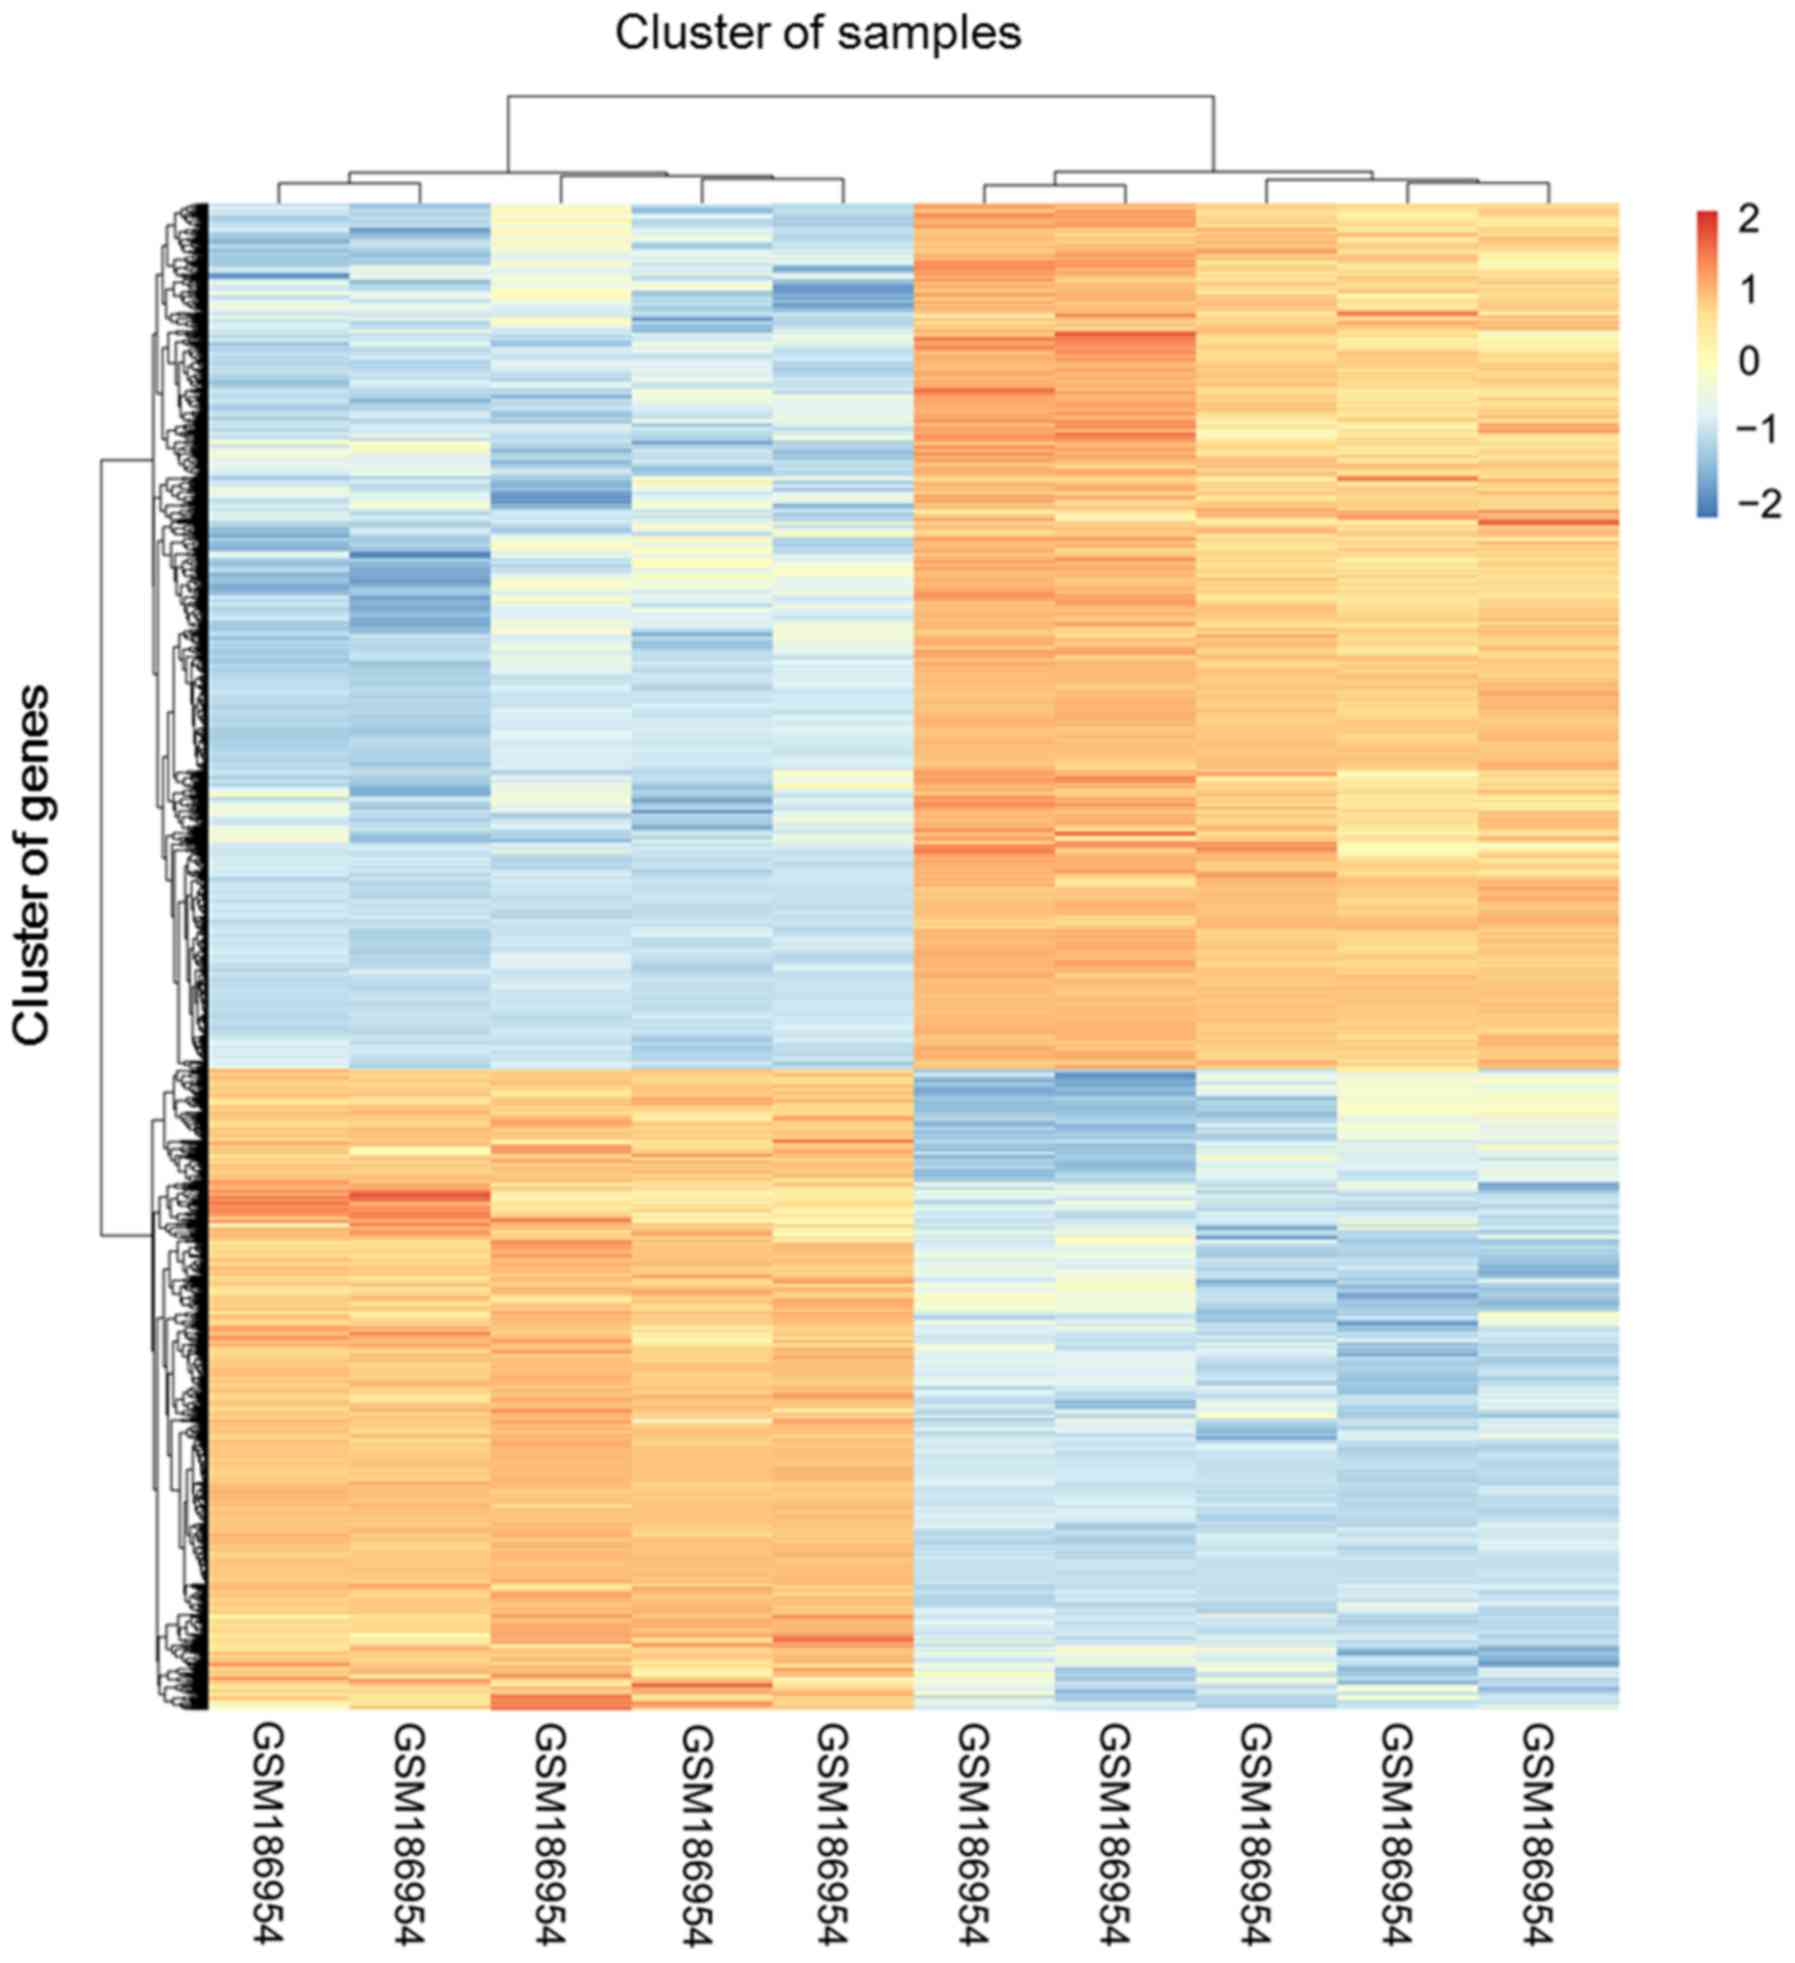
Differential expression analysis
The clustering heatmap for differentially expressed
probes is presented in the Fig. 1.
There were 318 DE-lncRNAs, including 105 upregulated and 213
downregulated, and 609 DE-mRNAs, including 353 upregulated and 256
downregulated, in the NAFLD liver tissues compared with the normal
liver tissues.
Enrichment analysis and PPI network
analysis of DE-mRNAs
The top 5 GO ‘biological process’ (BP), GO ‘cellular
component’ (CC), GO ‘molecular function’ (MF) and KEGG terms
enriched in the DE-mRNAs analysis are summarized in Table I. For the upregulated mRNAs, the
enriched GO and KEGG terms primarily included ‘carboxylic acid
metabolic process’ (GO_BP; FDR=1.24×10⁻²⁰), ‘cytoplasmic
part’ (GO_CC; FDR=8.66×10⁻¹²), ‘molecular function’
(GO_MF; FDR=1.73×10⁻¹⁴), and ‘metabolic pathways’ (KEGG
pathway; FDR=2.65×10−09). Downregulated mRNAs were
primarily enriched in ‘single-organism process’ (GO_BP;
FDR=1.52×10⁻¹²), ‘extracellular space’ (GO_CC;
FDR=5.95×10⁻¹¹), ‘molecular function’ (GO_MF;
FDR=6.89×10−09), and ‘adrenergic signaling in
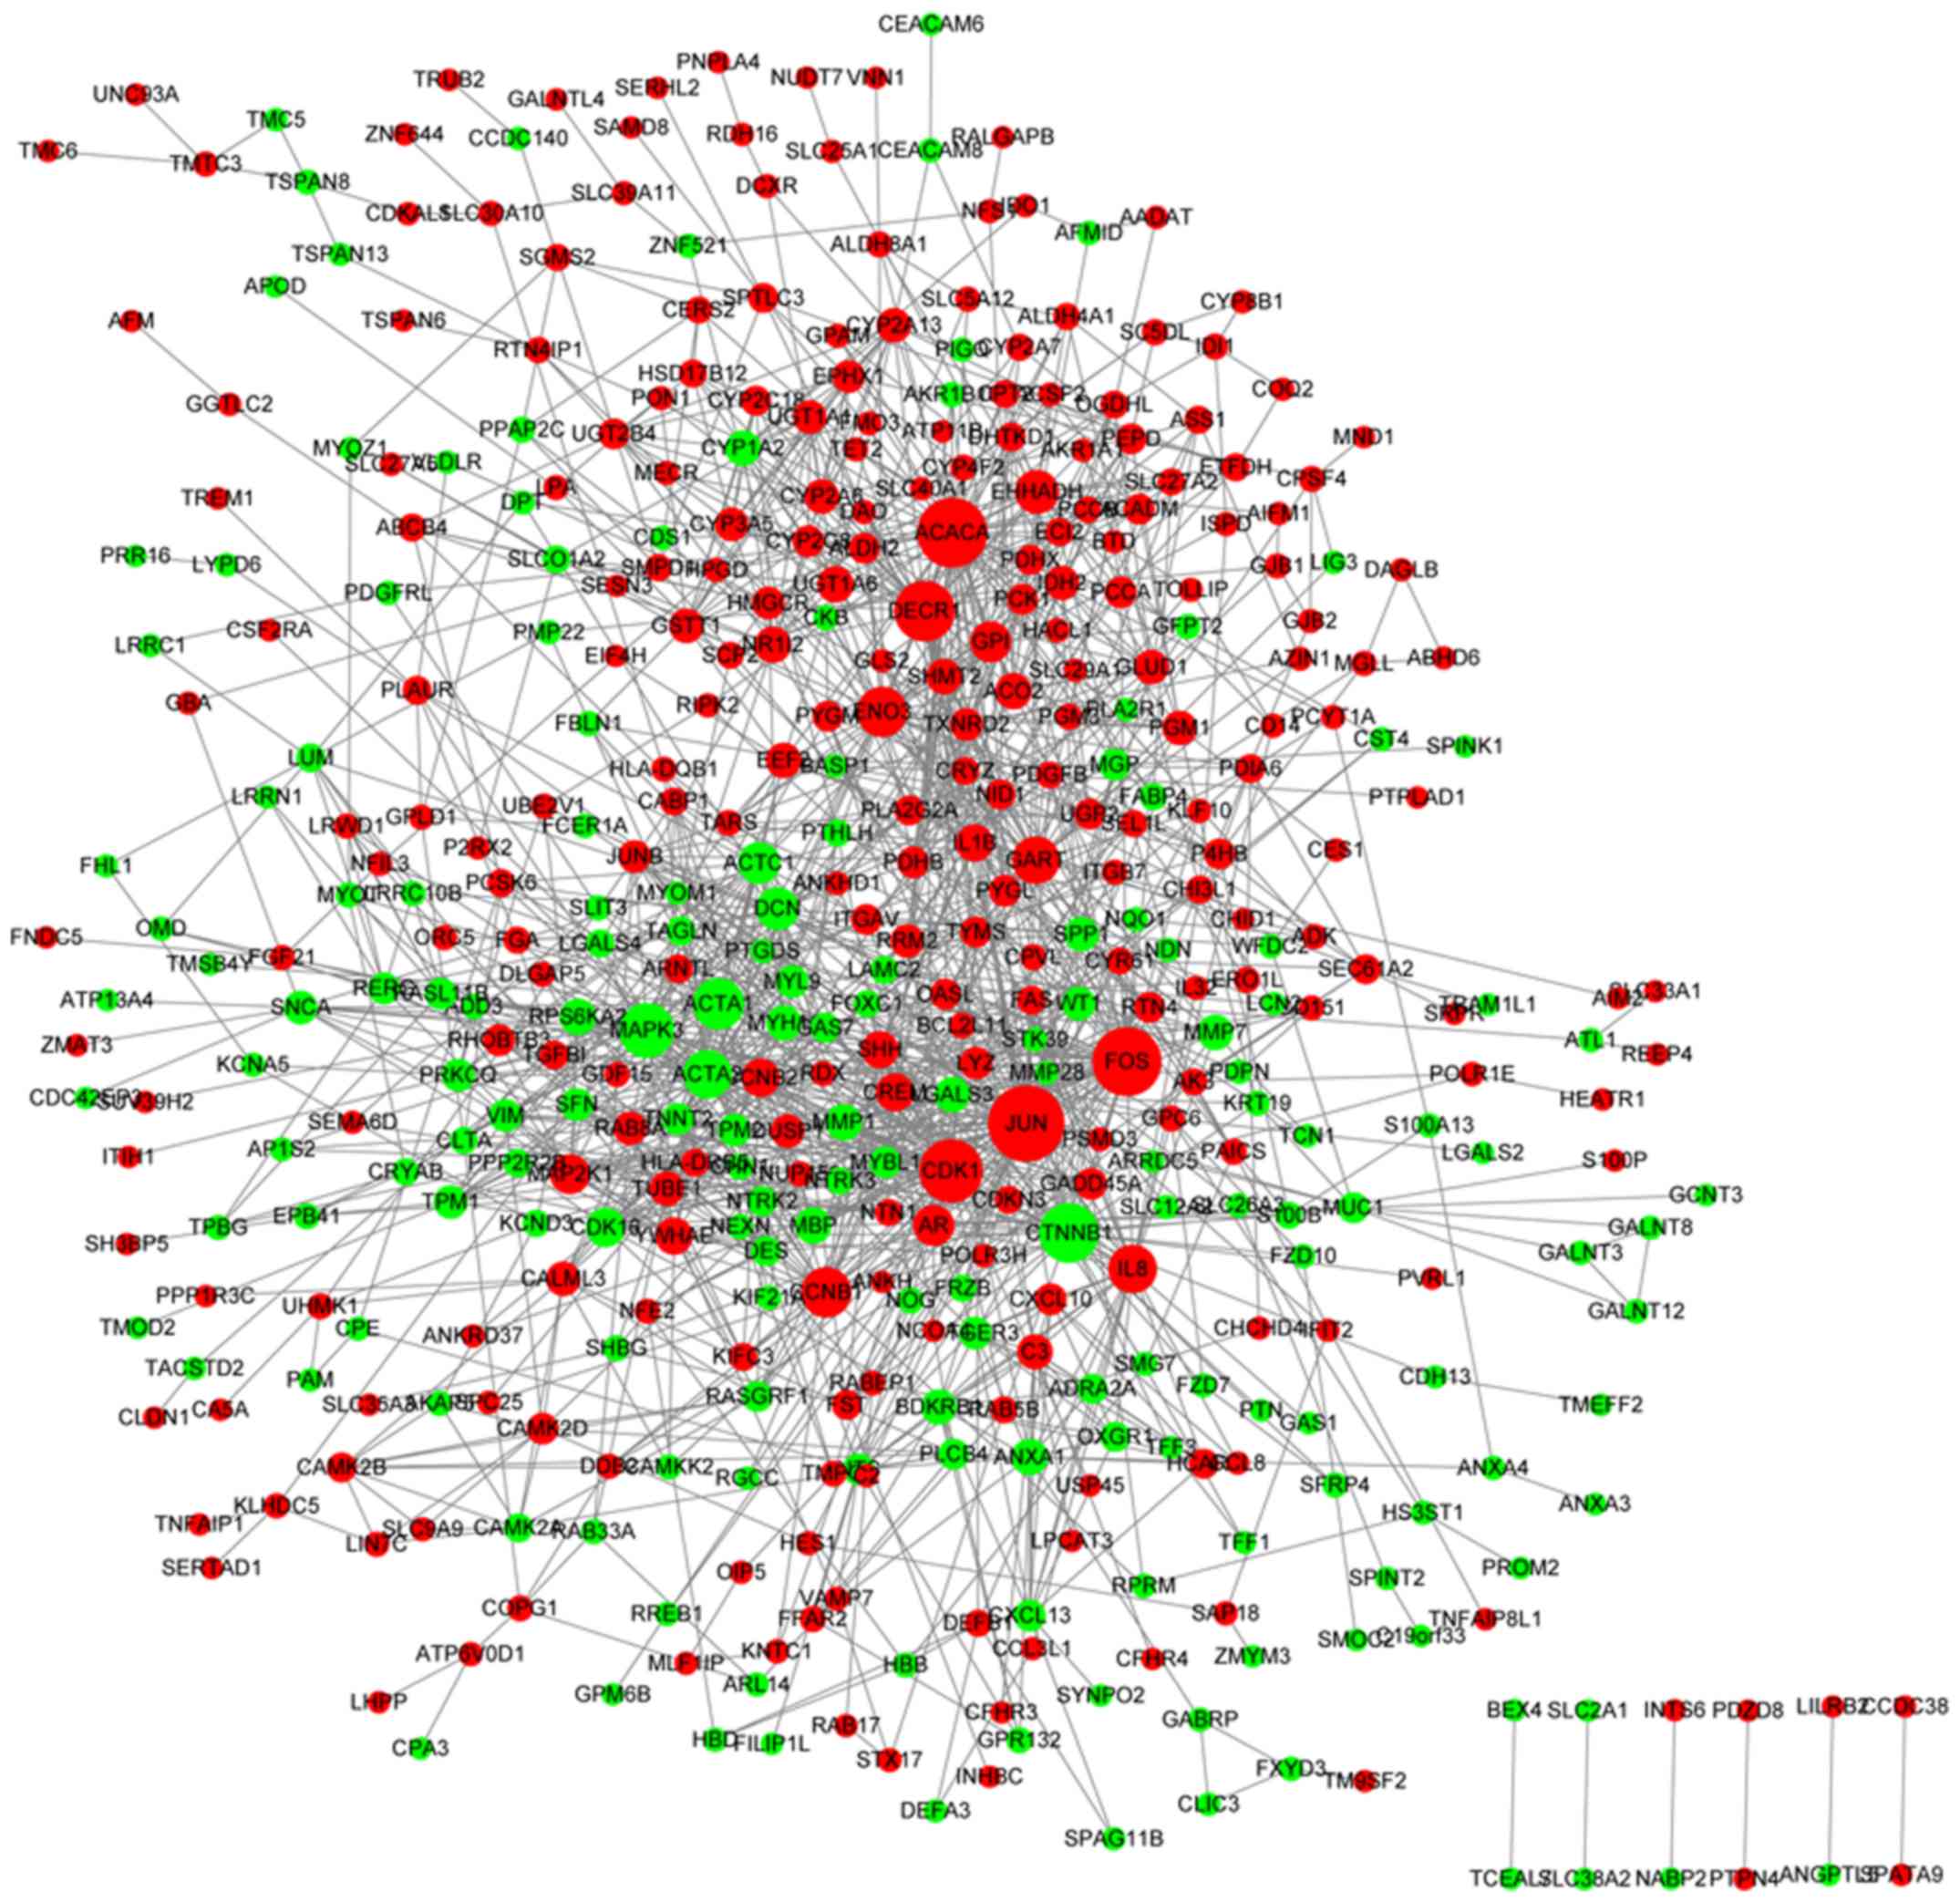
cardiomyocytes’ (KEGG pathway; FDR=4.34×10⁻²). The PPI
network for the DE-mRNAs involved 442 nodes and 1,409 edges, and it
was identified that Jun proto-oncogene, AP-1 transcription factor
subunit (JUN) interacted with B-cell lymphoma 2 (Bcl-2)-like 11
(BCL2L11), as demonstrated in Fig.
2. The top 15 nodes, including JUN, with the highest BC, CC and
DC scores are summarized in Table
II.
 | Table I.Top 5 functions and pathways enriched
in the analysis of differentially expressed mRNAs. |
Table I.
Top 5 functions and pathways enriched
in the analysis of differentially expressed mRNAs.
| Category | Term | ID | Description | P-value | FDR | Count |
|---|
| Upregulated | GO_BP | GO:0019752 | Carboxylic acid
metabolic process |
2.90×10⁻²⁴ |
1.24×10⁻²⁰ | 69 |
|
| GO_BP | GO:0032787 | Monocarboxylic acid
metabolic process |
7.56×10⁻²⁴ |
1.61×10⁻²⁰ | 53 |
|
| GO_BP | GO:0006082 | Organic acid
metabolic process |
1.14×10⁻²³ |
1.62×10⁻²⁰ | 73 |
|
| GO_BP | GO:0043436 | Oxoacid metabolic
process |
2.13×10⁻²³ |
2.27×10⁻²⁰ | 72 |
|
| GO_BP | GO:0044281 | Small molecule
metabolic process |
7.36×10⁻²² |
6.27×10⁻¹⁹ | 110 |
|
| GO_CC | GO:0044444 | Cytoplasmic
part |
1.98×10⁻¹⁴ |
8.66×10⁻¹² | 206 |
|
| GO_CC | GO:0044432 | Endoplasmic
reticulum part |
1.50×10⁻¹² |
3.27×10⁻¹⁰ | 55 |
|
| GO_CC | GO:0005783 | Endoplasmic
reticulum |
3.69×10⁻¹² |
5.38×10⁻¹⁰ | 68 |
|
| GO_CC | GO:0044421 | Extracellular
region part |
5.42×10⁻¹² |
5.93×10⁻¹⁰ | 120 |
|
| GO_CC | GO:0005789 | Endoplasmic
reticulum membrane |
1.20×10⁻¹¹ |
1.05×10⁻⁹ | 48 |
|
| GO_MF | GO:0003674 | Molecular
function |
2.54×10⁻¹⁷ |
1.73×10⁻¹⁴ | 324 |
|
| GO_MF | GO:0003824 | Catalytic
activity |
1.18×10⁻¹⁵ |
4.01×10⁻¹³ | 163 |
|
| GO_MF | GO:0048037 | Cofactor
binding |
4.10×10⁻¹² |
9.30×10⁻¹⁰ | 25 |
|
| GO_MF | GO:0016491 | Oxidoreductase
activity |
8.89×10⁻¹² |
1.51×10⁻⁹ | 41 |
|
| GO_MF | GO:0050662 | Coenzyme
binding |
2.34×10⁻⁸ |
3.18×10⁻⁶ | 17 |
|
| KEGG Pathway | hsa01100 | Metabolic
pathways |
1.02×10⁻¹¹ |
2.65×10⁻⁹ | 72 |
|
| KEGG Pathway | hsa00040 | Pentose and
glucuronate interconversions |
2.24×10⁻⁵ |
2.59×10⁻³ | 7 |
|
| KEGG Pathway | hsa01200 | Carbon
metabolism |
3.94×10⁻⁵ |
2.59×10⁻³ | 12 |
|
| KEGG Pathway | hsa00830 | Retinol
metabolism |
4.32×10⁻⁵ |
2.59×10⁻³ |
9 |
|
| KEGG Pathway | hsa05204 | Chemical
carcinogenesis |
4.99×10⁻⁵ |
2.59×10⁻³ | 10 |
| Downregulated | GO_BP | GO:0044699 | Single-organism
process |
4.23×10⁻¹⁶ |
1.52×10⁻¹² | 197 |
|
| GO_BP | GO:0032501 | Multicellular
organismal process |
1.48×10⁻¹² |
1.85×10⁻⁹ | 128 |
|
| GO_BP | GO:0044707 |
Single-multicellular organism process |
1.54×10⁻¹² |
1.85×10⁻⁹ | 125 |
|
| GO_BP | GO:0008150 | Biological
process |
6.60×10⁻¹² |
5.93×10⁻⁹ | 210 |
|
| GO_BP | GO:0051128 | Regulation of
cellular component organization |
1.24×10⁻¹¹ |
8.92×10⁻⁹ | 58 |
|
| GO_CC | GO:0005615 | Extracellular
space |
1.54×10⁻¹³ |
5.95×10⁻¹¹ | 52 |
|
| GO_CC | GO:0044449 | Contractile fiber
part |
1.04×10⁻¹¹ |
2.02×10⁻⁹ | 19 |
|
| GO_CC | GO:0005576 | Extracellular
region |
2.82×10⁻¹¹ |
3.64×10⁻⁹ | 103 |
|
| GO_CC | GO:0043292 | Contractile
fiber |
4.73×10⁻¹¹ |
4.58×10⁻⁹ | 19 |
|
| GO_CC | GO:0030017 | Sarcomere |
1.73×10⁻¹⁰ |
1.34×10⁻⁸ | 17 |
|
| GO_MF | GO:0003674 | Molecular
function |
1.33×10⁻¹¹ |
6.89×10⁻⁹ | 213 |
|
| GO_MF | GO:0005515 | Protein
binding |
8.48×10⁻⁹ |
2.19×10⁻⁶ | 159 |
|
| GO_MF | GO:0008307 | Structural
constituent of muscle |
1.73×10⁻⁸ |
2.99×10⁻⁶ |
8 |
|
| GO_MF | GO:0008092 | Cytoskeletal
protein binding |
3.61×10⁻⁸ |
4.67×10⁻⁶ | 29 |
|
| GO_MF | GO:0005488 | Binding |
1.29×10⁻⁶ |
1.34×10⁻⁶ | 187 |
|
| Pathway | hsa04261 | Adrenergic
signaling in cardiomyocytes |
2.73×10⁻⁴ | 4.34×10° |
8 |
|
| Pathway | hsa00512 | Mucin type O-glycan
biosynthesis |
4.43×10⁻⁴ | 4.34×10° |
4 |
| Table II.Top 15 nodes with increased DC, BC
and CC scores in the protein-protein interaction network. |
Table II.
Top 15 nodes with increased DC, BC
and CC scores in the protein-protein interaction network.
| DC | BC | CC |
|---|
|
|
|
|---|
| mRNA | Score | mRNA | Score | mRNA | Score |
|---|
| JUN | 59 | JUN | 33383.63 | JUN | 0.069956 |
| ACACA | 52 | ACACA | 23963.01 | FOS | 0.069231 |
| FOS | 51 | CTNNB1 | 18141.12 | CTNNB1 | 0.069133 |
| CDK1 | 45 | FOS | 16604.96 | DECR1 | 0.068756 |
| DECR1 | 42 | DECR1 | 15936.45 | MAPK3 | 0.068542 |
| CTNNB1 | 41 | CDK1 | 12244.42 | ACACA | 0.068531 |
| MAPK3 | 36 | IL8 | 11466.93 | ACTA1 | 0.068425 |
| ACTA1 | 32 | MAPK3 | 10861.69 | ACTA2 | 0.068383 |
| ENO3 | 31 | ACTA1 | 9482.17 | CREM | 0.068351 |
| CCNB1 | 31 | GART |
8161.233 | CDK1 | 0.068277 |
| IL8 | 29 | MBP |
7587.735 | AR | 0.068087 |
| ACTA2 | 29 | AR |
6690.792 | GART | 0.068024 |
| GART | 28 | ENO3 |
6230.197 | IL8 | 0.068014 |
| EHHADH | 24 | DCN |
6073.046 | CCNB1 | 0.067804 |
| DCN | 23 | RTN4IP1 |
5927.582 | ENO3 | 0.067784 |
Construction of the lncRNA-mRNA
regulatory network and functional prediction of DE-lncRNAs
Following prediction of the target genes of the
upregulated and downregulated lncRNAs, lncRNA-mRNA regulatory
networks were constructed. For the upregulated lncRNAs, the
lncRNA-mRNA regulatory network contained 182 nodes (including 37
lncRNAs and 145 target genes) and 672 interactions. For the
downregulated lncRNAs, the lncRNA-mRNA regulatory network contained
140 nodes (including 47 lncRNAs and 93 target genes) and 450
interactions, among which AC004540.4 and RP11-279F6.1 were
identified to target JUN. The top 10 nodes (including AC004540.4
and RP11-279F6.1) in the lncRNA-mRNA regulatory networks are
summarized in Table III.
Subsequent to enrichment analysis, the enriched pathways for the
target genes of each upregulated and downregulated lncRNA were
compared to identify significant pathways.
| Table III.Top 10 nodes in the lncRNA-mRNA
regulatory networks for the upregulated and downregulated
lncRNAs. |
Table III.
Top 10 nodes in the lncRNA-mRNA
regulatory networks for the upregulated and downregulated
lncRNAs.
| Upregulated | Downregulated |
|---|
|
|
|---|
| Symbol | Degree | Symbol | Degree |
|---|
|
AC004540.4 | 60 |
XLOC_014103 | 47 |
|
RP11-279F6.1 | 54 |
C17orf76-AS1 | 45 |
| AQP7P1 | 53 |
RP11-279F6.3 | 41 |
|
XLOC_007896 | 52 |
AK027145 | 41 |
|
AK025288 | 51 |
RP11-13L2.4 | 34 |
|
RP1-60O19.1 | 47 |
RP11-120K9.2 | 30 |
|
TRHDE-AS1 | 46 |
LOC100505806 | 29 |
|
RP11-345M22.2 | 42 |
BC073897 | 26 |
|
LOC100422737 | 38 |
RP11-471J12.1 | 21 |
|
AK055386 | 29 | RMST | 14 |
Construction of miRNA-lncRNA-mRNA
interaction network
The miRNAs (including miR-409-3p and miR-139, which
targeted JUN) targeting the DE-mRNAs involved in the PPI network
are summarized in Table IV.
Subsequent to prediction of the binding sites between DE-lncRNAs
and the miRNAs associated with the miRNA-mRNA pairs, an
miRNA-lncRNA interaction network was constructed (involving 26
miRNAs, 111 lncRNAs and 224 interactions). In the miRNA-lncRNA
interaction network, miR-409-3p and miR-139 interacted with
AC004540.4 and RP11-279F6.1, respectively. The top 10 nodes
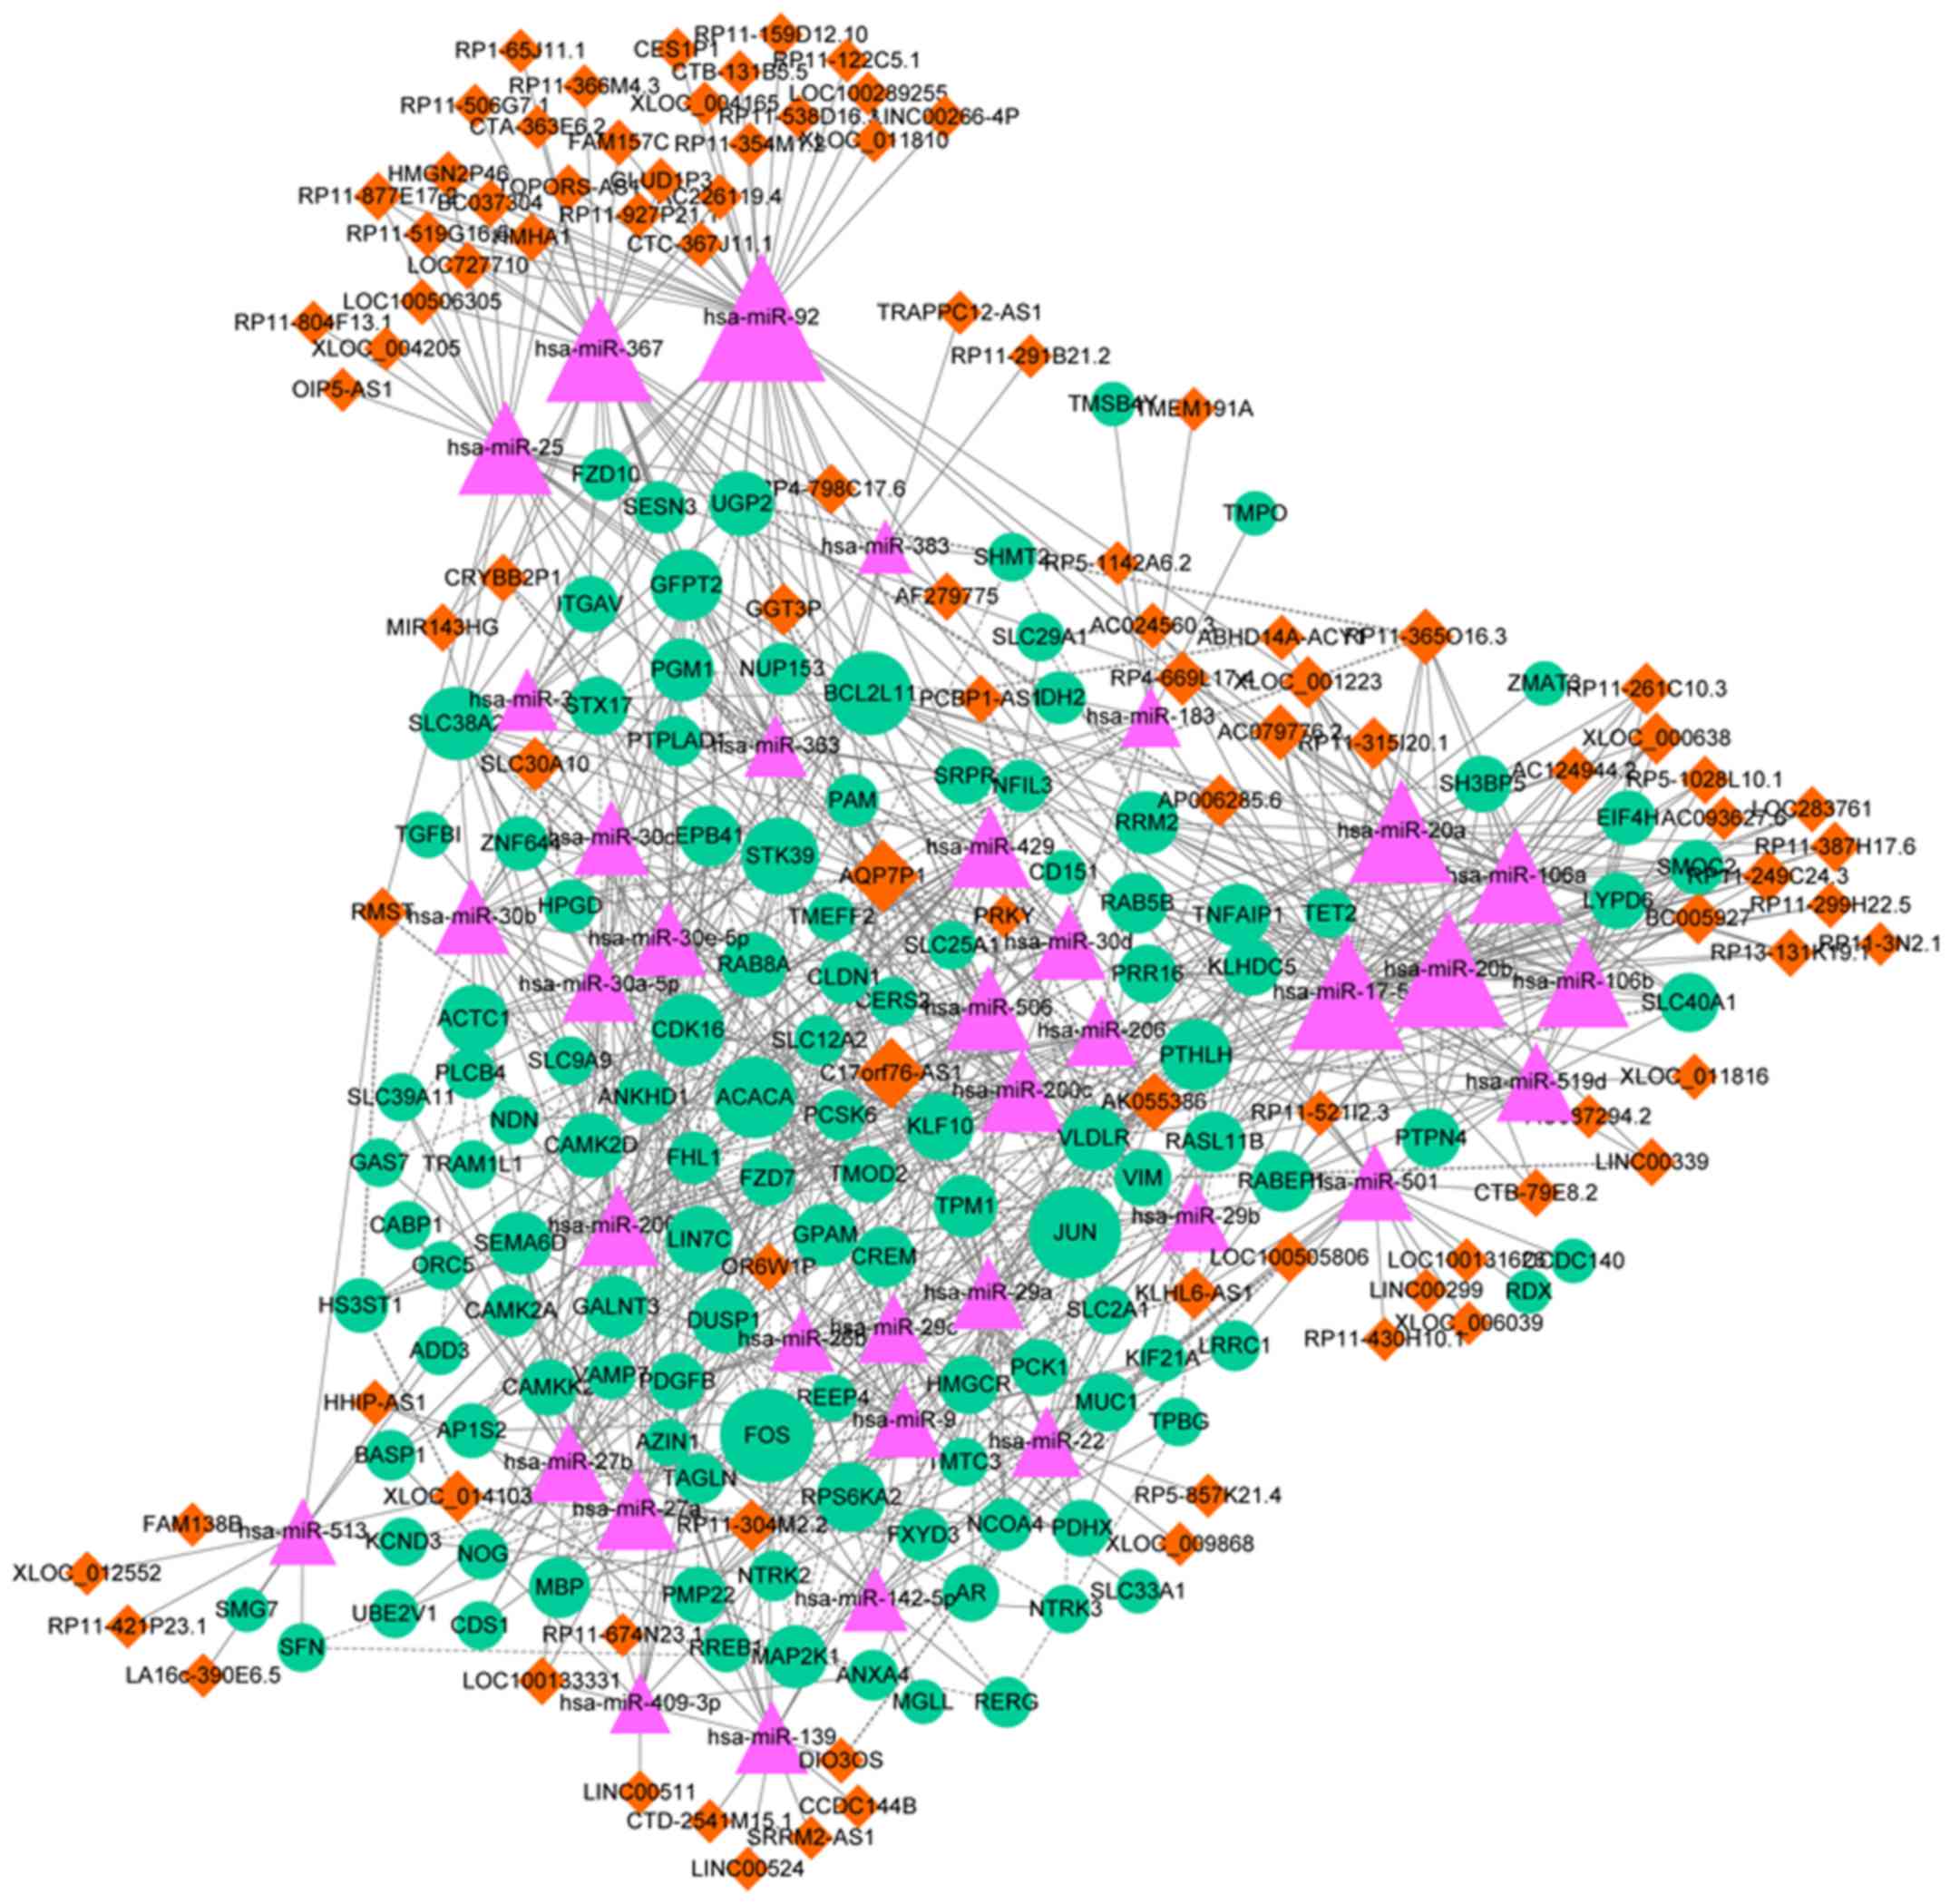
exhibiting the highest degrees are summarized in Table V. Finally, an miRNA-lncRNA-mRNA
interaction network was constructed, which contained 249 nodes,
including 36 miRNAs, 95 lncRNAs, 118 mRNAs and 845 interactions
(Fig. 3). The top 10 nodes
[including miR-20a; solute carrier family 30, member 10,
(SLC30A10); and BCL2L11] with the highest degrees in the
miRNA-lncRNA-mRNA interaction network are summarized in Table VI. In particular, BCL2L11 was
targeted by miR-20a in the interaction network.
| Table IV.miRNAs targeting the differentially
expressed mRNAs involved in the protein-protein interaction
network. |
Table IV.
miRNAs targeting the differentially
expressed mRNAs involved in the protein-protein interaction
network.
| miRNA | Gene count | P-value |
|---|
| hsa_CAGTATT,
miR-200B, miR-200C, miR-429 | 19 | adjP=0.00004 |
| hsa_ACCAAAG,
miR-9 | 16 | adjP=0.00220 |
| hsa_AACATTC,
miR-409-3P | 8 | adjP=0.00220 |
| hsa_GGCAGCT,
miR-22 | 10 | adjP=0.00220 |
| hsa_ACTGTAG,
miR-139 | 7 | adjP=0.00240 |
| hsa_ACATTCC,
miR-1, miR-206 | 11 | adjP=0.00240 |
| hsa_AAAGGAT,
miR-501 | 7 | adjP=0.00240 |
| hsa_TGTTTAC,
miR-30A-5P, miR-30C, miR-30D, miR-30B, miR-30E-5P | 16 | adjP=0.00240 |
| hsa_GTGCCTT,
miR-506 | 19 | adjP=0.00240 |
| hsa_TACTTGA,
miR-26A, miR-26B | 11 | adjP=0.00240 |
| hsa_ACTTTAT,
miR-142-5P | 11 | adjP=0.00240 |
| hsa_GTGCCAT,
miR-183 | 8 | adjP=0.00360 |
| hsa_TGGTGCT,
miR-29A, miR-29B, miR-29C | 14 | adjP=0.00670 |
| hsa_ACTGTGA,
miR-27A, miR-27B | 13 | adjP=0.00680 |
| hsa_GCACTTT,
miR-17-5P, miR-20A, miR-106A, miR-106B, miR-20B, miR-519D | 15 | adjP=0.00700 |
| hsa_GTGCAAT,
miR-25, miR-32, miR-92, miR-363, miR-367 | 10 | adjP=0.00760 |
| hsa_TCTGATC,
miR-383 | 4 | adjP=0.00820 |
| hsa_CCTGTGA,
miR-513 | 6 | adjP=0.00920 |
| Table V.Top 10 nodes with highest degrees in
the miRNA-lncRNA interaction network. |
Table V.
Top 10 nodes with highest degrees in
the miRNA-lncRNA interaction network.
| miRNA | lncRNA |
|---|
|
|
|---|
| Symbol | Degree | Symbol | Degree |
|---|
|
hsa-miR-92a | 32 |
C17orf76-AS1 | 9 |
|
hsa-miR-367 | 21 |
AC079776.2 | 8 |
|
hsa-miR-20b | 21 |
RP4-669L17.4 | 6 |
|
hsa-miR-17-5p | 21 |
XLOC_001223 | 5 |
|
hsa-miR-145 | 18 |
XLOC_000638 | 5 |
|
hsa-miR-25 | 15 |
RP11-365O16.3 | 5 |
|
hsa-miR-20a | 15 |
RP11-315I20.1 | 5 |
|
hsa-miR-106a | 11 |
RP11-261C10.3 | 5 |
|
hsa-miR-501 | 10 |
RP11-249C24.3 | 5 |
|
hsa-miR-106b | 9 |
BC005927 | 5 |
| Table VI.Top 10 nodes with highest degrees in
the miRNA-lncRNA-mRNA interaction network. |
Table VI.
Top 10 nodes with highest degrees in
the miRNA-lncRNA-mRNA interaction network.
| miRNA | lncRNA | mRNA |
|---|
|
|
|
|---|
| Symbol | Degree | Symbol | Degree | Symbol | Degree |
|---|
|
hsa-miR-92 | 42 | AQP7P1 | 15 | FOS | 25 |
|
hsa-miR-20b | 36 |
C17orf76-AS1 | 14 | JUN | 24 |
|
hsa-miR-17-5p | 36 |
AK055386 | 8 | BCL2L11 | 20 |
|
hsa-miR-367 | 31 |
RP11-365O16.3 | 7 | ACACA | 19 |
|
hsa-miR-20a | 30 |
AC079776.2 | 7 | STK39 | 17 |
|
hsa-miR-106a | 26 |
SLC30A10 | 6 | SLC38A2 | 15 |
|
hsa-miR-25 | 25 |
RP4-669L17.4 | 6 | CDK16 | 15 |
|
hsa-miR-106b | 24 |
XLOC_014103 | 5 | GFPT2 | 14 |
|
hsa-miR-506 | 21 |
XLOC_000638 | 5 | PTHLH | 14 |
|
hsa-miR-200c | 20 |
XLOC_001223 | 5 | RPS6KA2 | 13 |
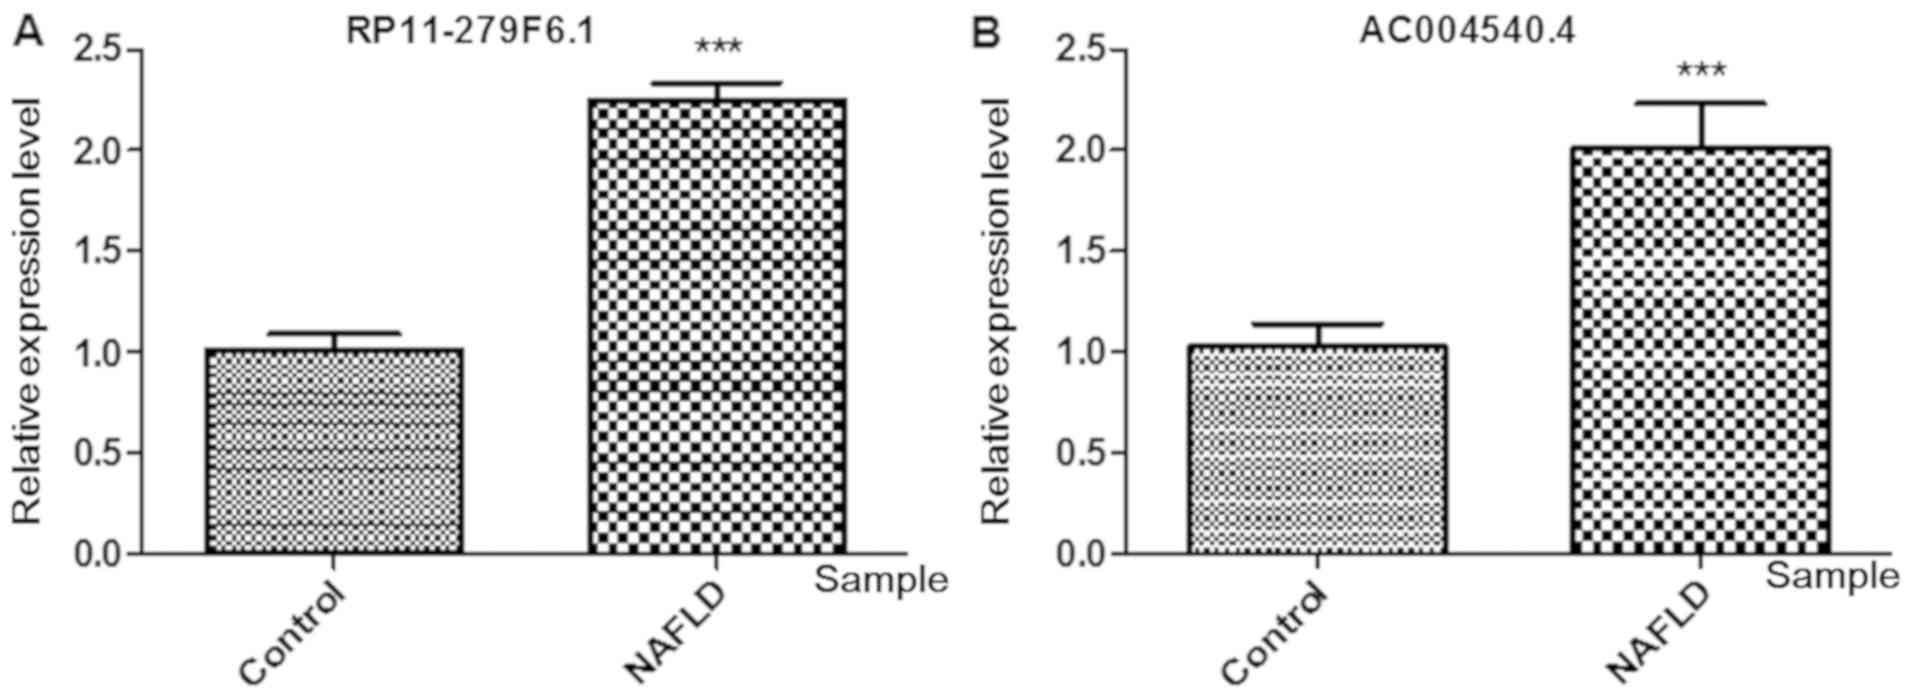
RP11-279F6.1 and AC004540.4
expression
The RT-qPCR results revealed that RP11-279F6.1 and
AC004540.4 expression levels were markedly enhanced in the liver
tissues from patients with NAFLD compared with the control liver
samples (Fig. 4; P<0.01).
Discussion
In the present study, 318 DE-lncRNAs, including 105
upregulated and 213 downregulated lncRNAs, and 609 DE-mRNAs,
including 353 upregulated and 256 downregulated mRNAs, were
screened in the NAFLD liver tissues compared with normal liver
tissues. In the PPI network for DE-mRNAs, JUN, the targeting gene
of BCL2L11, was among the top 15 nodes. JUN was targeted by the
lncRNAs RP11-279F6.1 and AC004540.4 and miRNAs miR-409-3p and
miR-139. Additionally, miR-409-3p and miR-139 were predicted as the
DE-mRNAs involved in the PPI network. Additionally, miR-409-3p and
miR-139 were regulated by AC004540.4 and RP11-279F6.1,
respectively. In the miRNA-lncRNA-mRNA interaction network,
miR-20a, SLC30A10 and BCL2L11 were among the top 10 nodes.
RP11-279F6.1 and AC004540.4 expression was markedly increased in
the NAFLD patient liver tissues compared with the control liver
samples.
JUN, also known as AP1, was identified to be
increased in a previous study of NAFLD (35). Phosphorylation of the
transcriptional activation domain of AP1 is conducted by
JNKs to enhance its activity, thereby accelerating the progression
and development of NASH (36,37).
JUN is considered to be an oncogene in the liver, and its
expression is enhanced in response to inflammatory stimuli,
promoting liver tumorigenesis (38,39).
JUN serves an important role in hepatitis B virus-associated
tumorigenesis by promoting the proliferation of hepatocytes and
dysplasia progression, indicating that JUN is a useful treatment
target for preventing hepatitis-associated tumorigenesis (40). The results from the present study
indicated that JUN is involved in the pathogenesis of NAFLD.
In the present study, JUN interacted with BCL2L11
and was targeted by miR-20a in the miRNA-lncRNA-mRNA interaction
network. The serum/plasma level of miR-20a has potential value for
detecting hepatitis C virus (HCV) infection, and therefore
circulating miR-20a may be useful as a predictive marker in liver
fibrosis mediated by HCV (41).
Apoptosis is a major cause of hepatocyte elimination in NAFLD, and
inhibition of the anti-apoptotic protein Bcl-2 and activation of
the pro-apoptotic protein p53 promotes inflammation in NAFLD
(42). Overexpression of Bcl-2
results in resistance to reperfusion injury in the ischemic liver
by suppressing apoptosis and is associated with increased caspase 3
and cytoplasmic cytochrome c and a deficiency of Bcl-extra
large (43). By targeting the
anti-apoptotic gene Bcl-2, miR-15b and miR-16 regulate tumor
necrosis factor-mediated hepatic apoptosis in the process of acute
liver failure (44). The data from
the present study suggest that miR-20a serves a role in NAFLD by
targeting BCL2L11 and affecting the expression of JUN.
JUN was also regulated by the miRNAs of miR-409-3p
and miR-139. In hepatoma HuH-7 cells, miR-409-3p decreased the
production of fibrinogen by downregulating fibrinogen beta chain
precursor expression (45). A
previous study suggested that miR-409-3p may be utilized to detect
the progression of NAFLD (46).
miR-409-3p was also identified as a biomarker for the therapeutics
and diagnosis of a number of heart failure-associated diseases and
a risk factor of NAFLD (47).
Overexpression of miR-139, which was downregulated in
hepatocellular carcinoma (HCC) samples, suppresses the progression
and metastasis of HCC by downregulating rho-kinase 2, indicating
that miR-139 may be used to predict the outcome of HCC (48). In the present study, miR-409-3p and
miR-139 interacted with the lncRNAs of AC004540.4 and RP11-279F6.1,
respectively. Furthermore, the expression levels of AC004540.4 and
RP11-279F6.1 were markedly enhanced in liver tissues from patients
with NAFLD compared with the control liver samples. Therefore, we
hypothesized that miR-409-3p, miR-139, AC004540.4 and RP11-279F6.1
co-regulated JUN expression in patients with NAFLD.
Although the present study succeeded in identifying
specific key miRNAs and lncRNAs in the development of NAFLD, there
were also certain limitations. For example, the analyses were based
on the microarray dataset GSE72756 downloaded from the GEO
database. However, the stages of NAFLD (fatty liver,
steatohepatitis or fibrosis/cirrhosis) were not clearly described
in the GEO database. Therefore, the degree of NAFLD was not clear.
In addition, the sample size was too small, and the predicted
regulatory associations were not validated. Future studies will aim
to confirm the predicted regulatory associations using cell line
experiments.
In conclusion, 318 DE-lncRNAs and 609 DE-mRNAs were
identified in NAFLD liver tissues by bioinformatics analysis.
Additionally, specific mRNAs (including JUN and BCL2L11) and miRNAs
(including miR-20a, miR-409-3p and miR-139) may serve essential
roles in the pathogenesis of NAFLD. The lncRNAs AC004540.4 and
RP11-279F6.1 were also implicated in the mechanisms of NAFLD.
Acknowledgements
Not applicable.
Funding
No funding was received.
Availability of data and materials
The datasets used and/or analyzed during the current
study are available from the corresponding author on reasonable
request.
Authors' contributions
HW and XS were responsible for the conception and
design of the research and drafting the manuscript. ZT and YL
performed the data acquisition. JZ performed the data analysis and
interpretation. YS participated in the design of the study and
performed the statistical analysis. All authors have read and
approved the manuscript.
Ethics approval and consent to
participate
The present study was approved by the Ethics
Committee of Nanjing First Hospital. Informed consent was obtained
from all patients.
Patient consent for publication
Informed consent was obtained from all patients.
Competing interests
The authors declare that they have no competing
interests.
Glossary
Abbreviations
Abbreviations:
|
lncRNAs
|
long non-coding RNA
|
|
miRNAs
|
microRNA
|
|
DE-lncRNAs
|
differentially expressed lncRNAs
|
|
PPI
|
protein-protein interaction
|
|
NAFLD
|
non-alcoholic fatty liver disease
|
|
NASH
|
non-alcoholic steatohepatitis
|
|
FATP5
|
fatty acid transport protein 5
|
|
FDR
|
false discovery rate
|
|
GO
|
Gene Ontology
|
|
KEGG
|
Kyoto Encyclopedia of Genes and
Genomes
|
|
CC
|
Closeness centrality
|
|
DC
|
Degree Centrality
|
|
BC
|
Betweenness centrality
|
|
RT-qPCR
|
reverse transcription quantitative
polymerase chain reaction
|
|
BP
|
biological process
|
|
MF
|
molecular function
|
|
CC
|
cellular component
|
|
HCC
|
hepatocellular carcinoma
|
References
|
1
|
Shaker M, Tabbaa A, Albeldawi M and
Alkhouri N: Liver transplantation for nonalcoholic fatty liver
disease: New challenges and new opportunities. World J
Gastroenterol. 20:5320–5330. 2014. View Article : Google Scholar : PubMed/NCBI
|
|
2
|
Rinella ME: Nonalcoholic fatty liver
disease: A systematic review. JAMA. 313:22632015. View Article : Google Scholar : PubMed/NCBI
|
|
3
|
Tolman KG and Dalpiaz AS: Treatment of
non-alcoholic fatty liver disease. Ther Clin Risk Manag.
3:1153–1163. 2007.PubMed/NCBI
|
|
4
|
Clark JM and Diehl AM: Nonalcoholic fatty
liver disease: An underrecognized cause of cryptogenic cirrhosis.
JAMA. 289:3000–3004. 2003. View Article : Google Scholar : PubMed/NCBI
|
|
5
|
Omagari K, Kadokawa Y, Masuda J, Egawa I,
Sawa T, Hazama H, Ohba K, Isomoto H, Mizuta Y, Hayashida K, et al:
Fatty liver in non-alcoholic non-overweight Japanese adults:
Incidence and clinical characteristics. J Gastroenterol Hepatol.
17:1098–1105. 2002. View Article : Google Scholar : PubMed/NCBI
|
|
6
|
Shen L, Fan JG, Shao Y, Zeng MD, Wang JR,
Luo GH, Li JQ and Chen SY: Prevalence of nonalcoholic fatty liver
among administrative officers in Shanghai: An epidemiological
survey. World J Gastroenterol. 9:1106–1110. 2003. View Article : Google Scholar : PubMed/NCBI
|
|
7
|
Lazo M, Hernaez R, Bonekamp S, Kamel IR,
Brancati FL, Guallar E and Clark JM: Non-alcoholic fatty liver
disease and mortality among US adults: Prospective cohort study.
BMJ. 343:d68912011. View Article : Google Scholar : PubMed/NCBI
|
|
8
|
Doege H, Grimm D, Falcon A, Tsang B, Storm
TA, Xu H, Ortegon AM, Kazantzis M, Kay MA and Stahl A: Silencing of
hepatic fatty acid transporter protein 5 in vivo reverses
diet-induced non-alcoholic fatty liver disease and improves
hyperglycemia. J Biol Chem. 283:22186–22192. 2008. View Article : Google Scholar : PubMed/NCBI
|
|
9
|
Hoekstra M, Li ZS, Kruijt JK, Van Eck M,
Van Berkel TJ and Kuiper J: The expression level of non-alcoholic
fatty liver disease-related gene PNPLA3 in hepatocytes is highly
influenced by hepatic lipid status. J Hepatol. 52:244–251. 2010.
View Article : Google Scholar : PubMed/NCBI
|
|
10
|
Lin YC, Chang PF, Hu FC, Yang WS, Chang MH
and Ni YH: A common variant in the PNPLA3 gene is a risk factor for
non-alcoholic fatty liver disease in obese Taiwanese children. J
Pediatr. 158:740–744. 2010. View Article : Google Scholar : PubMed/NCBI
|
|
11
|
Tang Y, Bian Z, Zhao L, Liu Y, Liang S,
Wang Q, Han X, Peng Y, Chen X, Shen L, et al: Interleukin-17
exacerbates hepatic steatosis and inflammation in non-alcoholic
fatty liver disease. Clin Exp Immunol. 166:281–290. 2011.
View Article : Google Scholar : PubMed/NCBI
|
|
12
|
Yamada H, Suzuki K, Ichino N, Ando Y,
Sawada A, Osakabe K, Sugimoto K, Ohashi K, Teradaira R, Inoue T, et
al: Associations between circulating microRNAs (miR-21, miR-34a,
miR-122 and miR-451) and non-alcoholic fatty liver. Clin Chim Acta.
424:99–103. 2013. View Article : Google Scholar : PubMed/NCBI
|
|
13
|
Sun C, Huang F, Liu X, Xiao X, Yang M, Hu
G, Liu H and Liao L: miR-21 regulates triglyceride and cholesterol
metabolism in non-alcoholic fatty liver disease by targeting HMGCR.
Int J Mol Med. 35:847–853. 2015. View Article : Google Scholar : PubMed/NCBI
|
|
14
|
Rui EC, Ferreira DM, Afonso MB, Borralho
PM, Machado MV, Cortez-Pinto H and Rodrigues CM: miR-34a/SIRT1/p53
is suppressed by ursodeoxycholic acid in the rat liver and
activated by disease severity in human non-alcoholic fatty liver
disease. J Hepatol. 58:119–125. 2012.PubMed/NCBI
|
|
15
|
Sun C, Liu X, Yi Z, Xiao X, Yang M, Hu G,
Liu H, Liao L and Huang F: Genome-wide analysis of long noncoding
RNA expression profiles in patients with non-alcoholic fatty liver
disease. IUBMB Life. 67:847–852. 2015. View
Article : Google Scholar : PubMed/NCBI
|
|
16
|
Smyth GK: Limma: Linear models for
microarray data. In: Bioinformatics and Computational Biology
Solutions Using R and Bioconductor. Gentleman R, Carey VJ, Huber W,
Irizarry RA and Dudoit S: Springer New York. (New York, NY).
397–420. 2005.
|
|
17
|
Kolde R and Kolde MR: Package ‘pheatmap’.
https://cran.r-project.org/web/packages/pheatmap/October
12–2015
|
|
18
|
Yu G, Wang LG, Han Y and He QY:
clusterProfiler: An R package for comparing biological themes among
gene clusters. OMICS. 16:284–287. 2012. View Article : Google Scholar : PubMed/NCBI
|
|
19
|
Tweedie S, Ashburner M, Falls K, Leyland
P, McQuilton P, Marygold S, Millburn G, Osumi-Sutherland D,
Schroeder A, Seal R, et al: FlyBase: Enhancing drosophila gene
ontology annotations. Nucleic Acids Res 37 (Database Issue).
D555–D559. 2009. View Article : Google Scholar
|
|
20
|
Altermann E and Klaenhammer TR:
PathwayVoyager: Pathway mapping using the Kyoto encyclopedia of
genes and genomes (KEGG) database. BMC Genomics. 6:602005.
View Article : Google Scholar : PubMed/NCBI
|
|
21
|
Szklarczyk D, Franceschini A, Wyder S,
Forslund K, Heller D, Huerta-Cepas J, Simonovic M, Roth A, Santos
A, Tsafou KP, et al: STRING v10: Protein-protein interaction
networks, integrated over the tree of life. Nucleic Acids Res 43
(Database Issue). D447–D452. 2015. View Article : Google Scholar
|
|
22
|
Saito R, Smoot ME, Ono K, Ruscheinski J,
Wang PL, Lotia S, Pico AR, Bader GD and Ideker T: A travel guide to
Cytoscape plugins. Nat Methods. 9:1069–1076. 2012. View Article : Google Scholar : PubMed/NCBI
|
|
23
|
Tang Y, Li M, Wang J, Pan Y and Wu FX:
CytoNCA: A cytoscape plugin for centrality analysis and evaluation
of biological networks. Biosystems. 127:67–72. 2015. View Article : Google Scholar : PubMed/NCBI
|
|
24
|
Du Y, Gao C, Chen X, Hu Y, Sadiq R and
Deng Y: A new closeness centrality measure via effective distance
in complex networks. Chaos. 25:0331122015. View Article : Google Scholar : PubMed/NCBI
|
|
25
|
Opsahl T, Agneessens F and Skvoretz J:
Node centrality in weighted networks: Generalizing degree and
shortest paths. Social Networks. 32:245–251. 2010. View Article : Google Scholar
|
|
26
|
Cukierski WJ and Foran DJ: Using
betweenness centrality to identify manifold Shortcuts. Proc IEEE
Int Conf Data Min. 2008:949–958. 2008.PubMed/NCBI
|
|
27
|
He X and Zhang J: Why do hubs tend to be
essential in protein networks? PLoS Genet. 2:e882006. View Article : Google Scholar : PubMed/NCBI
|
|
28
|
Mukaka MM: Statistics corner: A guide to
appropriate use of correlation coefficient in medical research.
Malawi Med J. 24:69–71. 2012.PubMed/NCBI
|
|
29
|
Wang J, Duncan D, Shi Z and Zhang B:
WEB-based GEne SeT AnaLysis Toolkit (WebGestalt): Update 2013.
Nucleic Acids Res. 41:W77–W83. 2013. View Article : Google Scholar : PubMed/NCBI
|
|
30
|
Kent WJ, Sugnet CW, Furey TS, Roskin KM,
Pringle TH, Zahler AM and Haussler D: The human genome browser at
UCSC. Genome Res. 12:996–1006. 2002. View Article : Google Scholar : PubMed/NCBI
|
|
31
|
Kozomara A and Griffiths-Jones S: miRBase:
Annotating high confidence microRNAs using deep sequencing data.
Nucleic Acids Res 42 (Database Issue). D68–D73. 2014. View Article : Google Scholar
|
|
32
|
John B, Enright AJ, Aravin A, Tuschl T,
Sander C and Marks DS: Correction: Human MicroRNA targets. PLoS
Biol. 3:e2642005. View Article : Google Scholar :
|
|
33
|
Krüger J and Rehmsmeier M: RNAhybrid:
microRNA target prediction easy, fast and flexible. Nucleic Acids
Res. 34:W451–W454. 2006. View Article : Google Scholar : PubMed/NCBI
|
|
34
|
Livak KJ and Schmittgen TD: Analysis of
relative gene expression data using real-time quantitative PCR and
the 2(-Delta Delta C(T)) method. Methods. 25:402–408. 2001.
View Article : Google Scholar : PubMed/NCBI
|
|
35
|
Dorn C, Engelmann JC, Saugspier M, Koch A,
Hartmann A, Müller M, Spang R, Bosserhoff A and Hellerbrand C:
Increased expression of c-Jun in nonalcoholic fatty liver disease.
Lab Invest. 94:394–408. 2014. View Article : Google Scholar : PubMed/NCBI
|
|
36
|
Singh R, Wang YJ, Xiang YQ, Tanaka KE,
Gaarde WA and Czaja MJ: Differential effects of JNK1 and JNK2
inhibition on murine steatohepatitis and insulin resistance.
Hepatology. 49:87–96. 2009. View Article : Google Scholar : PubMed/NCBI
|
|
37
|
Karin M and Gallagher E: From JNK to pay
dirt: Jun kinases, their biochemistry, physiology and clinical
importance. IUBMB Life. 57:283–295. 2005. View Article : Google Scholar : PubMed/NCBI
|
|
38
|
Min L, Ji Y, Bakiri L, Qiu Z, Cen J, Chen
X, Chen L, Scheuch H, Zheng H, Qin L, et al: Liver cancer
initiation is controlled by AP-1 through SIRT6-dependent inhibition
of survivin. Nat Cell Biol. 15:1203–1211. 2013. View Article : Google Scholar
|
|
39
|
Machida K, Tsukamoto H, Liu JC, Han YP,
Govindarajan S, Lai MM, Akira S and Ou JH: c-Jun mediates hepatitis
C virus hepatocarcinogenesis through signal transducer and
activator of transcription 3 and nitric oxide-dependent impairment
of oxidative DNA repair. Hepatology. 52:480–492. 2010. View Article : Google Scholar : PubMed/NCBI
|
|
40
|
Trierweiler C, Hockenjos B, Zatloukal K,
Thimme R, Blum HE, Wagner EF and Hasselblatt P: The transcription
factor c-JUN/AP-1 promotes HBV-related liver tumorigenesis in mice.
Cell Death Differ. 23:576–582. 2016. View Article : Google Scholar : PubMed/NCBI
|
|
41
|
Shrivastava S, Petrone J, Steele R, Lauer
GM, Di Bisceglie AM and Ray RB: Up-regulation of circulating
miR-20a is correlated with hepatitis C virus-mediated liver disease
progression. Hepatology. 58:863–871. 2013. View Article : Google Scholar : PubMed/NCBI
|
|
42
|
Panasiuk A, Dzieciol J, Panasiuk B and
Prokopowicz D: Expression of p53, Bax and Bcl-2 proteins in
hepatocytes in non-alcoholic fatty liver disease. World J
Gastroenterol. 12:6198–6202. 2006. View Article : Google Scholar : PubMed/NCBI
|
|
43
|
Selzner M, Rüdiger HA, Selzner N, Thomas
DW, Sindram D and Clavien PA: Transgenic mice overexpressing human
B cl-2 are resistant to hepatic ischemia and reperfusion. J
Hepatol. 36:218–225. 2002. View Article : Google Scholar : PubMed/NCBI
|
|
44
|
An F, Gong B, Wang H, Yu D, Zhao G, Lin L,
Tang W, Yu H, Bao S and Xie Q: miR-15b and miR-16 regulate TNF
mediated hepatocyte apoptosis via BCL2 in acute liver failure.
Apoptosis. 17:702–716. 2012. View Article : Google Scholar : PubMed/NCBI
|
|
45
|
Fort A, Borel C, Migliavacca E,
Antonarakis SE, Fish RJ and Neerman-Arbez M: Regulation of
fibrinogen production by microRNAs. Blood. 116:2608–2615. 2010.
View Article : Google Scholar : PubMed/NCBI
|
|
46
|
Tryndyak VP, Marrone AK, Latendresse JR,
Muskhelishvili L, Beland FA and Pogribny IP: MicroRNA changes,
activation of progenitor cells and severity of liver injury in mice
induced by choline and folate deficiency. J Nutr Biochem. 28:83–90.
2016. View Article : Google Scholar : PubMed/NCBI
|
|
47
|
Yang Y, Yu T, Jiang S, Zhang Y, Li M, Tang
N, Ponnusamy M, Wang JX and Li PF: miRNAs as potential therapeutic
targets and diagnostic biomarkers for cardiovascular disease with a
particular focus on WO2010091204. Expert Opin Ther Pat.
27:1021–1029. 2017. View Article : Google Scholar : PubMed/NCBI
|
|
48
|
Wong CC, Wong CM, Tung EK, Au SL, Lee JM,
Poon RT, Man K and Ng IO: The microRNA miR-139 suppresses
metastasis and progression of hepatocellular carcinoma by
down-regulating Rho-kinase 2. Gastroenterology. 140:322–331. 2011.
View Article : Google Scholar : PubMed/NCBI
|