Introduction
Bone nonunion (BN) is a frequent complication
following bone fracture, occurring when fracture healing ceases
without suitable bone union (1–3).
While much research is required to fully elucidate the causes of BN
(4), the rate of BN incidence
continues to rise, with ≤10% of bone fracture patients estimated to
have suffered from BN (5). It is
thus vital that BN, or the risk thereof, be accurately identified
in a timely manner, which will prevent disease progression and
afford the best chance of an optimal outcome for fracture
patients.
MicroRNAs (miRNAs/miRs), are short, noncoding
single-stranded RNAs that regulate gene expression, and their roles
as regulators of BN pathogenesis has been reported (6,7). For
example, one study found that miR-367-5p downregulation promoted
the proliferation of osteoblasts in a model of microgravity-induced
bone healing. These same researchers also determined that the gap
junction structural protein pannexin-3 is a miR-367-5p target
(8). Indeed, there is robust
evidence that the expression of specific miRNAs is linked to the
occurrence of BN (9–11). However, the exact molecular
mechanisms by which miRNAs influence gene expression, and thereby
regulate BN pathogenesis, remain incompletely understood, and as
such, must be further studied in order to better prevent, treat and
diagnose BN.
Microarrays have been widely used to explore the
pathogenic processes governing the development of a wide range of
diseases, making them invaluable for functional genomic studies
(12,13). Several studies have employed
microarrays to detect genes associated with BN-related processes,
identifying a range of relevant proteins including lysyl oxidase
like-2, chondroitin sulfate proteoglycan, aggrecan and collagen
α-1(II) chain (14,15). These differentially expressed genes
(DEGs) are associated with the altered expression of proteins that
have key structural and functional roles in this context, leading
to their regulation of BN progression.
Using microarray datasets analyzed via Gene Ontology
(GO) and Kyoto Encyclopedia of Genes and Genomes (KEGG) pathway
enrichment analyses, the present study sought to identify both DEGs
and differentially expressed miRNAs (DEMs) associated with the
progression of BN.
Materials and methods
Data collection
The Gene Expression Omnibus (GEO) repository
(National Center for Biotechnology Information) was reviewed to
identify and obtain relevant datasets for the analysis of DEGs and
DEMs. For DEGs, dataset GSE494 was downloaded, which was derived
from the GPL8300 (HG_U95Av2) Affymetrix Human Genome U95 Version 2
Array platform. This dataset comprises four bone tissue samples,
with two samples from BN patients and two from normal controls.
Dataset GSE93390 was downloaded to identify DEMs, which was derived
from the GPL14613 (miRNA-2) Affymetrix Multispecies miRNA-2 Array
platform (16). This dataset
contained miRNA expression levels for bone tissue samples from two
BN patients and five normal controls.
Differential expression analysis
First, the Morpheus online tool (https://software.broadinstitute.org/morpheus/) was
used to review the retrieved datasets, generating heat maps as a
means of assessing overall changes in gene or miRNA expression and
categorizing patients into BN and control groups. The GEO2R tool
was subsequently used to identify DEGs and DEMs in patients with
BN, based on the following criteria: P<0.05 and a fold-change of
log2≥1. Links to the GEO2R tools used for these analyses
are as follows: https://www.ncbi.nlm.nih.gov/geo/geo2r/?acc=GSE93390
and https://www.ncbi.nlm.nih.gov/geo/geo2r/?acc=GSE494.
Protein-protein interaction (PPI)
network and module analyses
The Search Tool for the Retrieval of Interacting
Genes (v10.0; http://www.string-db.org/) was used to predict PPI
pairs, followed by Cytoscape v3.7.1 (www.cytoscape.org/) to generate a PPI network for the
identified DEGs. Node scores within this network were based on the
degree of centrality, and nodes with higher scores were thus those
more likely to be important within the PPI network, with the
highest score indicating a hub protein within the network.
Significant PPI network modules were then identified via the
Molecular Complex Detection (MCODE) Cytoscape plugin (version
1.4.2; http://apps.cytoscape.org/apps/mcode), with a degree
cutoff ≥2 and k-core ≥3.
Identification of DEM target
genes
Next, miRDB (version 1.0; http://mirdb.org) was employed for DEM target gene
prediction, followed once again by Cytoscape, to construct a
DEM-target gene regulatory network. To identify points of overlap,
the GSE494 DEGs were then overlaid with the target genes of the
DEMs identified from GSE93390.
Functional enrichment analysis
Using the Database for Annotation, Visualization and
Integrated Discovery tool v6.8 (http://david.abcc.ncifcrf.gov/), GO and KEGG pathway
were both performed on all DEGs, module DEGs, and DEM target genes.
P<0.05 was the significance threshold.
Ethics approval
All experiments involving animals were conducted in
compliance with the Guide for the Care and Use of Laboratory
Animals by International Committees. The present study was approved
by the Committees of Clinical Ethics in Tongji Medical College,
Huazhong University of Science and Technology (Wuhan, China;
2016-049-83).
Femoral fracture models
A total of 20 male C57BL/6J mice (age, 8 weeks;
weight, 20–25 g) were obtained from the Center of Experimental
Animals (Tongji Medical College, Huazhong University of Science and
Technology) in accordance with protocols approved by the Tongji
Institutional Animal Care and Use Committee. Mice were single-caged
and housed at room temperatures of 18°C with a 12/12 h light-dark
cycle. The mice had free access to water and were fed a chow diet.
Animals were anesthetized using an intraperitoneal injection (i.p.)
of 10% chloral hydrate (300 mg/kg body weight) was used for
anesthesia via i.p., injection, after which no signs of
peritonitis, pain or discomfort were observed. A longitudinal
incision was created as in a previous study (17), and blunt separation of the
underlying muscles (without removal of the periosteum) was
performed to construct a mouse femoral fracture model. Transverse
osteotomy of the femur was performed in the mid-diaphysis region
using a diamond disk These fractures were then stabilized via a
23-gauge intramedullary needle. On days 14 and 21 days
post-surgery, the mice were anesthetized with an i.p. injection of
10% chloral hydrate (300 mg/kg body weight), and then sacrificed by
cervical dislocation, after which the callus was harvested for
subsequent analysis.
Blood collection
From June 2016 to September 2018, peripheral blood
samples from patients in Wuhan Union Hospital (6 healthy
volunteers, 6 bone union patients and 6 BN patients) were collected
1 day and 3 days post-surgery for determination of miRNA and mRNA
levels. Patient characteristics are shown in Table SI. The patient studies were
approved by the Committees of Clinical Ethics in the Union Hospital
(Tongji Medical College, Huazhong University of Science and
Technology), and informed consent was obtained from all
participants.
Microcomputed tomography (mircoCT)
analysis
The fracture site was scanned using the SkyScan 1276
scanner microCT system (Bruker Corporation) to provide images at
2,400 views, 5 frames/view, 37 kV, and 121 mA, and these images
were then analyzed with Bruker micro-CT evaluation software
(Version 1.15.4.0; Bruker Corporation) to determine segmentation,
three-dimensional morphometric analysis, density, and the following
distance parameters: Bone volume (BV), tissue volume (TV), BV/TV
and bone mineral density (BMD).
Cell culture and transfection
Human mesenchymal stem cells (hMSCs) were donated
from the Orthopedic Laboratory of Tongji Medical College, Huazhong
University of Science and Technology, and were cultured, in F12
media (Gibco; Thermo Fisher Scientific, Inc.) with 10% fetal bovine
serum (Gibco; Thermo Fisher Scientific, Inc.) and 1%
penicillin/streptomycin (all Gibco; Thermo Fisher Scientific,
Inc.). hMSCs were transfected with 20 µM agomiR-193a-3p or
antagomiR-193a-3p (Shanghai GenePharma Co., Ltd.) using
Lipofectamine® 3000 (Thermo Fisher Scientific, Inc.),
according to manufacturer's protocol. Lipofectamine®
3000 was also used to transfect cells with miRNAs or small
interfering (si)RNA oligos. Mitogen-activated protein kinase 10
(MAPK10) siRNAs (Guangzhou RiboBio Co., Ltd.) were transfected at
50 nM. Then, 48 h after transfection, cells were collected for
western blotting or reverse transcription-quantitative PCR
(RT-qPCR). The sequences of siRNA MAPK10, agomiR- or anagomiR- were
as follows: MAPK10 sense, 5′-CGCCAUCUAUGACAGUAAATT-3′ and
antisense, 5′-UUUACUGUCAUAGAUGGCGTT-3′; AntagomiR,
5′-ACUGGGACUUUGUAGGCCAGUU-3′; AgomiR-193a-3p sense,
5′-AACUGGCCUACAAAGUCCCAGU-3′ and antisense strand,
5′-ACUGGGACUUUGUAGGCCAGUU-3′. AgomiR- was composed of
double-stranded RNA with no chemical modifications. The 3′ ends of
the antagomiR and agomiR oligo nucleotides were conjugated to
cholesterol, and all the bases were 2′-O methylated. The agomiRs,
antagomiRs and siRNAs transfection kits (cat. nos. G04001, B05002
and B06002) were supplied by Shanghai GenePharma Co., Ltd.
RT-qPCR
TRIzol® reagent (Thermo Fisher
Scientific, Inc.) was used to isolate total RNA from cell and
tissue samples. The purified RNA was then reverse transcribed into
cDNA using the ReverTra Ace® qPCR RT Master Mix (Toyobo
Life Science), according to the manufacture's protocol. RT reaction
was conducted for 15 min at 42°C, followed by 5 min at 98°C and the
reaction volume was 20 µl. The qPCR thermocycling conditions were:
Intital denaturation at 95°C for 30 sec; 40 cycles at 95°C for 5
sec and 60°C for 30 sec, and the reaction volume was 25 µl. GAPDH
served as an internal control. Relative miRNA expression levels
were normalized to those of the internal control (GAPDH) and were
calculated according to the 2−∆∆Cq method (18) All experiments were conducted in
triplicate and the primer sequences are displayed in Table I.
 | Table I.miRNAs and mRNA primer sequence. |
Table I.
miRNAs and mRNA primer sequence.
| miRNAs or gene
name | Primer sequence
(5′→3′) |
|---|
|
hsa-miR-193a-3p-Forward |
ACACTCCAGCTGGGAACTGGCCTACAAAGT |
|
hsa-miR-193a-3p-Reverse |
TGGTGTCGTGGAGTCG |
|
H-miR-U6-Forward |
CTCGCTTCGGCAGCACA |
|
H-miR-U6-Reverse |
AACGCTTCACGAATTTGCGT |
|
hsa-MAPK10-Forward |
CCAAGTATGCGGGACTCACCT |
|
hsa-MAPK10-Reverse |
GGCTTGGCTGGCTTTGAGTT |
|
hsa-ALP-Forward |
GCTCTGGAAAGTCCTTCAAAGC |
|
hsa-ALP-Reverse |
TCTTCTTCCCTGGACACTGCC |
|
hsa-COL1A1-Forward |
TGGCAAAGATGGACTCAACG |
|
hsa-COL1A1-Reverse |
TCACGGTCACGAACCACATT |
|
hsa-OCN-Forward |
TCACACTCCTCGCCCTATTG |
|
hsa-OCN-Reverse |
CTCCTGAAAGCCGATGTGGT |
|
hsa-Runx2-Forward |
CTACTATGGCACTTCGTCAGGAT |
|
hsa-Runx2-Reverse |
ATCAGCGTCAACACCATCATT |
|
H-GAPDH-Forward |
GGAAGCTTGTCATCAATGGAAATC |
|
H-GAPDH-Reverse |
TGATGACCCTTTTGGCTCCC |
Western blotting
The cells were washed three times with PBS three
times and radio immunoprecipitation assay lysis buffer (Aspen
Pharmacare Holdings Ltd.; cat. no. AS1004) was used to extract the
total proteins from cells. Cell lysates (1×10⁴) were
subjected to 10% SDS-PAGE followed by determination of protein
concentration by the bicinchoninic acid method. The proteins (50
µg) were then transferred onto a 10% SDS-PVDF membrane. The PVDF
membrane was blocked by 5% bovine serum albumin (Abcam) at room
temperature for 2 h. A chemiluminescence detection system (Canon,
Inc.; cat. no. LiDE110) was then used to visualize proteins based
on the provided instructions. Antibodies used were as follows:
Anti-collagen I (1:500; Abcam; cat. no. ab34710), anti- alkaline
phosphatase (ALP; 1:1,000; Abcam; cat. no. ab95462),
anti-Osteocalcin (OCN; 1:500; Abcam; cat. no. ab93876),
anti-Runt-related transcription factor 2 (Runx2; 1:500; Abcam; cat.
no. ab23981) and anti-GAPDH (1:10,000; Abcam; cat. no. ab37168).
All experiments were conducted in triplicate.
Luciferase reporter assay
The position 596–602 of 3′UTR of MAPK10 mRNA
containing the putative target site of miR-193a-3p was determined
by TargetScan (version 7.0; http://www.targetscan.org/vert_70/), and amplified by
the same steps as mentioned above from the cDNA of hMSCs and
ligated into the pGL3-basic vector (Promega Corporation).
pGL3-MAPK10-3′UTR-mutant (Mut) was created by introducing two site
mutations into miR-193a-3p potential target sites using Quick
ChangeSite-Directed Mutagenesis kits (Agilent Technologies, Inc.).
pGL3-MAPK10-3′UTR-wild-type (W; 200 ng) or pGL3-MAPK10-3′UTR-Mut
(200 ng) was co-infected with Renilla plasmid into hMSCs
using Lipofectamine® 3000 (Thermo Fisher Scientific,
Inc.). This was followed by transfection of miR-NC mimic (10 nM) or
miR-193a-3p mimic (10 nM) for 48 h at 37°C. The miR-NC mimic and
miR-193a-3p mimic transfection kits (cat. nos. B05002 and B06002)
were supplied by Shanghai GenePharma Co., Ltd. The sequence of
miR-193a-3p mimic is as follow: sense, 5′-AACUGGCCUACAAAGUCCCAGU-3′
and antisense, 5′-ACUGGGACUUUGUAGGCCAGUU-3′. The Dual-Luciferase
Reporter assay system (Promega Corporation) was used to measure the
relative luciferase activity of each well. The firefly luciferase
expression was normalized to Renilla.
Therapeutic stimulation with
miR-193a-3p in fracture mice
A total of 20 mice were randomly divided into 3
groups, including a control group (injected locally with PBS), an
agomiR-193a-3p group (injected with 100 µl agomiR-193a-3p) and an
antagomiR-193a-3p group (injected with 100 µl antagomiR-193a-3p).
Each group was injected at the fracture site and injections were
administered on days 1, 3, and 7 post-surgery.
Statistical analysis
GraphPad Prism 8.0 (GraphPad Software, Inc.) was
used to conduct all analyses and the data are presented as the mean
± standard deviation. The Student's t-test was used to compare two
groups of data, whereas ≥3 groups were compared using one-way
analysis of variance with Tukey's post-hoc test. P<0.05 was
considered to indicate a statistically significant difference. All
experiments were performed three times.
Results
DEG identification
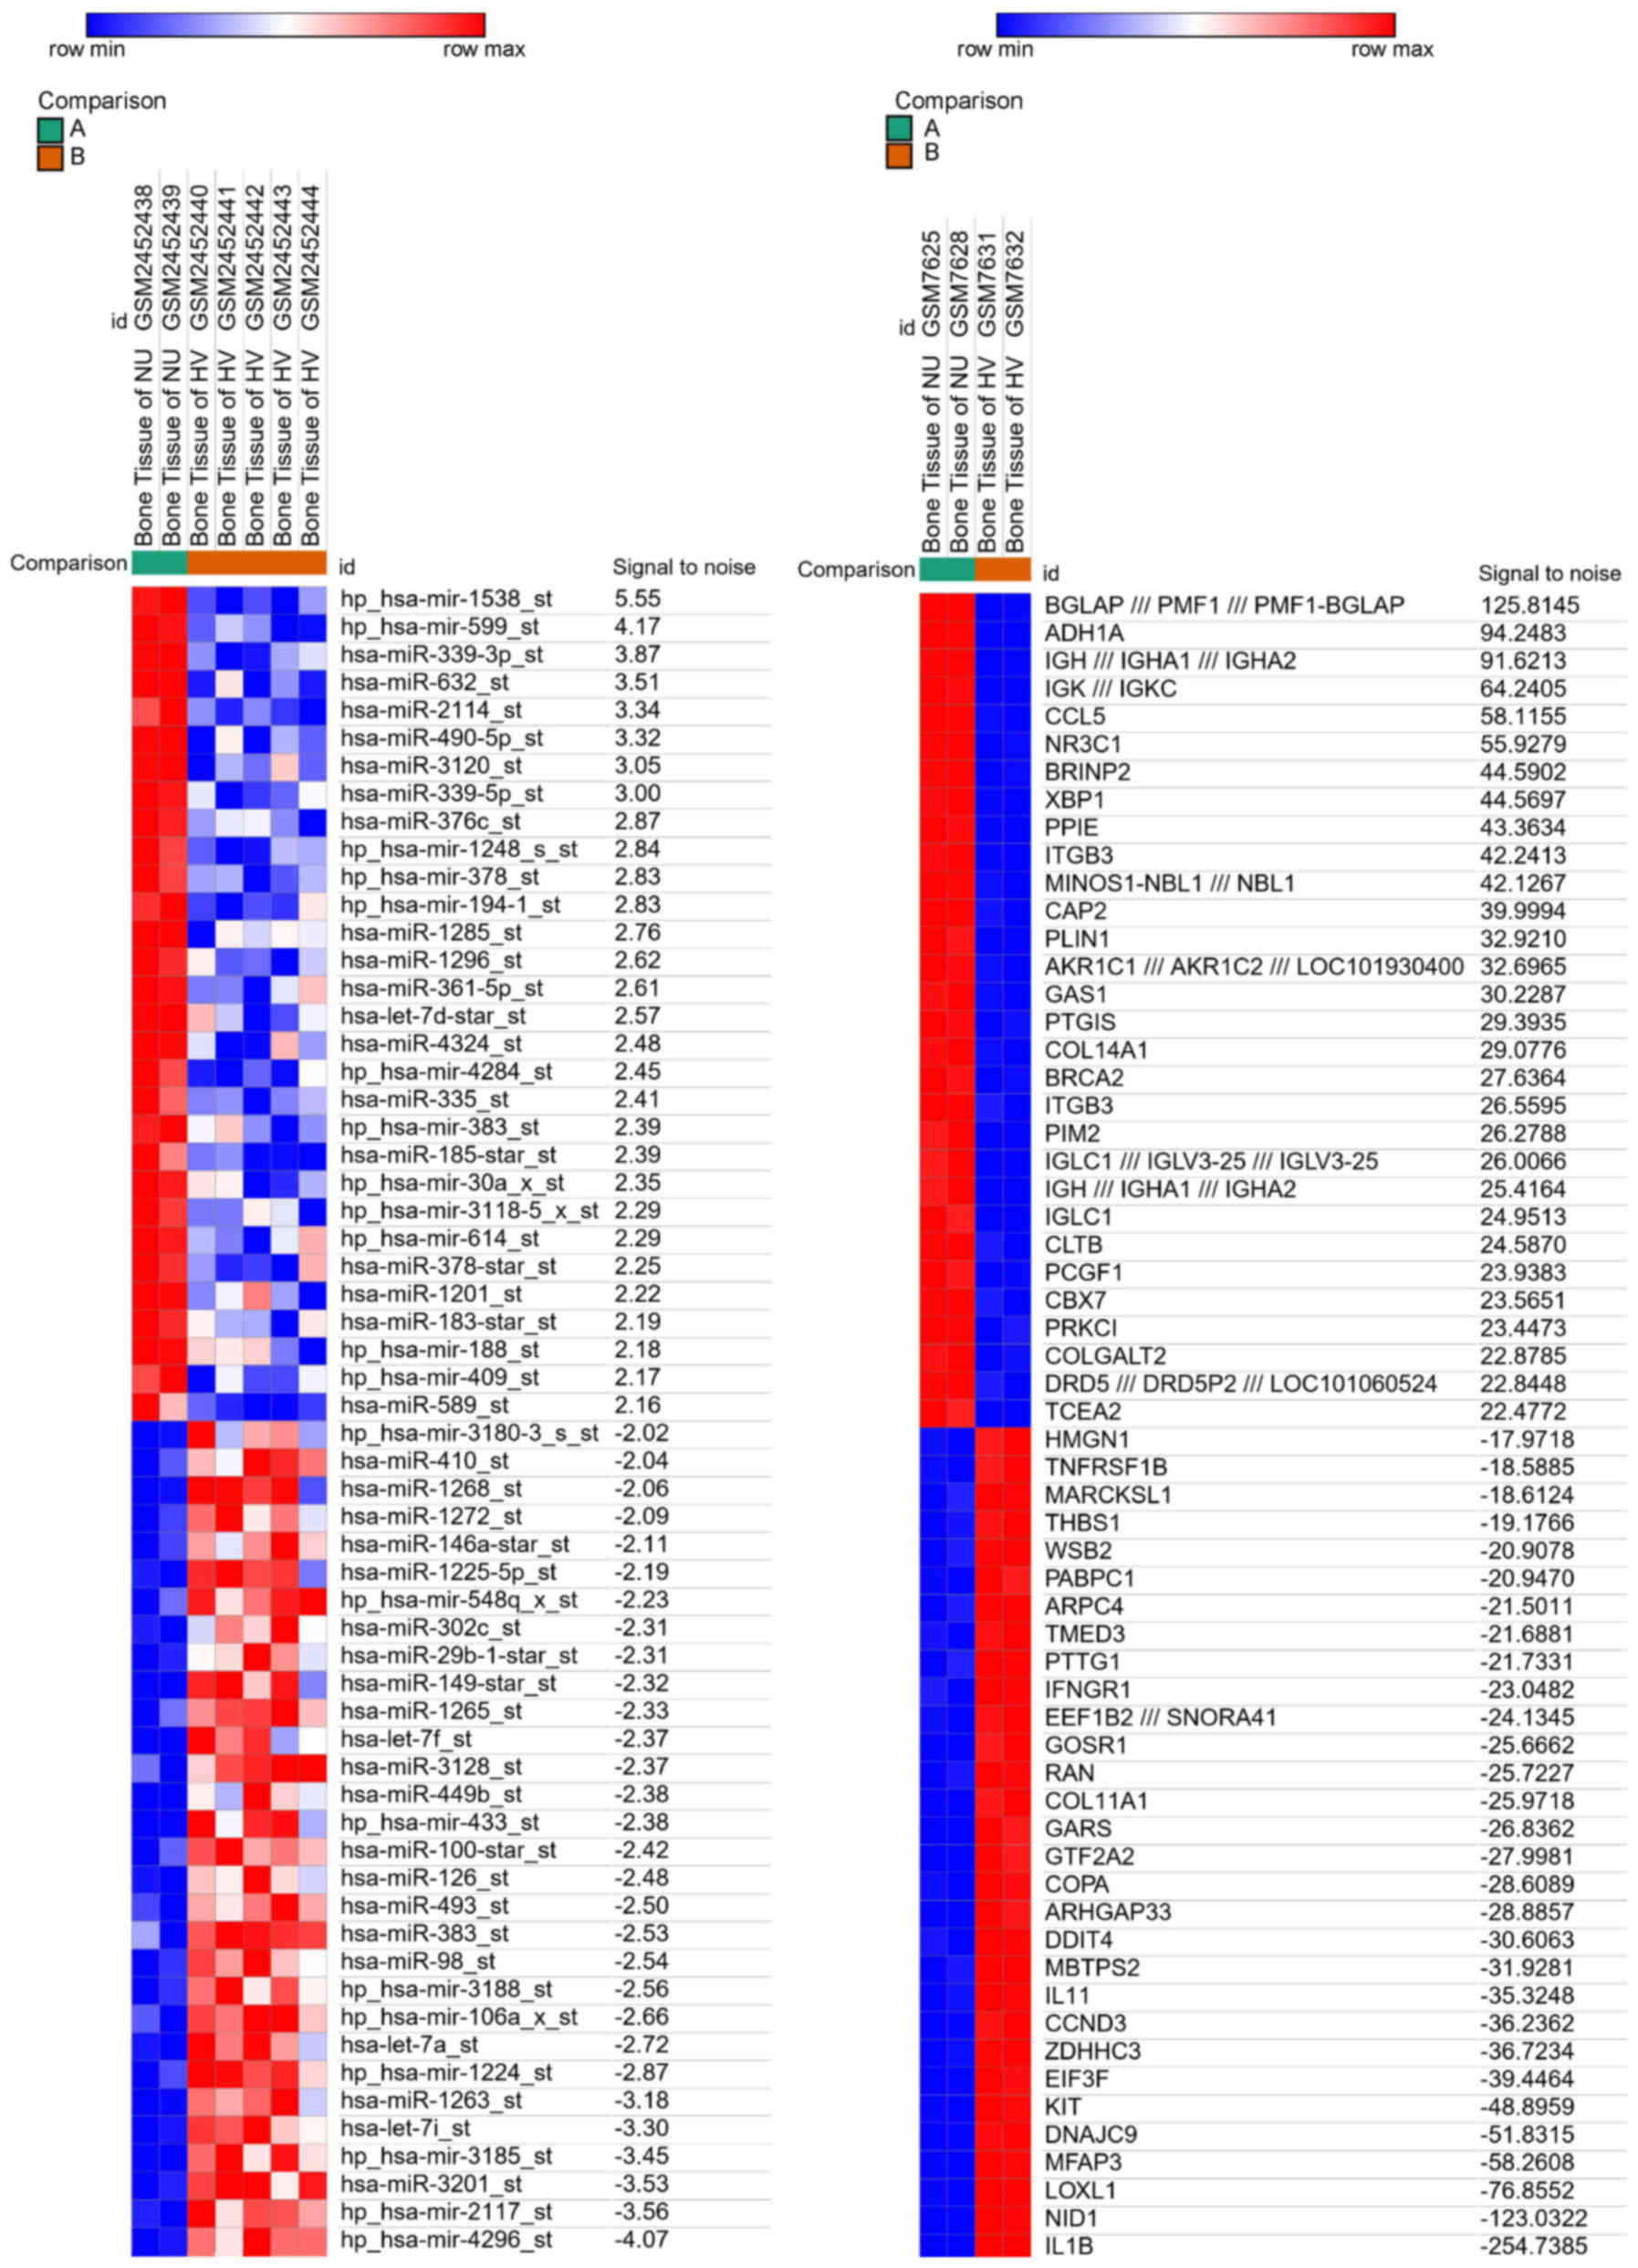
Across the two datasets analyzed in the present
study, a total of 4 BN patients and 7 control patient samples were
analyzed. The Morpheus software was used to independently assess
the gene expression profiles of these samples and the resultant DEG
heat maps of the 30 top upregulated and downregulated genes in BN
patients are shown in Fig. 1.
GO enrichment analysis
GO analysis revealed that the upregulated DEGs in
patients with BN were associated with processes pertaining to the
promotion of cell proliferation, cell responses to chemical stimuli
and lymphocyte differentiation. By contrast, downregulated DEGs
were associated with processes including ‘phagocytosis’, ‘bacterial
responses’, ‘responses to biotic stimuli’, ‘humoral immune
responses’ and ‘extracellular matrix organization’ (Table II).
| Table II.GO analysis of upregulated and
downregulated differentially expressed genes in biological
processes. |
Table II.
GO analysis of upregulated and
downregulated differentially expressed genes in biological
processes.
| A, Upregulated |
|---|
|
|---|
| Term | Function | Count | P-value |
|---|
| GO:0042127 | Regulation of cell
population proliferation | 13 |
3.20×10⁻⁶ |
| GO:0008284 | Positive regulation
of cell population proliferation | 9 |
1.10×10⁻⁶ |
| GO:0070887 | Cellular response
to chemical stimulus | 16 |
1.40×10⁻⁶ |
| GO:0008283 | Cell
proliferation | 13 |
1.60×10⁻⁵ |
| GO:0045621 | Positive regulation
of lymphocyte differentiation | 4 |
1.10×10⁻⁵ |
|
| B,
Downregulated |
|
| Term |
Function | Count | P-value |
|
| GO:0006910 | Phagocytosis,
recognition | 6 |
4.70×10⁻⁷ |
| GO:0009617 | Response to
bacterium | 14 |
8.30×10⁻⁷ |
| GO:0009607 | Response to biotic
stimulus | 17 |
1.30×10⁻⁶ |
| GO:0006959 | Humoral immune
response | 10 |
1.70×10⁻⁶ |
| GO:0030198 | Extracellular
matrix organization | 11 |
2.40×10⁻⁶ |
KEGG pathway enrichment analysis
A KEGG pathway analysis revealed that the
upregulated DEGs were those associated with cytokines, the
toll-like receptor and TNF signaling pathways. By contrast,
downregulated DEGs were primarily associated with pathways
including ‘ECM-receptor interaction’, ‘focal adhesion’ and ‘calcium
signaling pathways’ (Table
III).
| Table III.KEGG pathway analysis of upregulated
and downregulated differentially expressed genes. |
Table III.
KEGG pathway analysis of upregulated
and downregulated differentially expressed genes.
| A, Upregulated |
|---|
|
|---|
| Pathway ID | Name | Count | P-value | Genes |
|---|
| hsa04060 | Cytokine-cytokine
receptor interaction | 5 |
6.0×10⁻⁴ | CCL20, CXCL11,
CXCL8, MPL, OSM |
| hsa04620 | Toll-like receptor
signaling pathway | 3 |
1.4×10⁻⁴ | CXCL11, PTGS2,
MAPK8 |
| hsa04668 | TNF signaling
pathway | 3 |
1.4×10⁻⁴ | CCL20, PTGS2,
MAPK8 |
|
| B,
Downregulated |
|
| Pathway
ID | Name | Count | P-value | Genes |
|
| hsa04512 | ECM-receptor
interaction | 6 |
6.9×10⁻⁵ | CD47, COMP, CHAD,
COL4A3, LAMC2, THBS4 |
| hsa04510 | Focal adhesion | 6 |
3.6×10⁻³ | COMP, CHAD, COL4A3,
LAMC2, MYLPF, THBS4 |
| hsa04020 | Calcium signaling
pathway | 5 |
1.2×10⁻² | ATP2A1, CD38, GRM5,
TRHR, TNNC2 KEGG |
PPI network analysis
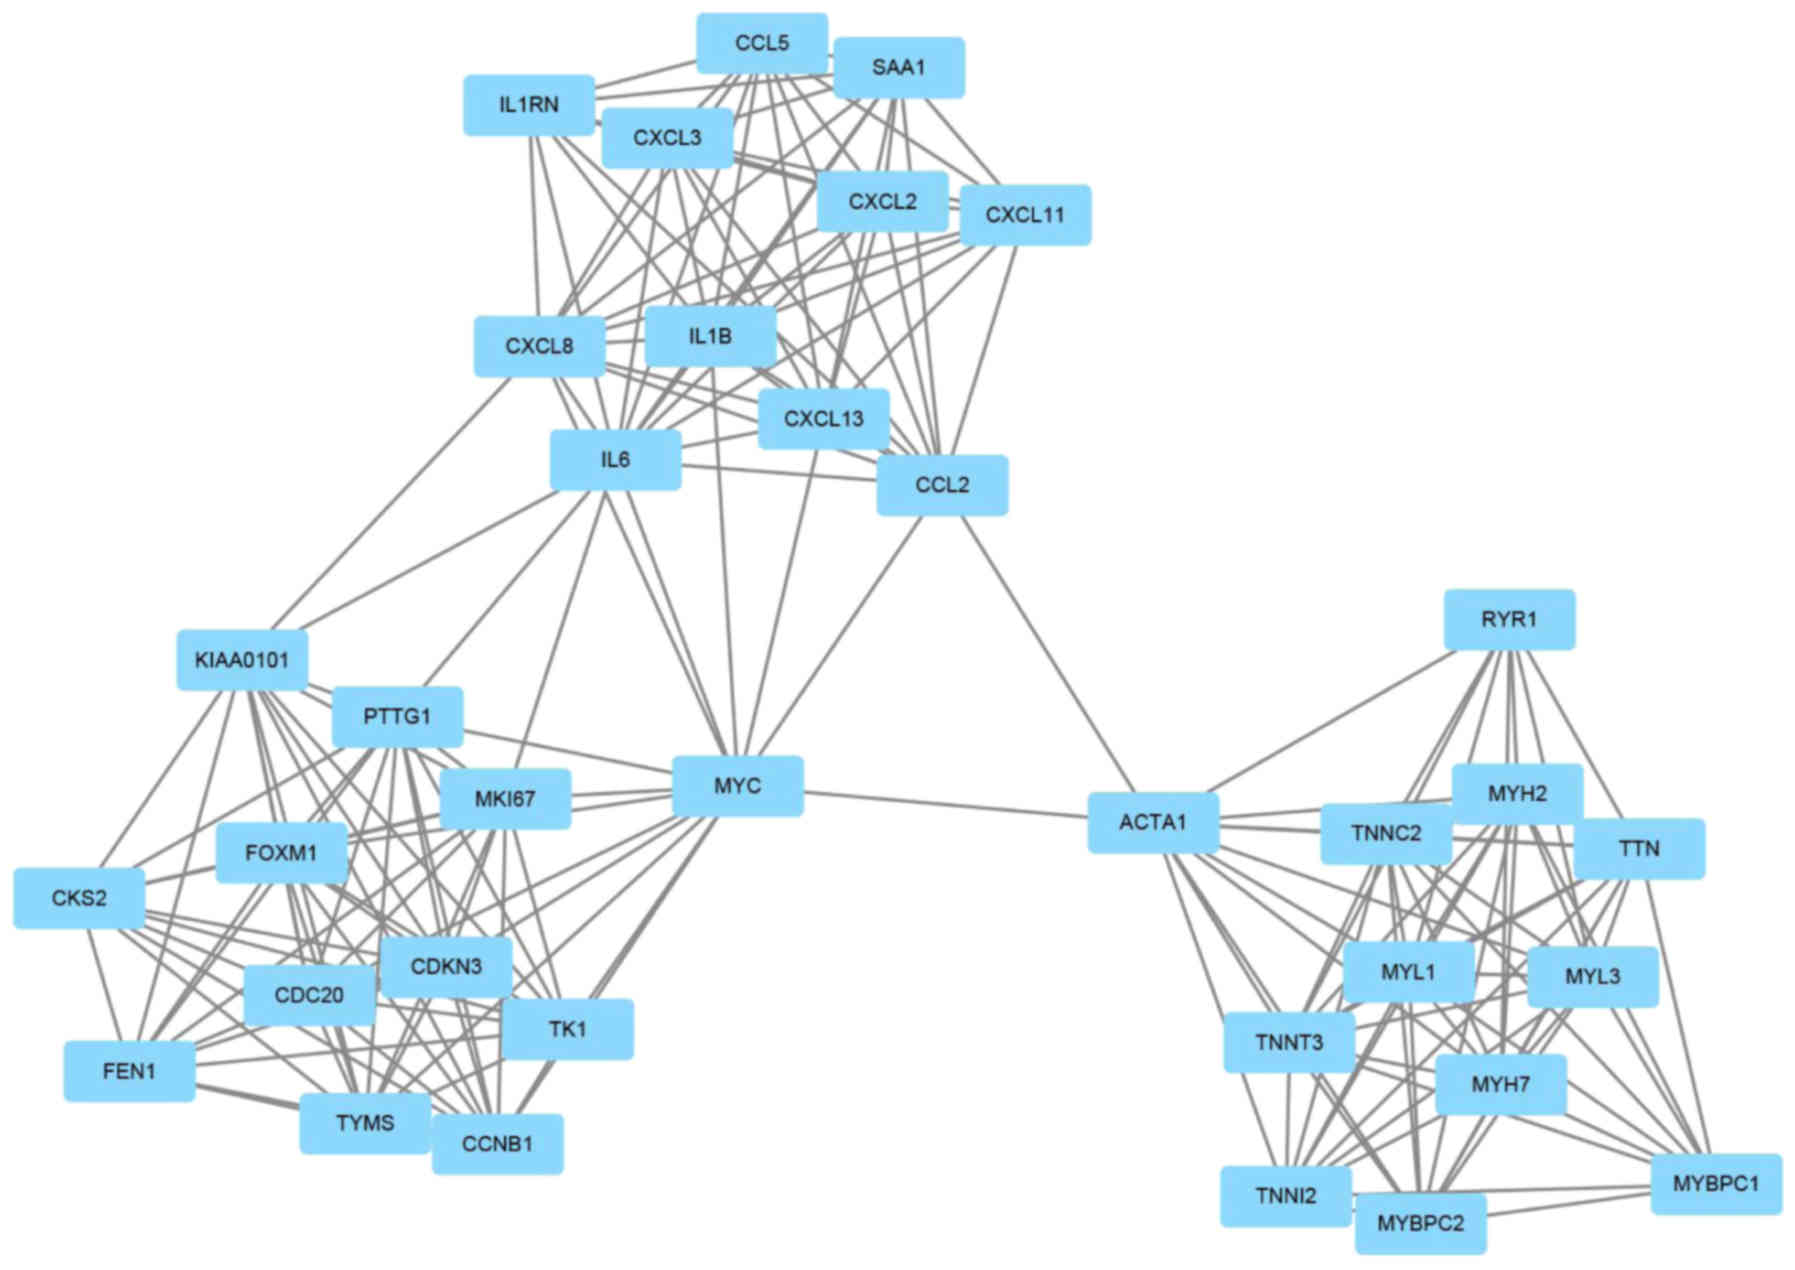
When the identified DEGs were analyzed, a total of
637 PPI pairs which were subsequently predicted to exist and these
pairs were used in order to construct a PPI network; hub genes were
then identified based on their location and degree of interaction
within the network. Furthermore, 3 significant functional modules
within this PPI network were further screened (Fig. 2). Enriched genes within module 1
included: CDKN3, RYR1, CXCL11, CCL2, KIAA0101, SAA1, CXCL2, IL1RN,
IL6, CXCL8, CCL5, TTN, MYL1, MYH7, MYL3, IL1B, MYH2, TK1, TYMS,
FOXM1, TNNI2, ACTA1, CXCL13, PTTG1, MYC, CKS2, MKI67, CCNB1, CDC20,
TNNT3, TNNC2, CXCL3, FEN1, MYBPC1 and MYBPC2 (Table IV). Functional and pathway
enrichment analyses of the genes were also performed (Table V).
| Table IV.Three modules from the
protein-protein interaction network satisfied the criteria of MCODE
scores ≥4 and number of nodes >4. |
Table IV.
Three modules from the
protein-protein interaction network satisfied the criteria of MCODE
scores ≥4 and number of nodes >4.
| Cluster | Score | Nodes | Edges | Node IDs |
|---|
| 1 | 11.118 | 35 | 189 | CDKN3, RYR1,
CXCL11, CCL2, KIAA0101, SAA1, CXCL2, IL1RN, IL6, CXCL8, CCL5, TTN,
MYL1, MYH7, MYL3, IL1B, MYH2, TK1, TYMS, FOXM1, TNNI2, ACTA1,
CXCL13, PTTG1, MYC, CKS2, MKI67, CCNB1, CDC20, TNNT3, TNNC2, CXCL3,
FEN1, MYBPC1, MYBPC2 |
| 2 | 4.4 | 6 | 11 | CILP, COL2A1, COMP,
PRG4, MATN4, COL11A1 |
| 3 | 3 | 3 | 3 | HMOX1, FOS,
SERPINE1 |
| Table V.Functional and pathway enrichment
analysis of the genes in module. |
Table V.
Functional and pathway enrichment
analysis of the genes in module.
| A, Biological
processes |
|---|
|
|---|
| Term | Name | Count | P-value | Genes |
|---|
| GO:0002690 | Positive regulation
of leukocyte chemotaxis | 9 |
1.6×10⁻¹¹ | CCL5, CXCL11,
CXCL13, CXCL8, CCL2, CXCL2, CXCL3, SERPINE1 |
| GO:0019221 | Cytokine-mediated
signaling pathway | 12 |
2.90×10⁻¹⁰ | CCL5, CXCL11,
CXCL13, CXCL8, CCL2, CXCL2, CXCL3, IL1B, IL1RN, IL6 |
| GO:0032103 | Positive regulation
of response to external stimulus | 10 |
3.10×10⁻⁹ | CCL5, CXCL11,
CXCL13, CXCL8, CCL2, CXCL2, CXCL3, IL6, SERPINE1 |
|
| B, Molecular
functions |
|
| Term | Name | Count | P-value | Genes |
|
| GO:0005125 | Cytokine
activity | 12 |
1.70×10⁻¹² | CCL5, CXCL11,
CXCL13, CXCL8, CCL2, CXCL2, CXCL3, IL1B, IL1RN, IL6 |
| GO:0005126 | Cytokine receptor
binding | 12 |
4.60×10⁻¹² | CCL5, CXCL11,
CXCL13, CXCL8, CCL2, CXCL2, CXCL3, IL1B, IL1RN, IL6 |
| GO:0008009 | Chemokine
activity | 8 |
1.20×10⁻¹¹ | CCL5, CXCL11,
CXCL13, CXCL8, CCL2, CXCL2, CXCL3 |
|
| C, KEGG
pathways |
|
| Term | Name | Count | P-value | Genes |
|
| hsa04668 | TNF signaling
pathway | 8 |
1.60×10⁻⁷ | FOS, IL6, CCL2,
CXCL3, CXCL2, IL1B, CCL5 |
| hsa04620 | Toll-like receptor
signaling pathway | 7 |
2.30×10⁻⁷ | FOS, IL6, IL1B,
CXCL8, CCL5, CXCL11 |
| hsa04062 | Chemokine signaling
pathway | 8 |
7.10×10⁻⁷ | CCL2, CXCL13,
CXCL3, CXCL2, CXCL8, CCL5, CXCL11 |
Identification of DEMs
the GEO2R tool was used to identify DEMs in BN
patients, based on the following criteria: P<0.05 and a
fold-change of log2≥1. They were sorted in descending order of the
absolute value of logFC. A total of 20 DEMs, including top 10 that
were upregulated (hsa-miR-129-5p, hsa-miR-1225-5p, hsa-miR-98,
hsa-miR-149, hsa-miR-29b, hsa-miR-1263, hsa-miR-3185, hsa-miR-3128,
hsa-miR-3187 and hsa-miR-126-5p) and top 10 that were downregulated
(hsa-miR-199a-5p, hsa-miR-671-3p, hsa-miR-942, hsa-miR-335,
hsa-miR-339-5p, hsa-miR-339-3p, hsa-miR-193a-3p, hsa-miR-504,
hsa-miR-199b-5p and hsa-miR-345) were identified when BN tissue
samples were compared with those of the controls (Table VI). Heat map analysis revealed
clear differences in the pattern of miRNA expression patterns
between patients with BN and the control group.
| Table VI.Differentially expressed miRNAs
between nonunion patients and healthy volunteers. |
Table VI.
Differentially expressed miRNAs
between nonunion patients and healthy volunteers.
| miRNA | logFC | P-value |
|---|
| hsa-miR-129-5p | 2.08 |
1.06×10⁻³ |
|
hsa-miR-1225-5p | 1.86 |
2.25×10⁻³ |
| hsa-miR-98 | 1.79 |
3.53×10⁻⁴ |
| hsa-miR-126-5p | 1.72 |
1.20×10⁻³ |
|
hsa-miR-149-star | 1.40 |
3.37×10⁻³ |
|
hsa-miR-29b-1-star | 1.37 |
1.50×10⁻³ |
| hsa-miR-1263 | 1.27 |
6.88×10⁻⁴ |
| hsa-mir-3185 | 1.15 |
6.19×10⁻⁴ |
| hsa-miR-3128 | 1.13 |
3.48×10⁻⁴ |
| hsa-miR-3187 | 1.03 |
3.04×10⁻³ |
|
hsa-miR-199a-5p | −2.28 |
2.96×10⁻³ |
| hsa-miR-671-3p | −1.71 |
1.11×10⁻³ |
| hsa-miR-942 | −1.70 |
1.31×10⁻³ |
| hsa-miR-335 | −1.60 |
1.08×10⁻⁴ |
| hsa-miR-339-5p | −1.47 |
4.68×10⁻⁴ |
| hsa-miR-339-3p | −1.28 |
2.60×10⁻⁴ |
|
hsa-miR-193a-3p | −1.19 |
9.31×10⁻⁴ |
| hsa-miR-504 | −1.15 |
3.92×10⁻⁴ |
|
hsa-miR-199b-5p | −1.14 |
2.87×10⁻³ |
| hsa-miR-345 | −1.13 |
3.46×10⁻³ |
DEM target prediction and functional
analysis
The miRDB database was used to identify 569
predicted DEM target genes and these target genes were then
subjected to GO and KEGG analyses as conducted for the
aforementioned DEGs (Table VII).
The target genes were found to be significantly enriched for the
following pathways and functions: ‘Negative regulation of
transcription by RNA polymerase II’, ‘positive regulation of
transcription’, ‘DNA-templated’, ‘axon guidance’, ‘the estrogen
signaling pathway’, ‘retrograde endocannabinoid signaling’, and
‘long-term potentiation’.
| Table VII.GO and KEGG pathways enrichment for
target genes of differentially expressed miRNAs. |
Table VII.
GO and KEGG pathways enrichment for
target genes of differentially expressed miRNAs.
| A, Biological
processes |
|---|
|
|---|
| Term | Name | Count | P-value | Genes |
|---|
| GO:0000122 | Negative regulation
of transcription by RNA polymerase II | 93 |
2.1×10⁻¹⁰ | ARID5B, BCL6, BCOR,
BEND3, BACH2, CTBP2, CGGBP1, CREBRF, DAB2IP, DCAF1, DNMT3A, DNAJB5,
EP300, ELK4, ETV3L, ETV6, JUNB, KLF11, KLF17, MAF, MXD4, MDM2,
MDM4, MLXIPL, MLX, NIPBL, OTUD7B, PHF12, PHF21A, PRDM1, PRDM5, RB1,
REL, SATB1, SMAD4, SP100, SOX11, SOX6, SP3, TAL1, TGIF2, WWC1,
WWTR1, ZFP90, ATF7IP, BPTF, CBX4, CBX6, CBX7, CIITA, CUX1, CDKN1C,
CPEB3, ESR1, FNIP2, FLCN, FST, FOXP2, HSBP1, HMGA2, HMGB1, HDAC9,
HIPK2, JARID2, KDM5A, MTDH, MECP2, MEF2A, NFIB, NFIC, NFKB1, NR4A2,
NFX1, PAX6, PIAS4, SIM2, SHH, TSHZ1, TSHZ2, THRB, TCF4, TBL1XR1,
TRIM33, USP9X, VEGFA, ZEB2, ZBTB20, ZBTB4, ZBTB7A, ZFHX3, ZNF280D,
ZNF281 |
| GO:0045893 | Positive regulation
of transcription, DNA-templated | 67 |
7.6×10⁻⁸ | CTCFL, CNBP, DAB2,
ELK3, ETS1, KLF6, KLF7, LHX2, MLXIPL, NAA15, NIF3L1, POU3F1, PIM2,
RORA, RB1, SMAD4, SP100, SOX11, SOX4, SP3, TAL1, WNT5A, ZFP90,
ATF5, ATF7IP, AR, BPTF, CREB5, CAMK4, CIITA, CLOCK, F2R, COL1A1,
CDKN1C, ERBB4, ESR1, FOXN3, FZD4, GRIP1, HMGA2, HIPK2, IGF1, IRF1,
LBH, KAT6B, KDM5A, KDM7A, KMT2A, MECP2, MAPK1, NFKB1, NFATC3,
NCOA1, PAX6, PHIP, RFX3, RET, RUNX1, SHH, TCF4, TFAP4, TBL1XR1,
ZFHX3, ZNF281, ZNF516, ZXDA |
| GO:0007411 | Axon guidance | 31 |
1.0×10⁻⁷ | EPHA8, EPHB2,
EPHB3, ETV1, KLF7, L1CAM, LHX2, SMAD4, SOS1, WNT5A, APBB2, ANK3,
BDNF, CNTN4, ENAH, KIF26A, MATN2, MAPK1, NTN1, NRXN1, NRXN3, NFASC,
PAX6, RPS6KA5, SEMA3A, EMA6A, SIAH1, SHH, UNC5C, UNC5D,
ZNF280D |
|
| B, KEGG
pathways |
|
| Term | Name | Count | P-value | Genes |
|
| hsa04915 | Estrogen signaling
pathway | 20 |
8.2×10⁻⁶ | ADCY1, ADCY2,
CCNL2, FKBP5, ESR1, CREB5, GABBR2, GRM1, ITPR1, ITPR2, MAPK1, GNAQ,
SOS1, SOS2, SHC1, PRKACB, PLCB2, PIK3R1, CALM1, SHC4 |
| hsa04723 | Retrograde
endocannabinoid signaling | 20 |
1.1×10⁻⁵ | GABRG1, ADCY1,
ADCY2, GNAI3, GABRA4, GABRA3, GABRB1, GRIA4, GRM1, ITPR1, PRCP,
ITPR2, GRM5, MAPK10, SLC17A6, GNAQ, MGLL, PRKACB, PLCB2,
CACNA1B |
| hsa04720 | Long-term
potentiation | 15 |
4.0×10⁻⁵ | ADCY1, GRIN2A,
GRM1, ITPR1, PRKCB, ITPR2, GRM5, MAPK1, EP300, CAMK4, GNAQ, CAMK2D,
PRKACB, PLCB2, CALM1 |
Integrated analysis of the DEG and DEM
datasets
When the DEGs and DEM target genes were compared, a
total of 9 common genes were identified between the two groups:
ZBTB20, Cyclin L2 (CCNL2), PTPN9, ERCC1, CRLF1, SHH, PRCP, MAPK10,
and MYH11 (Table VIII).
However, only three of these showed the inverse regulatory
relationships that one would expect for a miRNA-target gene pair:
hsa-miR-1225-5p (upregulated)-CCNL2 (downregulated), hsa-miR-339-5p
(downregulated)-PRCP (upregulated) and hsa-miR-193a-3p
(downregulated)-MAPK10 (upregulated) (Table VII).
| Table VIII.The genes of bone tissue and their
regulatory miRNAs. |
Table VIII.
The genes of bone tissue and their
regulatory miRNAs.
| miRNA name | Gene symbol |
|---|
| hsa-miR-129-5p |
ZBTB20 |
|
hsa-miR-1225-5p |
CCNL2 |
| hsa-miR-126-5p |
PTPN9 |
| hsa-mir-3185 |
ERCC1 |
|
hsa-miR-199a-5p |
CRLF1 |
| hsa-miR-671-3p |
SHH |
| hsa-miR-339-5p |
PRCP |
|
hsa-miR-193a-3p |
MAPK10 |
|
hsa-miR-199b-5p |
MYH11 |
miR-193a-3p exerts a negative effect
on osteoblast differentiation
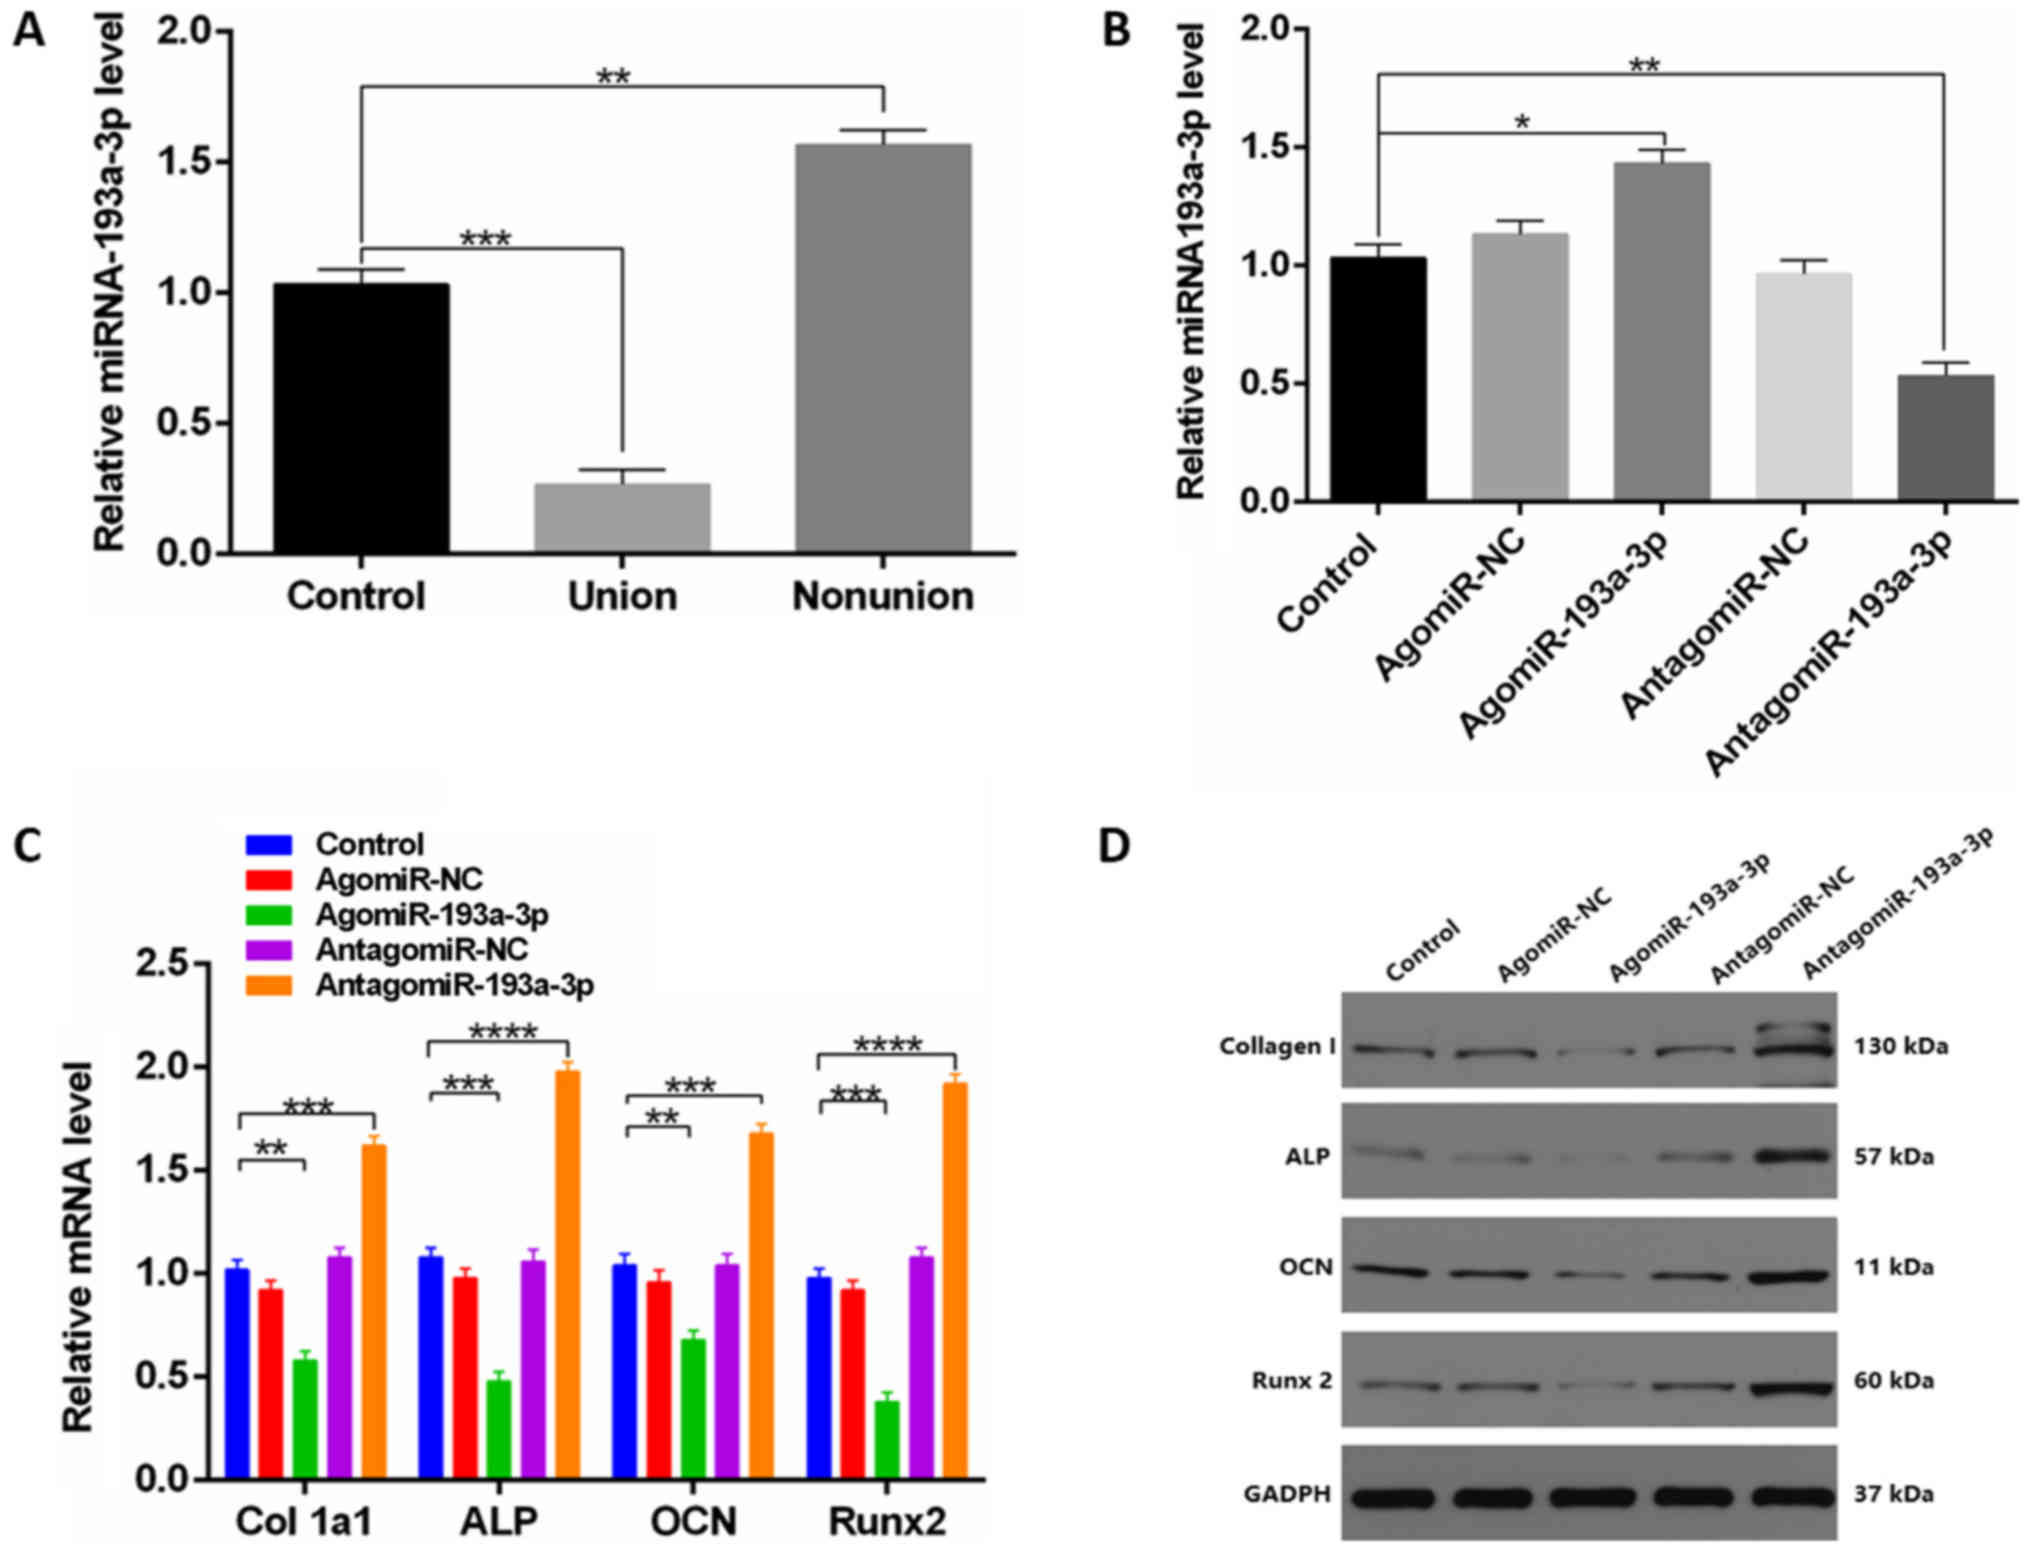
As miR-193a-3p has been previously linked to
cellular differentiation (17),
the expression of miR-193a-3p in the serum of 18 patients in 3
groups (control, union and nonunion) was investigated by RT-qPCR.
The results indicated that 72 h post-injury, miR-193a-3p levels in
BN group were increased compared with the other groups 72 h
post-injury (Fig. 3A).
Subsequently, the effect of miR-193a-3p on osteoblastogenesis was
evaluated and the level of miR-193a-3p was found to be
significantly upregulated in cells treated with agomiR-193a-3p
(Fig. 3B and Fig. S1). Furthermore, the effects of
miR-193a-3p were assessed in vitro, revealing a significant
increase in bone formation markers in the antagomiR-193a-3p group
(Fig. 3C and D).
miR-193a-3p directly targets
MAPK10
Next, in order to investigate the downstream targets
of miR-193a-3p, WT MAPK10 3′untranslated region (UTR) and Mut
MAPK10 3′UTR constructs were cloned into luciferase reporters for
use in a reporter assay, which revealed that agomiR-193a-3p, but
not the agomiR-NC, significantly decreased WT MAPK10 3′UTR reporter
activity (Fig. 4A). Moreover, to
explore the association between miR-193a-3p and MAPK10, MAPK10
expression levels were measured during osteoblastic
differentiation. In addition, serum samples were collected from
control, union or nonunion patients and they were analyzed via
RT-qPCR, which revealed clear MAPK10 downregulation in nonunion
patients relative to other groups (Fig. 4B). In vitro, lower relative
MAPK10 mRNA levels in the agomiR-193a-3p group were observed
compared with other groups (Fig.
4C). Furthermore, to test whether osteoblast differentiation
was MAPK10-dependent, the effect of a MAPK10-specific siRNA on
osteoblastogenesis was evaluated. RT-qPCR and western blotting
analysis indicated that siRNA-MAPK10 downregulated Col1-a1, ALP,
OCN, and Runx2 (Fig. 4D and
E).
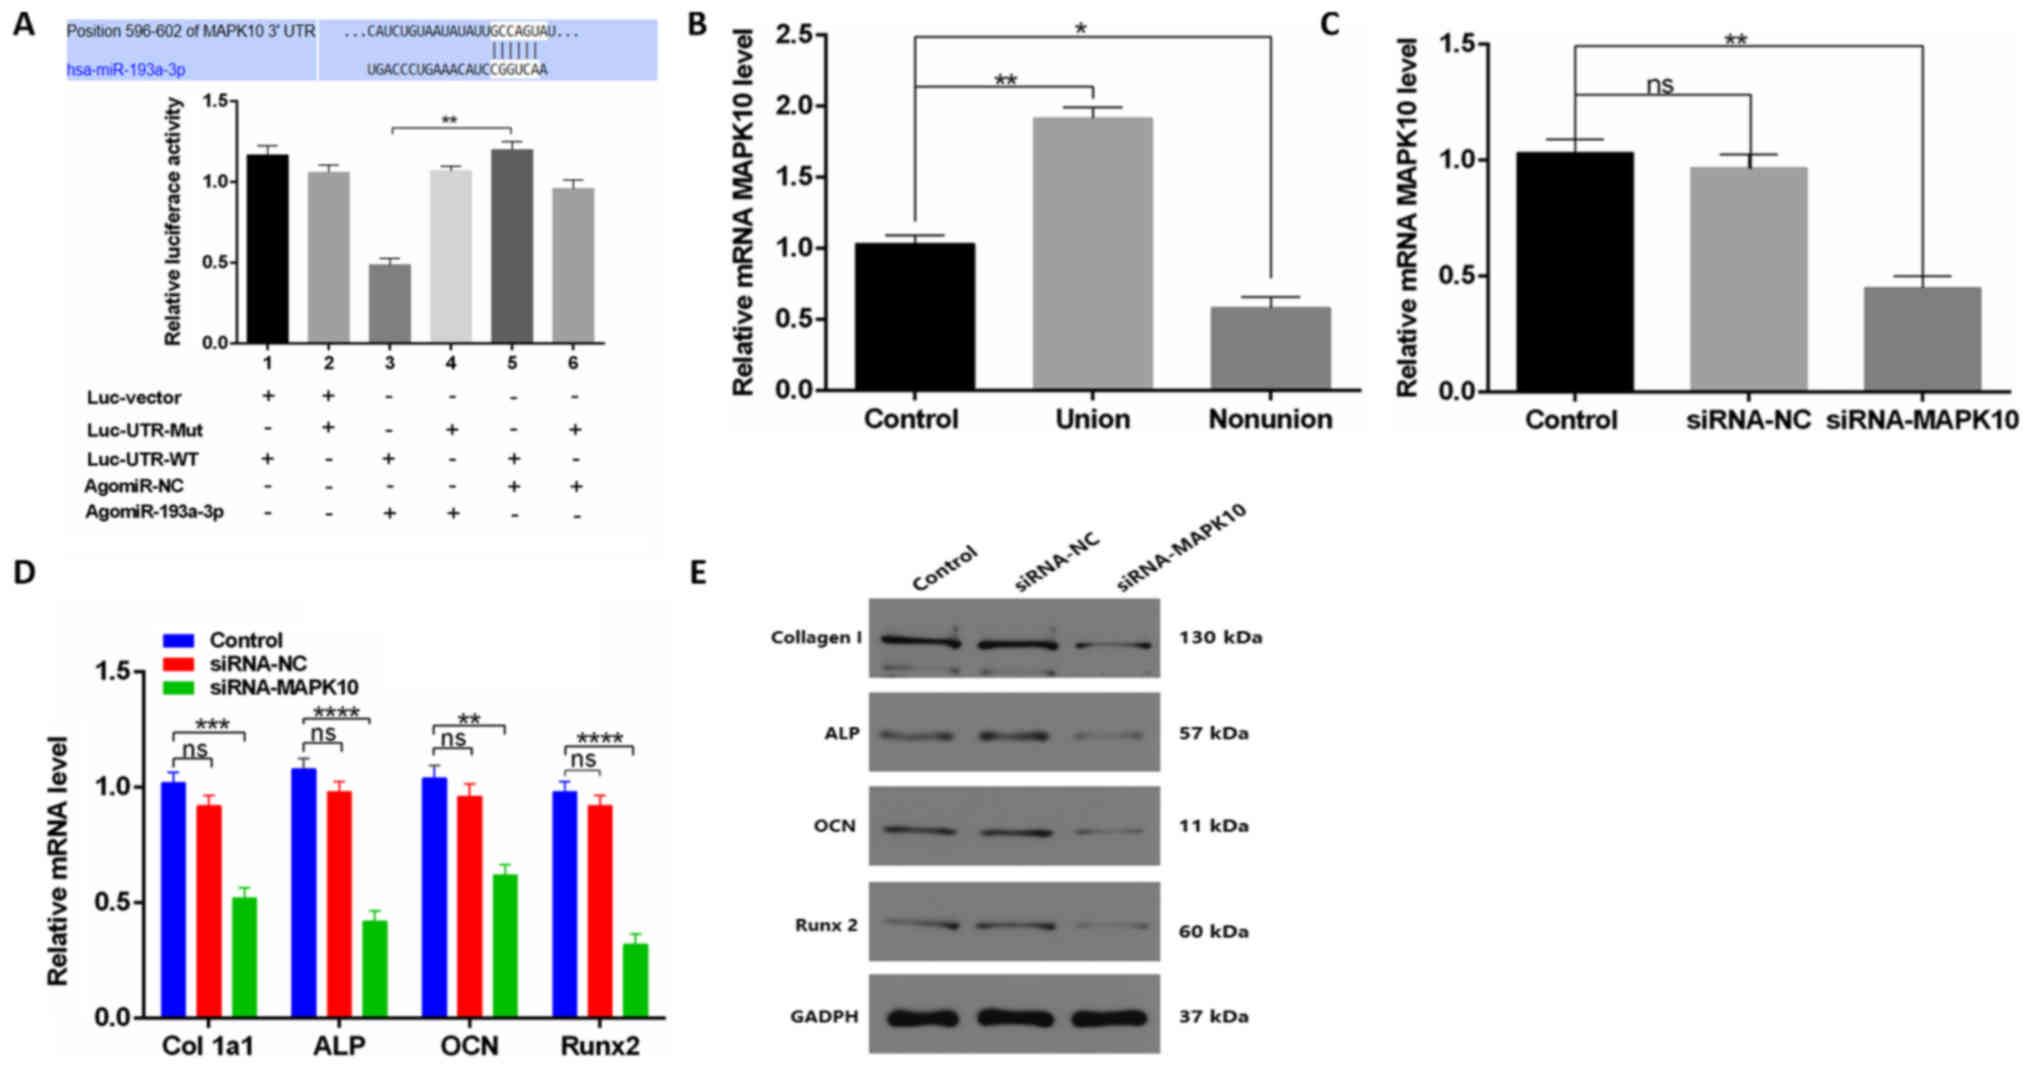 | Figure 4.miR-193a-3p targets MAPK10 to inhibit
osteoblast activity in vitro. (A) miR-193a-3p effects in
hMSCs cells on luciferase activity following antagomiR-NC or
antagomiR-193a-3p treatment. (B) Relative MAPK10 level was lower in
the nonunion group than other groups. (C) Relative MAPK10 level was
lower in agomiR-193a-3p group than other groups. (D) PCR and (E)
western blotting analysis were used following transfection to
assess Col1a1, ALP, OCN, and Runx2 expression. Data are the mean ±
standard deviation of triplicate experiments. *P<0.05,
**P<0.01, ***P<0.001, ****P<0.0001. miR, microRNA; ALP,
alkaline phosphatase; hMSCs, human mesenchymal stem cells; Runx2,
Runt-related transcription factor 2; Col1a1, collagen 1α(I); NC,
negative control; MAPK, mitogen associated protein kinase; ns, not
significant; Mut, mutant; WT, wild type; UTR, untranslated
region. |
Local injection of miR-193a-3p
inhibits fracture healing in mice
Finally, PBS, agomiR-193a-3p, or antagomiR-193a-3p
were directly injected into the local fracture sites of model
animals to assess whether agomiR-193a-3p was able to improve
fracture healing. Additionally, RT-qPCR analysis was performed for
the mice bone tissues to testify the overexpression/knockdown of
miR-193a-3p level (Fig. S2).
Local injection was performed at three time points on days 1, 3 and
7 post fracture respectively, and microCT examination was performed
on days 14 and 21 post-fracture. The results indicated a smaller
total and bone callus volume in agomiR-193a-3p animals compared
with the control and antagomiR-193a-3p-treated-animals (Fig. 5A-C). In addition,
agomiR-193a-3p-treated-animals exhibited lower BMD than did animals
in the other two groups (Fig. 5D).
In summary, these results indicated that miRNA-193a-3p plays a
negative role in fracture healing.
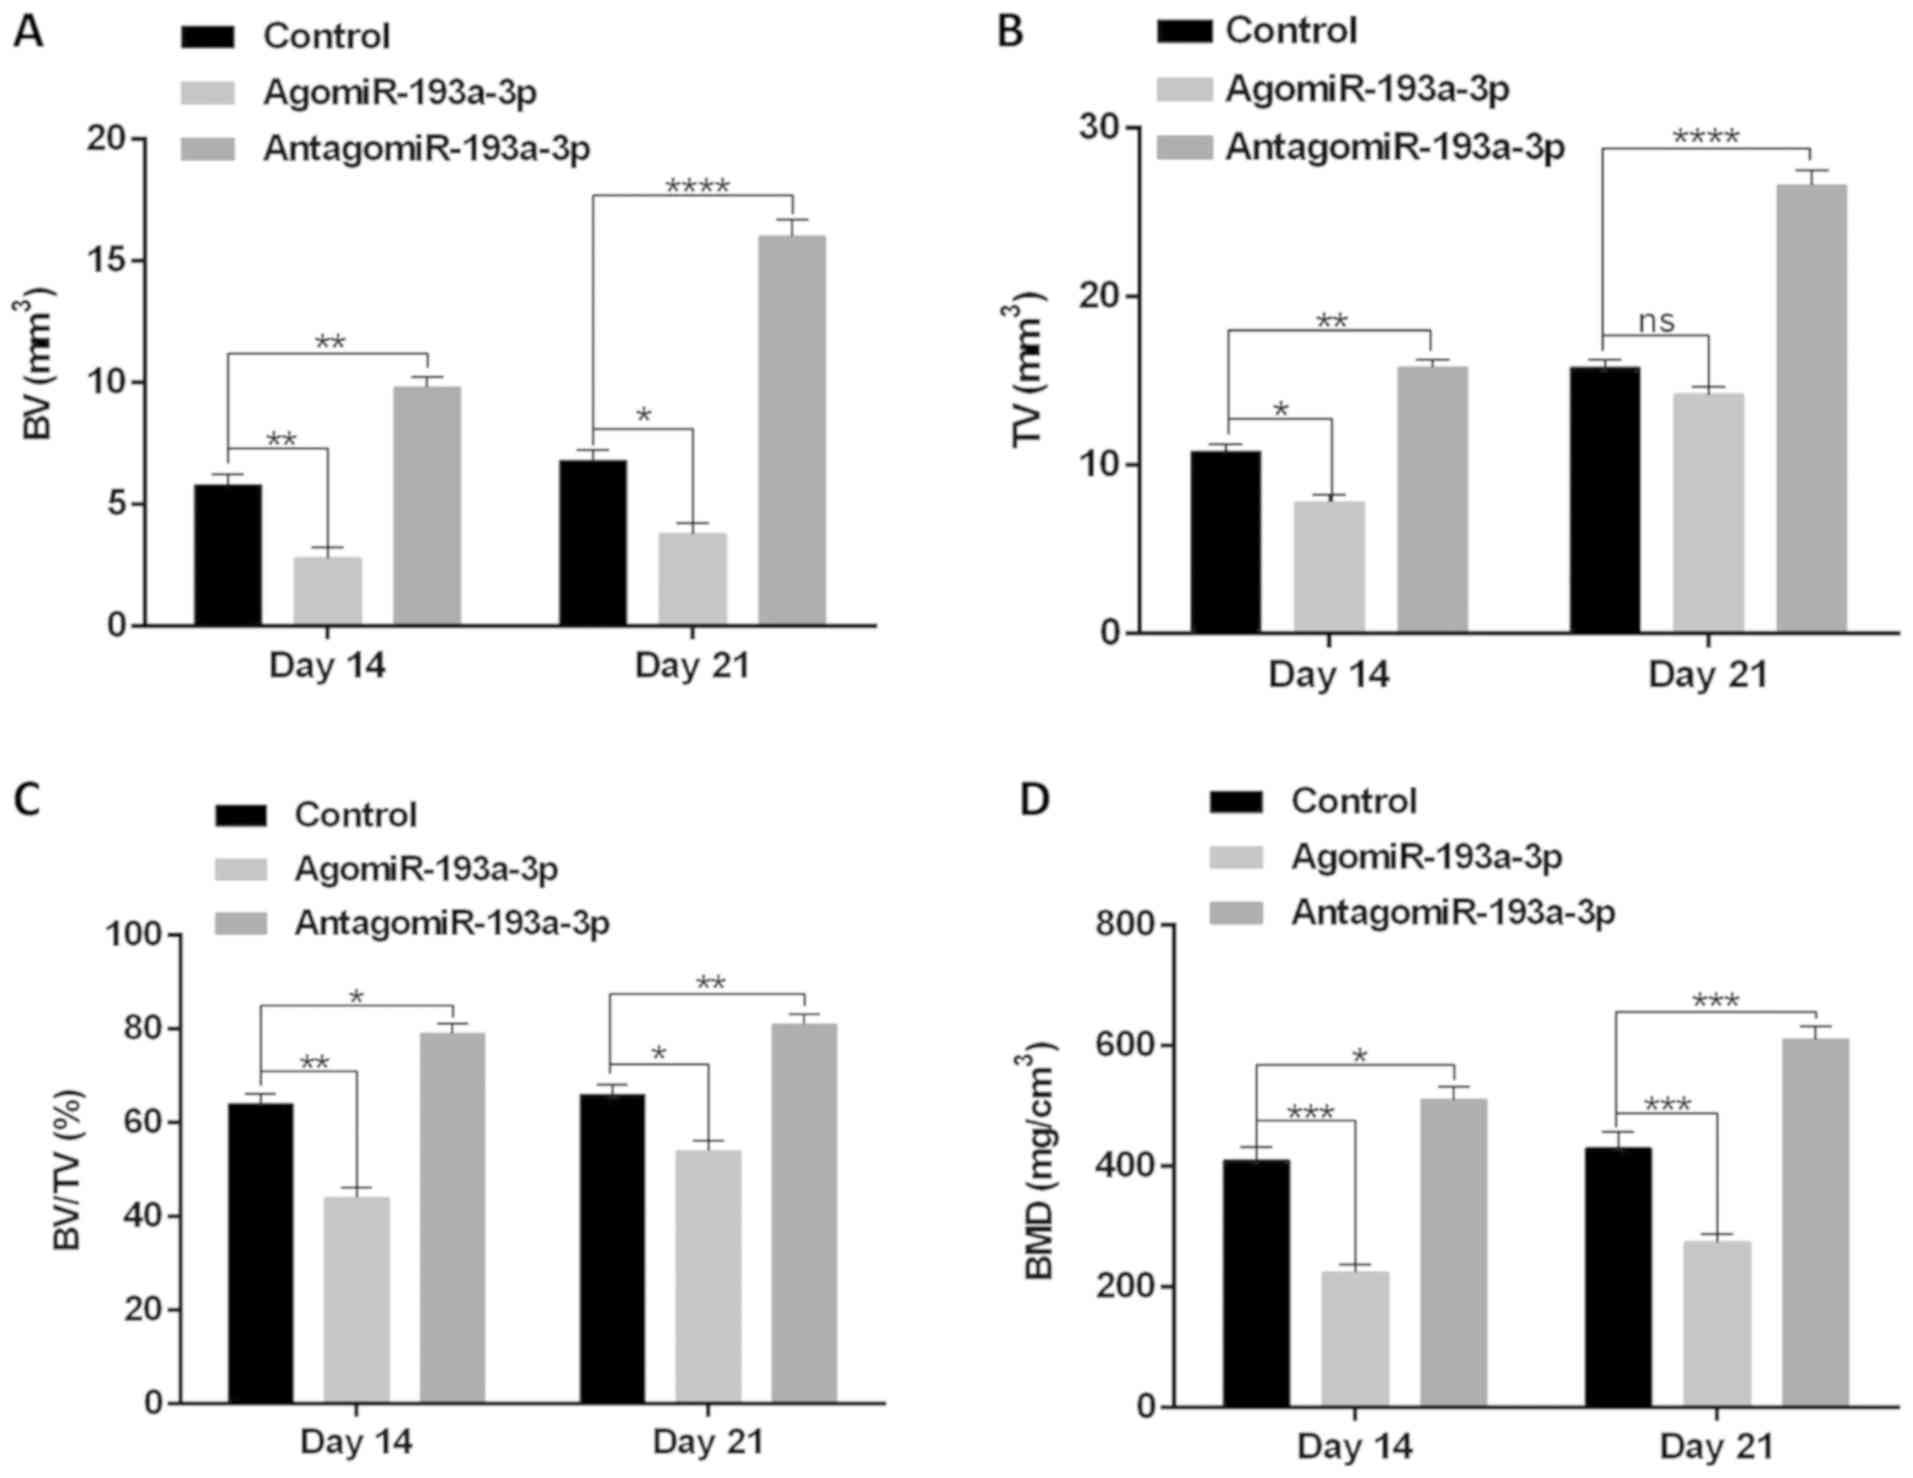 | Figure 5.Local injection of agomiR-193a-3p
inhibits fracture healing in mice. PBS, agomiR-193a-3p and
antagomiR-193a-3p were injected locally to the fracture site on
days 1, 3, and 7 post-fracture. BV (A) and TV (B) of the callus,
BV/TV (C) and BMD (D) on days 14 and 21 post-operation were
established via microcomputed tomography. n=10 mice/group. Data are
means ± standard deviation of triplicate experiments. *P<0.05,
**P<0.01, ***P<0.001, ****P<0.0001. BV, bone volume; TV,
tissue volume; BMD, bone mineral density; miR, microRNA; ns, not
significant. |
Discussion
In the present study, mRNA and miRNA expression
datasets from BN and control patients were integrated, allowing the
identification of hsa-miR-1225-5p, hsa-miR-339-5p and
hsa-miR-193-3p, and their respective target genes CCNL2, PRCP, and
MAPK10 as potential biomarkers useful for BN diagnosis. Based on
functional enrichment analyses and previous publications, it was
also further determined that CCNL2 may regulate BN development via
the estrogen signaling pathway, whereas PRCP and MAPK10 may do so
via retrograde endocannabinoid signaling.
The estrogen signaling pathway plays a key role in
regulating the functionality and proliferation of cells in numerous
contexts (19–22). Endometrial cell proliferation is
regulated via the estrogen-induced brain-derived neurotrophic
factor signaling pathway (23,24).
It has also been shown that 17βestradiol is able to prevent bone
deterioration at least in part via suppressing ephA2/ephrinA2
signaling (25,26). As such, the regulation of estrogen
signaling has been explored as a potential treatment for promoting
bone formation. For example, a previous study found that
8-O-4′norlignan was able to activate an endoplasmic reticulum
signaling pathway in osteoblast-like cells in a ligand-independent,
estrogen response element-independent and MAPK-dependent manner
(27). Another study determined
that estrogen receptor-α was expressed in both osteoblasts and
osteoclasts, and they further found that estrogen-mediated
activation of this receptor within osteoblast progenitor cells
promoted cortical bone accrual (28). Transforming growth factor
β-inducible early gene-1 is also known to regulate estrogen
signaling in bone tissue (29). In
the present study, it was found that ZBTB20, PTPN9 and ERCC1 were
all upregulated in individuals with BN, confirming the relevance of
estrogen-associated proliferation and apoptosis in BN.
Previous research suggests that CCNL2 can negatively
regulate blood vessel remodeling (30). Further studies have also found that
this gene also enhances intracellular intron splicing activity in a
manner opposed by the expression of cyclin dependent kinase (CDK)11
(p58/p46) or inactive CDK11 (p110), resulting in differential mRNA
splicing as a function of CCNL2 expression (31–33).
A previous study suggested CCNL2 to be a cyclin family gene member
that has the potential to regulate the transcription and subsequent
RNA processing for genes which regulate apoptosis, thereby
impairing cellular proliferation and potentially promoting
apoptotic cell death (31). In the
present study, CCNL2 was found to be upregulated in samples from
patients with BN, wherein it has the potential to cause osteoblast
apoptosis. At present to the best of our knowledge, no previous
studies have examined the role of CCNL2 in BN and as such, further
studies are warranted.
The current study revealed that PRCP and MAPK10 are
involved in the retrograde endocannabinoid signaling pathway, which
has the potential to activate presynaptic type 1 cannabinoid
receptors to depress neurotransmitter release. As such, it is
speculated that PRCP and MAPK10 may regulate BN by mediating the
release of special neurotransmitters, which in turn may regulate
bone remodeling (33,34). Indeed, synaptic function is known
to be regulated by endocannabinoids, which are lipid signaling
molecules that regulate signaling within the central nervous system
(35). This may explain the
downregulation of PRCP and MAPK10 in the BN patients of the present
study.
miRNAs have previously attracted attention as
potential biomarkers of BN (36–39),
warranting the identification of DEMs in BN patient bone tissue
samples. The present study revealed that miR-1225-5p is highly
expressed in BN tissues. The upregulation of miR-1225-5p has also
been associated with the impaired proliferation of laryngeal
carcinoma cells as a result of G1/S phase cell cycle arrest. By
contrast, reduced miR-1225-5p expression was associated with
increased cell survival (40). In
line with this, miR-1225-5p was found to regulate CCNL2 potentially
promoting cellular proliferation and inhibiting apoptotic cell
death, though further research is required to experimentally
validate the relationship between miR-1225-5p and CCNL2.
Elevated plasma miR-339-5p levels have previously
been identified as a biomarker of lung adenocarcinoma (39) and linked to increased activation of
the protein B-cell lymphoma 6 (41), whereas upregulation of the
resulting protein suppresses PRCP expression (42,43).
Consistent with these findings, the present study revealed that
miR-339-5p was upregulated in the BN samples, with the potential to
negatively regulate its target gene, PRCP. However, further
experimental validation of the relationship between miR-339-5p and
PRCP expression is required.
It is also known that miR-193a-3p serves key roles
in regulating the metastasis of osteosarcoma by downregulating both
the Rab27B and serine racemase genes, and as such, miR-193a-3p has
been proposed as a biomarker of metastatic osteosarcoma (44). Advanced osteosarcoma is also
associated with increased bone damage and osteoclast activation,
and therefore, miR-193a-3p may also be downregulated in BN, as was
observed in the present study. To the best of our knowledge, no
previous studies have documented a negative association between
miR-193a-3p and MAPK10 in the context of BN, and as such this was a
novel finding of the present study. These results also illustrated
that the expression of miR-193a-3p was increased in patients with
BN compared with those with bone union and the negative effect of
miR-193a-3p on hMSC osteoblastic differentiation was demonstrated
in vitro. In addition, a fracture mouse model was used to
assess the effect of miR-193a-3p on fracture healing in
vivo. Collectively, these results helped to support the in
vitro and in silico findings of the present group.
To conclude, the present study revealed that
miR-193a-3p and its target gene MAPK10 may be a potential
biomarkers for BN, although further investigation with a larger
sample size is required to validate their potential values as
future diagnostic, prognostic and/or therapeutic biomarkers.
However, there still exits some limitations in the present study.
Firstly, as it appears to be common practice to adjust P-values for
multiple testing during bioinformatics analysis and adjusted
P-values in the authors' subsequent studies will be applied.
Moreover, bioinformatics analysis and multiple experimental tools
were used to screen for potential key markers of BN. However,
sensitivity and specificity of this potential biomarkers had not
been explored in the current study, and the present group aims to
highlight these points in their future research. Additionally, the
small sample size and types of patient was another limitation of
the present study.
Supplementary Material
Supporting Data
Acknowledgements
Not applicable.
Funding
This study was supported by the National Science
Foundation of China (grant no. 81772345), the Healthy Commission
Key Project of Hubei Province (grant no. WJ2019Z009), the Science
and Technology Department of Hubei Province (grant no. 2016CFB424),
the Development Center for Medical Science and Technology National
Health and Family Planning Commission of the People's Republic of
China (ZX-01-C2016024).
Availability of data and materials
The datasets used and/or analyzed during the current
study are available from the corresponding author on reasonable
request.
Authors' contributions
YX and LC designed the study. FC and XL performed
data curation. YC and YX carried out the statistical analysis. GL
and CY performed the investigations. BM and WZ were responsible for
project administration. YE and GL operated the software. YE was
responsible for supervision. BM and WZ performed validation. CY and
YC conceived the study, participated in its design and coordination
and helped to draft the manuscript. GL, YX, and WZ participated in
the sequence alignment and drafted the manuscript. All authors read
and approved the final manuscript.
Ethics approval and consent to
participate
All experiments involving animals were conducted in
compliance with the Guide for the Care and Use of Laboratory
Animals by International Committees. The present study was approved
by the Committees of Clinical Ethics in Tongji Medical College,
Huazhong University of Science and Technology (Wuhan, China)
approved this study (2016-049-83). The patient studies were
approved by the Committees of Clinical Ethics in the Union Hospital
(Tongji Medical College, Huazhong University of Science and
Technology, Wuhan, China), and informed consent was obtained from
all participants.
Patient consent for publication
Not applicable.
Competing interests
The authors declare that they have no competing
interests.
References
|
1
|
DiSilvio F Jr, Foyil S, Schiffman B,
Bernstein M, Summers H and Lack WD: Long bone union accurately
predicted by cortical bridging within 4 months. JB JS Open Access.
3:e122018.
|
|
2
|
Supakul S, Yao K, Ochi H, Shimada T,
Hashimoto K, Sunamura S, Mabuchi Y, Tanaka M, Akazawa C, Nakamura
T, et al: Pericytes as a source of osteogenic cells in bone
fracture healing. Int J Mol Sci. 20:E10792019. View Article : Google Scholar : PubMed/NCBI
|
|
3
|
Hovius SE and de Jong T: Bone grafts for
scaphoid nonunion: An overview. Hand Surg. 20:222–227. 2015.
View Article : Google Scholar : PubMed/NCBI
|
|
4
|
Zaidenberg EE, Juarez Cesca F, Pastrana MJ
and Zaidenberg CR: Pedicled vascularized bone graft of the distal
radius for recalcitrant nonunion of the distal humerus. J Orthop
Trauma. 32:e394–e399. 2018. View Article : Google Scholar : PubMed/NCBI
|
|
5
|
Attanayake AMHS, De Silva UMGD, Jayaweera
JAAS and Perera DL: Use of Ayurveda and Sri Lankan traditional
medicine for healing shaft of humerus fracture following nonunion.
J Ayurveda Integr Med. 9:217–220. 2018. View Article : Google Scholar : PubMed/NCBI
|
|
6
|
Zheng W and Guan J: Oncostatin M promotes
the osteogenic differentiation of mouse MC3T3-E1osteoblasts through
the regulation of monocyte chemotactic protein-1. Mol Med Rep.
18:2523–2530. 2018.PubMed/NCBI
|
|
7
|
Zhang P, Gao H, Li Q, Chen X and Wu X:
Downregulation of microRNA-660 inhibits cell proliferation and
invasion in osteosarcoma by directly targeting forkhead box O1. Mol
Med Rep. 18:2433–2440. 2018.PubMed/NCBI
|
|
8
|
Jia HL and Zhou DS: Downregulation of
microRNA-367 promotes osteoblasts growth and proliferation of mice
during fracture by activating the PANX3-mediated Wnt/β-catenin
pathway. J Cell Biochem. 2018.(Epub ahead of print).
|
|
9
|
Frohlich LF: Micrornas at the interface
between osteogenesis and angiogenesis as targets for bone
regeneration. Cells. 8:E1212019. View Article : Google Scholar : PubMed/NCBI
|
|
10
|
Zu H, Yi X and Zhao D: Transcriptome
sequencing analysis reveals the effect of combinative treatment
with low-intensity pulsed ultrasound and magnesium ions on hFOB1.19
human osteoblast cells. Mol Med Rep. 18:749–762. 2018.PubMed/NCBI
|
|
11
|
Mao W and Zhu Z: Parthenolide inhibits
hydrogen peroxide-induced osteoblast apoptosis. Mol Med Rep.
17:8369–8376. 2018.PubMed/NCBI
|
|
12
|
Kang S and Song J: Robust gene selection
methods using weighting schemes for microarray data analysis. BMC
Bioinformatics. 18:3892017. View Article : Google Scholar : PubMed/NCBI
|
|
13
|
Lin SM, Du P, Huber W and Kibbe WA:
Model-based variance-stabilizing transformation for Illumina
microarray data. Nucleic Acids Res. 36:e112008. View Article : Google Scholar : PubMed/NCBI
|
|
14
|
Wang A, Ren M, Song Y, Wang X, Wang Q,
Yang Q, Liu H, Du Z, Zhang G and Wang J: MicroRNA expression
profiling of bone marrow mesenchymal stem cells in steroid-induced
osteonecrosis of the femoral head associated with osteogenesis. Med
Sci Monit. 24:1813–1825. 2018. View Article : Google Scholar : PubMed/NCBI
|
|
15
|
Waki T, Lee SY, Niikura T, Iwakura T,
Dogaki Y, Okumachi E, Oe K, Kuroda R and Kurosaka M: Profiling
microRNA expression during fracture healing. BMC Musculoskelet
Disord. 17:832016. View Article : Google Scholar : PubMed/NCBI
|
|
16
|
Fortriede JD, Pells TJ, Chu S, Chaturvedi
P, Wang D, Fisher ME, James-Zorn C, Wang Y, Nenni MJ, Burns KA, et
al: Xenbase: Deep integration of GEO & SRA RNA-seq and ChIP-seq
data in a model organism database. Nucleic Acids Res gkz933.
2019.(Epub ahead of print). View Article : Google Scholar
|
|
17
|
Xiong Y, Cao F, Hu L, Yan C, Chen L,
Panayi AC, Sun Y, Zhou W, Zhang P and Wu Q: miRNA-26a-5p
accelerates healing via downregulation of PTEN in fracture patients
with traumatic brain injury. Mol Ther Nucleic Acids. 17:223–234.
2019. View Article : Google Scholar : PubMed/NCBI
|
|
18
|
Livak KJ and Schmittgen TD: Analysis of
relative gene expression data using real-time quantitative PCR and
the 2(-Delta Delta C(T)) method. Methods. 25:402–408. 2001.
View Article : Google Scholar : PubMed/NCBI
|
|
19
|
Wang W, Chen J, Hui Y, Huang M and Yuan P:
Down-regulation of miR-193a-3p promotes osteoblast differentiation
through up-regulation of LGR4/ATF4 signaling. Biochem Biophys Res
Commun. 503:2186–2193. 2018. View Article : Google Scholar : PubMed/NCBI
|
|
20
|
Zhu Y, Kawaguchi K and Kiyama R:
Differential and directional estrogenic signaling pathways induced
by enterolignans and their precursors. PLoS One.
12:e1713902017.
|
|
21
|
Vrtacnik P, Ostanek B, Mencej-Bedrac S and
Marc J: The many faces of estrogen signaling. Biochem Med (Zagreb).
24:329–342. 2014. View Article : Google Scholar : PubMed/NCBI
|
|
22
|
Kiyama R: Estrogenic terpenes and
terpenoids: Pathways, functions and applications. Eur J Pharmacol.
815:405–415. 2017. View Article : Google Scholar : PubMed/NCBI
|
|
23
|
Dong F, Zhang Q, Kong W, Chen J, Ma J,
Wang L, Wang Y, Liu Y, Li Y and Wen J: Regulation of endometrial
cell proliferation by estrogen-induced BDNF signaling pathway.
Gynecol Endocrinol. 33:485–489. 2017. View Article : Google Scholar : PubMed/NCBI
|
|
24
|
Crider A and Pillai A: Estrogen signaling
as a therapeutic target in neurodevelopmental disorders. J
Pharmacol Exp Ther. 360:48–58. 2017. View Article : Google Scholar : PubMed/NCBI
|
|
25
|
Liu L, Zhou L, Yang X, Liu Q, Yang L,
Zheng C, Zhao Y, Zhang Z and Luo X: 17β-estradiol attenuates
ovariectomy induced bone deterioration through the suppression of
the ephA2/ephrinA2 signaling pathway. Mol Med Rep. 17:1609–1616.
2018.PubMed/NCBI
|
|
26
|
Yin X, Wang X, Hu X, Chen Y, Zeng K and
Zhang H: ERβ induces the differentiation of cultured osteoblasts by
both Wnt/β-catenin signaling pathway and estrogen signaling
pathways. Exp Cell Res. 335:107–114. 2015. View Article : Google Scholar : PubMed/NCBI
|
|
27
|
Xiao HH, Gao QG, Ho MX, Zhang Y, Wong KC,
Dai Y, Yao XS and Wong MS: An 8-O-4′ norlignan exerts
oestrogen-like actions in osteoblastic cells via rapid nongenomic
ER signaling pathway. J Ethnopharmacol. 170:39–49. 2015. View Article : Google Scholar : PubMed/NCBI
|
|
28
|
Almeida M, Iyer S, Martin-Millan M,
Bartell SM, Han L, Ambrogini E, Onal M, Xiong J, Weinstein RS,
Jilka RL, et al: Estrogen receptor-α signaling in osteoblast
progenitors stimulates cortical bone accrual. J Clin Invest.
123:394–404. 2013. View
Article : Google Scholar : PubMed/NCBI
|
|
29
|
Hawse JR, Pitel KS, Cicek M, Philbrick KA,
Gingery A, Peters KD, Syed FA, Ingle JN, Suman VJ, Iwaniec UT, et
al: TGFβ inducible early gene-1 plays an important role in
mediating estrogen signaling in the skeleton. J Bone Miner Res.
29:1206–1216. 2014. View Article : Google Scholar : PubMed/NCBI
|
|
30
|
Liu H, Tao Y, Chen M, Yu J, Li WJ, Tao L,
Li Y and Li F: Upregulation of MicroRNA-214 contributes to the
development of vascular remodeling in hypoxia-induced pulmonary
hypertension via targeting CCNL2. Sci Rep. 6:246612016. View Article : Google Scholar : PubMed/NCBI
|
|
31
|
Loyer P, Trembley JH, Grenet JA, Busson A,
Corlu A, Zhao W, Kocak M, Kidd VJ and Lahti JM: Characterization of
cyclin L1 and L2 interactions with CDK11 and splicing factors:
Influence of cyclin L isoforms on splice site selection. J Biol
Chem. 283:7721–7732. 2008. View Article : Google Scholar : PubMed/NCBI
|
|
32
|
Yang L, Li N, Wang C, Yu Y, Yuan L, Zhang
M and Cao X: Cyclin L2, a novel RNA polymerase II-associated
cyclin, is involved in pre-mRNA splicing and induces apoptosis of
human hepatocellular carcinoma cells. J Biol Chem. 279:11639–11648.
2004. View Article : Google Scholar : PubMed/NCBI
|
|
33
|
Araque A, Castillo PE, Manzoni OJ and
Tonini R: Synaptic functions of endocannabinoid signaling in health
and disease. Neuropharmacology. 124:13–24. 2017. View Article : Google Scholar : PubMed/NCBI
|
|
34
|
Ohno-Shosaku T and Kano M:
Endocannabinoid-mediated retrograde modulation of synaptic
transmission. Curr Opin Neurobiol. 29:1–8. 2014. View Article : Google Scholar : PubMed/NCBI
|
|
35
|
Smith-Dijak AI, Sepers MD and Raymond LA:
Alterations in synaptic function and plasticity in Huntington
disease. J Neurochem. 150:346–365. 2019. View Article : Google Scholar : PubMed/NCBI
|
|
36
|
Sampson HW, Chaput CD, Brannen J, Probe
RA, Guleria RS, Pan J, Baker KM and VanBuren V: Alcohol induced
epigenetic perturbations during the inflammatory stage of fracture
healing. Exp Biol Med (Maywood). 236:1389–1401. 2011. View Article : Google Scholar : PubMed/NCBI
|
|
37
|
Selvamurugan N, He Z, Rifkin D, Dabovic B
and Partridge NC: Pulsed electromagnetic field regulates microRNA
21 expression to activate TGF-β signaling in human bone marrow
stromal cells to enhance osteoblast differentiation. Stem Cells
Int. 2017:24503272017. View Article : Google Scholar : PubMed/NCBI
|
|
38
|
Yoshizuka M, Nakasa T, Kawanishi Y,
Hachisuka S, Furuta T, Miyaki S, Adachi N and Ochi M: Inhibition of
microRNA-222 expression accelerates bone healing with enhancement
of osteogenesis, chondrogenesis, and angiogenesis in a rat
refractory fracture model. J Orthop Sci. 21:852–858. 2016.
View Article : Google Scholar : PubMed/NCBI
|
|
39
|
Takahara S, Lee SY, Iwakura T, Oe K, Fukui
T, Okumachi E, Waki T, Arakura M, Sakai Y, Nishida K, et al:
Altered expression of microRNA during fracture healing in diabetic
rats. Bone Joint Res. 7:139–147. 2018. View Article : Google Scholar : PubMed/NCBI
|
|
40
|
Sun P, Zhang D, Huang H, Yu Y, Yang Z, Niu
Y and Liu J: MicroRNA-1225-5p acts as a tumor-suppressor in
laryngeal cancer via targeting CDC14B. Biol Chem. 400:237–246.
2019. View Article : Google Scholar : PubMed/NCBI
|
|
41
|
Sun Y, Mei H, Xu C, Tang H and Wei W:
Circulating microRNA-339-5p and −21 in plasma as an early detection
predictors of lung adenocarcinoma. Pathol Res Pract. 214:119–125.
2018. View Article : Google Scholar : PubMed/NCBI
|
|
42
|
Li P, Liu H, Li Y, Wang Y, Zhao L and Wang
H: MiR-339-5p inhibits lung adenocarcinoma invasion and migration
by directly targeting BCL6. Oncol Lett. 16:5785–5790.
2018.PubMed/NCBI
|
|
43
|
Zhang L, Lu XQ, Zhou XQ, Liu QB, Chen L
and Cai F: NEAT1 induces osteosarcoma development by modulating the
miR-339-5p/TGF-β1 pathway. J Cell Physiol. 234:5097–5105. 2019.
View Article : Google Scholar : PubMed/NCBI
|
|
44
|
Pu Y, Zhao F, Cai W, Meng X, Li Y and Cai
S: MiR-193a-3p and miR-193a-5p suppress the metastasis of human
osteosarcoma cells by down-regulating Rab27B and SRR, respectively.
Clin Exp Metastasis. 33:359–372. 2016. View Article : Google Scholar : PubMed/NCBI
|