Introduction
Liver fibrosis is a common outcome of virtually all
chronic hepatic injuries, such as viral hepatitis, and is
frequently induced by hepatitis B and hepatitis C infection,
alcoholic or nonalcoholic steatohepatitis, autoimmune and chronic
inflammatory conditions, and metabolic disorders (1,2). If
left untreated, fibrosis can progress to clinically evident liver
cirrhosis and hepatic failure, ultimately leading to mortality.
Current treatments for liver fibrosis are mostly limited to
removing the underlying injurious stimulus (where possible),
eradicating viruses using antiviral drugs in viral hepatitis,
enhancing exercise for nonalcoholic steatohepatitis, and liver
transplantation (3). However, many
patients with liver fibrosis either do not respond to these
treatments or are diagnosed at intermediate or advanced disease
stages, where satisfactory curative approaches are often not
feasible (4). Additionally,
although liver transplantation is a highly successful treatment for
end stage liver fibrosis, it is not always possible, due to limited
organ availability and the presence of contraindicating
comorbidities (5). Therefore,
there is an urgent need to develop, test and monitor antifibrotic
treatments that can prevent, halt, or even reverse liver
fibrosis.
MicroRNAs (miRNAs), a class of short (~22 nt)
non-coding RNA molecules, can directly regulate gene expression by
specifically binding to the 3′-untranslated region (UTR) of target
mRNAs to block translation at the initiation or post-initiation
steps, inducing mRNA deadenylation and decay (6). It has been demonstrated that several
mammalian miRNAs are implicated in various biological processes,
including differentiation, proliferation, oxidative stress
resistance and tumor suppression (7). miRNAs are known to be dysregulated in
several diseases, including liver fibrosis (8). For example, all miRNA (miR)-29 family
members (miR-29a, miR-29b, and miR-29c) are downregulated during
the in vitro activation of isolated rat and mouse hepatic
stellate cells [HSCs, the main extracellular matrix (ECM)-producing
cells in the fibrotic liver], and in liver biopsies from patients
with advanced liver fibrosis; and miR-29 overexpression in HSCs
could significantly reduce collagen I and IV synthesis (9–11).
miR-122, mainly enriched in hepatic tissue, regulates the
activation of HSCs and liver fibrosis by controlling collagen
maturation and ECM production (12); ectopic miR-21 stimulates
extracellular signal-regulated kinase 1 signaling in HSCs and
induces hepatocyte epithelial-mesenchymal transition by targeting
sprouty2 or hepatocyte nuclear factor 4α (13). Thus, these findings were expected
to uncover the critical mechanism of liver fibrosis and strongly
implied that these dysregulated miRNAs serve a role in the
development of liver fibrosis, and could also be explored as novel
disease markers for the diagnosis or monitoring of the progression
of liver fibrosis (14).
Recently, increasing evidence has demonstrated that
aberrantly expressed miR-200a is considered to be a regulator in
some fibrosis diseases. For instance, miR-200a is significantly
downregulated in the lungs of rats with experimental lung fibrosis
and patients with idiopathic pulmonary fibrosis (15); miR-200a has been identified to be
downregulated in transforming growth factor (TGF)-β1-activated
pancreatic stellate cells (PSCs) and forced miR-200a expression
could attenuate TGF-β1-induced PSC activation and ECM formation by
inhibiting the phosphatase and tensin homolog/AKT/mTOR (16). It has also been reported that
increasing expression of miR-200a attenuates HSC proliferation
while knocking down miR-200a-promoted HSC proliferation (17,18).
In addition, the Hh signaling pathway has been found to be an
important pathway responsible for the pathogenesis of liver
fibrosis. The GLI family zinc finger (Gli) family, including
members Gli1, Gli2 and Gli3, can directly activate the Hh signaling
pathway (19). Nevertheless,
little is known about the roles of miR-200a and the Gli family in
the development of liver fibrosis, and the present study aimed to
address this.
Materials and methods
Patients
The participants enrolled in the present study were
divided into two groups: Group I comprised 10 patients with liver
fibrosis from the Digestive System Department of First People's
Hospital of Kunming City; and Group II comprised 10 healthy people
from the Health Examination Center of First People's Hospital of
Kunming City. Participants were recruited between January 2014 and
June 2015. The clinical parameters of patients are listed in
Tables SI and SII. Patients who had autoimmune
hepatitis, drug-induced injury, alcohol abuse or liver carcinoma
were excluded. Prior informed consent was obtained from all
patients and the study protocol was approved by the Ethics
Committee of First People's Hospital of Kunming City. A fasting
blood sample (8 ml) was collected from patients with liver fibrosis
and healthy donors during his/her first admission to the hospital.
The blood samples were kept at room temperature for 1 h and then
cellular components were removed by two consecutive centrifugation
steps (1,000 × g for 10 min at 4°C and 1,800 × g for 3 min at 4°C,
respectively). The supernatant serum was recovered and then stored
at −80°C.
Rat models of liver fibrosis and
treatment protocol
The animal experiments were approved by the Ethics
Committee of First People's Hospital of Kunming City and complied
with the National Institutes of Health Guide for the Care and Use
of Laboratory Animals (NIH Publications No. 8023, revised 1978)
(20). A total of 25 healthy male
Sprague-Dawley (SD) rats (5–6 weeks old) with a mean weight of
180±10 g, were obtained from the Guangdong Province Laboratory
Animal Center. All the rats were kept in plastic cages with a
stainless steel cover (5 rats in each cage), and all of them were
provided with free access to food and water (ordinary tap water) in
an air-conditioned room (25°C and 65% humidity) with a 12-h
light/dark cycle. All rats were acclimated for 1 week to reduce the
stress response caused by environmental changes, and were then used
to establish the liver fibrosis model. The SD rats were randomly
divided into the control group (healthy rats), Model-0 week group,
Model-2 week group, Model-4 week group, Model-8 week group, with 5
rats in each group. Model + Negative control (NC) group were
injected with agomir control via the tail vein, and Model +
miR-200a group were injected with miR-200a agomir via the tail
vein. miR-200a agomir (5′UAACACUGUCUGGUAACGAUGU3′ and agomir
control (5′UUUGUACUACACAAAAGUACUG3′) were obtained from Guangzhou
Ribobio Co., Ltd.
The Model-0 week group received nothing as a
control. To induce the rat model of liver fibrosis, 50% carbon
tetrachloride (CCl4) in peanut oil solution (0.1 ml/kg,
freshly prepared) was subcutaneously injected to the back of the
rats twice a week for 2 weeks, 4 weeks and 8 weeks to establish the
Model-2 week group, Model-4 week group and Model-8 week group,
respectively. Rats in the Model + NC group and Model + miR-200a
group were given 1–10 nmol agomir control or miR-200a agomir during
the period of CCl4 treatment every 3 days for 4
weeks.
All rats were sacrificed by CO2
inhalation to ameliorate animal suffering after the last dose of
CCl4. Blood was collected from the abdominal aorta, and
serum was separated and stored at −80°C. The livers were removed
and processed for further histopathological, reverse
transcription-quantitative (RT-q)PCR and western blot analysis
(WB).
Cell culture and treatments
Normal hepatocytes, including AML12 (mouse
hepatocyte cell line) and L02 (human hepatocyte cell line), both
from the American Type Culture Collection (ATCC), and the hepatic
stellate cell line LX2 (cat no. CBP60648; Shanghai Cobioer Biotech
Co., Ltd), were cultivated in Dulbecco's modified Eagle's medium
(DMEM; Gibco; Thermo Fisher Scientific, Inc.) containing 10% fetal
bovine serum (FBS; Gibco; Thermo Fisher Scientific, Inc.) and 100
µg/ml penicillin and streptomycin, and incubated in a humidified
state of 95% air and 5% CO2 at 37°C. When the cells grew
to 80% confluence in culture flasks, they were detached with a
solution of 0.25% trypsin and 0.002% EDTA (Gibco; Thermo Fisher
Scientific, Inc.) and seeded into 6-well plates at a density of
5×10⁵ cells/well for subsequent experiments.
THP-1 cells were used to establish the liver cell
fibrosis model as previously described by Prestigiacomo et
al (21). THP-1 cells
purchased from ATCC were grown in RPMI-1640 medium (Gibco; Thermo
Fisher Scientific, Inc.) with the addition of 10% FBS and
antibiotics (100 IU/ml penicillin and 100 mg/ml streptomycin), and
kept at 37°C under 5% CO2. THP-1 cells were
differentiated into macrophages over 48 h with 5–25 ng/ml
phorbol-12-myristate-13-acetate (PMA) treatment, according to a
previously published method (22).
Then, LX2 cells with the characteristics of an activated hepatic
stellate cell (HSC) phenotype were pre-cocultured with the treated
THP-1 cells and challenged with LPS (1 µg/ml) (21). After 0, 6, 12, 24 and 48 h, the
cells were harvested for subsequent analysis.
293T cells obtained from ATCC were cultured in
RPMI-1640 medium supplemented with 10% FBS and 1% antibiotics at
37°C in a humidified air atmosphere containing 5% CO2,
for the dual luciferase assay.
Hydroxyproline assay
Since hydroxyproline is a basic constituent of
collagen structure, its content can serve as indicator of collagen
synthesis (23). Hydroxyproline
analysis was performed to assess the amount of collagen in liver
tissues (24). In brief, the
samples were hydrolyzed with 6 M HCl at 130°C for 12 h. Then, 1 ml
hydroxyproline developer (β-dimethylaminobenzaldehyde solution) was
added to the samples and standards. The optical densities were
measured at 558 nm using a spectrophotometer (Bio-Rad Laboratories,
Inc.). Finally, the hydroxyproline/mg liver tissue was calculated
according to the standard curve constructed with serial
concentrations of commercial hydroxyproline.
Histological assessment
Liver tissues were fixed with 10% formalin at 4°C
for 24 h, and 4-µm-thick slices were stained with 0.2% hematoxylin
for 10 min and 0.5% eosin for 1 min at room temperature.
Subsequently, liver sections were subjected to Masson's trichrome
staining (cat. no. SBJ-0288; Nanjing Senbeijia Biological
Technology Co., Ltd). To observe the liver fibrosis, the blue pixel
content of the images was obtained using an Olympus optical
microscope (Olympus Corporation) at ×200 magnification. The degree
stages of liver fibrosis in the specimen were graded according to
the Ishak scoring system (25).
The scoring method for the Ishak scoring system is shown in
Table I. An Ishak score of ≥2 was
regarded as significant liver fibrosis.
 | Table I.Sequences of primers used for reverse
transcription-quantitative PCR. |
Table I.
Sequences of primers used for reverse
transcription-quantitative PCR.
| miRNA or gene | Primer
sequences |
|---|
| miR-200a | RT primer:
5′-CTCAACTGGTGTCGTGGAGTCGGCAATTCAGTTGAGCCAAGTTC-3′ |
|
| Forward primer: 5′-
ACACTCCAGCTGGGTAACACTGTCTGGTAACG-3′ |
|
| Reverse primer: 5′-
CTCAACTGGTGTCGTGGA-3′ |
| U6 | RT primer:
5′-CTCAACTGGTGTCGTGGAGTCGGCAATTCAGTTGAGAAAAATATGG-3′ |
|
| Forward primer:
5′-CTCGCTTCGGCAGCACA-3′ |
|
| Reverse primer:
5′-AACGCTTCACGAATTTGCGT-3′ |
| α-SMA (Human) | Forward primer:
5′-GTTCCAGCCATCCTTCATCGG-3′ |
|
| Reverse primer:
5′-CCTTCTGCATTCGGTCGGCAA-3′ |
| Albumin
(Human) | Forward primer:
5′-CAGAATGCGCTATTAGTTCG-3′ |
|
| Reverse primer:
5′-CTGGCGTTTTCTCATGCAA-3′ |
| Gli3 (Human) | Forward primer: 5′-
TTTTCCCCTTTAATCTTGCCAT-3′ |
|
| Reverse primer:
5′-CCAGTGGCAAATCAACCTCC-3′ |
| β-actin
(Human) | Forward primer:
5′-CTCCATCCTGGCCTCGCTGT-3′ |
|
| Reverse primer:
5′-GCTGTCACCTTCACCGTTCC-3′ |
| α-SMA (Rat) | Forward primer:
5′-GCGTGACTCACAACGTGCCTA-3′ |
|
| Reverse primer:
5′-CCCATCAGGCAGTTCGTAGCTCT-3′ |
| Albumin (Rat) | Forward primer:
5′-GATCTGCCCTCAATAGCTG-3′ |
|
| Reverse primer:
5′-TGGCTTCATATTTCTTAGCAA-3′ |
| Gli3 (Rat) | Forward primer:
5′-CTCGACCATTTCCACGGCAAC-3′ |
|
| Reverse primer:
5′-TCAGCACAGTGAAGTCTACACC −3′ |
| β-actin (Rat) | Forward primer: 5′-
TCAGGTCATCACTATCGGCAAT-3′ |
|
| Reverse primer:
5′-AAAGAAAGGGTGTAAAACGCA-3′ |
Immunohistochemical staining
Immunohistochemistry was used to measure the α-SMA
expression in the liver tissues. In brief, the liver tissues were
embedded with paraffin, serially sectioned (thickness, 5 µm) and
deparaffinized with xylene. Then, gradient ethanol hydration (85%
ethanol for 10 min, 95% ethanol for 10 min and 100% ethanol for 10
min) was performed, and the slices were washed with distilled
water. Next, heat-induced antigen retrieval (100°C; 10 min) was
conducted followed by blocking of endogenous peroxide using 3%
hydrogen peroxide (H2O2) in methanol for 15
min at room temperature. The sections were incubated with a primary
monoclonal anti-α-SMA antibody (cat. no. ab32575; 1:300; Abcam)
overnight at 4°C. Negative controls were obtained by omitting the
primary antibody. After washing with PBS three times for 3 min each
time, the sections were incubated with a horseradish
peroxidase-conjugated secondary antibody (1:200; cat. no. BA1056;
Wuhan Boster Biological Technology, Ltd., China) for 30 min at room
temperature. Then, the sections were washed again with PBS three
times for 5 min each time, and positive staining was detected using
the DAB Envision System (Dako; Agilent Technologies, Inc.).
Finally, light microscopy was used for observation, under which
α-SMA-positive cells appeared brown-yellow.
Computational target prediction
TargetScan was used to predict putative miRNAs
targeted by Gli3 in the present study (http://www.targetscan.org/mamm_31/).
RNA isolation and RT-qPCR detection of
miRNA and mRNA
The expression levels of miR-200a, α-SMA, albumin
and Gli3 were examined by RT-qPCR. For miRNA analysis, RNA was
extracted using the miRNeasy kit (Qiagen GmbH) according to the
manufacturer's protocol, and further purified using an RN easy mini
kit (Qiagen GmbH) following the instructions of the supplier. Then,
total RNA was reverse transcribed (37°C for 15 min; 85°C for 10
sec; holding at 4°C) using the miRCURY LNA Universal RT miRNA PCR,
Polyadenylation and cDNA synthesis kit (Exiqon; Qiagen GmbH). cDNA
diluted 1:50 was assayed in 10 ml PCR reactions supplemented with
SYBR green according to the protocol for the miRCURY LNA Universal
RT miRNA PCR with an ABI PRISM 7500 Sequence Detection System
(Applied Biosystems; Thermo Fisher Scientific, Inc.) at 95°C for 10
min, followed by 40 cycles at 95°C for 10 sec and 60°C for 1
min.
For mRNA analysis, the cDNA was synthesized using
the PrimeScript RT reagent kit (Epicentre; Illumina, Inc.) RT-PCR
thermocycling was performed under the following conditions: 37°C
for 15 min, 85°C for 10 sec, and holding at 4°C. Then, the cDNA was
subsequently amplified by PCR using a SYBR Green mix (Takara Bio,
Inc.) on an ABI PRISM 7500 Sequence Detection System. The PCR was
conducted as follows: i) Pre-denaturation at 94°C for 5 min; ii) 40
cycles of denaturation at 94°C for 40 sec; ii) annealing at 60°C
for 40 sec; iii) extension at 72°C for 1 min; and iv) overlap
extension at 72°C for 10 min. The quantification cycle (Cq) value
for mRNA was normalized against the Cq value for the internal
control, β-actin, while U6 small nuclear RNA was used as an
internal control for the relative amount of miRNA. The data were
analyzed using the comparative Cq method (26), which was defined as
2−ΔΔCq to express the relationship for target gene
expression between the experiment and control groups, where
ΔΔCq=[Cq (target gene)-Cq (β-actin or U6)]experiment
group-[Cq (target gene)-Cq (β-actin or U6)]control
group. All primers used in this study are listed in Table II and experiments were repeated ≥3
times.
| Table II.Description of the ISHAK scoring. |
Table II.
Description of the ISHAK scoring.
| Score | Description |
|---|
| 0 | No fibrosis |
| 1 | Fibrotic expansion
of some portal areas, with short fibrous septa |
| 2 | Fibrotic expansion
of most portal areas, with short fibrous septa |
| 3 | Fibrotic expansion
of most portal areas, with occasional portal to portal
bridging |
| 4 | Fibrotic expansion
of most portal areas, with marked portal to portal bridging and
portal areas to central bridging |
| 5 | Marked bridging
with occasional nodules |
| 6 | Probable to define
cirrhosis |
WB
Total proteins from all samples were lysed in
modified RIPA lysis buffer (Beyotime Institute of Biotechnology)
with freshly added protease inhibitor cocktail (Beyotime Institute
of Biotechnology) at 4°C for 30 min. Protein concentration was
quantified using a BCA protein assay kit (Thermo Fisher Scientific,
Inc.). Then, 30 µg of total cellular extracts were separated by 10%
SDS-PAGE and immobilized onto a polyvinylidene fluoride membrane
(EMD Millipore). Following blocking by 5% skimmed milk at room
temperature for 1 h, the membrane was probed with primary
antibodies against GAPDH (cat. no. ABCA0467269; 1:1,000; Abmart),
α-SMA (1:1,000; Abcam), albumin (1:1,500; Abcam) and Gli3 (cat. no.
ab6050; 1:2,000; Abcam) overnight at 4°C. Subsequently, the
membrane was incubated with horseradish peroxidase-conjugated
goat-anti-mouse IgG (cat. no. ABCA2267961; 1:12,000; Abmart) or
goat-anti-rabbit IgG (cat. no. ABCA2267958; 1:12,000; Abmart) for 1
h at room temperature. Following incubation, the membranes were
extensively washed with Tris-buffered saline with 0.1% Tween-20
(TBST) five times for 5 min each time. Immunoreactive bands were
visualized using ECL detection reagent (Beyotime Institute of
Biotechnology) using Gel imager (Bio-Rad Laboratories, Inc.).
Densities of target protein bands were determined with Quantity One
version 4.6 (Bio-Rad Laboratories, Inc.). The internal control
GAPDH was used to normalize loading variations.
Construction of luciferase plasmids
and reporter assay
The 3′ UTR of Gli3 fragment containing putative
binding sites for miRNA-200a was amplified by PCR from human
genomic DNA and cloned into the psiCHECK-2 reporter vector (Promega
Corporation). The PCR was conducted as follows: i) Pre-denaturation
at 94°C for 5 min; ii) 40 cycles of denaturation at 94°C for 40
sec, annealing at 58°C for 30 sec, extension at 72°C for 30 sec;
and iii) overlap extension at 72°C for 10 min. The predicted target
site was mutated by site-directed mutagenesis (27). For the luciferase reporter assays,
the wild-type (WT) or mutated luciferase plasmids and miRNAs,
including miRNA-200a mimics, miRNA-200a inhibitor, negative control
(NC) plasmid or NC inhibitor, were co-transfected into 293T cells
(~80% confluence) using Lipofectamine™ 2000 transfection reagent
(cat. no. 11668019; Invitrogen; Thermo Fisher Scientific, Inc.) and
each experiment was repeated in triplicate. All of the plasmids
contained a GFP reporter, and the transfection efficacy was
calculated as the ratio of GFP+ cells/total cells. The
transfection efficiency for miR-200a mimics and inhibitor was
detected using laser scanning confocal microscopy at ×100
magnification (Fig. S1). Cells
were lysed at 48 h post-transfection and luciferase activity was
assayed using a dual-luciferase reporter assay system (Promega
Corporation). Firefly luciferase activity was normalized to
Renilla luciferase activity, with ratios of firefly
luciferase values/Renilla.
Statistical analysis
The statistical analysis was performed using SPSS
Statistics Version 18 (SPSS, Inc.) and graphs were generated with
GraphPad Prism 5 (GraphPad Software, Inc.). Data are presented as
the mean ± standard deviation and comparisons between two groups
were made by Tukey's HSD post-hoc test following one-way ANOVA.
P<0.05 was considered to indicate a statistically significant
difference. The correlation between Gli3 and miR-200a was evaluated
by linear fit; if the correlation coefficient, R2, was
>0.6, it was considered to indicate a significant
correlation.
Results
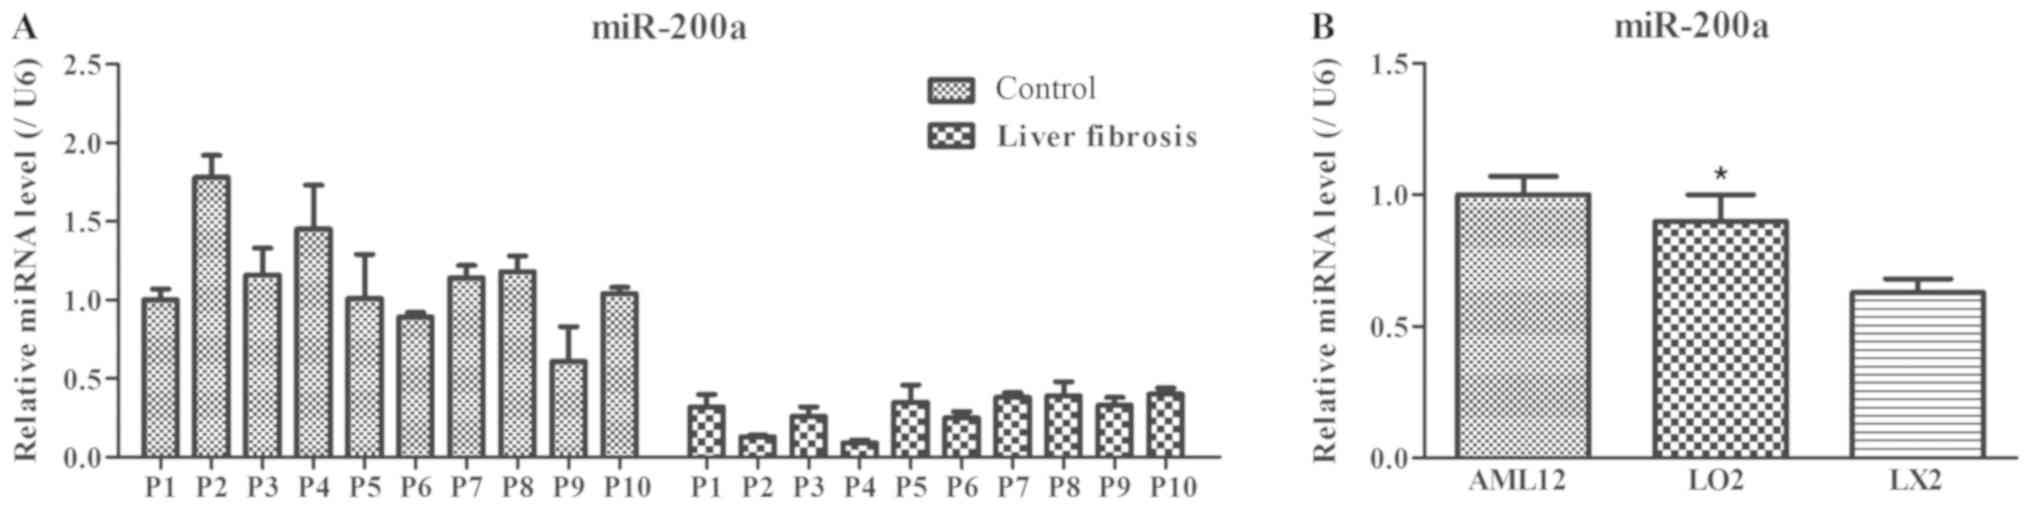
miR-200a expression levels in serum
specimens of liver fibrosis patients and cellular samples
The miR-200a levels in serum specimens and cellular
samples were determined using RT-qPCR. As shown in Fig. 1A, a decreased level of miR-200a was
observed in serum specimens from patients with liver fibrosis
compared with the control group. Meanwhile, the expression of
miR-200a in the hepatic stellate cell line LX2 was significantly
lower compared with normal AML12 and L02 hepatocytes (P<0.05;
Fig. 1B). Therefore, the results
suggested that miR-200a might be implicated in the process of liver
fibrosis.
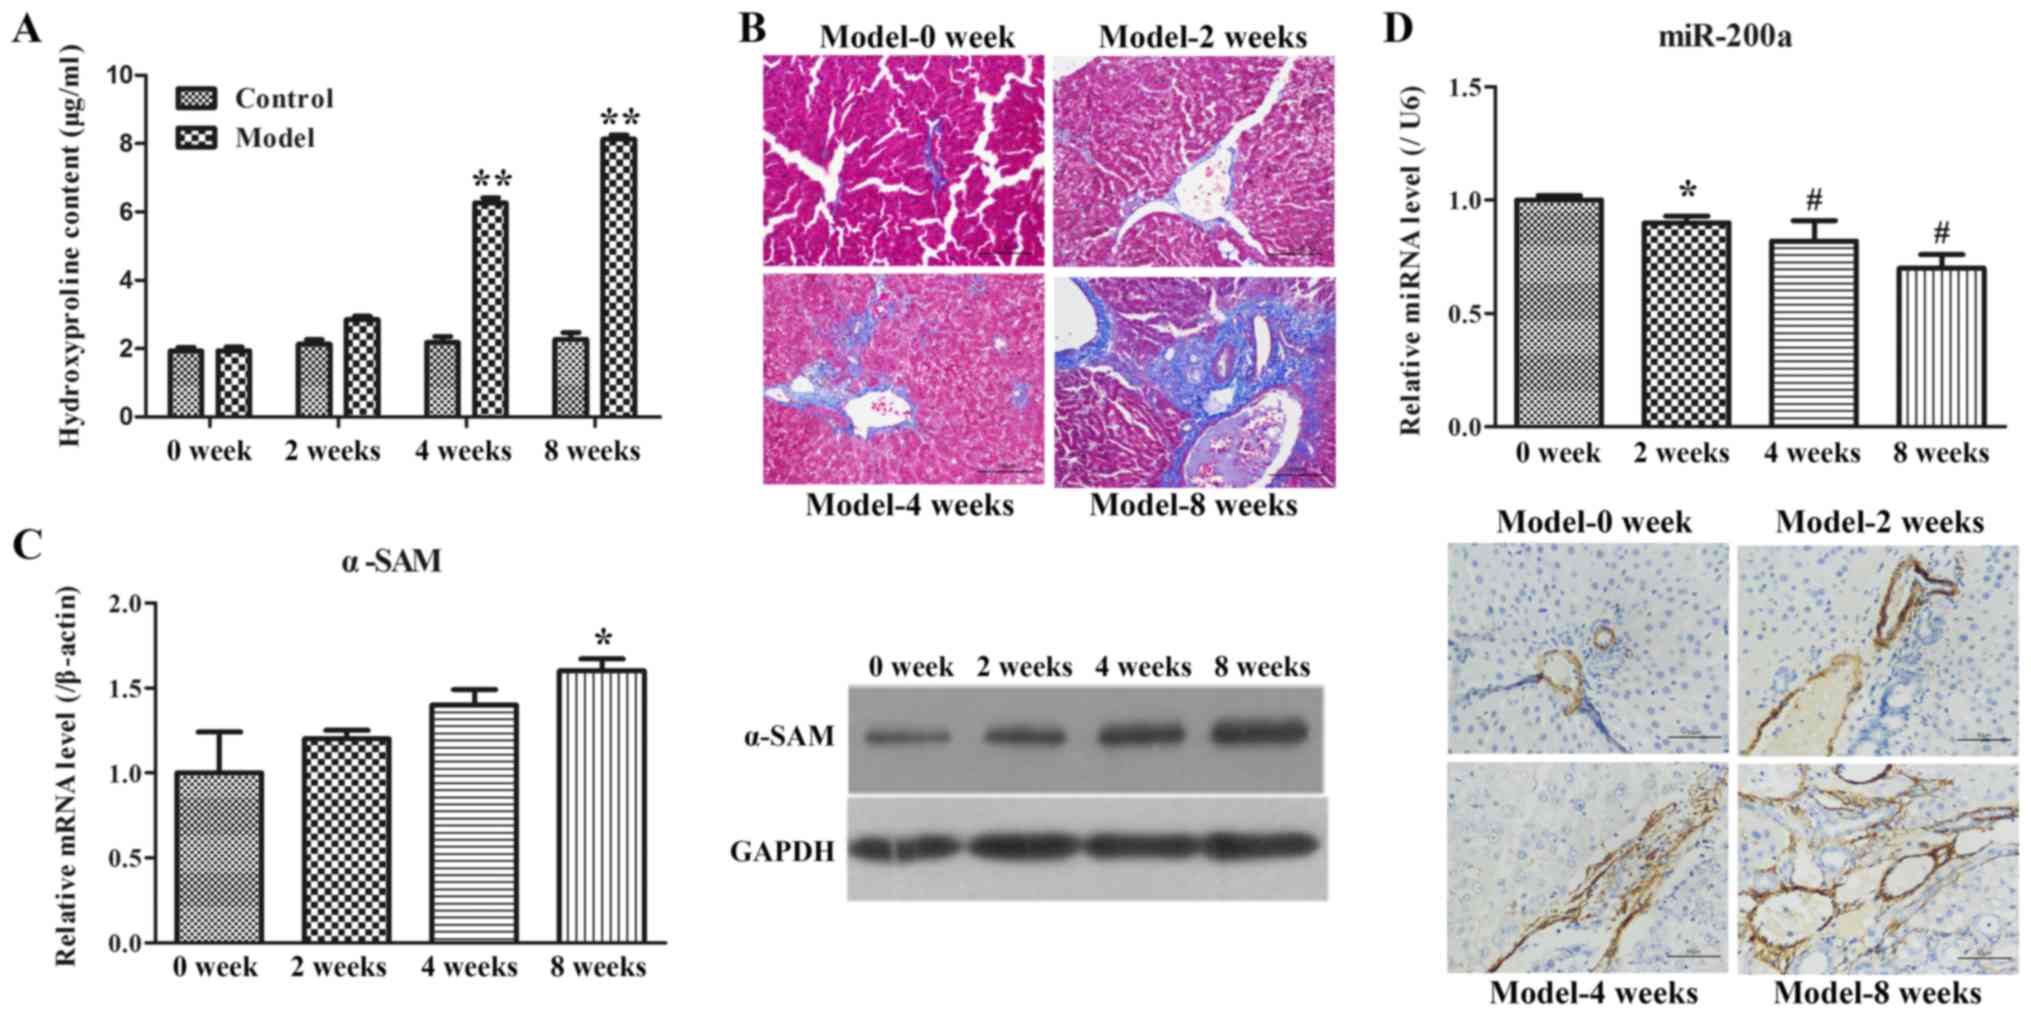
Animal model observations
Administration of CCl4 can cause
iterative toxic damage in the liver, so it is commonly used to
construct models of experimental fibrosis (28). First, hydroxyproline, a surrogate
marker for collagen content (29),
was detected, and the results showed that hydroxyproline content
was gradually increased in the rat model groups over time (Fig. 2A). Subsequently, the morphological
changes of liver injury and fibrosis were visualized in sections by
H&E and Masson's staining. The ISHAK scoring system was used to
evaluate the degree of liver fibrosis in the H&E sections
(Table II). It was found that
rats in Model-0 week group exhibited an ISHAK score of 1 with
intact liver tissue structures and very little collagen deposition
(Fig. 2B). However, rats in
Model-2, Model-4 and Model-8 exhibited an ISHAK score of 2.39, 3.62
and 4.76, respectively, and showed an increased amount of blue
collagen deposited in the portal area and interlobular septa of the
liver (Table III). Similarly,
the Masson-positive area increased with the modeling time and was
augmented from 15.17% in Model 0 week to 41.26% in Model 8 week
(Table III). Using correlation
analysis, it was noted that ISKAK score and Masson-positive area in
Table III were negatively
correlated with miR-200a expression in Fig. 2C (R2=0.947 and 0.945
respectively). In order to further evaluate the rat model of liver
fibrosis, α-SMA mRNA and protein expression levels were tested by
RT-qPCR, WB and immunohistochemistry analysis. As demonstrated in
Fig. 2D, an increasing trend of
α-SMA mRNA expression was observed over the model progression
period. WB also demonstrated similar results. In addition, liver
tissues with positive α-SMA expression exhibited yellow or brown
granules in immunohistochemical staining. The representative IHC
images of each group in Fig. 2D
revealed that fewer α-SMA-positive tissues were detected around the
blood vessels of liver tissues in the Model-0 week group, whereas
the expression of α-SMA was found not only at the vascular walls,
but also widely spread at the portal area, fibrous septum and the
adjacent hepatic sinusoids in other three groups. These results
indicated that the rat model of liver fibrosis was successfully
established.
| Table III.ISHAK score and Masson-positive area
of the rat livers. |
Table III.
ISHAK score and Masson-positive area
of the rat livers.
| Assay | Control | Model 0 week | Model 2 week | Model 4 week | Model 8 week |
|---|
| Ishak score | 0.00±0.00 |
1.00±0.13 |
2.39±0.49 |
3.62±0.75 |
4.76±1.01 |
| Masson (%) | 2.03±0.28 | 15.17±2.85 | 19.37±2.63 | 25.06±3.55 | 41.26±4.76 |
Examination of miR-200a expression in
rat model of fibrosis
Based on the lower miR-200a expression in clinical
samples, the expression level of miR-200a in the rat model of
fibrosis with was further measured using RT-qPCR. It was identified
that miR-200a expression was gradually decreased over the model
progression period (Fig. 2C).
Hence, it was suggested that the decrease in miR-200a expression
may be involved in the progression of liver fibrosis.
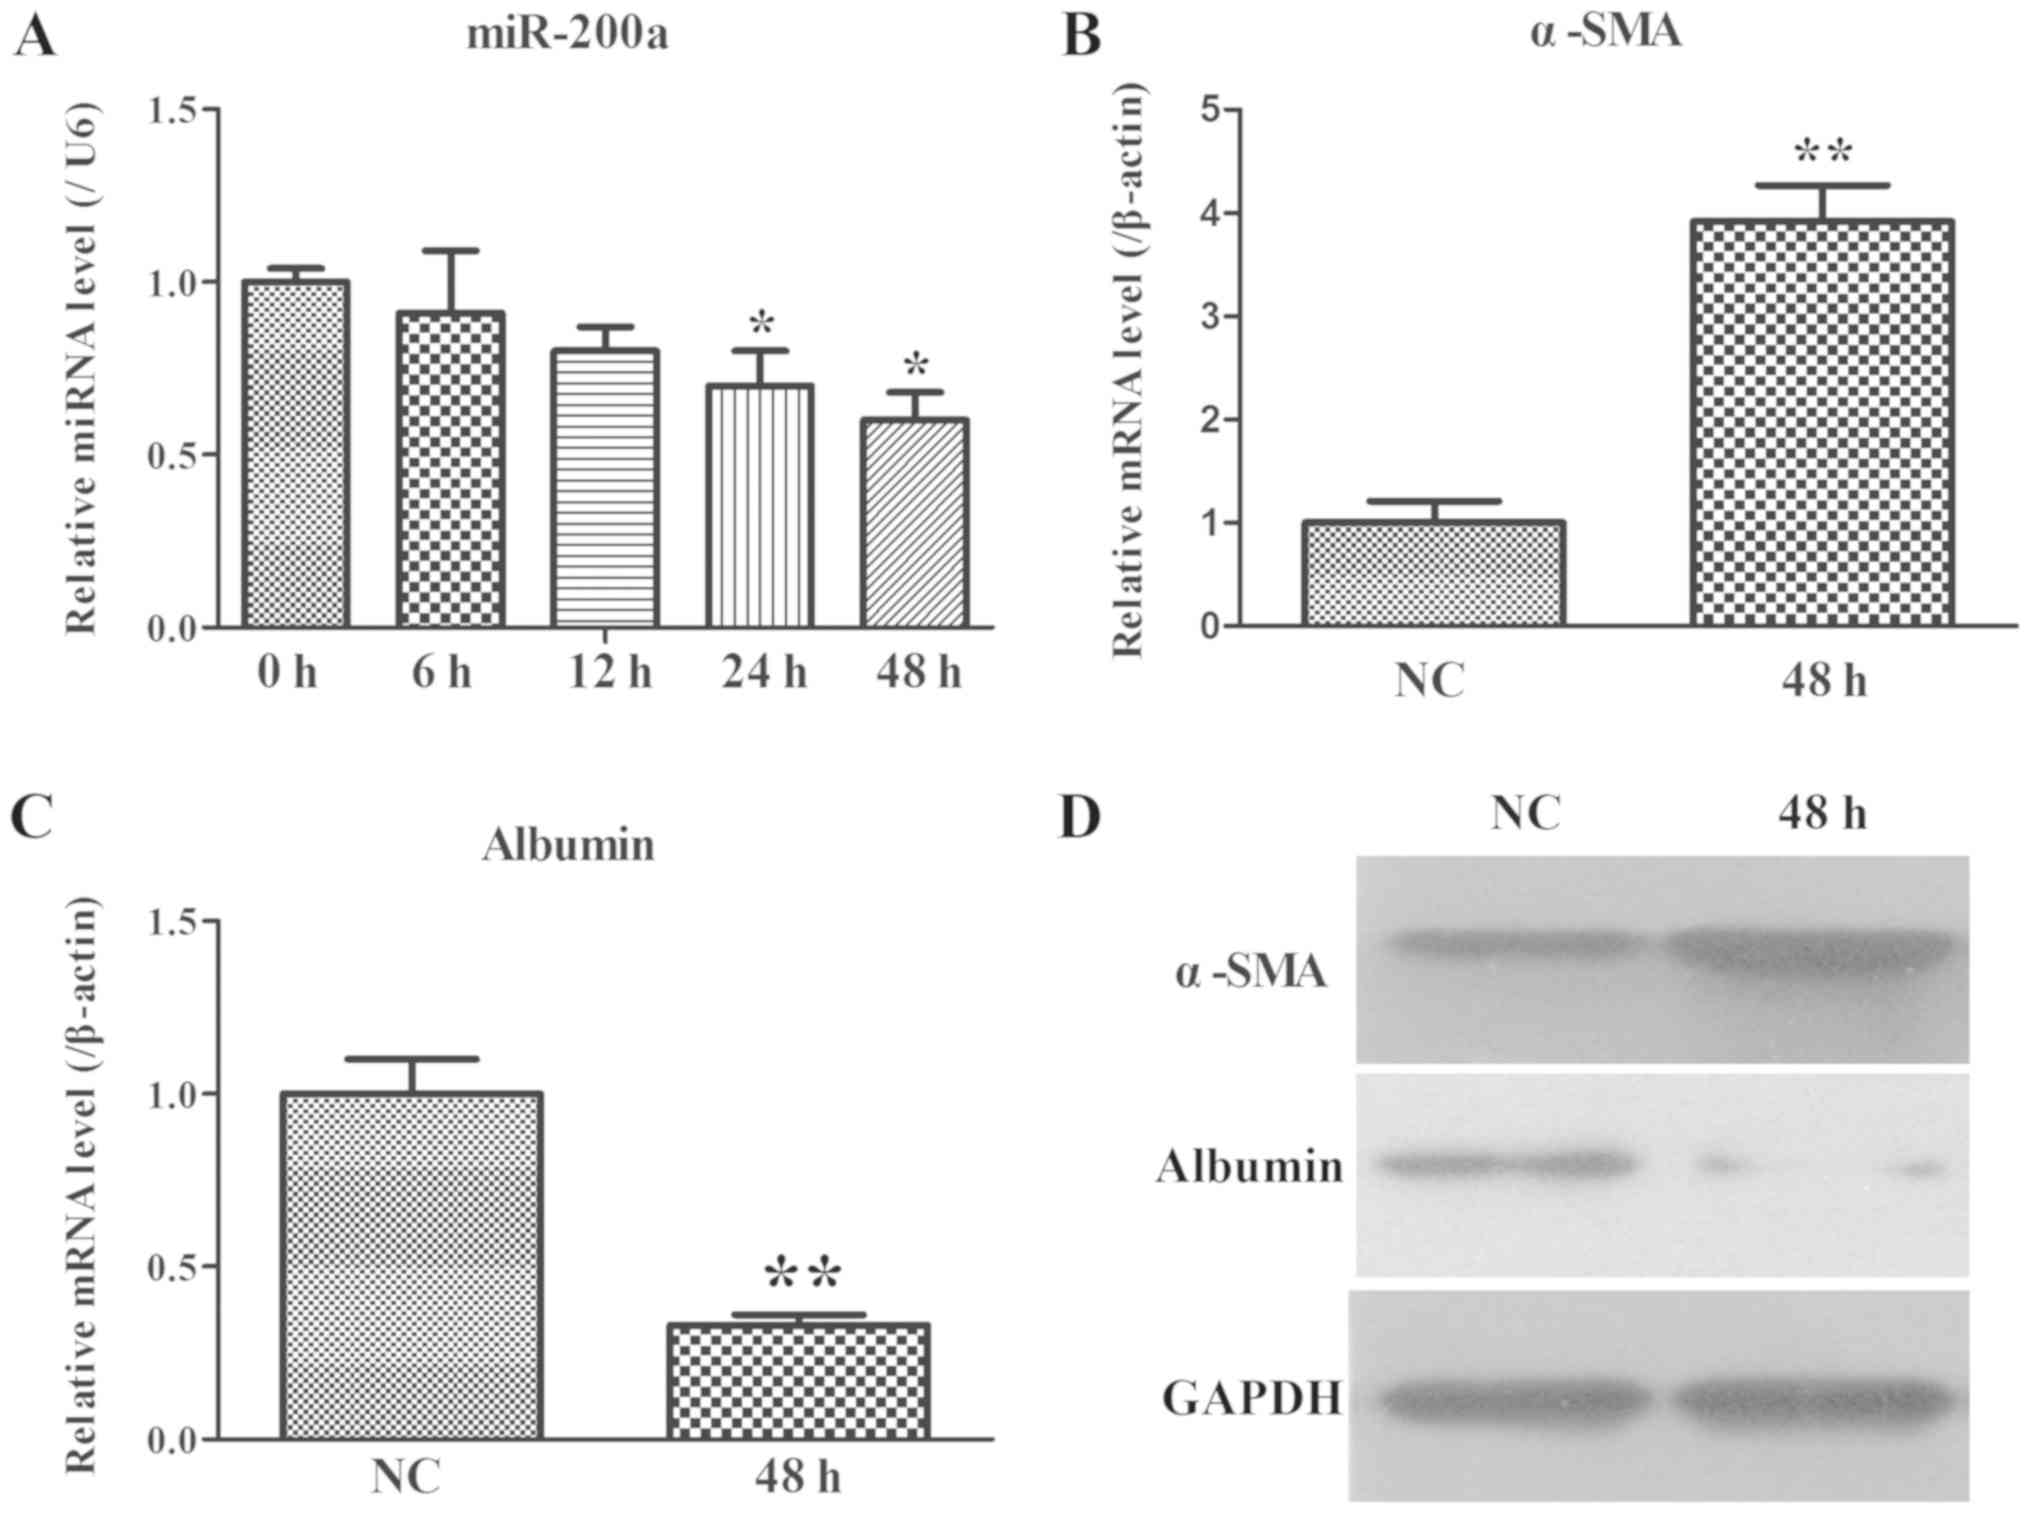
miR-200a and fibrosis-related gene
expression in the co-culture system of LX2 and THP-1 cells
HSCs, such as LX2 cells, serve an important function
in the process of liver fibrosis (30), thus LX2 cells were adopted as a
cellular model of human hepatic fibrosis. The miR-200a expression
was determined by RT-qPCR and it was established that the levels of
miR-200a gradually declined in time-dependent manner (Fig. 3A).
α-SMA, as the marker of activated HSCs (30), was evaluated at the mRNA and
protein level using RT-qPCR and WB, respectively. The results
revealed that upregulated expression of α-SMA was found (Fig. 3B and D). Additionally, changes in
albumin were also measured as they are the major predictor of liver
fibrosis in patients. Downregulated expression of albumin was
observed (Fig. 3C and D). These
data further suggested that the co-culture system with activated
LX2 cells and miR-200a may serve an important role in the
development of liver fibrosis.
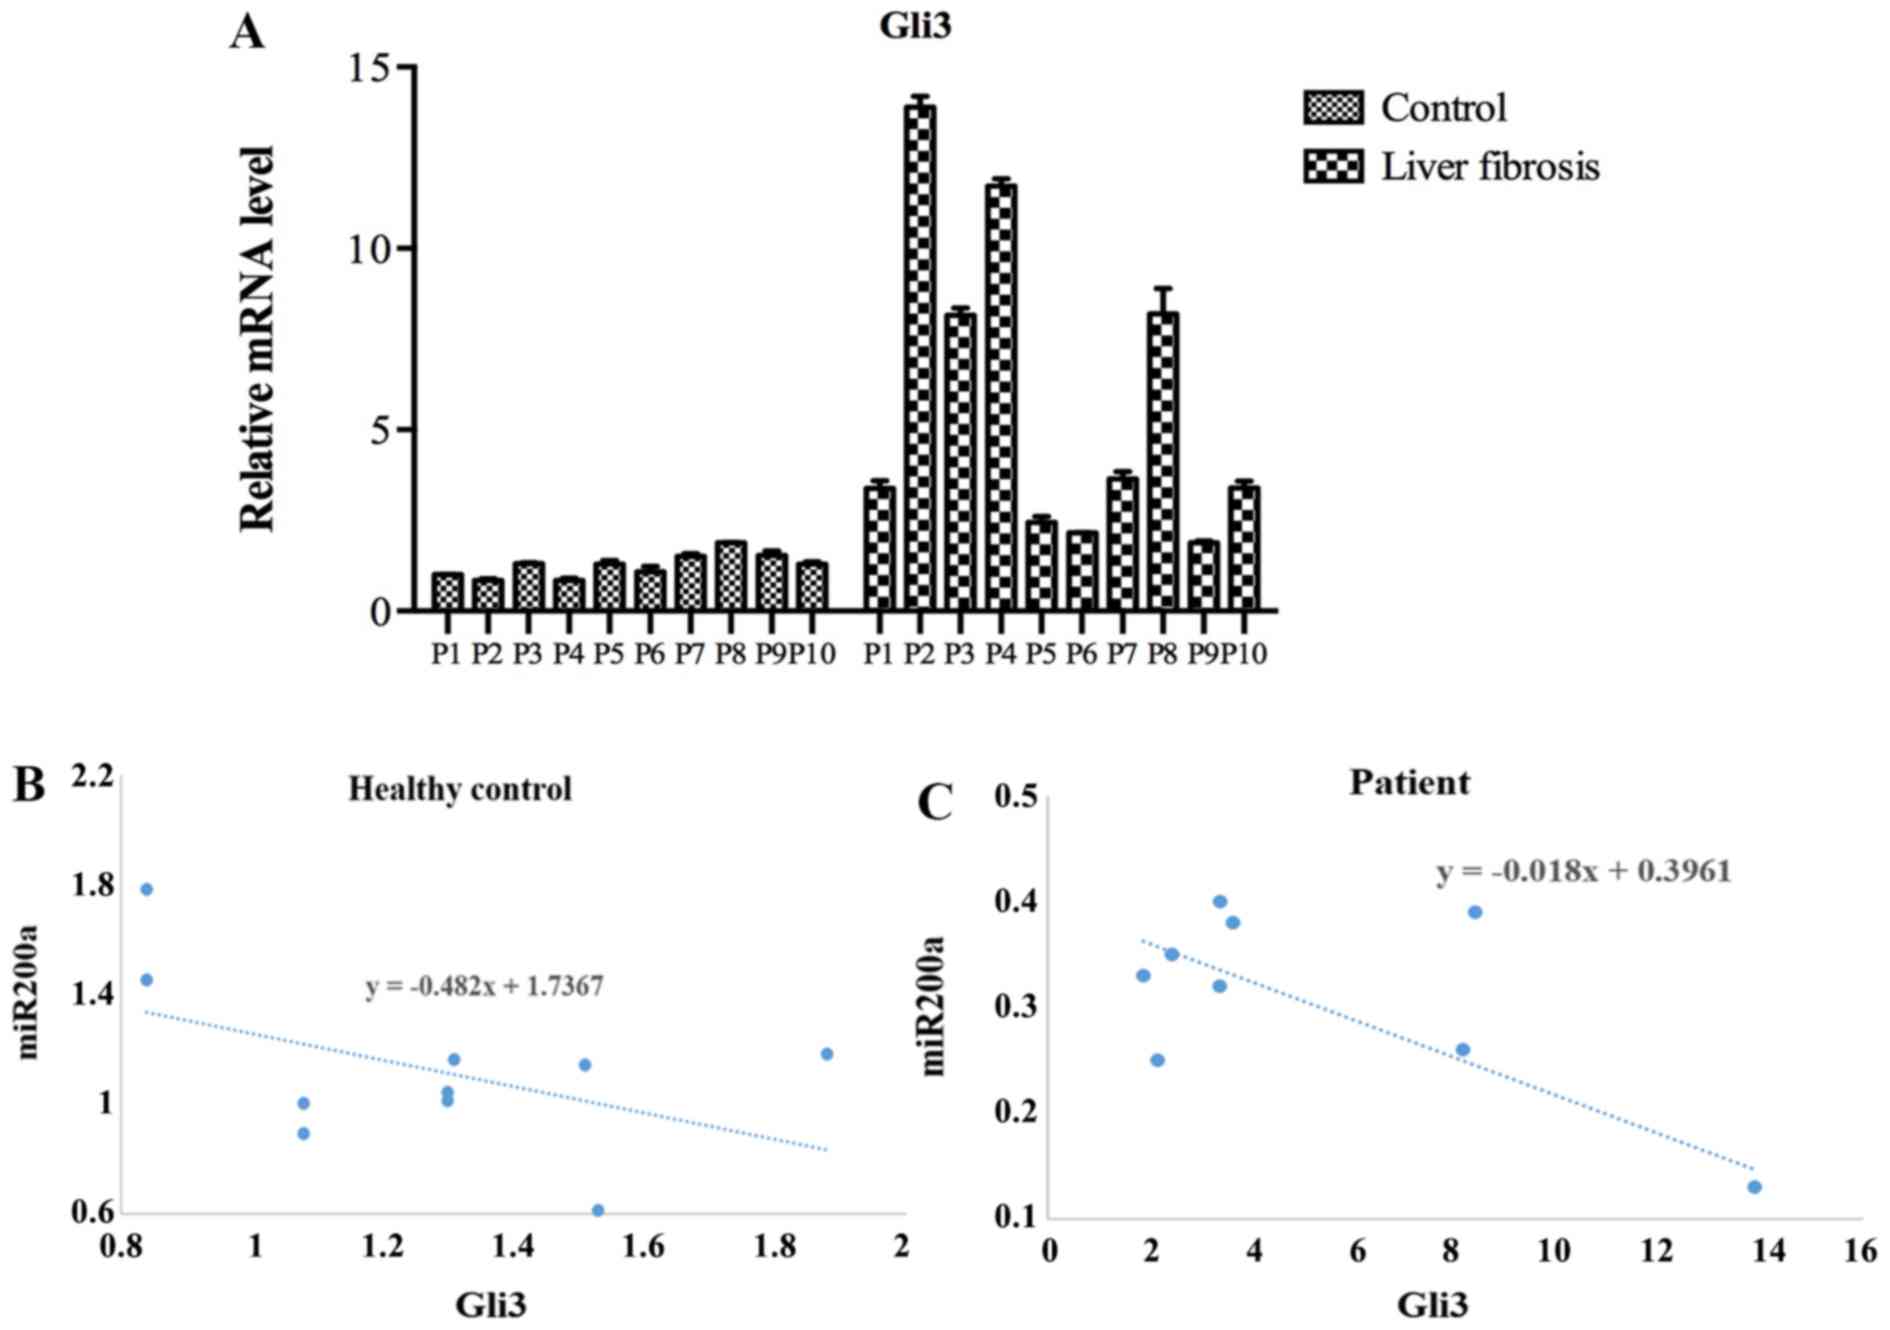
Roles of miR-200a in serum
specimens
Gli3 is related to liver fibrosis. Thereafter, the
expression of Gli3 in the serum was measured. Results demonstrated
that the Gli3 level was clearly elevated in liver fibrosis patients
compared with the controls (Fig.
4A). Moreover, the Gli3 expression and miR200a expression were
negatively correlated, with the R2 value being 0.69 in
the healthy control and 0.73 in the fibrosis patients (Figs. 4B and C and S1).
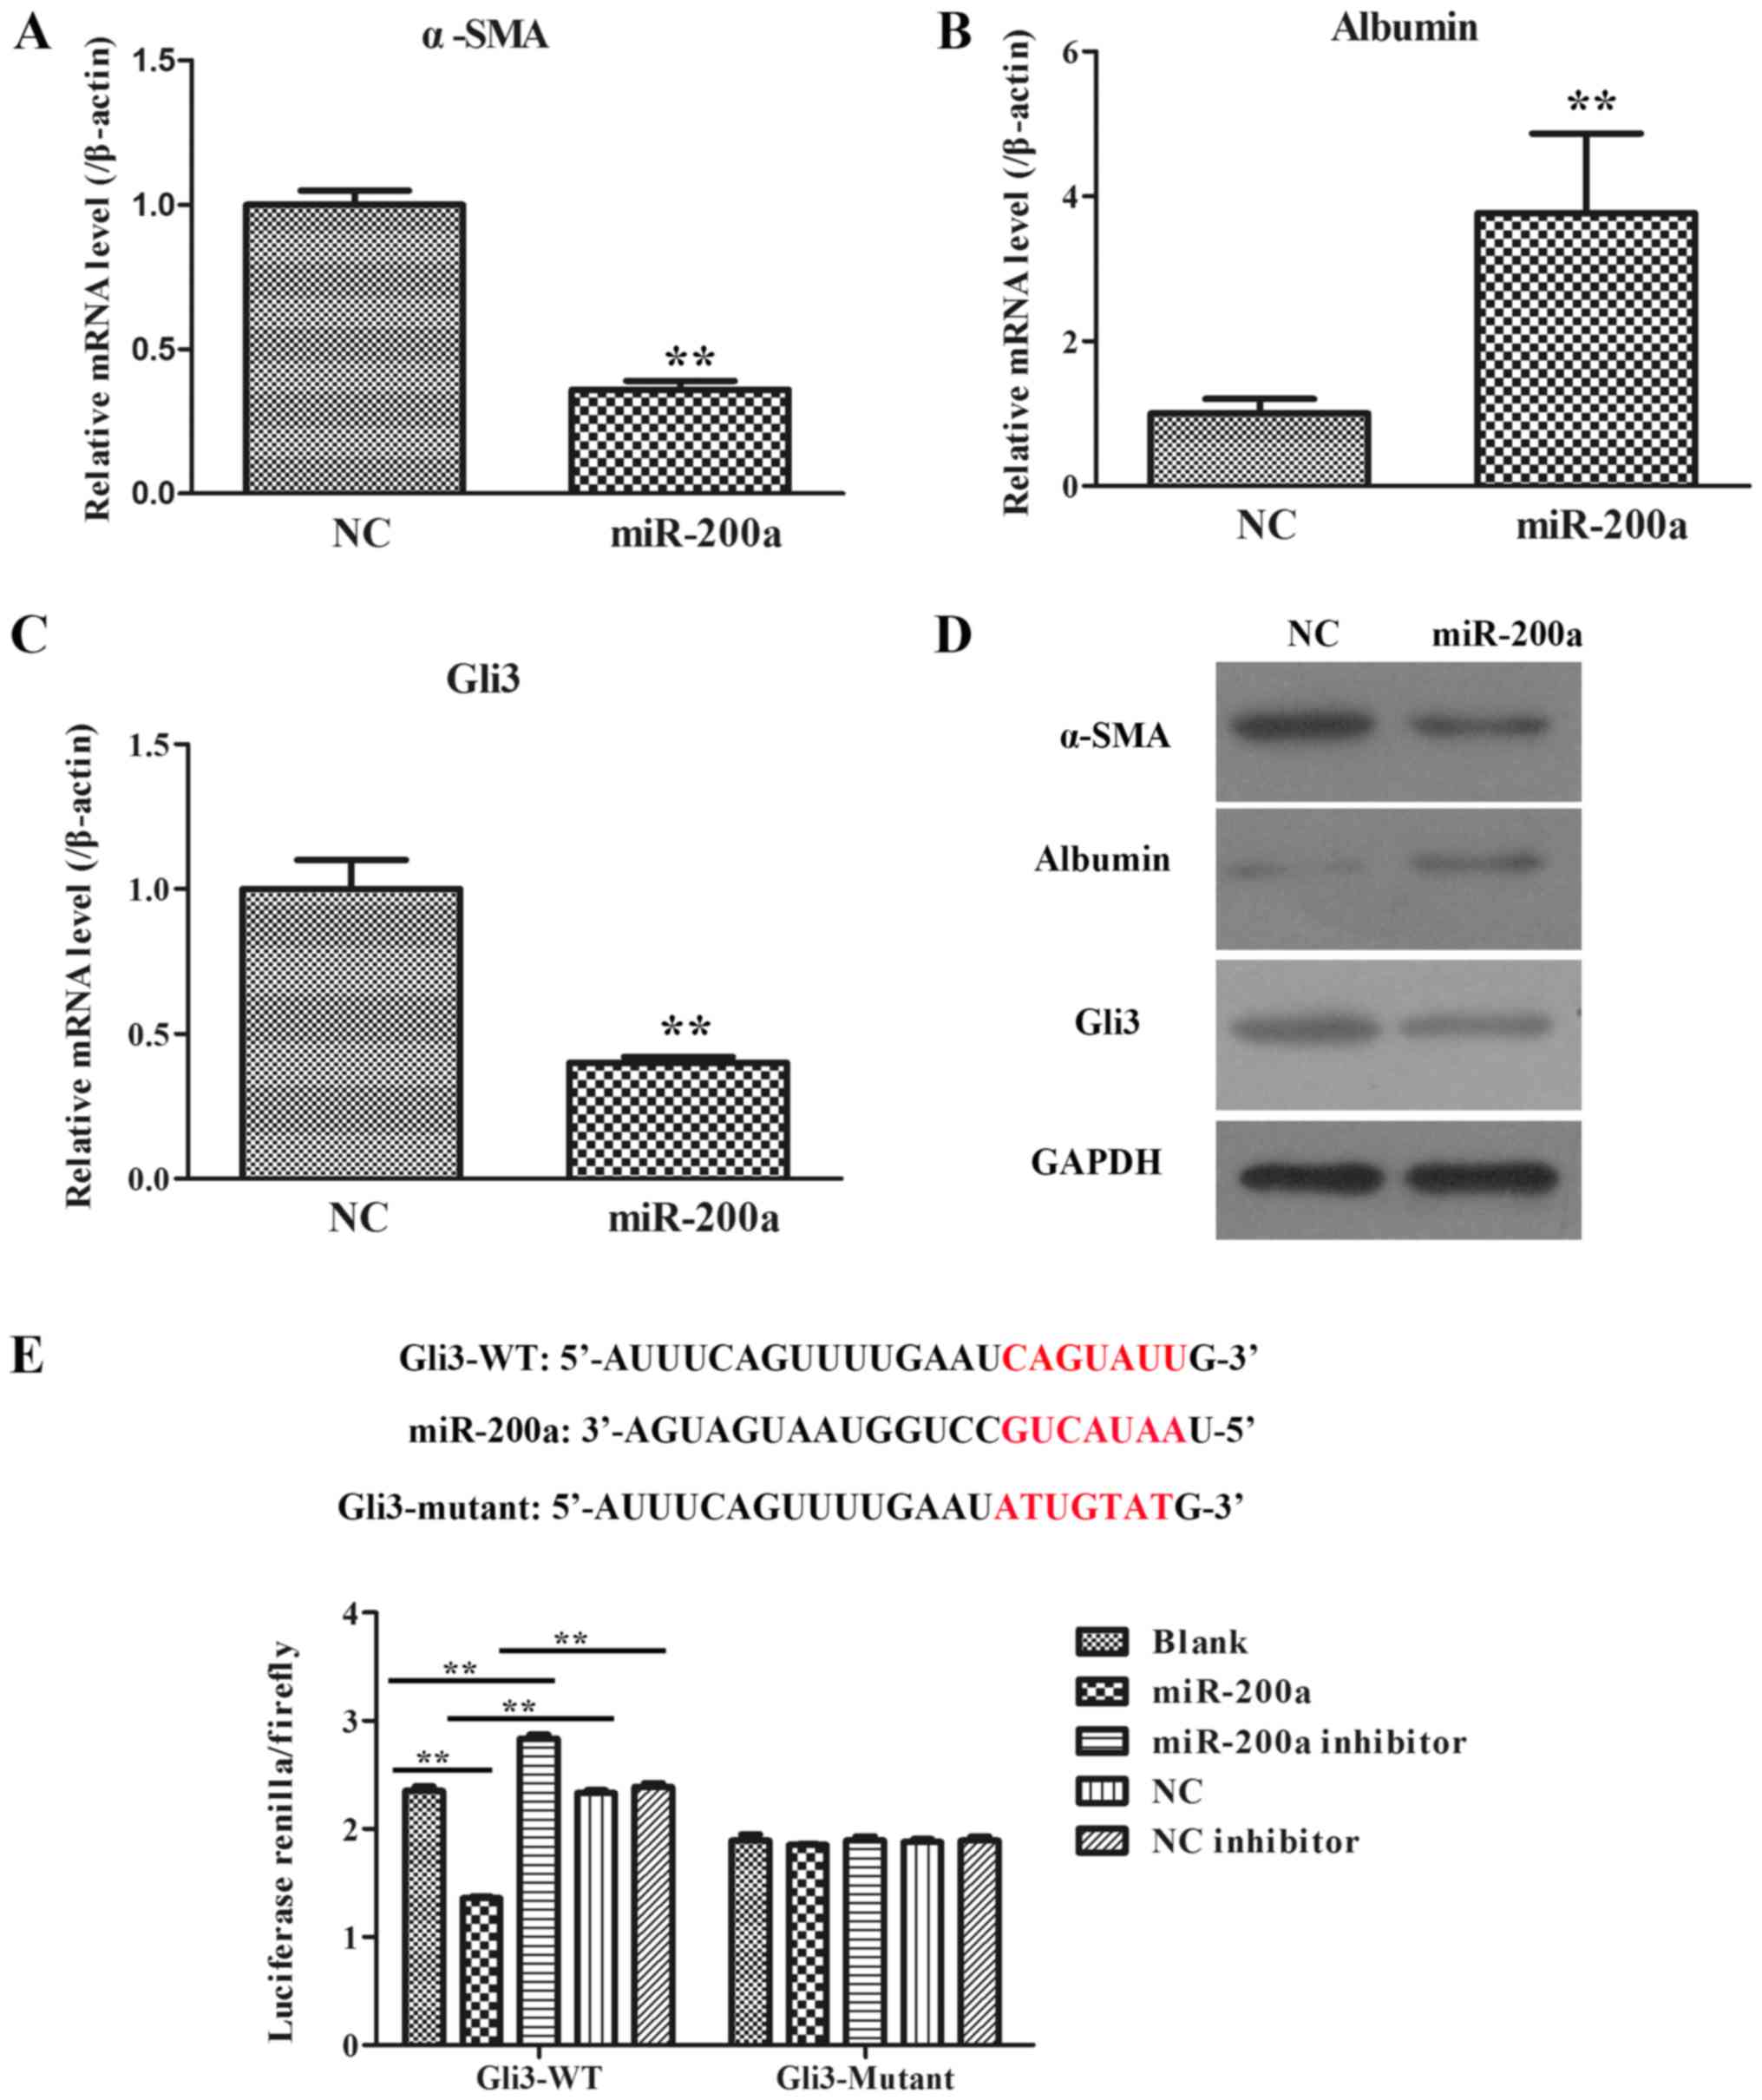
Roles of miR-200a in activated LX2
cells
In order to further explore the effects of miR-200a
during the formation of liver fibrosis, fibrosis-related gene and
protein expression (α-SMA, albumin and Gli3) were determined by
RT-qPCR and WB in LX2 cells with NC plasmid and miR-200a mimic
transfection. It was demonstrated that the mRNA and protein
expressions of α-SMA and Gli3 in miR-200a group were notably lower
compared with the NC group (Fig. 5A, C
and D), whereas the mRNA and protein expression levels of
albumin in the miR-200a group were markedly higher than those in
the NC group (Fig. 5B and D).
Thus, these data demonstrated that miR-200a might suppress α-SMA
and Gli3 expression and facilitate albumin expression.
miR-200a directly acts on the 3′-UTRs
of Gli3
Through computational target prediction, it was
found that the 3′-UTRs of Gli3 contained putative binding sites for
miR-200 (Fig. 5E). To verify
whether miR-200a directly binds to the 3′-UTRs of Gli3 and causes
translational inhibition, dual-luciferase reporter assays were
performed using 293T cells. The miR-200a mimics significantly
decreased the luciferase activity of the Gli3 3′-UTR-dependent
reporter, but it did not affect the luciferase activity of the
mutant reporter (Fig. 5E). The
mimics control had no effect on either WT or mutant reporter
luciferase activity, suggesting that miR-200a might directly act on
the 3′-UTRs of Gli3 mRNA.
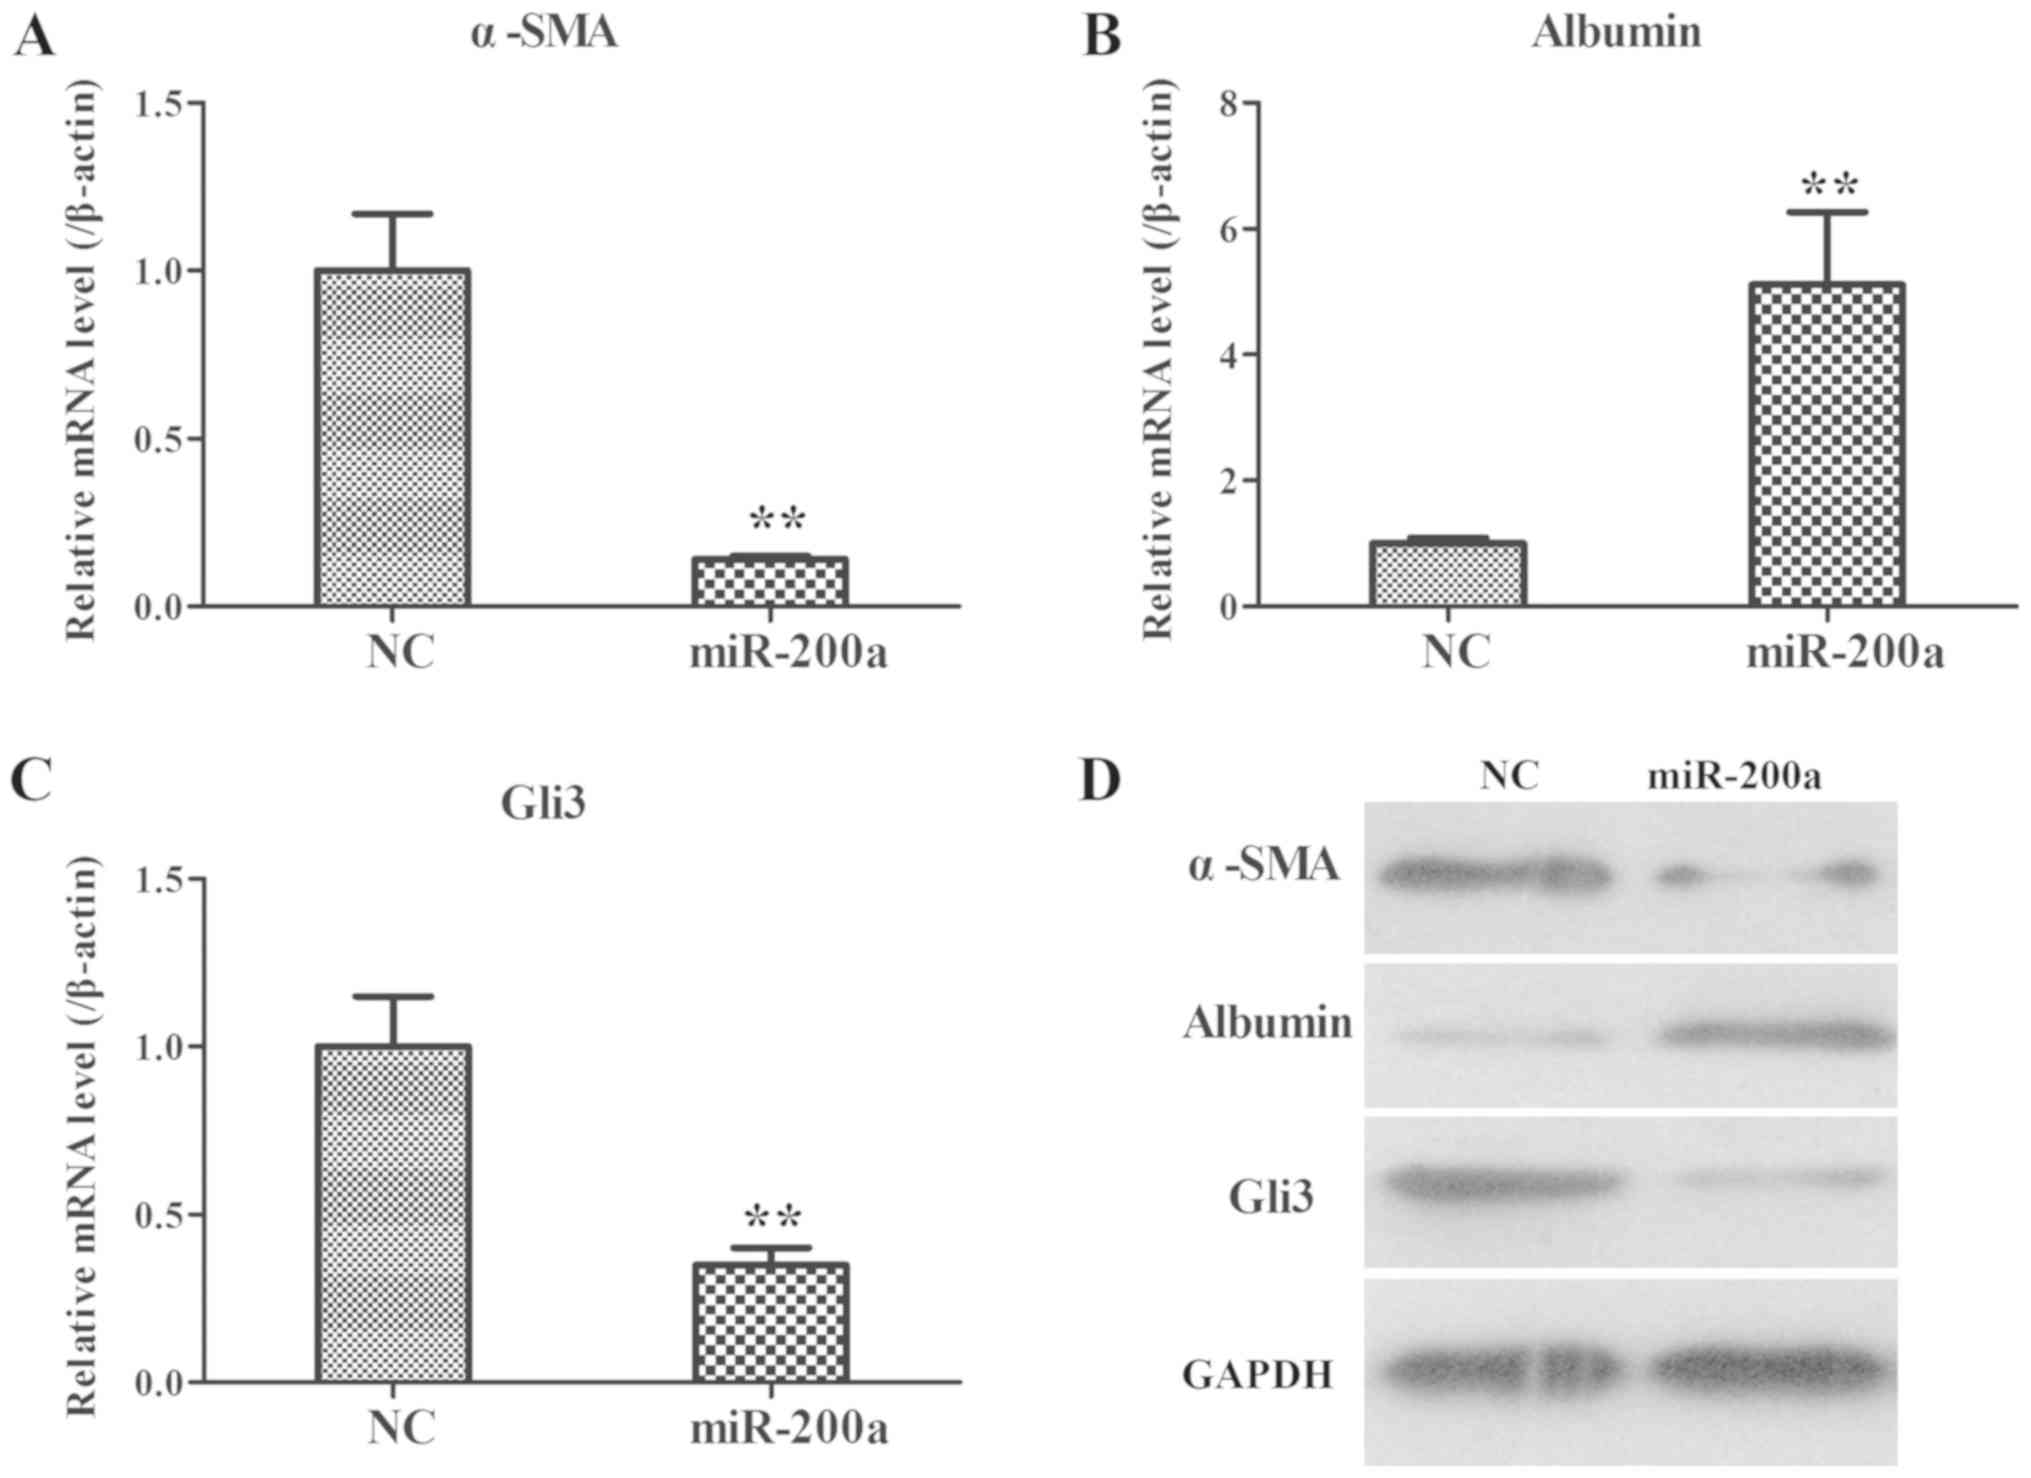
Effects of over-expression of miR-200a
in a rat model of liver fibrosis
Next, miR-200a agomir was used to confirm the role
of miR-200a in vivo. As demonstrated in Fig. 6, in line with the results of
miR-200a mimic-transfected LX2 cells, the mRNA and protein
expressions of α-SMA and Gli3 were significantly decreased in the
livers of rats receiving miR-200a agomir, while the mRNA and
protein expression levels of albumin were significantly increased.
Taken together, these data indicated that miR-200a could decrease
α-SMA and Gli3 expression, while increasing albumin expression
in vivo and in vitro.
Discussion
Liver fibrosis, which is characterized by the
accumulation of ECM, is a common response to many types of liver
injury (2). Recently, miRNAs have
emerged as key regulators in chronic liver diseases, including
hepatic fibrosis (31). For
example, miR-145 inhibits HSC activation and proliferation by
targeting zinc finger E-box-binding homeobox 2 (ZEB2) through the
Wnt/β-catenin pathway (32);
miR-222 overexpression may contribute to liver fibrosis in biliary
atresia by targeting serine/threonine-protein phosphatase 2A 55 kDa
regulatory subunit B α isoform (33). The results of the present study
showed that miR-200a was significantly reduced in serum samples
from clinical patients, liver tissues from CCl4-induced
model rats and activated LX2 cells, suggesting that the
downregulation of miR-200a may exert an important role in liver
fibrosis.
Fibrogenesis-related indexes, including
hydroxyproline content, collagen deposition, α-SMA expression and
albumin expression were identified in CCl4-induced rat
models and activated LX2 cells. It was found that the hepatic
hydroxyproline content and the Masson's trichrome-positive area in
liver tissues from CCl4-treated rats were apparently
increased in comparison with those in control rats. Moreover, the
expression levels of α-SMA were also clearly elevated. Therefore,
the results indicated that the liver fibrosis of model rats was
successfully established. Additionally, it was found that α-SMA and
albumin expression at the mRNA and protein levels were markedly
upregulated in a co-culture system of LX2 and THP-1 cells. The
activation of HSCs is a critical event in the development of liver
fibrosis (34). In response to
injury, HSCs become activated into proliferative myofibroblasts,
migrate into the surrounding parenchymal cells and secrete
tissue-damaging ECM (35). It is
known that a single miRNA may target >100 mRNAs (36). miR-200a was reported to target
ZEB2, thioredoxin-interacting protein/NACHT, LRR and PYD
domains-containing protein 3 and insulin-like growth factor 2 to
regulate cell growth, hepatic inflammation and placental
development (37–39). Recently, the role of Gli3 in liver
fibrosis has attracted attention (40). Gli3 is the upstream transcriptional
activator of Hh signaling (41).
There is emerging evidence that Hh, a master developmental
regulator, becomes reactivated during adult wound healing (42). Hh signaling is initiated by the
interactions of Hh receptor Patched, Hh ligands (Sonic hedgehog,
Indian hedgehog, and Desert hedgehog), and other molecules (such as
Gli3) (43). A previous study
demonstrated that Gli3 is implicated in the pathogenesis of liver
fibrosis via miR-378 regulation (40). In the present study, Gli3 was
predicted to be a target of miR-200a. Moreover, the serum Gli3
level in patients with liver fibrosis was negatively related to
miR-200a. By using LX2 cells (a common type of HSC), it was also
found that forced expression of miR-200a suppressed α-SMA and Gli3
expression and promoted albumin expression. In addition, it was
demonstrated that miR-200a could target the 3′-UTR of Gli3, as
detected by dual-luciferase reporter assay. Ultimately, at the
animal model level, it was further verified that the expression
levels of α-SMA and Gli3 were decreased in liver tissues from
CCl4-treated rats injected with miR-200a agomir, whereas
the albumin level was enhanced, implying that elevated levels of
miR-200a were negatively correlated with Gli3 in activated LX2
cells and rat livers. There is still a limitation in the present
study; it only included the serum samples of the patients.
Subsequent experiments may include the collection of liver samples
to analyze liver miRNA and Gli3 expression.
Taken together, the results of the present study
identified that miR-200a was markedly downregulated during the
process of liver fibrosis. The present study also evaluated the
target relationship of miR-200a and Gli3. Additionally, restoring
miR-200a expression by giving miR-200a mimic in
CCl4-induced liver fibrosis rats and activated LX2 cells
could attenuate pro-fibrotic gene expression and enhance
anti-fibrotic gene expression. These findings concluded that
miR-200a might be a potential target to attenuate liver fibrosis by
suppressing Gli3.
Supplementary Material
Supporting Data
Acknowledgements
Not applicable.
Funding
The present study was supported by a Research Fund
from the Yunnan Provincial Department of Education (grant no.
2013C239) and a Postdoctoral Supporting Fund from Kunming Human
Resources and Social Security Bureau (grant no. 20140298).
Availability of data and materials
The datasets generated and/or analyzed during the
present study are available from the corresponding author on
reasonable request.
Authors' contributions
LiL and JR made substantial contributions to
conception and design. LiL, LaL and GC were involved in the design
of the concept, drafting the manuscript and revising it critically
for important intellectual content. SZ collected the blood samples
of patients and healthy donors, and performed the relevant
detection in samples. YW collected and analyzed the data in the
animal experiments, and edited the manuscript. All authors read and
approved the final manuscript.
Ethics approval and consent to
participate
The study protocol was approved by the Ethics
Committee of First People's Hospital of Kunming City. The animal
experiments were approved by the Ethics Committee of First People's
Hospital of Kunming City and complied with the National Institutes
of Health Guide for the Care and Use of Laboratory Animals. Prior
informed consent was obtained from all patients.
Patient consent for publication
Not applicable.
Competing interests
The authors declare that they have no competing
interests.
References
|
1
|
Lee UE and Friedman SL: Mechanisms of
hepatic fibrogenesis. Best Pract Res Clin Gastroenterol.
25:195–206. 2011. View Article : Google Scholar : PubMed/NCBI
|
|
2
|
Elpek GÖ: Cellular and molecular
mechanisms in the pathogenesis of liver fibrosis: An update. World
J Gastroenterol. 20:7260–7276. 2014. View Article : Google Scholar : PubMed/NCBI
|
|
3
|
Friedman SL: Mechanisms of disease:
Mechanisms of hepatic fibrosis and therapeutic implications. Nat
Clin Pract Gastroenterol Hepatol. 1:98–105. 2004. View Article : Google Scholar : PubMed/NCBI
|
|
4
|
Coletta M, Nicolini D, Benedetti
Cacciaguerra A, Mazzocato S, Rossi R and Vivarelli M: Bridging
patients with hepatocellular cancer waiting for liver transplant:
All the patients are the same? Transl Gastroenterol Hepatol.
2:782017. View Article : Google Scholar : PubMed/NCBI
|
|
5
|
Lim R, Ricardo SD and Sievert W:
Cell-based therapies for tissue fibrosis. Front Pharmacol.
8:6332017. View Article : Google Scholar : PubMed/NCBI
|
|
6
|
Treiber T, Treiber N, Plessmann U,
Harlander S, Daiß JL, Eichner N, Lehmann G, Schall K, Urlaub H and
Meister G: A compendium of RNA-binding proteins that regulate
MicroRNA biogenesis. Mol Cell. 66:270–284 e13. 2017. View Article : Google Scholar : PubMed/NCBI
|
|
7
|
Liu X, Fortin K and Mourelatos Z:
MicroRNAs: Biogenesis and molecular functions. Brain Pathol.
18:113–121. 2008. View Article : Google Scholar : PubMed/NCBI
|
|
8
|
Murakami Y and Kawada N: MicroRNAs in
hepatic pathophysiology. Hepatol Res. 47:60–69. 2017. View Article : Google Scholar : PubMed/NCBI
|
|
9
|
Roderburg C, Urban GW, Bettermann K,
Bettermann K, Vucur M, Zimmermann H, Schmidt S, Janssen J, Koppe C,
Knolle P, et al: Micro-RNA profiling reveals a role for miR-29 in
human and murine liver fibrosis. Hepatology. 53:209–218. 2011.
View Article : Google Scholar : PubMed/NCBI
|
|
10
|
Sekiya Y, Ogawa T, Yoshizato K, Ikeda K
and Kawada N: Suppression of hepatic stellate cell activation by
microRNA-29b. Biochem Biophys Res Commun. 412:74–79. 2011.
View Article : Google Scholar : PubMed/NCBI
|
|
11
|
Ogawa T, Iizuka M, Sekiya Y, Yoshizato K,
Ikeda K and Kawada N: Suppression of type I collagen production by
microRNA-29b in cultured human stellate cells. Biochem Biophys Res
Commun. 391:316–321. 2010. View Article : Google Scholar : PubMed/NCBI
|
|
12
|
Li J, Ghazwani M, Zhang Y, Lu J, Li J, Fan
J, Gandhi CR and Li S: miR-122 regulates collagen production via
targeting hepatic stellate cells and suppressing P4HA1 expression.
J Hepatol. 58:522–528. 2013. View Article : Google Scholar : PubMed/NCBI
|
|
13
|
Zhao J, Tang N, Wu K, Dai W, Ye C, Shi J,
Zhang J, Ning B, Zeng X and Lin Y: MiR-21 simultaneously regulates
ERK1 signaling in HSC activation and hepatocyte EMT in hepatic
fibrosis. PLoS On. 9:e1080052014. View Article : Google Scholar
|
|
14
|
He Y, Huang C, Zhang SP, Sun X, Long XR
and Li J: The potential of microRNAs in liver fibrosis. Cell
Signal. 24:2268–2272. 2012. View Article : Google Scholar : PubMed/NCBI
|
|
15
|
Yang S, Banerjee S, de Freitas A, Sanders
YY, Ding Q, Matalon S, Thannickal VJ, Abraham E and Liu G:
Participation of miR-200 in pulmonary fibrosis. Am J Pathol.
180:484–493. 2012. View Article : Google Scholar : PubMed/NCBI
|
|
16
|
Xu M, Wang G, Zhou H, Cai J, Li P, Zhou M,
Lu Y, Jiang X, Huang H, Zhang Y and Gong A: TGF-β1-miR-200a-PTEN
induces epithelial-mesenchymal transition and fibrosis of
pancreatic stellate cells. Mol Cell Biochem. 431:161–168. 2017.
View Article : Google Scholar : PubMed/NCBI
|
|
17
|
Yang JJ, Tao H, Hu W, Liu LP, Shi KH, Deng
ZY and Li J: MicroRNA-200a controls Nrf2 activation by target Keap1
in hepatic stellate cell proliferation and fibrosis. Cell Signal.
26:2381–2389. 2014. View Article : Google Scholar : PubMed/NCBI
|
|
18
|
Sun X, He Y, Ma TT, Huang C, Zhang L and
Li J: Participation of miR-200a in TGF-β1-mediated hepatic stellate
cell activation. Mol Cell Biochem. 388:11–23. 2014. View Article : Google Scholar : PubMed/NCBI
|
|
19
|
Riobo NA and Manning DR: Pathways of
signal transduction employed by vertebrate Hedgehogs. Biochem J.
403:369–379. 2007. View Article : Google Scholar : PubMed/NCBI
|
|
20
|
Bloomsmith MA, Perlman JE, Hutchinson E
and Sharpless M: Behavioral management programs to promote
laboratory animal welfare. Weichbrod RH, Thompson GAH and Norton
JN: Management of animal care and use programs in research,
education, and testing. 2nd. Boca Raton (FL): CRC Press/Taylor
& Francis. Chapter 5. 2018
|
|
21
|
Prestigiacomo V, Weston A, Messner S,
Lampart F and Suter-Dick L: Pro-fibrotic compounds induce stellate
cell activation, ECM-remodelling and Nrf2 activation in a human
3D-multicellular model of liver fibrosis. PLoS One.
12:e01799952017. View Article : Google Scholar : PubMed/NCBI
|
|
22
|
Park EK, Jung HS, Yang HI, Yoo MC, Kim C
and Kim KS: Optimized THP-1 differentiation is required for the
detection of responses to weak stimuli. Inflamm Res. 56:45–50.
2007. View Article : Google Scholar : PubMed/NCBI
|
|
23
|
Zhou L, Dong X, Wang L, Shan L, Li T, Xu
W, Ding Y, Lai M, Lin X, Dai M, et al: Casticin attenuates liver
fibrosis and hepatic stellate cell activation by blocking
TGF-β/Smad signaling pathway. Oncotarget. 8:56267–56280.
2017.PubMed/NCBI
|
|
24
|
Knight V, Lourensz D, Tchongue J, Correia
J, Tipping P and Sievert W: Cytoplasmic domain of tissue factor
promotes liver fibrosis in rat. World J Gastroenterol.
23:5692–5699. 2017. View Article : Google Scholar : PubMed/NCBI
|
|
25
|
Ishak K, Baptista A, Bianchi L, Callea F,
De Groote J, Gudat F, Denk H, Desmet V, Korb G, MacSween RN, et al:
Histological grading and staging of chronic hepatitis. J Hepatol.
22:696–699. 1995. View Article : Google Scholar : PubMed/NCBI
|
|
26
|
Livak KJ and Schmittgen TD: Analysis of
relative gene expression data using real-time quantitative PCR and
the 2(-Delta Delta C(T)) method. Methods. 25:402–408. 2001.
View Article : Google Scholar : PubMed/NCBI
|
|
27
|
Rasheed SA, Teo CR, Beillard EJ, Voorhoeve
PM and Casey PJ: MicroRNA-182 and microRNA-200a control G-protein
subunit α-13 (GNA13) expression and cell invasion synergistically
in prostate cancer cells. J Biol Chem. 288:7986–7995. 2013.
View Article : Google Scholar : PubMed/NCBI
|
|
28
|
Kim JY, An HJ, Kim WH, Gwon MG, Gu H, Park
YY and Park KK: Anti-fibrotic effects of synthetic
oligodeoxynucleotide for TGF-β1 and smad in an animal model of
liver cirrhosis. Mol Ther Nucleic Acids. 8:250–263. 2017.
View Article : Google Scholar : PubMed/NCBI
|
|
29
|
King A, Houlihan DD, Kavanagh D, Haldar D,
Luu N, Owen A, Suresh S, Than NN, Reynolds G, Penny J, et al:
Sphingosine-1-phosphate prevents egress of hematopoietic stem cells
from liver to reduce fibrosis. Gastroenterology. 153:233–248.e16.
2017. View Article : Google Scholar : PubMed/NCBI
|
|
30
|
Xu F, Han Y, Zhu D, Tian H, Zhu H, Ren J,
Gu D and Duan Y: Construction of a recombinant pIRES2-EGFP-ARTS
plasmid and its effect on LX-2 cells. Mol Med Rep. 16:4737–4743.
2017. View Article : Google Scholar : PubMed/NCBI
|
|
31
|
Jiang XP, Ai WB, Wan LY, Zhang YQ and Wu
JF: The roles of microRNA families in hepatic fibrosis. Cell
Biosci. 7:342017. View Article : Google Scholar : PubMed/NCBI
|
|
32
|
Zhou DD, Wang X, Wang Y, Xiang XJ, Liang
ZC, Zhou Y, Xu A, Bi CH and Zhang L: MicroRNA-145 inhibits hepatic
stellate cell activation and proliferation by targeting ZEB2
through Wnt/β-catenin pathway. Mol Immunol. 75:151–160. 2016.
View Article : Google Scholar : PubMed/NCBI
|
|
33
|
Dong R, Zheng Y, Chen G, Zhao R, Zhou Z
and Zheng S: miR-222 overexpression may contribute to liver
fibrosis in biliary atresia by targeting PPP2R2A. J Pediatr
Gastroenterol Nutr. 60:84–90. 2015. View Article : Google Scholar : PubMed/NCBI
|
|
34
|
Tsuchida T and Friedman SL: Mechanisms of
hepatic stellate cell activation. Nat Rev Gastroenterol Hepatol.
14:397–411. 2017. View Article : Google Scholar : PubMed/NCBI
|
|
35
|
Zhang CY, Yuan WG, He P, Lei JH and Wang
CX: Liver fibrosis and hepatic stellate cells: Etiology,
pathological hallmarks and therapeutic targets. World J
Gastroenterol. 22:10512–10522. 2016. View Article : Google Scholar : PubMed/NCBI
|
|
36
|
Friedman RC, Farh KK, Burge CB and Bartel
DP: Most mammalian mRNAs are conserved targets of microRNAs. Genome
Res. 19:92–105. 2009. View Article : Google Scholar : PubMed/NCBI
|
|
37
|
Xia H, Ng SS, Jiang S, Cheung WK, Sze J,
Bian XW, Kung HF and Lin MC: miR-200a-mediated downregulation of
ZEB2 and CTNNB1 differentially inhibits nasopharyngeal carcinoma
cell growth, migration and invasion. Biochem Biophys Res Commun.
391:535–541. 2010. View Article : Google Scholar : PubMed/NCBI
|
|
38
|
Ding XQ, Wu WY, Jiao RQ, Gu TT, Xu Q, Pan
Y and Kong LD: Curcumin and allopurinol ameliorate fructose-induced
hepatic inflammation in rats via miR-200a-mediated TXNIP/NLRP3
inflammasome. Pharmacol Res. 137:64–75. 2018. View Article : Google Scholar : PubMed/NCBI
|
|
39
|
Saha S, Choudhury J and Ain R:
MicroRNA-141-3p and miR-200a-3p regulate insulin-like growth factor
2 during mouse placental development. Mol Cell Endocrinol.
414:186–193. 2015. View Article : Google Scholar : PubMed/NCBI
|
|
40
|
Hyun J, Wang S, Kim J, Rao KM, Park SY,
Chung I, Ha CS, Kim SW, Yun YH and Jung Y: MicroRNA-378 limits
activation of hepatic stellate cells and liver fibrosis by
suppressing Gli3 expression. Nat Commun. 7:109932016. View Article : Google Scholar : PubMed/NCBI
|
|
41
|
Trnski D, Sabol M, Gojević A, Martinić M,
Ozretić P, Musani V, Ramić S and Levanat S: GSK3β and Gli3 play a
role in activation of Hedgehog-Gli pathway in human colon
cancer-Targeting GSK3β downregulates the signaling pathway and
reduces cell proliferation. Biochim Biophys Acta. 1852:2574–2584.
2015. View Article : Google Scholar : PubMed/NCBI
|
|
42
|
Shen X, Peng Y and Li H: The
injury-related activation of hedgehog signaling pathway modulates
the repair-associated inflammation in liver fibrosis. Front
Immunol. 8:14502017. View Article : Google Scholar : PubMed/NCBI
|
|
43
|
Machado MV and Diehl AM: Hedgehog
signalling in liver pathophysiology. J Hepatol. 68:550–562. 2018.
View Article : Google Scholar : PubMed/NCBI
|