Introduction
The mechanisms underlying the high prevalence of
type 2 diabetes mellitus (T2DM) among obese individuals remain
unclear (1). Insulin resistance
and islet β-cell dysfunction are currently regarded as two key
pathogenic mechanisms in the progression of obesity to diabetes
(2). When various factors lead to
insulin resistance in obese patients, β-cells compensate by
increasing insulin secretion to maintain a normal blood glucose
level and glucose tolerance; however, when the amount of insulin
produced by β-cells is insufficient to compensate for the reduced
insulin sensitivity of tissues, glucose homeostasis is disrupted,
leading to impaired glucose tolerance and ultimately, diabetes
(3).
The highly developed endoplasmic reticulum (ER) is
an important feature of pancreatic β-cells that participates in
multiple cellular biological functions, including insulin
synthesis, post-translational modification and maintenance of
intracellular calcium homeostasis (4). A number of pathological and
physiological factors can influence ER function and disrupt ER
homeostasis to induce ER stress (ERs), such as viral toxins,
inflammatory cytokines, mutations and misfolded protein expression
(5). Pancreatic β-cells are one of
the cell types most sensitive to ERs. Under physiological
conditions, moderate ERs contributes to the regulation of the
synthesis and secretion of insulin by pancreatic β-cells, and helps
maintain glucose homeostasis in the body (6). However, excessive long-term ERs
results in toxic effects, leading to pancreatic β-cell dysfunction
(7). A previous study on obesity
has indicated that ERs is an integral component of obesity, insulin
resistance and T2DM at the molecular, cellular and tissue levels
(8). Excessive ERs is present in
the peripheral tissues of patients with obesity, such as liver,
muscle and adipose tissues (9).
ERs blocks the insulin signaling pathway, leading to insulin
resistance. However, it remains unclear whether excessive ERs also
exists in the pancreatic tissues of individuals with obesity and
leads to impaired islet β-cell functions.
Following ERs development, the accumulation of a
large amount of proteins in the ER lumen induces the downstream
unfolded protein response (UPR) signaling pathway (10). ERs-induced UPR can selectively
activate three signal transduction pathways in cells; a number of
studies have indicated that activation of the protein kinase
RNA-like ER kinase (PERK) and inositol-requiring enzyme 1α (IRE1α)
signaling pathways plays important roles in the pathogenetic
mechanisms underlying β-cell dysfunction (4,11).
However, little is known concerning the influence of activating
transcription factor 6 (ATF6) on β-cell functions. It has been
demonstrated that ERs-inducing factors, such as hypoxia,
tunicamycin and thapsigargin, can upregulate the expression of ATF6
mRNA, indicating that the increase in ATF6 expression is important
for ERs responses and that ATF6 may serve a role in the development
of cell dysfunction, similar to IRE1 and PERK (12).
In the present study, it was investigated as to
whether there was an excessive ERs in the islets of high-fat diet
(HFD)-induced obese mice, and the effects of ERs on β-cell function
were evaluated. Subsequently, it was determined if high
concentrations of palmitate (PA) induced ERs in cultured INS-1
cells, and whether ERs impaired insulin gene transcription.
Finally, whether ERs-impaired insulin gene transcription was
mediated by ATF6 was evaluated.
Materials and methods
HFD-induced obese mice
In total, 36 C57BL/6J mice (male; 3 weeks old;
starting weight, 8.5–10 g) were obtained from Xi'an Jiaotong
University Animal Center. The mice were housed in individual cages.
Mice were provided with access to food and water ad libitum,
and the temperature was controlled at 26–28°C. The relative
humidity was 40–60%, and a 10:14 h light:dark cycle was maintained
every day. After adaptive feeding with a normal diet for 1 week,
the mice were randomly divided into a normal diet group and a HFD
group (18 mice/group) and then fed with general feed or high-fat
feed for 16 weeks. On caloric basis, the HFD consisted of 40% fat
from lard, 41.8% carbohydrate, and 18.2% protein, whereas the
normal diet contained 13.8% fat, 60.5% carbohydrate, and 25.7%
protein. The body weight was measured once per week at a fixed
time.
The study was approved by the Animal Ethics
Committee at Xi'an Jiaotong University (permit no. 2017-30). The
study was conducted in strict accordance with the recommendations
of the Guide for the Care and Use of Laboratory Animals of the
National Institutes of Health and the AVMA Guidelines for the
Euthanasia of Animals 2013 Edition (13,14).
Intraperitoneal glucose tolerance test
(IPGTT) and insulin release test
After 16 weeks, the mice were fasted for 15 h and
subjected to an intraperitoneal injection of 25% glucose at 2 g/kg
body weight. The blood glucose levels in the tail vein were
measured before injection and at 30, 60 and 120 min after injection
using a blood glucose meter. Venous blood samples (0.1 ml/sample)
were collected from the retro-orbital venous plexus before
injection and at 30, 60 and 120 min after injection. All animals
were anesthetized with sodium pentobarbital (40 mg/kg,
intraperitoneal) for retro-orbital sampling of blood. The blood
samples were centrifuged for 15 min at 1,000 × g at 4°C, and then
serum samples were collected and stored at −70°C. ELISA was used
for insulin detection (Mouse Insulin ELISA kit; cat. no. F6301;
Westang Biological Technology Co., Ltd.).
Immunohistochemical analysis
To determine whether exposure to HFD induced
excessive ERs in pancreatic islets, the expression levels of ATF6
and phosphorylated (p)-eukaryotic initiation factor 2α (eIF2α) were
detected via immunofluorescence staining. ATF6 has two subtypes,
ATF6α and ATF6β, with ATF6α playing more of a important role in the
signaling pathway during endoplasmic reticulum stress (12). Therefore, ATF6α was investigated in
the subsequent experiments. At the end of the tolerance test, mice
were euthanized with an overdose of sodium pentobarbital (100
mg/kg, intraperitoneal), and pancreases were then dissected and
frozen in liquid nitrogen (−196°C). Euthanasia was confirmed before
disposal of all animal remains. A combination of criteria were used
in confirming death, including lack of pulse, breathing, corneal
reflex and response to firm toe pinch, graying of the mucous
membranes and rigor mortis. Pancreases were cut into cryostat
sections (4–8 µm; −20°C) and embedded in cryomolds with
Tissue-Tek® O.C.T.™ mounting medium (Sakura Finetek USA,
Inc.). Pancreatic sections were permeabilized with Triton X-100/TBS
and pre-incubated with 2% BSA (cat. no. C500626; Sangon Biotech
Co., Ltd.) in PBS for 10 min at room temperature. The sections were
incubated overnight at 4°C with rabbit anti-mouse p-eIF2α antibody
(1:200; cat. no. 11279; Signalway Antibody LLC) or mouse monoclonal
ATF6 antibody (1:100; cat. no. ab11909; Abcam). The sections were
rinsed three times with PBS, and incubated for 1 h at 4°C with the
secondary antibody, Cy3®-conjugated goat anti-rabbit or
goat anti-mouse IgG antibody (1:100; cat. nos. BA1031 and BA1032;
Boster Biological Technology). Following washing for three times,
buffered glycerol was added dropwise onto the sections, which were
then covered with coverslips. Staining was observed under a
fluorescence microscope with the magnification of ×20 (Leica
Microsystems GmbH) and ten fields containing islets were randomly
selected from each section. Images were analyzed using Leica
Confocal software (version 2.61; Leica Microsystems GmbH).
Electron microscopy
Mice were sacrificed and pancreatic tissues were
harvested as described above. Pancreatic samples were cut into
small cubes (1 mm3), and immediately placed in a 2.5%
glutaraldehyde fixative solution (containing 0.1 M PBS and 4%
paraformaldehyde) at 4°C for >2 h. After rinsing with PBS, the
samples were fixed in a 2% osmium tetroxide solution at 4°C for 2 h
and and epoxy resin/propylene oxide 1:1 mixture for 1 h at 37°C.
Samples were embedded in epoxy resin for 1 h at 37°C and
polymerized at 60°C overnight for ultra-thin sectioning (thickness,
100 nm). The samples were stained with uranyl acetate and lead
citrate at room temperature for 30 min. Sections were examined
under a H-600 transmission electron microscope (Hitachi, Ltd.) at
80 kV.
Cell culture
The INS-1 rat insulinoma cell line (Biohermes
Biomedical Technology Co., Ltd.) was cultured in 5%
CO2−95% air at 37°C in RPMI-1640 medium (cat. no.
22400071; Thermo Fisher Scientific, Inc.) containing 11.1 mM
glucose and 2 mM l-glutamine. The medium was supplemented with 10%
FBS (cat. no. SV30087; Thermo Fisher Scientific, Inc.), 1 mM
pyruvate, 10 mM HEPES, 0.05 mM 2-mercaptoethanol, 100 U/ml
penicillin and 100 mg/ml streptomycin. All experiments were
performed using INS-1 cells between their 20 and 30th passages.
Preparation of culture media containing PA (cat. no. P9767;
Sigma-Aldrich; Merck KGaA) was performed as follows: The
concentration of PA was 0.5 mM, and the final fatty acid-free BSA
concentration was 0.1 mM. Therefore, the molar ratio of PA:BSA
ranged between 1:1 and 5:1. All control conditions contained the
same quantities of BSA as those with PA. The normal control group
contained RPMI-1640 medium with 10% FBS. The BSA control group
contained RPMI-1640 medium with 0.5% BSA, and the PA treatment
group contained RPMI-1640 medium with 0.5 mM PA and 0.5% BSA.
Western blot analysis
INS-1 cells were plated into 6-well plates
(106 cells/well) and cultured at 37°C for 48 h in
RPMI-1640, followed by further culture in the same medium
containing 0.5 mM PA for 24 h. Cells were collected following PA
treatment and lysed using RIPA protein lysis buffer on ice (cat.
no. R0020; Beijing Solarbio Science and Technology Co., Ltd.).
Samples were centrifuged at 4°C and 12,000 × g for 10 min.
Supernatants were collected and aliquoted. The Bradford protein
assay kit (cat. no. 23200; Thermo Fisher Scientific, Inc.)was used
for protein quantitation. Next, 4X sample buffer was added, and the
samples were heated at 100°C for 10 min to denature proteins for
SDS-PAGE (protein sample, 50 µg/lane; 8% SDS). The proteins were
transferred onto a PVDF membrane and blocked in 5% skimmed milk for
2 h at room temperature. The membrane was incubated with the
anti-ATF6 antibody (1:100; cat. no. ab11909; Abcam) at 4°C
overnight. The membrane was then washed with TBS-Tween 20 (0.1%
Tween 20) and incubated with horseradish peroxidase-conjugated
secondary antibodies (1:100; cat. nos. ZB2301 and ZB2305; Beijing
Zhongshan Golden Bridge Biotechnology Co., Ltd; OriGene
Technologies, Inc.) at 4°C for 2 h. Protein bands were visualized
using an enhanced chemiluminescence kit (cat. no. 32132X3; Thermo
Fisher Scientific, Inc.). GAPDH (1:1,000; cat. no. TA-08; Beijing
Zhongshan Golden Bridge Biotechnology Co., Ltd.) was used as the
internal control. The gray density values were scanned, and the
relative protein expression levels were analyzed using
Gel-Pro-Analyzer software 4.0 (Media Cybernetics, Inc.).
Reverse transcription-quantitative PCR
(RT-qPCR)
For RT-qPCR, total RNA was isolated from INS-1 cells
using TRIzol® reagent (Invitrogen; Thermo Fisher
Scientific, Inc.). cDNA was synthesized using a
PrimeScript® RT Master Mix kit (Takara Bio, Inc.),
according to the manufacturer's protocols. The resulting cDNA was
used for qPCR analysis using an SYBR® Premix Ex Taq™ II
system (Takara Bio, Inc.). For PCR amplification the following
protocol was used: 95°C for 30 sec, followed by 40 cycles of 95°C
for 5 sec and 60°C for 30 sec. qPCR was performed in a Bio-Rad IQ5
system (Bio-Rad Laboratories, Inc.). The following primers were
used: ATF6, forward 5′-ACAAGACCGAAGATGTCCATTGTG-3′, reverse
5′-GATCCTGGTGTCCATGACCTGA-3′; insulin, forward
5′-CAGCACCTTTGTGGTTCTCACTT-3′, reverse 5′-CTCCACCCAGCTCCAGTTGT-3′;
and GAPDH, forward 5′-GGCACAGTCAAGGCTGAGAATG-3′ and reverse
5′-ATGGTGGTGAAGACGCCAGTA-3′.
The amplified products were analyzed by agarose gel
electrophoresis (2% agarose) to validate qPCR analysis. Ethidium
bromide (cat. no. E1385; Sigma-Aldrich; Merck KGaA) was used for
visualization. The standard curve and corresponding values for each
sample were determined using the Bio-Rad IQ5 system. GAPDH was used
as the internal control, and the 2−ΔΔCq method was used
to calculate the relative expression levels of the target genes
(15).
Immunofluorescence analysis (nuclear
localization of ATF6)
Cells were plated on cover glasses before incubating
them for 48 h in the standard culture medium described in the
‘Cell culture’ section. After cultivation for 24 h in media
containing 0.5 mM PA, the cells were fixed in 4% paraformaldehyde
at room temperature for 20 min and permeabilized in Triton X-100 at
room temperature for 30 min. The cells were pre-incubated with 2%
BSA (cat. no. C500626; Sangon Biotech Co., Ltd.) for 10 min at room
temperature. Then the cells were incubated with ATF6 antibody
overnight at 4°C (1:100; cat. no. ab11909; Abcam) and subsequently
the Cy3®-conjugated secondary antibody 1 h at 4°C
(1:100; cat. no. BA1031, Boster Biological Technology). The nuclei
were stained with DAPI for 15 min at room temperature, and the
samples were mounted in glycerol and observed under a fluorescence
microscope with the magnification of ×40.
Small interfering (si)RNA transfection
for ATF6
ATF6--specific siRNAs were synthesized by Samchully
Pharm Co., Ltd. and Bioneer Corporation. Three candidate
ATF6-siRNAs were synthesized and evaluated for their ATF6 knockdown
efficiency prior to the formal experiment. The candidate siRNAs
were transfected into INS-1 cells and the expression of ATF6 was
detected via RT-qPCR after 24 h of transfection. ATF6-siRNA2 had
the greatest impact on ATF6 expression and was selected for
subsequent experiments. The sequences of ATF6-siRNA and the
nonspecific control siRNA (con-siRNA) were as follows: ATF6-siRNA1,
5′-GCAGUCGAUUAUCAGUAUATT-3′ (sense); ATF6-siRNA2,
5′-CUGGGUUCAUAGACAUGAATT-3′ (sense); ATF6-siRNA3,
5′-GGGCAGGAUUAUGAAGUAATT-3′ (sense); con-siRNA,
5′-UUCUCCGAACGUGUCACGUTT-3′ (sense). Transfections were performed
according to the manufacturer's protocols. Briefly, INS-1 cells
were plated into 6-well plates (106 cells/well) and
cultured for 48 h in RPMI-1640. Lipofectamine® 2000
(Invitrogen; Thermo Fisher Scientific, Inc.) was diluted and mixed
with ATF-siRNA. The mixture (containing 100 nmol/l siRNA) was added
to the plates. After 6 h of transfection, transfection was
evaluated by observing the uptake of fluorescein-tagged siRNA
(FAM-siRNA) by the cells under a fluorescence microscope with a
magnification of ×20. Following successful transfection, the
culture medium was replaced with lipophilic medium containing 0.5
mM PA for continuous culture for 24 h. RNA was extracted for
RT-qPCR analysis to detect changes in the expression of insulin
mRNA.
Statistical analysis
Data are presented as the mean ± SE of at least
three independent experiments. Statistical analysis was performed
using one-way ANOVA and two-way ANOVA. Post hoc analysis was
performed using Bonferroni correction for multiple comparisons.
P<0.05 was considered to indicate a statistically significant
difference.
Results
Obese mouse model
The body weights of the HFD-fed mice were similar to
those of the normal diet-fed mice at the beginning of the
experiment (data not shown). During the first week after the
introduction of the HFD, a significantly greater increase in the
body weights of the HFD-fed mice was observed compared with the
normal diet-fed mice (P=0.009). The significant increase in the
body weight gain of the HFD-fed mice relative to the normal diet
control group was maintained until the end of the study. After 16
weeks' induction, mice fed with HFD had 24% higher body weights
(37.4±3.8 g) compared with the normal group (29.8±2.4 g; P=0.0004),
and developed adiposity with excessive adipose tissue pad mass.
Thus, it was determined that the obese model was successfully
established.
IPGTT and insulin release test
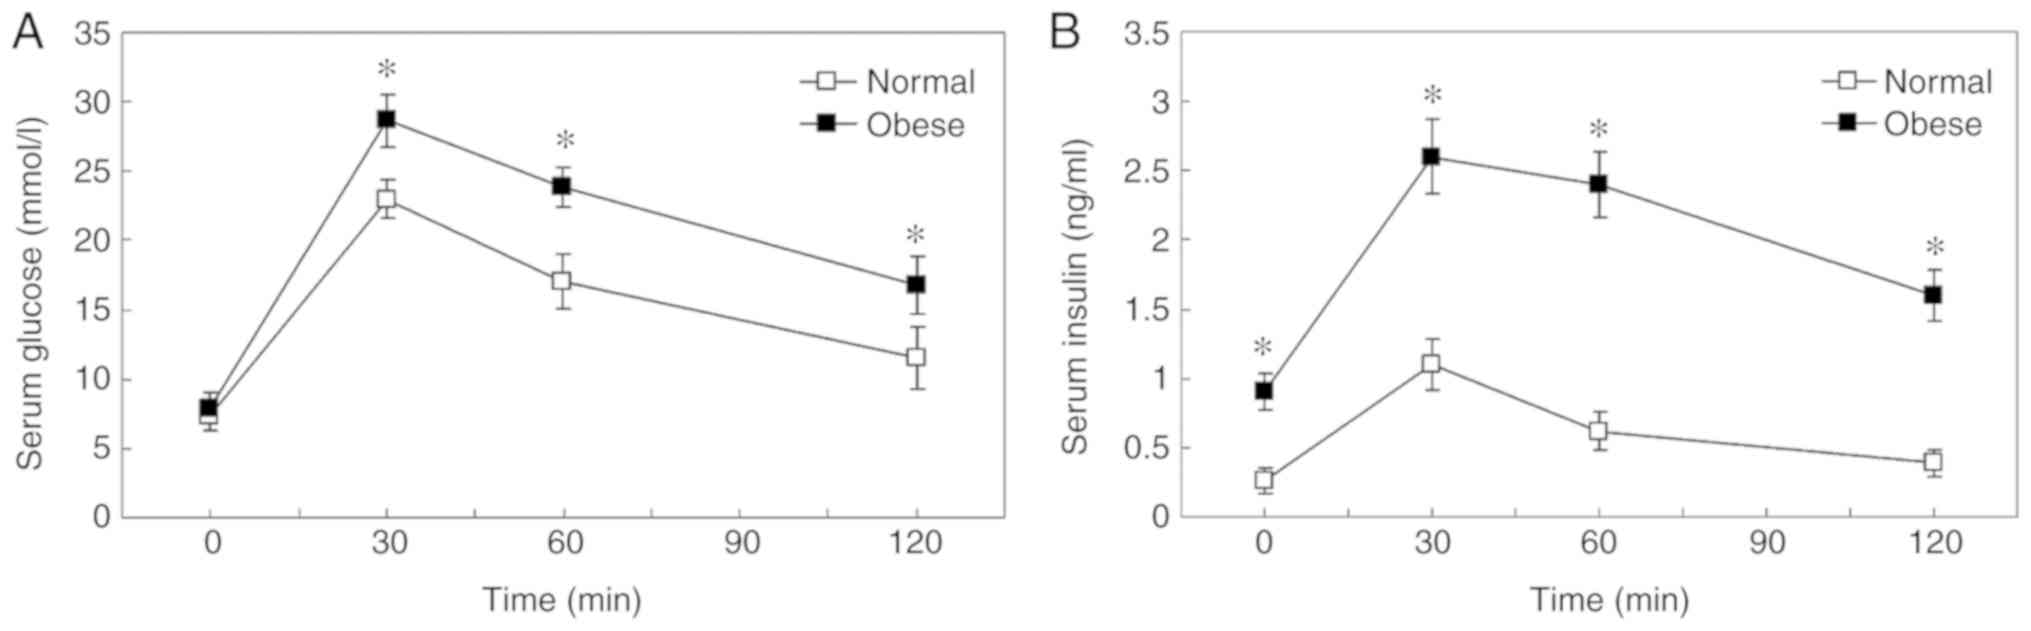
Basal plasma glucose levels of the obese mice were
similar to the normal control. Following an intraperitoneal
injection of glucose, the concentration of glucose in the blood
increased to a maximum at 30 min in the two groups (Fig. 1). Blood glucose levels were notably
higher at 30, 60 and 120 min in obese mice compared with normal
mice, which indicated impaired glucose tolerance (Fig. 1A; P=0.0003 at 30 min; P=0.0006 at
60 min; P=0.0015 at 120 min). In addition, the HFD-induced obese
mice exhibited ~3-fold higher fasting plasma insulin levels
compared with the control groups at the beginning of the study
(P=0.004). Following intraperitoneal injection of glucose, insulin
levels were significantly higher in obese mice compared with normal
control mice at all time points, indicating insulin resistance
(Fig. 1B; P=0.0240 at 30 min;
P=0.0008 at 60 min; P=0.0020 at 120 min;). Plasma insulin levels
increased to a maximum at 30 min in the two groups. Compared with
the baseline, insulin levels of the obese mice increased 3-fold at
30 min, wherever those of the controls increased 5-fold, which
suggested decreased compensatory insulin secretory ability in HFD
mice.
ERs status in the pancreas of obese
mice
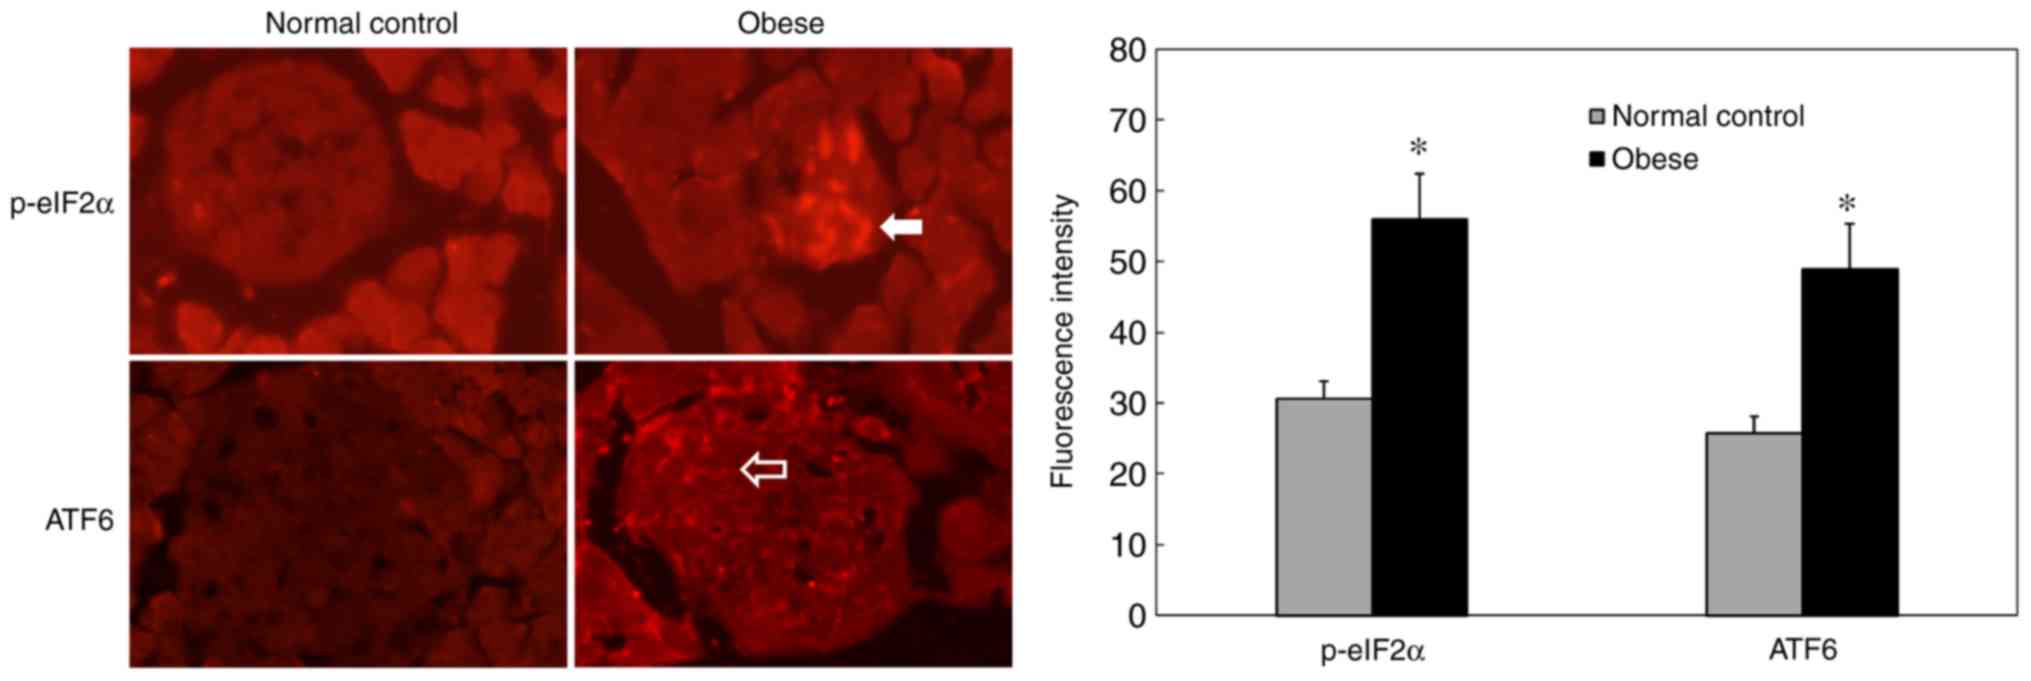
Immunohistochemical staining results showed
increased p-eIF2α expression in pancreatic islets in the obese
group compared with the normal group (Fig. 2; P=0.0071). In addition, ATF6
staining intensity was significantly increased in the pancreatic
islets of obese mice (Fig. 2;
P=0.0115). These results suggested that the pancreatic islets of
obese mice had undergone excessive ERs and that the ATF6 signaling
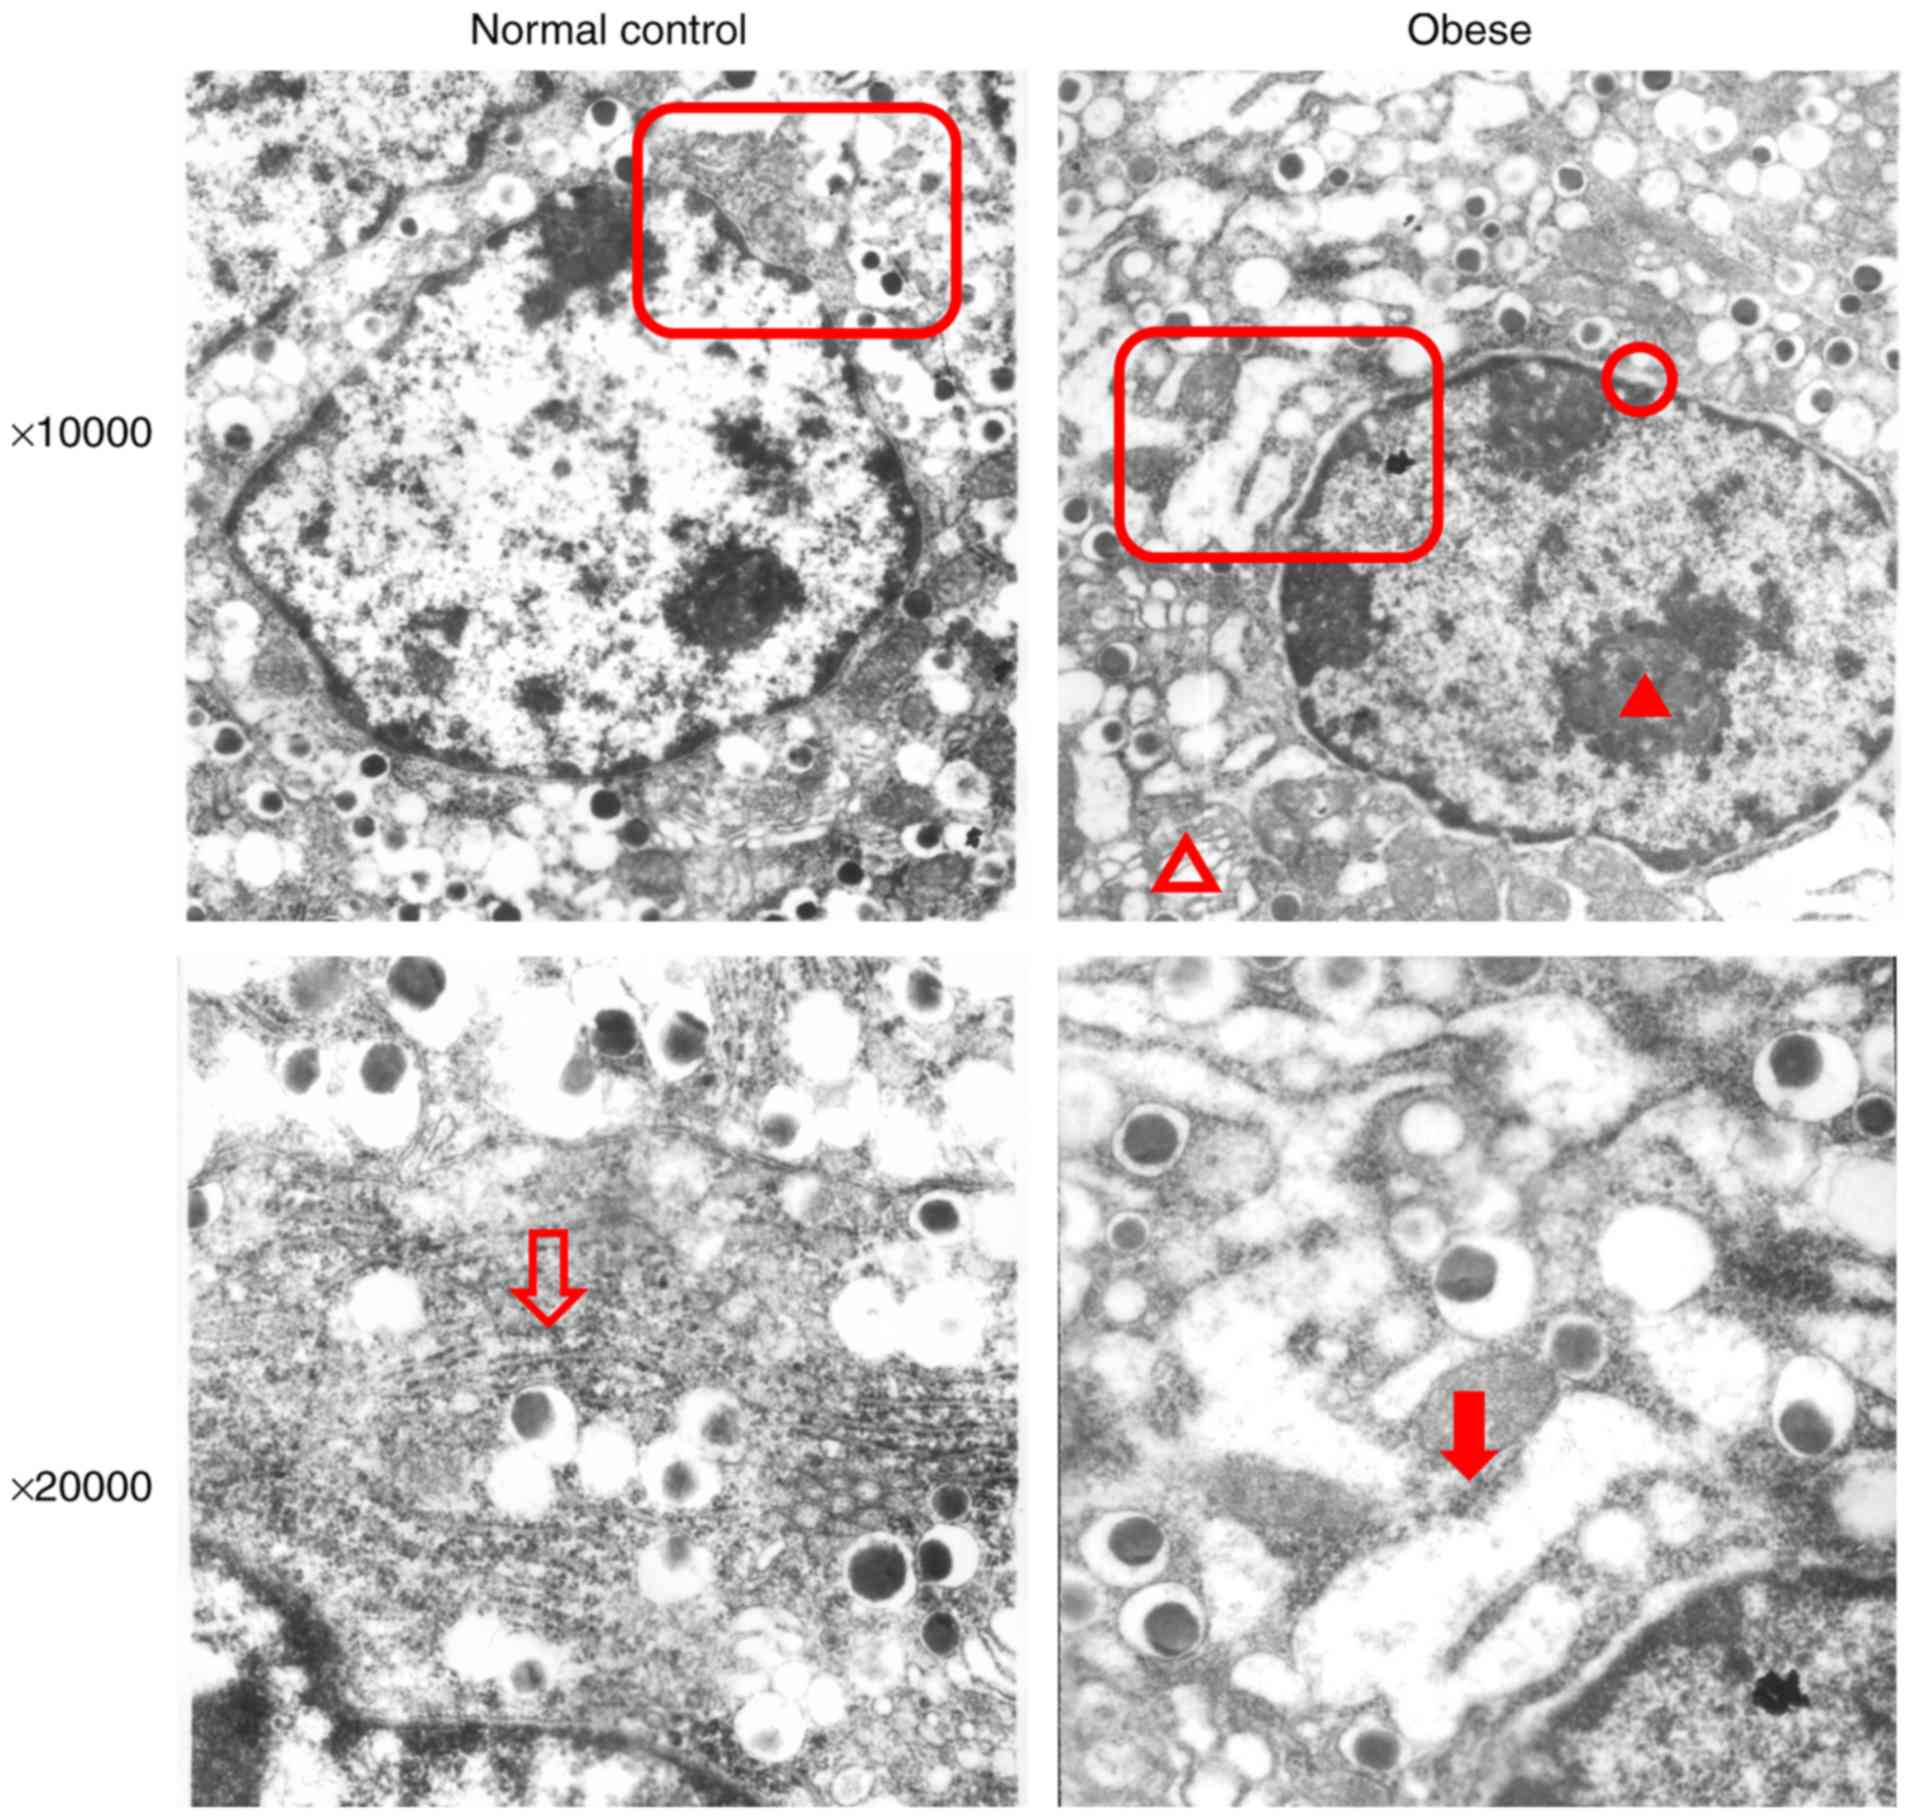
pathway was activated. Electron microscopy revealed the following
results in pancreatic β-cells from obese mice (Fig. 3): Chromatin was slightly condensed
in the nucleus; perinuclear spaces were widened; Golgi complex
cisternae were dilated; the rough ER was dilated and degranulated;
dilated cisternae contained low-electron density substances;
mitochondria were swollen; mitochondria volume was increased;
endocrine particles in the cytoplasm decreased; and endocrine
particle volume increased. These results revealed that the
pancreatic islet β-cells of obese mice exhibted changes in ER
microstructures. In addition, the reduction of insulin secretory
granules also suggested that the secretory function of β-cells was
impaired.
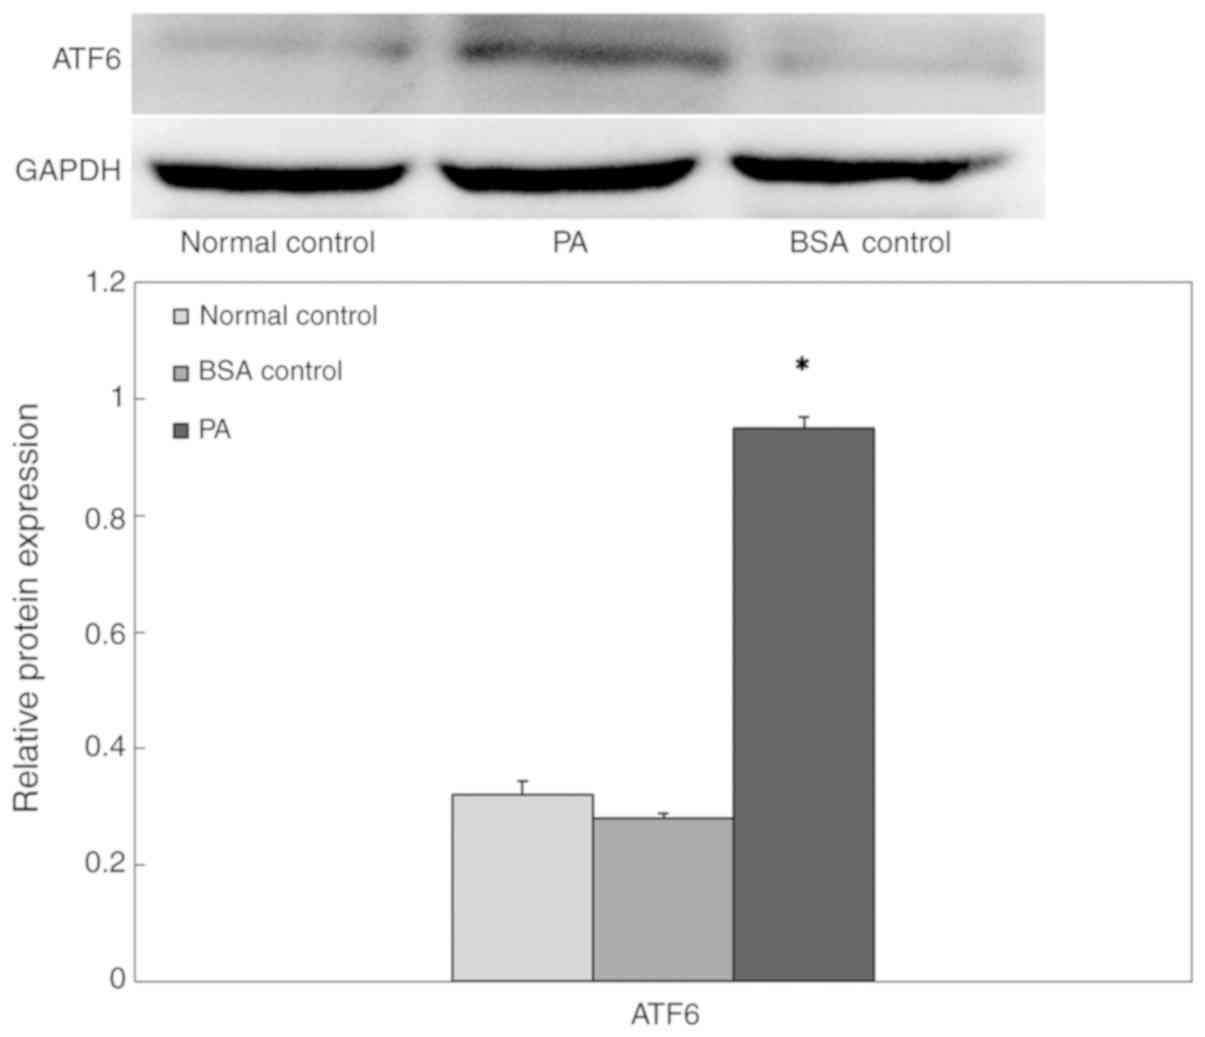
PA-induced ERs in INS-1 cells
To confirm whether the high-lipid environment
induced β-cell ERs, INS-1 cells were cultured in a high-lipid
environment, and the expression of ATF6 protein in cells was
measured via western blot analysis (Fig. 4). The expression level of ATF6
protein in the BSA control group was not significantly different
compared with that of the normal control group. However, in the
presence of 0.5 mM PA, ATF6 expression increased significantly
following 24 h exposure, which suggested that prolonged exposure to
PA may induce ERs.
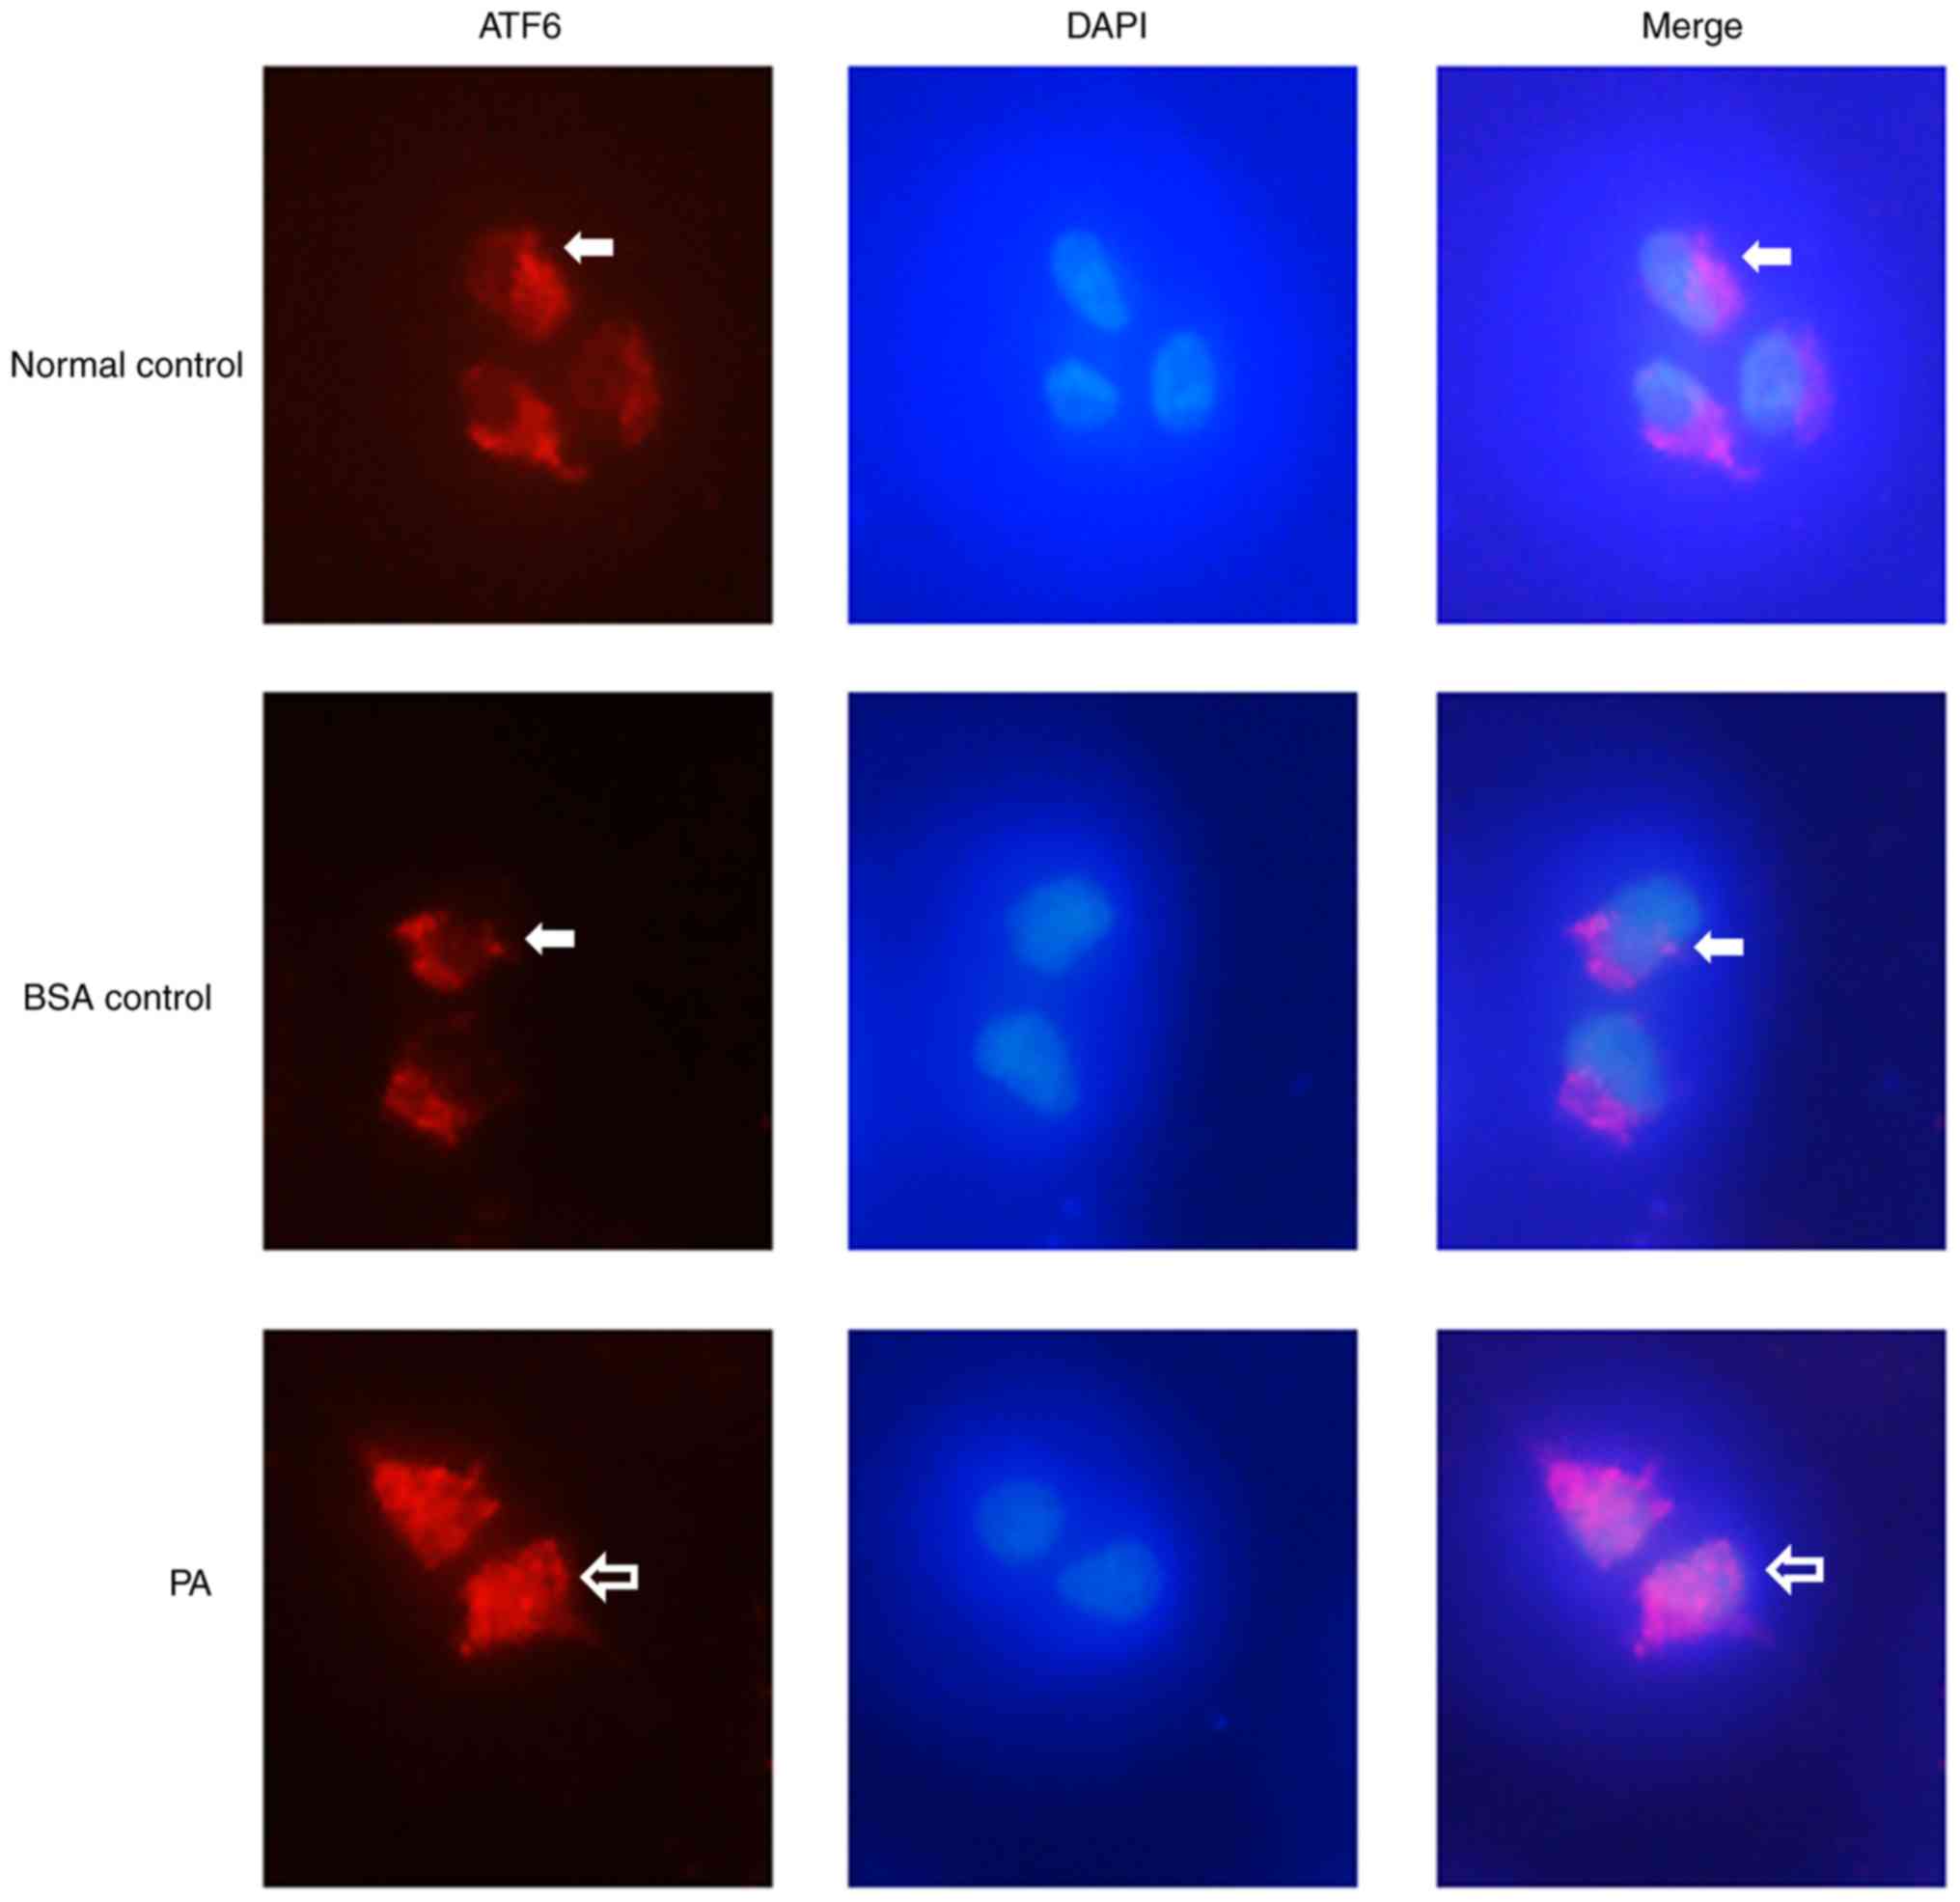
PA treatment induces nuclear
localization of ATF6
Immunofluorescence staining showed that ATF6
(Fig. 5; red) was expressed at low
levels in the cytoplasm of INS-1 cells in the BSA control group,
and that there was no ATF6 expression in the nucleus (Fig. 5). After the cells were treated with
0.5 mM PA, ATF6 was expressed in both the cytoplasm and the
nucleus, and the expression levels were markedly higher compared
with those in the BSA control group. These results suggested that
PA treatment induced nuclear localization of ATF6 in INS-1
cells.
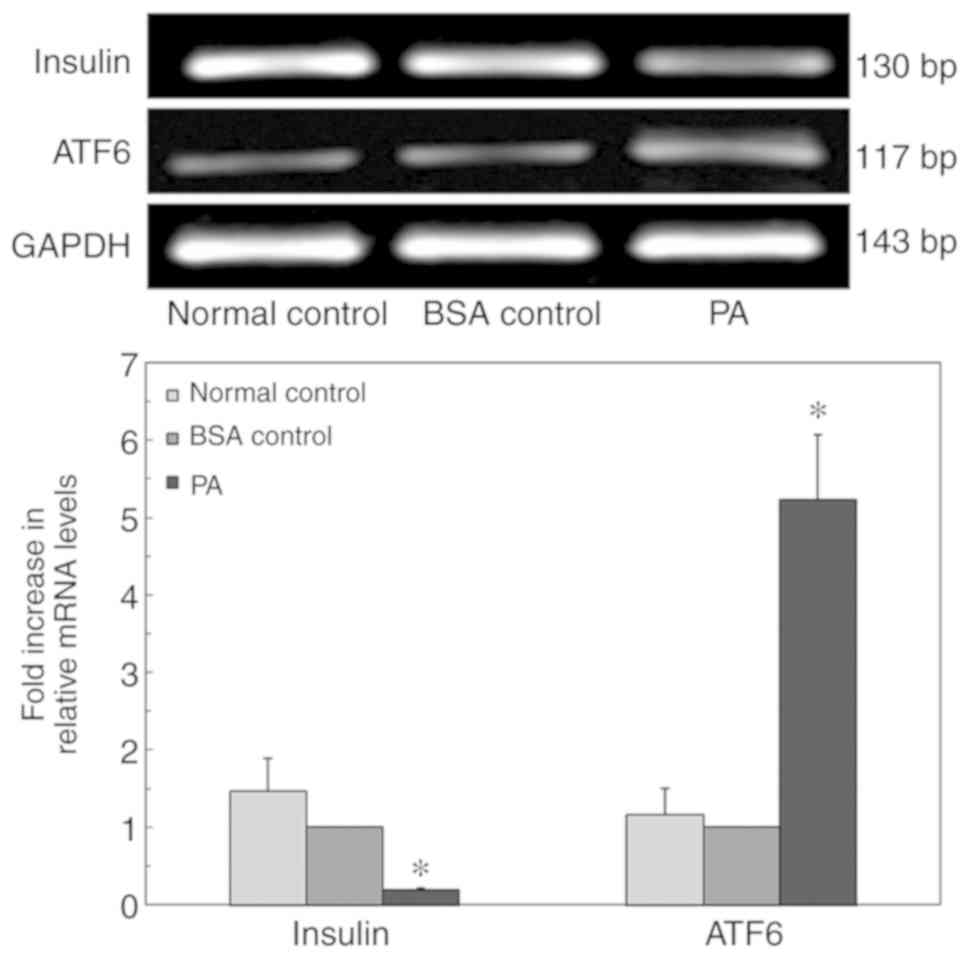
ERs in INS-1 cells impairs insulin
gene expression
To confirm whether ERs influenced insulin gene
expression, INS-1 cells were cultured in a high-lipid environment,
and insulin mRNA expression levels were detected via RT-qPCR
(Fig. 6). After 24 h of
incubation, the expression level of ATF6 in the PA group was
significantly higher compared with that in the BSA control group.
In addition, the mRNA expression level of insulin in the normal
control group was not significantly different compared with that in
the BSA control group. The insulin mRNA expression level in the PA
group was significantly decreased. These results suggested that PA
inhibited insulin mRNA expression in INS-1 cells.
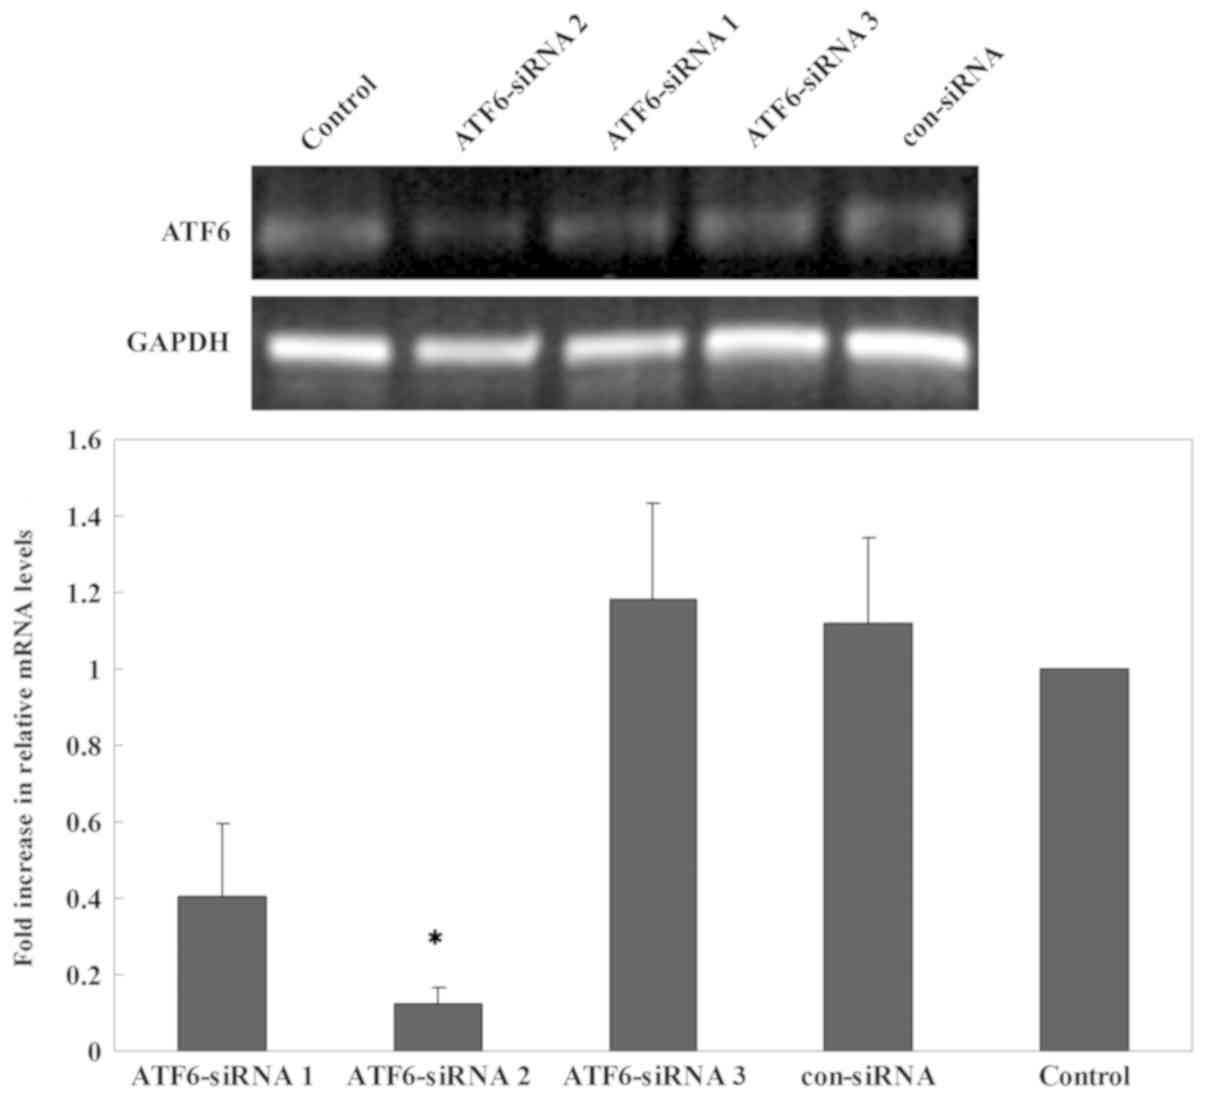
ERs-induced impairment of insulin gene
transcription is mediated by ATF6
The inhibitory effects of three candidate siRNAs
were evaluated. The results showed that ATF6-siRNA2 had the best
inhibitory effect compared with other candidate siRNAs (Fig. 7). Therefore, subsequent experiments
were performed using ATF6-siRNA2 to ensure that ATF6 was inhibited.
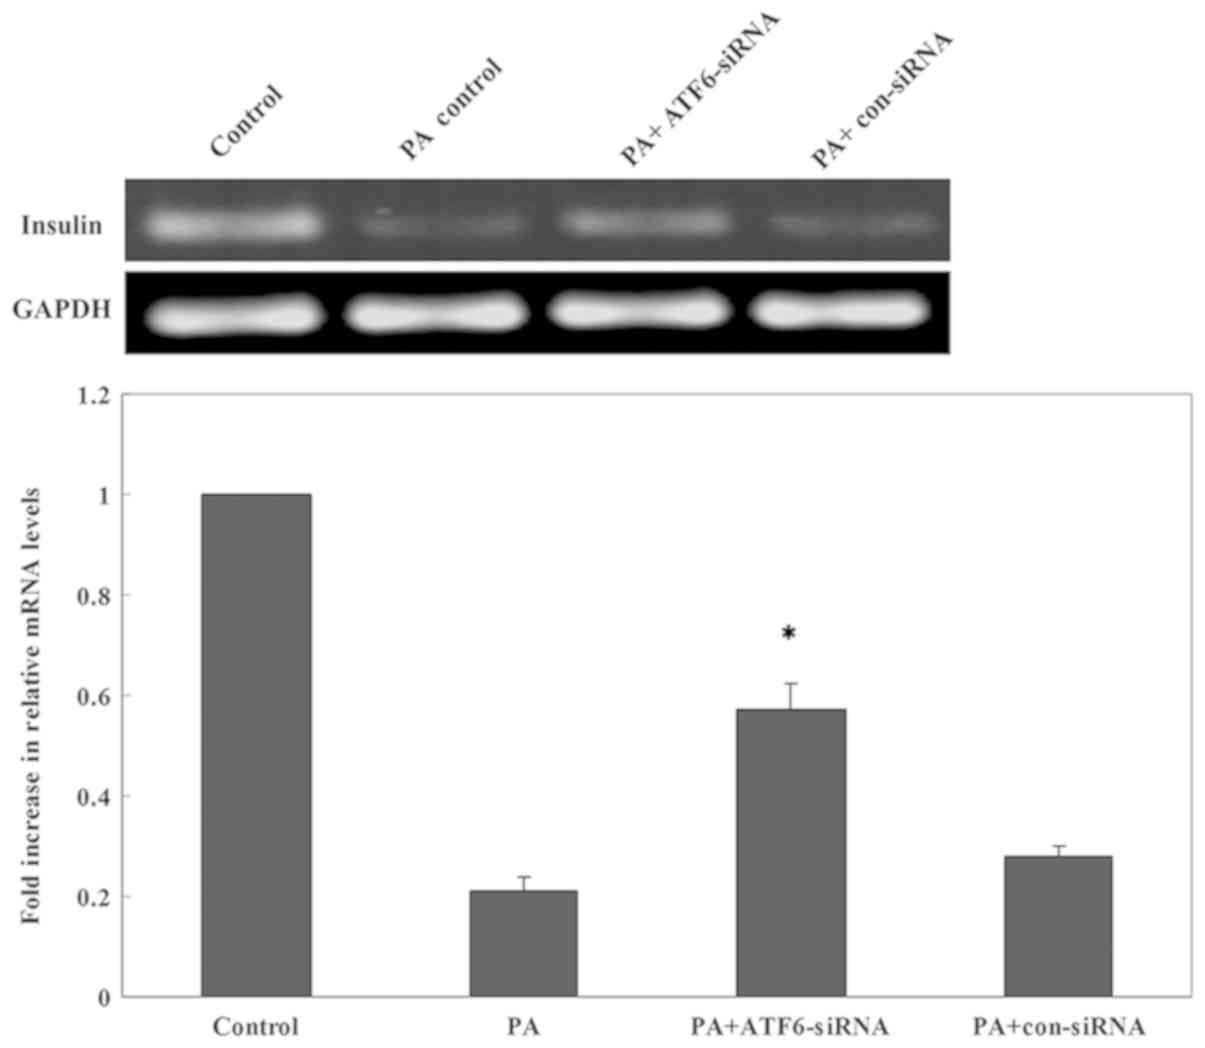
To test whether ATF6 mediated the ERs-induced insulin gene
transcription impairment, ATF6-siRNA2 was transfected into INS-1
cells which were subsequently cultured in a high-lipid environment
for 24 h. RT-qPCR showed that the mRNA expression of insulin was
significantly increased following a 24 h PA treatment in cells
transfected with ATF6-siRNA2 compared with untransfected cells and
cells transfected with con-siRNA (Fig.
8). Thus, ATF6 knockdown attenuated the inhibitory effect of PA
on insulin mRNA expression.
Discussion
Obesity is associated with the activation of
cellular stress signals (9);
however, the origin of this stress is still not clear. One key
component of cellular stress responses is the ER (16). Multiple pathological and
physiological factors can disrupt ER homeostasis to cause ERs,
including aging, viral infection, environmental toxins,
inflammatory cytokines, glucose or nutritional deficiency,
increased lipid and secretory protein synthesis, mutations and
misfolded protein expression (17). A number of these factors are
present in obesity. Ozcan et al (18) detected the expression levels of
ERs-related indicators (p-PERK, p-eIF2α and glucose-regulated
protein 78 kDa) in the peripheral tissues (liver, adipose tissue
and muscle) of HFD-induced and genetic (ob/ob) models of
obese mice. These results revealed increased expression levels of
ERs-related indicators in liver and adipose tissues, suggesting
that obesity may induce excessive ERs. However, it remains unclear
whether excessive ERs also exists in the pancreatic tissues of
obese individuals and further compromises islet β-cell functions.
In the present study, male C57BL/6J mice were used as the
experimental subjects. After a 16 week induction, mice fed a HFD
exhibited higher body weights compared with the normal diet group,
and developed adiposity with excessive adipose tissue pad mass. The
obese mice showed impaired glucose tolerance, insulin resistance
and decreased ability of compensatory secretion of insulin.
Furthermore, the microstructures of islet β-cells of obese mice
were observed via transmission electron microscopy. Rough ER
expansion and degranulation were observed, with low-electron
density materials in the expanded lumen, suggesting the presence of
excessive ERs. In addition, structural changes in other organelles
in the nuclei and cytoplasm, such as the Golgi apparatus and
mitochondria, were also observed, with reduced numbers of insulin
secretory granules, suggesting a degree of impairment in the
secretory functions of β-cells.
After ERs development, the accumulation of a large
amount of proteins in the ER lumen induces the downstream UPR
signaling pathway (19). UPR
signaling is mediated by ERs signal transduction molecules,
including PERK, IRE1α and ATF6, which are important transmembrane
proteins in the ER (20). eIF2α is
a key molecule in the PERK-mediated signaling pathway. The
phosphorylation status of eIF2α is an important evaluation
indicator of ERs (4). Gregor et
al (21) detected changes in
eIF2α expression in the livers of obese patients using
immunofluorescence staining when evaluating changes in the ERs
status of patients before and after weight loss. The
immunofluorescence staining results in the present study showed
that p-eIF2α expression in the pancreatic islets of obese mice was
significantly higher compared with in normal mice, suggesting that
the pancreatic islets of obese mice had excessive ERs. ATF6 is an
ER membrane-bound transcription factor; it is a member of the
ATF/cAMP response element-binding protein basic-leucine zipper
family of DNA-binding proteins (22). The present study detected the α
subtype of ATF6, and the results showed that it was expressed in
the pancreatic islets of both normal mice and obese mice, but at
higher levels in the latter. These results further suggested that
the pancreatic islets of HFD obese mice had ERs, and that the
ATF6-mediated signal transduction pathway was activated.
Dyslipidemia is the most typical pathophysiological
change in patients with obesity, of which hypertriglyceridemia is
the major form (23).
Triglycerides are hydrolyzed into free fatty acids (FFAs) by
lipoprotein lipases; when the increase in FFAs in blood exceeds the
storage capacity of adipose tissues and the oxidation ability of
all tissues, excess FFAs are deposited in non-adipose tissues
(24). Cell injury caused by an
overly high FFA level combined with triglyceride accumulation is
termed β-cell lipotoxicity, which is a potential factor causing
cell dysfunction (25,26). However, the molecular mechanisms
underlying FFA-mediated β-cell lipotoxicity are still not
completely understood. Karaskov et al (27) treated β-cells with PA, a saturated
fatty acid containing 16 carbon atoms that is an important
component of vegetable and animal oils, for 16–24 h. Their results
demonstrated that the levels of p-eIF2α, ATF4 and X-box binding
protein 1 were significantly increased, and that ER morphology and
molecular chaperone distribution were significantly changed,
indicating that PA induced ERs in β-cells, and activated the PERK
and IRE1α signaling pathways. By contrast, treatment with oleate,
which is an unsaturated fatty acid containing 18 carbon atoms and
one double bond, did not induce ERs responses. However, whether PA
can activate the ATF6 signaling pathway remains to be determined
(28,29). In the present study, INS-1 cells
were cultured in the presence of 0.5 mM PA, and the expression
levels of ATF6 were analyzed via western blotting. To avoid the use
of over-passaged cells to ensure reliable and reproducible results,
INS-1 cells between their 20th and 30th passages were used. INS-1,
a rat insulinoma cell line, was considered the most reliable
insulin-secreting β-cell line that is stable in morphology,
responses to stimuli, growth rates, protein expression and
transfection efficiency within 30 consecutive passages (30). Various studies involving the use of
the INS-1 cell line for investigating stimulated insulin release
have used cells between passages 20 and 30 (31–34).
In addition, the capacity for insulin secretion of INS-1 cells
between their 20 and 30th passages was confirmed by preliminary
experiments prior to the reported experiments (data not shown). The
present study demonstrated that in the presence of PA, ATF6
expression increased significantly in INS-1 cells. qPCR analysis
also revealed that ATF6 expression increased under PA conditions.
These results suggested that prolonged exposure to PA may induce
ERs and activate the ATF6 pathway.
Under normal conditions, ATF6 interacts with the ER
protein chaperone binding immunoglobulin protein/GRP78 and is
retained in the ER membrane (35).
During ERs, unfolded protein accumulation induces the transfer of
ATF6 to the Golgi apparatus to be hydrolyzed into active fragments
(22). Activated ATF6 enters the
nucleus to activate the ERs response element on the promoter
regions of several genes in order to promote the correct folding of
proteins in the ER lumen (36). In
the present study, immunofluorescence staining showed that in
normal INS-1 cells, ATF6 was mainly expressed at a low level in the
cytoplasm, with nearly no expression in the nucleus. However, in
cells treated with PA, both cytoplasmic and nuclear ATF6 expression
were observed, with higher expression levels than those observed in
normal cells. These findings suggested that in INS-1 cells treated
with PA, ATF6 protein was activated and translocated from the
cytoplasm into the nuclei.
The most important function of β-cells is to
synthesize and secrete insulin, which is generated via expression
of the insulin gene. To determine whether signaling induced by
long-term excessive ERs may affect insulin mRNA expression, the
expression of insulin mRNA was examined via RT-qPCR in the present
study. The results indicated that following the treatment of INS-1
cells with PA, insulin mRNA expression was significantly decreased
compared with in uninduced cells, and the ATF6 signaling pathway
was activated. These results suggested that ATF6 may serve an
important role in ERs-induced cell dysfunction. Therefore, to
further verify whether ATF6 mediated the ERs-induced impairment of
insulin gene transcription, siRNA was used to knock down ATF6
expression in INS-1 cells in subsequent experiments; the results
demonstrated that compared with untransfected cells, transfected
cells cultured for 24 h with PA exhibited increased insulin mRNA
expression. This result suggested that PA may inhibit insulin mRNA
expression in β-cells by activating the ATF6 signaling pathway;
downregulation of ATF6 may ameliorate the inhibitory effect of PA
on insulin mRNA expression. Seo et al (34) obtained similar findings by
transfecting ATF6-siRNA into INS-1 cells and culturing the cells in
a high-glucose environment (30 mM glucose) for 48 h. It was also
reported that northern blot analysis indicated significantly higher
insulin mRNA expression levels in cells transfected with ATF6-siRNA
compared with the untransfected group, and it was revealed that
ATF6-siRNA significantly reversed the inhibition of insulin mRNA
expression by high glucose. In addition, the results of the present
study were also consistent with the findings of Hong et al
(37). Given these findings, ATF6
may play an important role in the impairment of β-cells under
high-glucose and high-fat conditions. This conclusion also reflects
the intrinsic links between obesity and T2DM.
The present study used HFD-induced obese mice to
evaluate the ERs status in the pancreas of obese mice, and to
evaluate the influence of obesity on glucose metabolism and
pancreatic islet β-cell function in the body. Changes in ATF6, an
important signaling molecule in the process of ERs in β-cells, at
the protein and mRNA levels, and its influence on insulin mRNA
expression in β-cells were investigated using in vitro
experiments. The results confirmed that activation of the ATF6
signaling pathway induced by excessive ERs was one of the potential
mechanisms underlying β-cell dysfunction in obesity. The present
study theoretically elucidated potential mechanisms underlying the
high prevalence of T2DM among obese patients, indicating novel
strategies for effective prevention and control of the development
of obesity-related T2DM in clinical practice.
Acknowledgements
Not applicable.
Funding
The present study was supported by The National
Natural Science Foundation of China (grant no. 81673187).
Availability of data and materials
The data set used and/or analyzed during the present
study are available from the corresponding author on reasonable
request.
Authors' contributions
XY conceived and coordinated the study, designed and
performed the experiments, analyzed the data and drafted the
manuscript. XC, SW and YX performed the data collection, analyzed
the data and revised the manuscript. All authors reviewed the
results and approved the final version of the manuscript.
Ethics approval and consent to
participate
The study was approved by the Animal Ethics
Committee at Xi'an Jiaotong University (permit no. 2017-30). The
study was conducted in strict accordance with the recommendations
of the Guide for the Care and Use of Laboratory Animals of the
National Institutes of Health and the AVMA Guidelines for the
Euthanasia of Animals 2013 Edition.
Patient consent for publication
Not applicable.
Competing interests
The authors declare that they have no competing
interests.
Glossary
Abbreviations
Abbreviations:
|
T2DM
|
type 2 diabetes mellitus
|
|
ER
|
endoplasmic reticulum
|
|
ERs
|
ER stress
|
|
UPR
|
unfolded protein response
|
|
PA
|
palmitate
|
|
HFD
|
high-fat diet
|
|
PERK
|
protein kinase RNA-like endoplasmic
reticulum kinase
|
|
IRE1α
|
inositol-requiring enzyme 1α
|
|
ATF6
|
activating transcription factor 6
|
|
FFAs
|
free fatty acids
|
References
|
1
|
Leitner DR, Frühbeck G, Yumuk V, Schindler
K, Micic D, Woodward E and Toplak H: Obesity and type 2 diabetes:
Two diseases with a need for combined treatment strategies - EASO
can lead the way. Obes Facts. 10:483–492. 2017. View Article : Google Scholar : PubMed/NCBI
|
|
2
|
Kahn SE, Cooper ME and Del Prato S:
Pathophysiology and treatment of type 2 diabetes: Perspectives on
the past, present, and future. Lancet. 383:1068–1083. 2014.
View Article : Google Scholar : PubMed/NCBI
|
|
3
|
Prieto D, Contreras C and Sanchez A:
Endothelial dysfunction, obesity and insulin resistance. Curr Vas
Pharmacol. 12:412–426. 2014. View Article : Google Scholar
|
|
4
|
Cnop M, Toivonen S, Igoillo-Esteve M and
Salpea P: Endoplasmic reticulum stress and eIF2α phosphorylation:
The achilles heel of pancreatic β cells. Mol Metab. 6:1024–1039.
2017. View Article : Google Scholar : PubMed/NCBI
|
|
5
|
Sun J, Cui J, He Q, Chen Z, Arvan P and
Liu M: Proinsulin misfolding and endoplasmic reticulum stress
during the development and progression of diabetes. Mol Aspects
Med. 42:105–118. 2015. View Article : Google Scholar : PubMed/NCBI
|
|
6
|
Rabhi N, Salas E, Froguel P and Annicotte
JS: Role of the unfolded protein response in β cell compensation
and failure during diabetes. J Diabetes Res. 2014:7951712014.
View Article : Google Scholar : PubMed/NCBI
|
|
7
|
Hu Y, Gao Y, Zhang M, Deng KY, Singh R,
Tian Q, Gong Y, Pan Z, Liu Q, Boisclair YR and Long Q: Endoplasmic
reticulum-associated degradation (ERAD) has a critical role in
supporting glucose-stimulated insulin secretion in pancreatic
β-cells. Diabetes. 68:733–746. 2019. View Article : Google Scholar : PubMed/NCBI
|
|
8
|
Sovolyova N, Healy S, Samali A and Logue
SE: Stressed to death-mechanisms of ER stress-induced cell death.
Biol Chem. 395:1–13. 2014. View Article : Google Scholar : PubMed/NCBI
|
|
9
|
Yilmaz E: Endoplasmic reticulum stress and
obesity. Adv Exp Med Biol. 960:261–276. 2017. View Article : Google Scholar : PubMed/NCBI
|
|
10
|
Lee J and Ozcan U: Unfolded protein
response signaling and metabolic diseases. J Biol Chem.
289:1203–1211. 2014. View Article : Google Scholar : PubMed/NCBI
|
|
11
|
Tsuchiya Y, Saito M and Kohno K:
Pathogenic mechanism of diabetes development due to dysfunction of
unfolded protein response. Yakugaku Zasshi. 136:817–825. 2016.(In
Japanese). View Article : Google Scholar : PubMed/NCBI
|
|
12
|
Namba T, Ishihara T, Tanaka K, Hoshino T
and Mizushima T: Transcriptional activation of ATF6 by endoplasmic
reticulum stressors. Biochem Biophys Res Commun. 355:543–548. 2007.
View Article : Google Scholar : PubMed/NCBI
|
|
13
|
National Research Council (US) Committee
for the Update of the Guide for the Care and Use of Laboratory
Animals. Guide for the Care and Use of Laboratory Animals.
2011.PubMed/NCBI
|
|
14
|
AVMA Guidelines for the Euthanasia of
Animals: 2013 Edition. https://www.avma.org/kb/policies/documents/euthanasia.pdf
|
|
15
|
Livak KJ and Schmittgen TD: Analysis of
relative gene expression data using real-time quantitative PCR and
the 2(-Delta Delta C(T)) method. Methods. 25:402–408. 2001.
View Article : Google Scholar : PubMed/NCBI
|
|
16
|
Esser N, Legrand-Poels S, Piette J, Scheen
AJ and Paquot N: Inflammation as a link between obesity, metabolic
syndrome and type 2 diabetes. Diab Res Clin Pract. 105:141–150.
2014. View Article : Google Scholar
|
|
17
|
Fonseca SG, Burcin M, Gromada J and Urano
F: Endoplasmic reticulum stress in beta-cells and development of
diabetes. Cur Opin Pharm. 9:763–770. 2009. View Article : Google Scholar
|
|
18
|
Ozcan U, Cao Q, Yilmaz E, Lee AH, Iwakoshi
NN, Ozdelen E, Tuncman G, Görgün C, Glimcher LH and Hotamisligil
GS: Endoplasmic reticulum stress links obesity, insulin action, and
type 2 diabetes. Science. 306:457–461. 2004. View Article : Google Scholar : PubMed/NCBI
|
|
19
|
Zhang K and Kaufman RJ: The unfolded
protein response: A stress signaling pathway critical for health
and disease. Neurology. 66 (2 Suppl 1):S102–S109. 2006. View Article : Google Scholar : PubMed/NCBI
|
|
20
|
Oakes SA and Papa FR: The role of
endoplasmic reticulum stress in human pathology. Annu Rev Pathol.
10:173–194. 2015. View Article : Google Scholar : PubMed/NCBI
|
|
21
|
Gregor MF, Yang L, Fabbrini E, Mohammed
BS, Eagon JC, Hotamisligil GS and Klein S: Endoplasmic reticulum
stress is reduced in tissues of obese subjects after weight loss.
Diabetes. 58:693–700. 2009. View Article : Google Scholar : PubMed/NCBI
|
|
22
|
Hillary RF and FitzGerald U: A lifetime of
stress: ATF6 in development and homeostasis. J Biomed Sci.
25:482018. View Article : Google Scholar : PubMed/NCBI
|
|
23
|
Klop B, Elte JW and Cabezas MC:
Dyslipidemia in obesity: Mechanisms and potential targets.
Nutrients. 5:1218–1240. 2013. View Article : Google Scholar : PubMed/NCBI
|
|
24
|
Engin A: Fat cell and fatty acid turnover
in obesity. Adv Exp Med Biol. 960:135–160. 2017. View Article : Google Scholar : PubMed/NCBI
|
|
25
|
Tinahones FJ, Pareja A, Soriguer FJ,
Gomez-Zumaquero JM, Cardona F and Rojo-Martinez G: Dietary fatty
acids modify insulin secretion of rat pancreatic islet cells in
vitro. J Endocrinol Invest. 25:436–441. 2002. View Article : Google Scholar : PubMed/NCBI
|
|
26
|
Sargsyan E, Artemenko K, Manukyan L,
Bergquist J and Bergsten P: Oleate protects beta-cells from the
toxic effect of palmitate by activating pro-survival pathways of
the ER stress response. Biochim Biophysica Acta. 1861:1151–1160.
2016. View Article : Google Scholar
|
|
27
|
Karaskov E, Scott C, Zhang L, Teodoro T,
Ravazzola M and Volchuk A: Chronic palmitate but not oleate
exposure induces endoplasmic reticulum stress, which may contribute
to INS-1 pancreatic beta-cell apoptosis. Endocrinology.
147:3398–3407. 2006. View Article : Google Scholar : PubMed/NCBI
|
|
28
|
Mayer CM and Belsham DD: Palmitate
attenuates insulin signaling and induces endoplasmic reticulum
stress and apoptosis in hypothalamic neurons: Rescue of resistance
and apoptosis through adenosine 5′ monophosphate-activated protein
kinase activation. Endocrinology. 151:576–585. 2010. View Article : Google Scholar : PubMed/NCBI
|
|
29
|
Hall E, Volkov P, Dayeh T, Bacos K, Rönn
T, Nitert MD and Ling C: Effects of palmitate on genome-wide mRNA
expression and DNA methylation patterns in human pancreatic islets.
BMC Med. 12:1032014. View Article : Google Scholar : PubMed/NCBI
|
|
30
|
Poitout V, Olson LK and Robertson RP:
Insulin-secreting cell lines: Classification, characteristics and
potential applications. Diabetes Metab. 22:7–14. 1996.PubMed/NCBI
|
|
31
|
Assimacopoulos-Jeannet F, Thumelin S,
Roche E, Esser V, McGarry JD and Prentki M: Fatty acids rapidly
induce the carnitine palmitoyltransferase I gene in the pancreatic
b-Cell line INS-1. J Biol Chem. 272:1659–1664. 1997. View Article : Google Scholar : PubMed/NCBI
|
|
32
|
Quinault A, Gausseres B, Bailbe D, Chebbah
N, Portha B, Movassat J and Tourrel-Cuzin C: Disrupted dynamics of
F-actin and insulin granule fusion in INS-1 832/13 beta-cells
exposed to glucotoxicity: Partial restoration by glucagon-like
peptide 1. Biochim Biophys Acta. 1862:1401–1411. 2016. View Article : Google Scholar : PubMed/NCBI
|
|
33
|
Kwon MJ, Chung HS, Yoon CS, Lee EJ, Kim
TK, Lee SH, Ko KS, Rhee BD, Kim MK and Park JH: Low glibenclamide
concentrations affect endoplasmic reticulum stress in INS-1 cells
under glucotoxic or glucolipotoxic conditions. Korean J Intern Med.
28:339–346. 2013. View Article : Google Scholar : PubMed/NCBI
|
|
34
|
Seo HY, Kim YD, Lee KM, Min AK, Kim MK,
Kim HS, Won KC, Park JY, Lee KU, Choi HS, et al: Endoplasmic
reticulum stress-induced activation of activating transcription
factor 6 decreases insulin gene expression via up-regulation of
orphan nuclear receptor small heterodimer partner. Endocrinology.
149:3832–2841. 2008. View Article : Google Scholar : PubMed/NCBI
|
|
35
|
Walter P and Ron D: The unfolded protein
response: From stress pathway to homeostatic regulation. Science.
334:1081–1086. 2011. View Article : Google Scholar : PubMed/NCBI
|
|
36
|
Sano R and Reed JC: ER stress-induced cell
death mechanisms. Biochim Biophys Acta. 1833:3460–3470. 2013.
View Article : Google Scholar : PubMed/NCBI
|
|
37
|
Hong SW, Lee J, Cho JH, Kwon H, Park SE,
Rhee EJ, Park CY, Oh KW, Park SW and Lee WY: Pioglitazone
attenuates palmitate-induced inflammation and endoplasmic reticulum
stress in pancreatic β-Cells. Endocrinol Metab (Seoul). 33:105–113.
2018. View Article : Google Scholar : PubMed/NCBI
|