Introduction
Systemic lupus erythematosus (SLE) is an autoimmune
disease with complex clinical manifestations, including nephritis,
central nervous system diseases and multi-system organ failure,
which can affect multiple organ systems and cause major episodes
(1). SLE demonstrates a cyclical
disease course, with aggravation and remission occurring
alternately (2). SLE is a female
sex-biased disease mainly affecting women of childbearing age and
with a male:female ratio of 1:9 (3). Although the precise pathogenesis of
SLE remains poorly understood, the etiology is considered to be due
to a combination of factors, including environmental, genetic,
hormonal and immunomodulatory factors (4). Without a clear understanding of the
causative agents, the current treatment relies on the alleviation
of symptoms with glucocorticoids and non-steroidal
anti-inflammatory drugs (5);
however, these drugs only help to control the disease progression
prophylactically and cannot allow a complete cure. Therefore, the
mortality rate of patients with SLE remains high.
One of the most important characteristics of SLE is
the hyperactivity of B cells, which produce various autoantibodies
(6). Consequently,
autoantibody/autoantigen immune complexes accumulate in various
organs and tissues, causing chronic inflammation and tissue damage
(7). Therapeutic strategies that
regulate B cells are therefore promising. However, the development
of effective therapeutic interventions has been hindered by the
lack of understanding of B cell activation underlying mechanisms.
Furthermore, the clinical diagnosis of SLE remains a challenge due
to the high heterogeneity of the disease (8). Current diagnostic indicators include
the SLE Disease Activity Index (SLEDAI) and dsDNA levels (9); however, there is still no
gold-standard diagnostic marker. Previous studies have focused on
the roles of epigenetic factors in the pathogenesis as potential
markers, such as microRNAs (miRNAs/miRs) and circular RNAs
(10,11).
miRNAs are a class of non-coding RNAs that regulate
gene expression post-transcriptionally (12,13).
Previous studies demonstrated that miRNAs serve an important role
in the immune system, and that they may potentially serve as
disease biomarkers and therapeutic targets (3,14).
Several miRNAs have also been proposed to regulate the pathogenesis
of autoimmune diseases, such as rheumatoid arthritis and SLE, by
affecting B cell function (15).
For example, Luo et al (7)
reported that decreased expression levels of miR-1246 can enhance
the expression levels of early B-cell factor 1 and promote the
further activation of B cells in lupus. In addition, miR-29c and
miR-29b were also discovered to be two important miRNAs associated
with SLE (16). However, to the
best of our knowledge, the expression patterns of miR-29a in the B
cells of patients with SLE remain unclear.
The miR-29 family includes miR-29a, miR-29b and
miR-29c (17) characterized by
similar seed sequences, which are expressed in both T and B cells
(18,19). miR-29b was discovered to induce DNA
demethylation and activate the AKT signaling pathway (20), in addition to serving a role in
Toll-like receptor inhibition (16). Furthermore, miR-29a was
demonstrated to downregulate the expression levels of the Nef
protein and interfere with human immunodeficiency virus-1
replication (21). In fact, the
deregulation of miRNA expression has been associated with several
types of disease and miRNAs have been revealed to function as tumor
suppressor genes or oncogenes, depending on their target mRNAs
(18). However, the target cells
for miR-29a in SLE remain unclear. The present study aimed
therefore to investigate the role of miR-29a in B cell
hyperactivity and to determine its contribution to the pathogenesis
of SLE. miR-29a may thus be considered as a potential diagnostic
marker or therapeutic target in SLE.
Materials and methods
Patient studies
The present study was approved by the Medical and
Ethical Committees of Wenzhou Medical University (Zhejiang, China)
and informed written consent was obtained from all participants.
The study included a total of 106 patients with SLE (15 males, 91
females, age range, 28–52 years; mean age, 39.75±10.00 years) who
were admitted to the Department of Rheumatology and Nephrology,
First Affiliated Hospital of Wenzhou Medical University between
February 2018 and October 2018. All patients with SLE fulfilled the
SLE Classification Criteria of the American College of Rheumatology
(22). The SLEDAI was evaluated
according to the systemic symptoms prior to blood collection
(23). A total of 3 patients with
SLE with an SLEDAI score >10 were selected for miRNA-Seq and 66
patients with SLE with an SLEDAI score >10 were selected for
miRNA hybridization chip analysis (Table SI). Another 37 patients with SLE
were randomly selected for validation. A total of 43 healthy
individuals (10 males, 33 females, age range, 26–50 years; mean
age, 38±12 years) were also admitted to the First Affiliated
Hospital of Wenzhou Medical University between February 2018 and
October 2018, who did not have arthralgia, heart or renal failure,
and had not been diagnosed with an autoimmune disease served as
healthy controls (HCs). Whole blood samples (5 ml) were collected
from all participants into EDTA-coated tubes after obtaining
informed written consent.
Peripheral blood mononuclear cell
(PBMC) isolation and RNA sequencing
PBMCs were isolated within 4 h of blood sample
collection using human peripheral blood lymphocyte separation
medium (3) (Tianjin HaoYang
Biological Manufacture Co., Ltd.). RNA extraction from PBMC and RNA
sequencing were performed as previously reported (3).
B cell isolation and miRNA
hybridization chip detection
B cells (1×10⁶) from PBMCs were labeled
with anti-human CD19 magnetic particles (cat. no. 130-050-301;
Miltenyi Biotec GmbH), according to the manufacturer protocol, and
obtained by passing the sample through a magnetic stand. The
positive fraction was further analyzed using flow cytometry.
Total RNA was extracted from the B cells (1–2 µg) as
previously described (3). The
NanoDrop ND-1000 instrument (Thermo Fisher Scientific, Inc.) was
used to measure total RNA concentration. The OD260/OD280 value was
used as an index of RNA purity. If the OD260/OD280 value range is
1.8–2.1, the RNA purity is acceptable. The 200 ng RNA samples were
then loaded onto an Affymetrix miRNA 2.0 array chip (Affymetrix;
Thermo Fisher Scientific, Inc.); the chip uses Sanger miRBase
version 15.0 (genewiz.com.cn/)sequences with a
probe length of 25 bases and a design covering 20,162 miRNAs.
Poly(A) polymerase was used to add poly(A) tails to the miRNA
samples and the miRNAs were fluorescently labeled and purified
using the FlashTag Biotin HSR Ligation Labelling kit (Applied
Biosystems; Thermo Fisher Scientific, Inc.) according to the
manufacturer's protocol. The hybridization solution was configured
according to the manufacturer's instructions (Applied Biosystems;
Thermo Fisher Scientific, Inc.), injected into the chip and the
sample port was sealed with a sticker. The chip was then placed in
a hybridization oven and hybridized at 60 × g for 16 h at 48°C. The
hybridization solution was subsequently aspirated with a pipette
tip and scanned after elution using an Affymetrix 7G/TG scanner
(Affymetrix; Thermo Fisher Scientific, Inc.). The image was
converted into a digital signal based on the fluorescence
intensity. Affymetrix miRNA QC Tool version 1.1.1.0 (Thermo Fisher
Scientific, Inc.) was used for data summarization and initial
quality control.
Reverse transcription-quantitative PCR
(RT-qPCR)
Total RNA was extracted from B cells as previously
described (3). A volume of 1 µg
RNA was reverse transcribed into cDNA according to the
manufacturer's protocol of ReverTra Ace® qPCR RT Master
mix (Toyobo Life Science). qPCR was performed using 1 µg cDNA as a
template and a QuantiNova SYBR Green PCR kit (Qiagen,GmbH) and
miR-29a/U6-specific stem-loop primers. The following primers were
used: miR-29a: Forward, 5′-GCGGGACTGATTTCTTTTGG-3′ and reverse,
5′-GTGCAGGGTCCGAGGTATTC-3′ and U6: Forward,
5′-GTGCTCGCTTCGGCAGCACAT-3′ and reverse,
5′-TACCTTGCGAAGTGCTTAAAC-3′. Samples were run in triplicate in
96-well plates using an Applied Biosystems 7900HT Real-Time PCR
thermocycler (Applied Biosystems; Thermo Fisher Scientific, Inc.).
Preamplification was performed at 95°C for 2 min, denaturation at
95°C for 15 sec, annealing and extension at 60°C for 1 min, 40
cycles. Expression levels were analyzed using the 2−ΔΔCt
method (24) and normalized to U6
as the reference gene.
Cell culture and transfection
Raji cells (Chinese Academy of Sciences Shanghai
Cell Bank) were cultured in RPMI-1640 medium (Gibco; Thermo Fisher
Scientific, Inc.), supplemented with 10% FBS (GE Healthcare
Bio-Sciences) in a 37°C incubator under a humidified atmosphere
containing 5% CO2. Raji cells were subsequently plated
into a 6-well cell culture plate at a density of 1×10⁶
cells/well and 300 µl electroporation solution (BTX, Genetronics,
Inc.) was added to each well. Subsequently, 60 nM of miR-29a-mimic
(5′-UAGCACCAUCUGAAAUCGGUUA-3′), mimic-NC
(5′-UUCUCCGAACGUGUCACGUTT-3′), miR-29a-inhibitor
(5′-UAACCGAUUUCAGAUGGUGCUA-3′) or inhibitor-NC
(5′-CAGUACUUUUGUGUAGUACAA-3′) (GenePharma, Shanghai, China) were
added to the solution, which were all FAM-conjugated. The control
group (electrotransfected without transfection components) and the
blank group (not electrotransfected) were also set up. The mixed
cell suspension was transferred to the electroporation cup and an
ECM 830 Square Wave electroporator (BTX, Genetronics, Inc.) was
used for the electroporation transfection (250 V; 10 ms) at 37°C
for 10 min. Following transfection, cells were cultured in
RPMI-1640 medium containing 10% FBS. The experiment was
subsequently divided into two groups as follows: The first group of
cells was used to evaluate the transfection efficiency and the
second group of cells was used for subsequent experiments. After 48
h of incubation, the first group of collected cells was used to
evaluate the transfection efficiency by flow cytometry and the
second group of cells and supernatant were collected and stored at
−20°C for further experimentation.
Flow cytometry
Following 48 h transfection, the cell suspension was
centrifuged for 5 min at 1,000 × g at 4°C; the supernatant was
discarded and the cell pellet was resuspended in PBS at a cell
density of 1×10⁶ cells/ml for analysis using a BD
Accuri™ C6 Flow Cytometer (BD Biosciences). The control group was
used as a negative control to set the gates for the flow cytometry.
The transfection efficiency of the miR-29a-mimic, mimic-NC,
miR-29a-inhibitor and inhibitor-NC was subsequently analyzed to
confirm that all transfections were effective. Data was analyzed
using BD_Accuri_C6 software 2.0 (BD Biosciences).
IgG ELISAs
At 48 h post-transfection, the cell suspension was
centrifuged for 10 min at 12,000 × g at 4°C. The IgG concentration
in the B cell culture supernatant was determined using a human IgG
ELISA kit (cat. no. ab100547; Abcam), according to the
manufacturer's protocol. All experiments were performed in
triplicate. The absorbance of the sample was read at 450 nm using a
fully automated ELISA processor (Roche Applied Science).
Target gene prediction and
bioinformatics analysis of miRNAs and mRNAs
A total of four online databases were used to
predict the target genes of miRNAs: miRanda (http://www.microrna.org/), PolymiRTS database
(http://compbio.uthsc.edu/miRSNP/home.php), TargetMiner
(https://www.isical.ac.in/~Bioinfo_miu/targetminer20.htm)
and CLIP-Seq (http://mirtarclip.mbc.nctu.edu.Tw/). Venny 2.1.0
software was used to draw the Venn diagrams to obtain the
intersection of the prediction results from the four databases. The
3′ untranslated region (UTR) sequence of the target gene was
obtained using TableBrowser (http://genome.ucsc.edu/cgi-bin/hgTables). The
secondary structure of the mRNA and miRNA interactions was
predicted using RNAhybrid (bibiserv.cebitec.uni-bielefeld.de/rnahybrid/)
(3). Target genes associated with
B cell function or IgG levels were identified using Chilibot
(chilibot.net).
Dual-luciferase reporter assay
The 3′ UTR of CRKL, which contains the predicted
target site for miR-29a, was cloned into the pmirGLO luciferase
reporter vector. 293T cells (1×10⁶)were co-transfected
(in 24-well plates with 1 µg firefly luciferase reporter vector
(pmirGLO-CRKL-3UTR) or control vector (pmirGLO-CRKL −3UTR-mut; cat.
no. E1910Promega Corporation) containing Renilla luciferase and 60
nM miR-29a-mimic or mimic-NC. Following incubation at 37°C for 48
h, the firefly and Renilla luciferase activities were detected
using a Dual-Luciferase Reporter assay system (Promega
Corporation), according to the manufacturer's protocol. Firefly
luciferase activity was normalized to Renilla luciferase
activity.
Western blotting
Total protein was extracted from Raji cells and
PBMCs using RIPA lysis buffer (Beijing Solarbio Science &
Technology Co.) supplemented with protease inhibitor cocktail
(Pierce; Thermo Fisher Scientific, Inc.). A BCA protein assay kit
(Thermo Fisher Scientific, Inc.) was used to determine the protein
concentration. A total of 15 µg protein was separated by 12%
SDS-PAGE. Proteins were subsequently transferred onto PVDF
membranes (EMD Millipore) and blocked in 5% skim milk at 37°C for
1.5 h. The membranes were incubated with a monoclonal rabbit
anti-CRKL (1:1,000; cat. no. ab32126; Abcam) and monoclonal mouse
anti-GAPDH primary antibody (1:1,000; cat. no. AB-M-M001; Xianzhi
Biotechnology Company) overnight at 4°C. Following the primary
antibody incubation, the membranes were washed five times for 5 min
each with TBST (0.05% Tween-20) buffer and then incubated with a
horseradish peroxidase (HRP)-conjugated goat anti-rabbit IgG
secondary antibody(1:5,000; Hangzhou Multi Sciences) and
HRP-conjugated goat anti-mouse IgG secondary antibody (1:5,000;
Hangzhou Multi Sciences) for 1.5 h at 37°C. Protein bands were
detected using a chemiluminescence solution (Bio-Rad Laboratories,
Inc.) and visualized using a Gel Doc 2000 ChemiDoc imaging system
(Bio-Rad Laboratories, Inc.). Relative expression level of CRKL was
normalized to endogenous control GAPDH using ImageJ software v1.8.0
(National Institutes of Health).
Statistical analysis
Statistical analysis was performed using SPSS 22.0
software (IBM Corp.); expression levels obtained following RT-qPCR
data were analyzed using GraphPad Prism software (version 5.0;
GraphPad Software, Inc.). The data were presented as the mean ±
standard deviation of three repeats. An independent Student's
t-test was used to determine the statistical differences between
two groups, and multigroup comparisons of the means were performed
via one-way ANOVA with post hoc Student-Newman-Keuls test.
Sensitivity and specificity values were determined using a
receiving operating characteristic (ROC) curve. P<0.05 was
considered to indicate a statistically significant difference.
Results
Expression profiles of B cell miRNAs
from patients with SLE and HCs
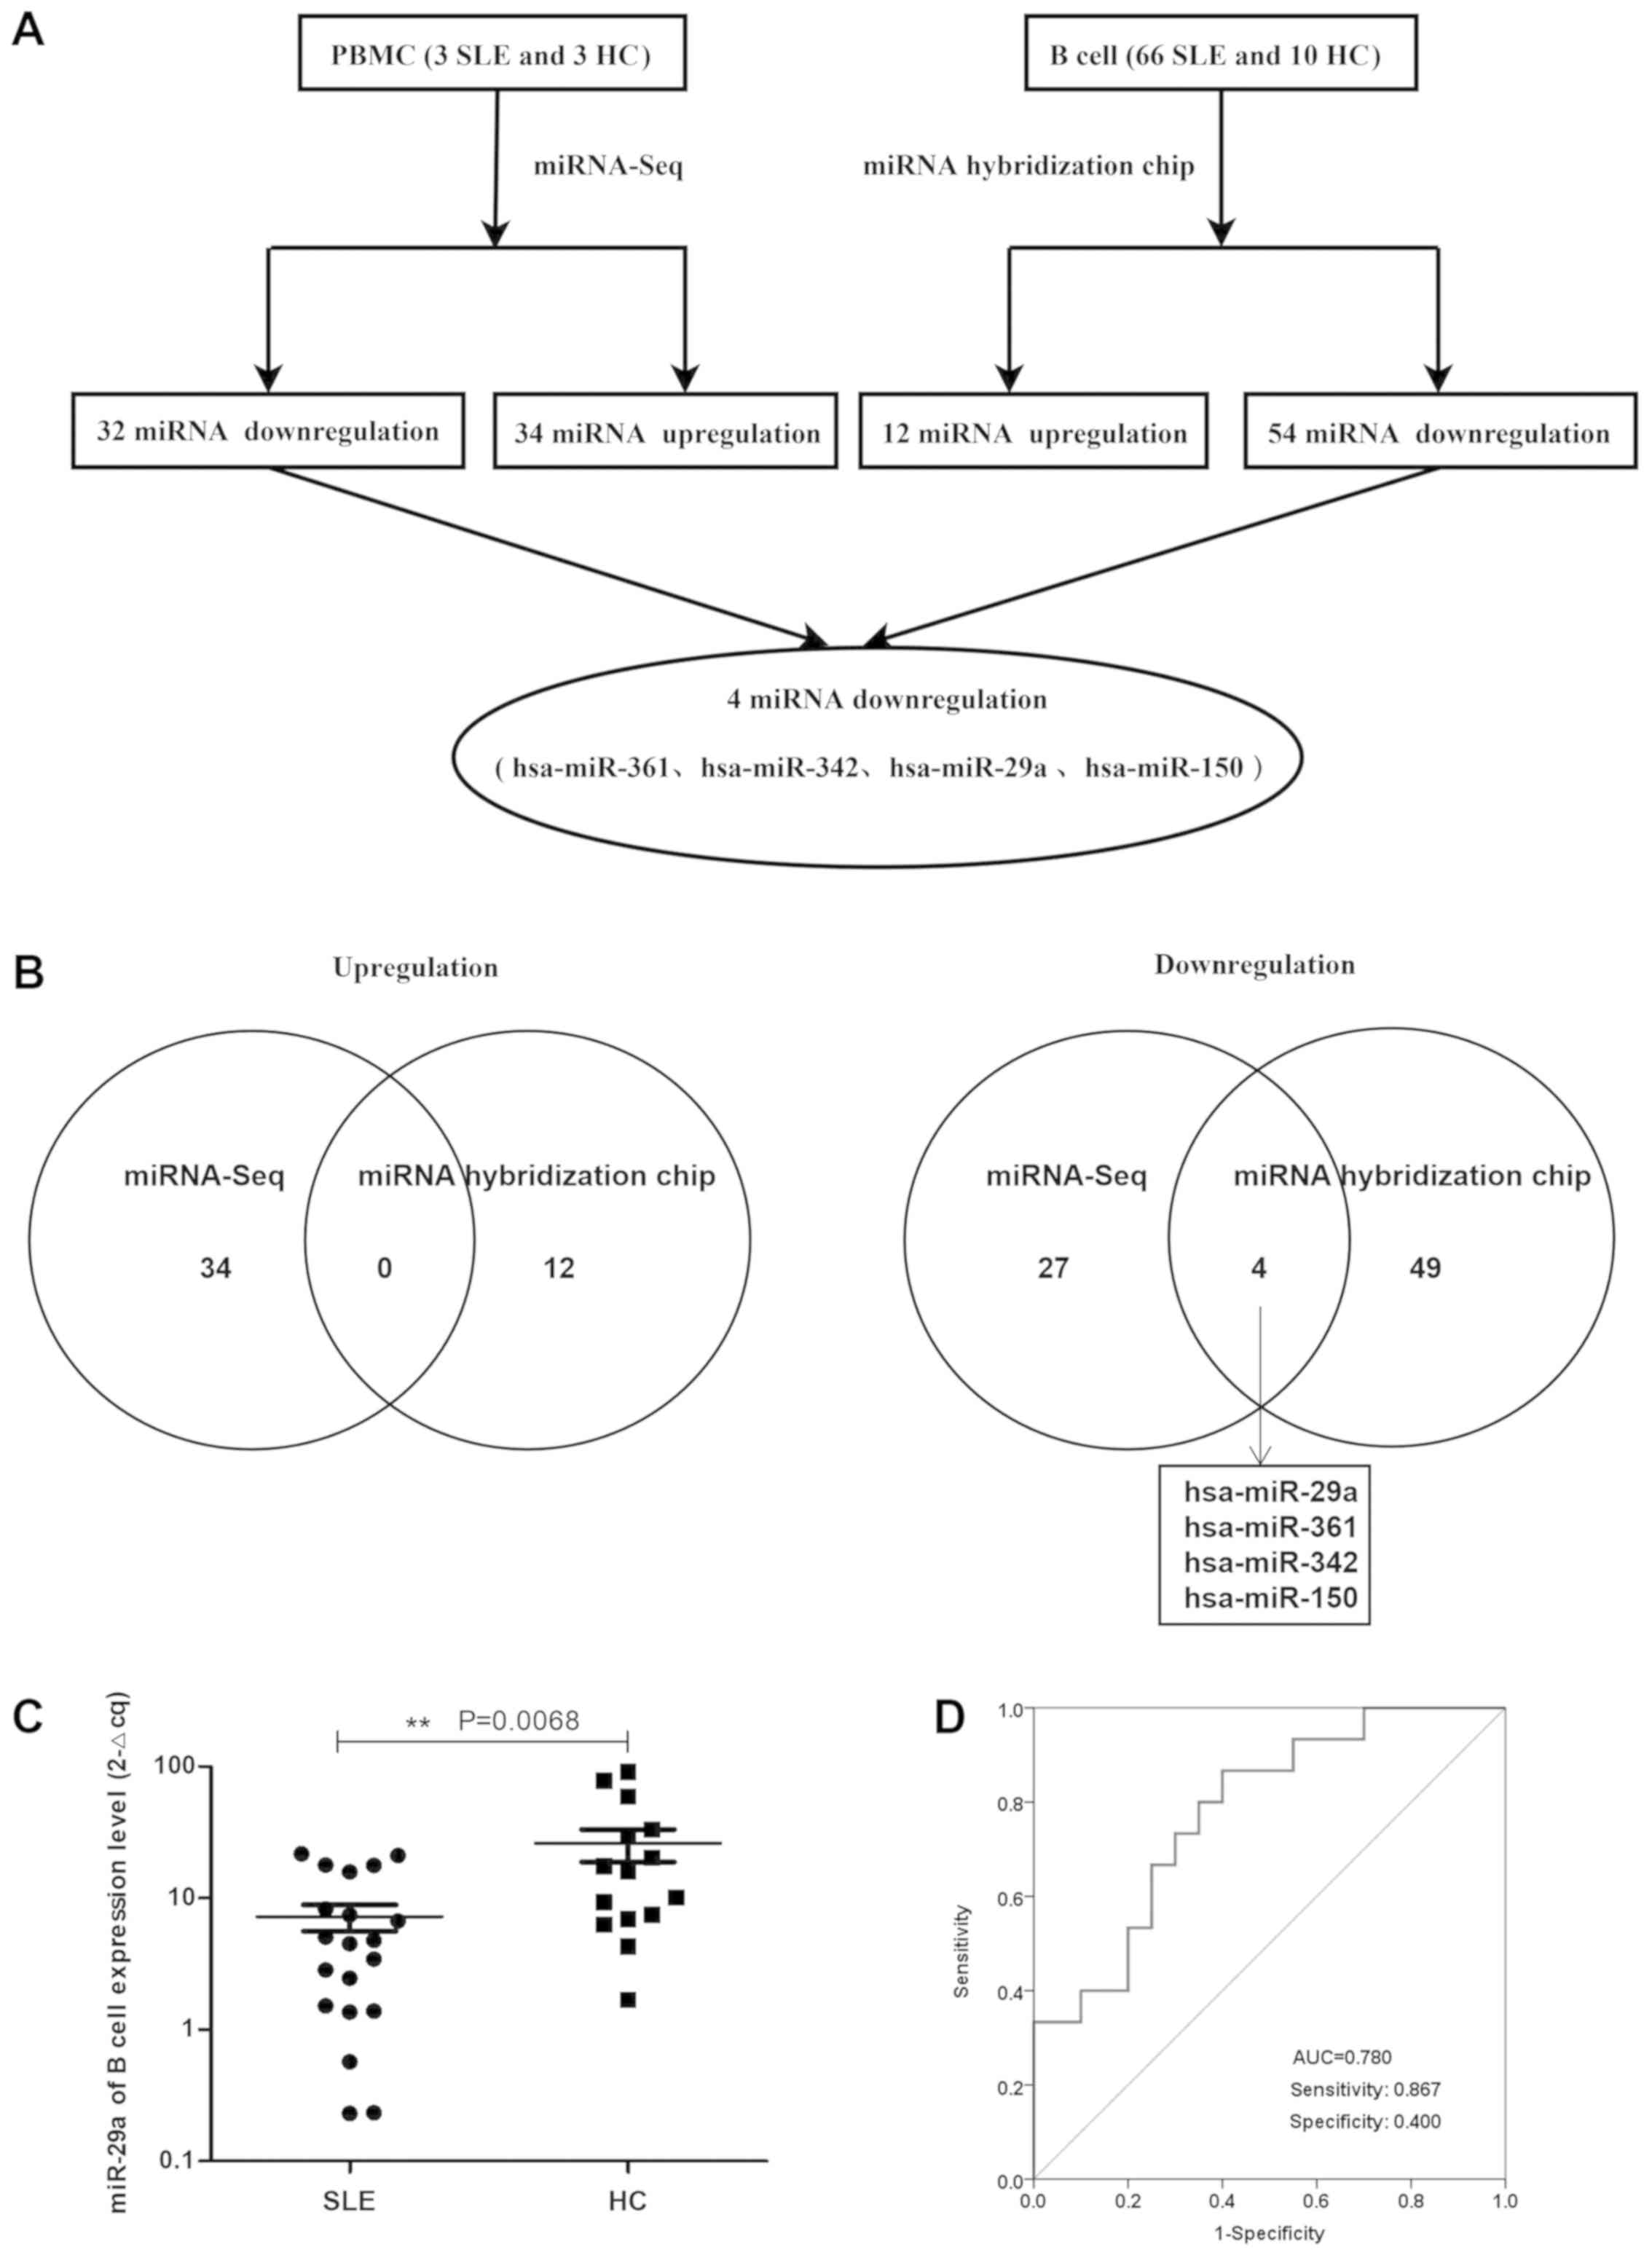
The miRNA array revealed that compared with HCs,
there were 66 miRNAs in patients with active SLE (SLEDAI ≥10),
including 54 miRNAs that were downregulated and 12 miRNAs that were
upregulated in patients with SLE (Tables I and II; Fig.
1A). In addition, the expression profiles of miRNAs in the
PBMCs from three patients with SLE and three HCs confirmed the
significant differential expression of these 66 miRNAs (P<0.05
and fold change >2), whereby 34 upregulated and 32 downregulated
miRNAs were discovered in the PBMCs of patients with SLE. The
differential expression of miRNAs in the PBMCs of patients with SLE
and HCs is presented as a heatmap and cluster diagram in Fig. S1A, whereas the combined analysis
of miRNA hybridization chips and miRNA-Seq data is presented as a
flow chart in Fig. 1A. In the
intersection data of these two analyses, miR-29a, miR-361, miR-342
and miR-150 were all found to be commonly downregulated in patients
with SLE (Fig. 1B). Therefore, the
present study focused on the role of miR-29a in the hyperactivity
of B cells in SLE.
 | Table I.Upregulated miRNA expression profiles
in B cells of patients with SLE and HCs determined using a miRNA
hybridization chip. |
Table I.
Upregulated miRNA expression profiles
in B cells of patients with SLE and HCs determined using a miRNA
hybridization chip.
| miRNA |
Fold-changea (SLE/HC) |
|---|
| hsa-miR-2054 | 18.29 |
|
hsa-miR-1224-3p | 7.44 |
| hsa-miR-1249 | 6.09 |
|
hsa-miR-2116-star | 4.30 |
| hsa-miR-4258 | 4.12 |
| hsa-miR-4313 | 3.07 |
| hsa-miR-1915 | 2.40 |
| hsa-miR-220b | 2.13 |
| hsa-miR-19b | 2.23 |
| hsa-miR-15b | 2.30 |
| hsa-miR-22 | 2.37 |
| hsa-miR-155 | 2.11 |
| Table II.miRNA expression level profiles in B
cells of patients with SLE and HCs determined using a miRNA
hybridization chip. |
Table II.
miRNA expression level profiles in B
cells of patients with SLE and HCs determined using a miRNA
hybridization chip.
| miRNA |
Fold-changea (SLE/HC) |
|---|
| hsa-miR-29a | 0.03 |
| hsa-miR-26a | 0.03 |
| hsa-miR-150 | 0.03 |
| hsa-miR-103 | 0.04 |
| hsa-let-7b | 0.04 |
| hsa-miR-342-3p | 0.04 |
| hsa-miR-16 | 0.05 |
| hsa-miR-1826 | 0.05 |
| hsa-miR-191 | 0.06 |
| hsa-miR-107 | 0.06 |
| hsa-miR-24 | 0.06 |
| hsa-miR-92a | 0.07 |
| hsa-let-7a | 0.08 |
| hsa-let-7d | 0.09 |
| hsa-miR-181a | 0.09 |
| hsa-miR-23a | 0.10 |
| hsa-miR-20a | 0.11 |
| hsa-miR-320a | 0.12 |
| hsa-miR-17 | 0.12 |
| hsa-let-7i | 0.12 |
| hsa-miR-140-3p | 0.13 |
| hsa-miR-222 | 0.13 |
| hsa-miR-106a | 0.15 |
| hsa-miR-221 | 0.15 |
| hsa-miR-320c | 0.15 |
| hsa-miR-320b | 0.15 |
| hsa-let-7c | 0.16 |
| hsa-miR-93 | 0.17 |
| hsa-miR-29 | 0.17 |
| hsa-miR-185 | 0.19 |
| hsa-let-7g | 0.23 |
| hsa-miR-106b | 0.25 |
| hsa-miR-146a | 0.25 |
| hsa-miR-425 | 0.28 |
| hsa-miR-23b | 0.29 |
| hsa-miR-27a | 0.30 |
| hsa-miR-361-5p | 0.30 |
| hsa-miR-151-5p | 0.30 |
| hsa-miR-126 | 0.47 |
| hsa-miR-320d | 0.29 |
| hsa-miR-1975 | 0.21 |
| hsa-let-7f | 0.37 |
| hsa-miR-652 | 0.37 |
| hsa-miR-4298 | 0.39 |
| hsa-miR-638 | 0.29 |
| hsa-miR-181b | 0.33 |
| hsa-miR-20b | 0.39 |
| hsa-miR-494 | 0.47 |
| hsa-miR-4270 | 0.32 |
| hsa-miR-223 | 0.48 |
|
hsa-miR-149-star | 0.32 |
| hsa-miR-762 | 0.28 |
| hsa-miR-25 | 0.38 |
| hsa-miR-378 | 0.34 |
miR-29a expression levels are
significantly downregulated in B cells from patients with SLE
Flow cytometry analysis demonstrated that the pure B
cells of patients with SLE (n=20) and HCs (n=10) accounted for
85.9% of the total number of cells according to the scatter signal
(Fig. S2A). Furthermore, the
RT-qPCR data revealed that miR-29a expression level was
significantly downregulated in B cells from patients with SLE
compared with HCs (Fig. 1C). The
area under the ROC curve value was 0.780, with a sensitivity of
0.867 and a specificity of 0.400 (Fig.
1D). These results suggested that miR-29a may be considered as
a novel diagnostic marker for SLE prognosis.
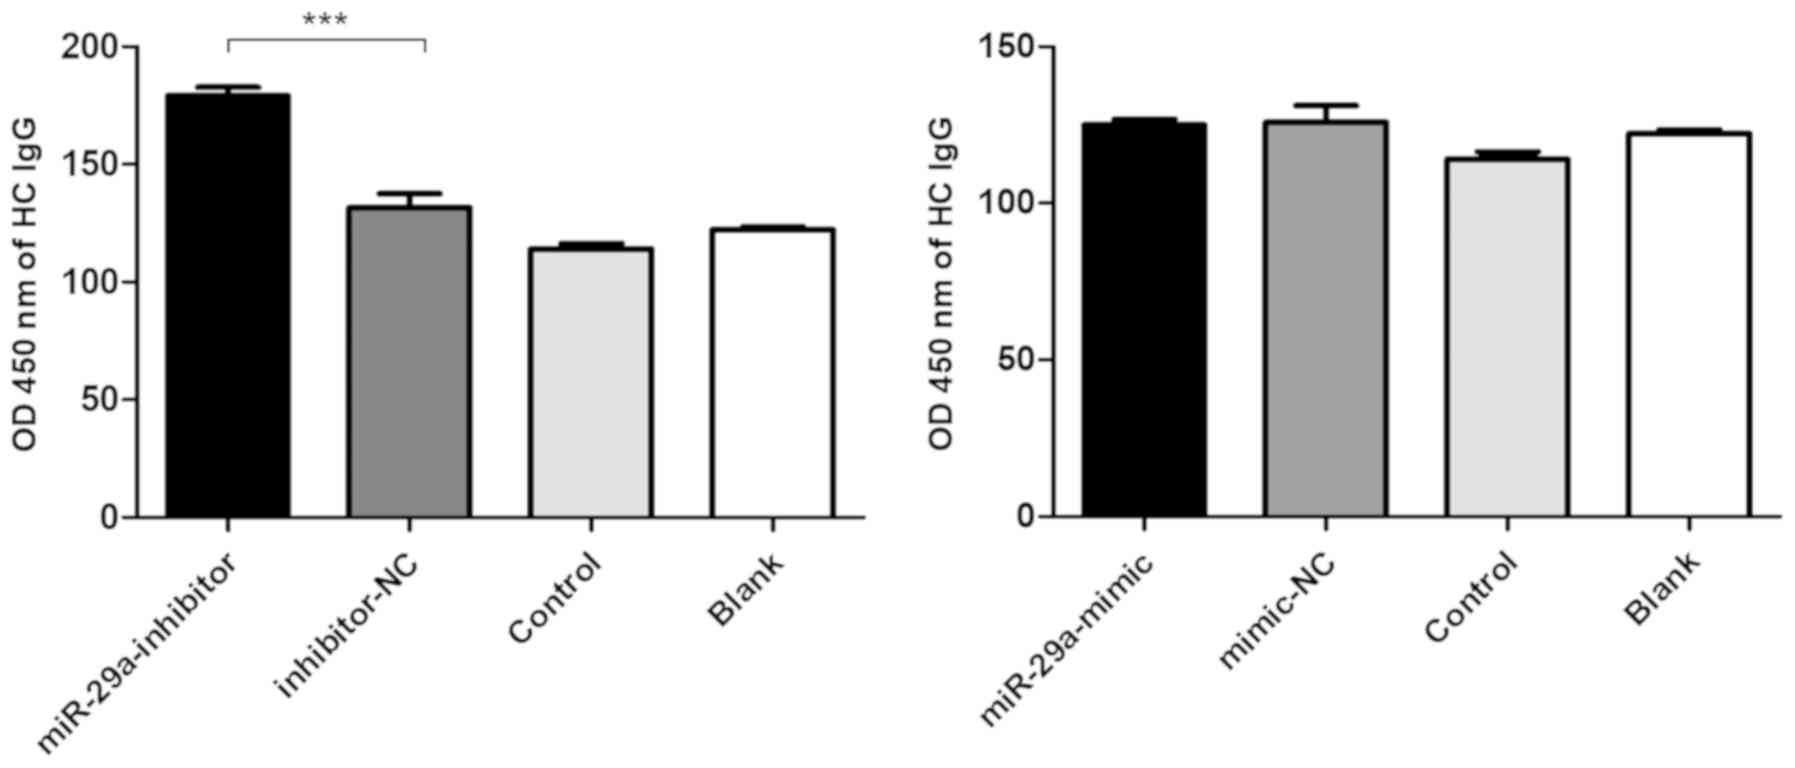
Low miR-29a expression levels promote
IgG production
Based on the fluorescence analysis of FAM
expression, the transfection efficiency of the miR-29a mimic,
mimic-NC, miR-29a inhibitor and inhibitor-NC in PBMCs was 41.2,
47.8, 59.8 and 65.4%, respectively (Fig. S2B). In addition, the levels of
total IgG in the supernatant were significantly increased following
the transfection of the miR-29a inhibitor into the PBMCs obtained
from HCs (Fig. 2).
miR-29a directly targets CRKL
The MiRanda, PolymiRTS Database, TargetMiner and
CLIP-Seq databases predicted 1,565, 32, 1,756 and 267 target genes
for miR-29a, respectively (Fig.
3A). After taking the intersection of these results, two
predicted target genes were obtained: CRKL and Rasrelated
GTP-binding protein C (RRAGC). The target position and
secondary structure of the mir-29a-3p interactions with CRKL
were subsequently predicted (Fig.
3B). These findings were further supported by the Chilibot
database analysis, which predicted CRKL to be associated
with both B cell function and IgG levels (21,22).
The results showed that there are currently 18 reports that CRKL is
associated with B cells, and four reports that CRKL is associated
with IgG production. (Fig.
3C).
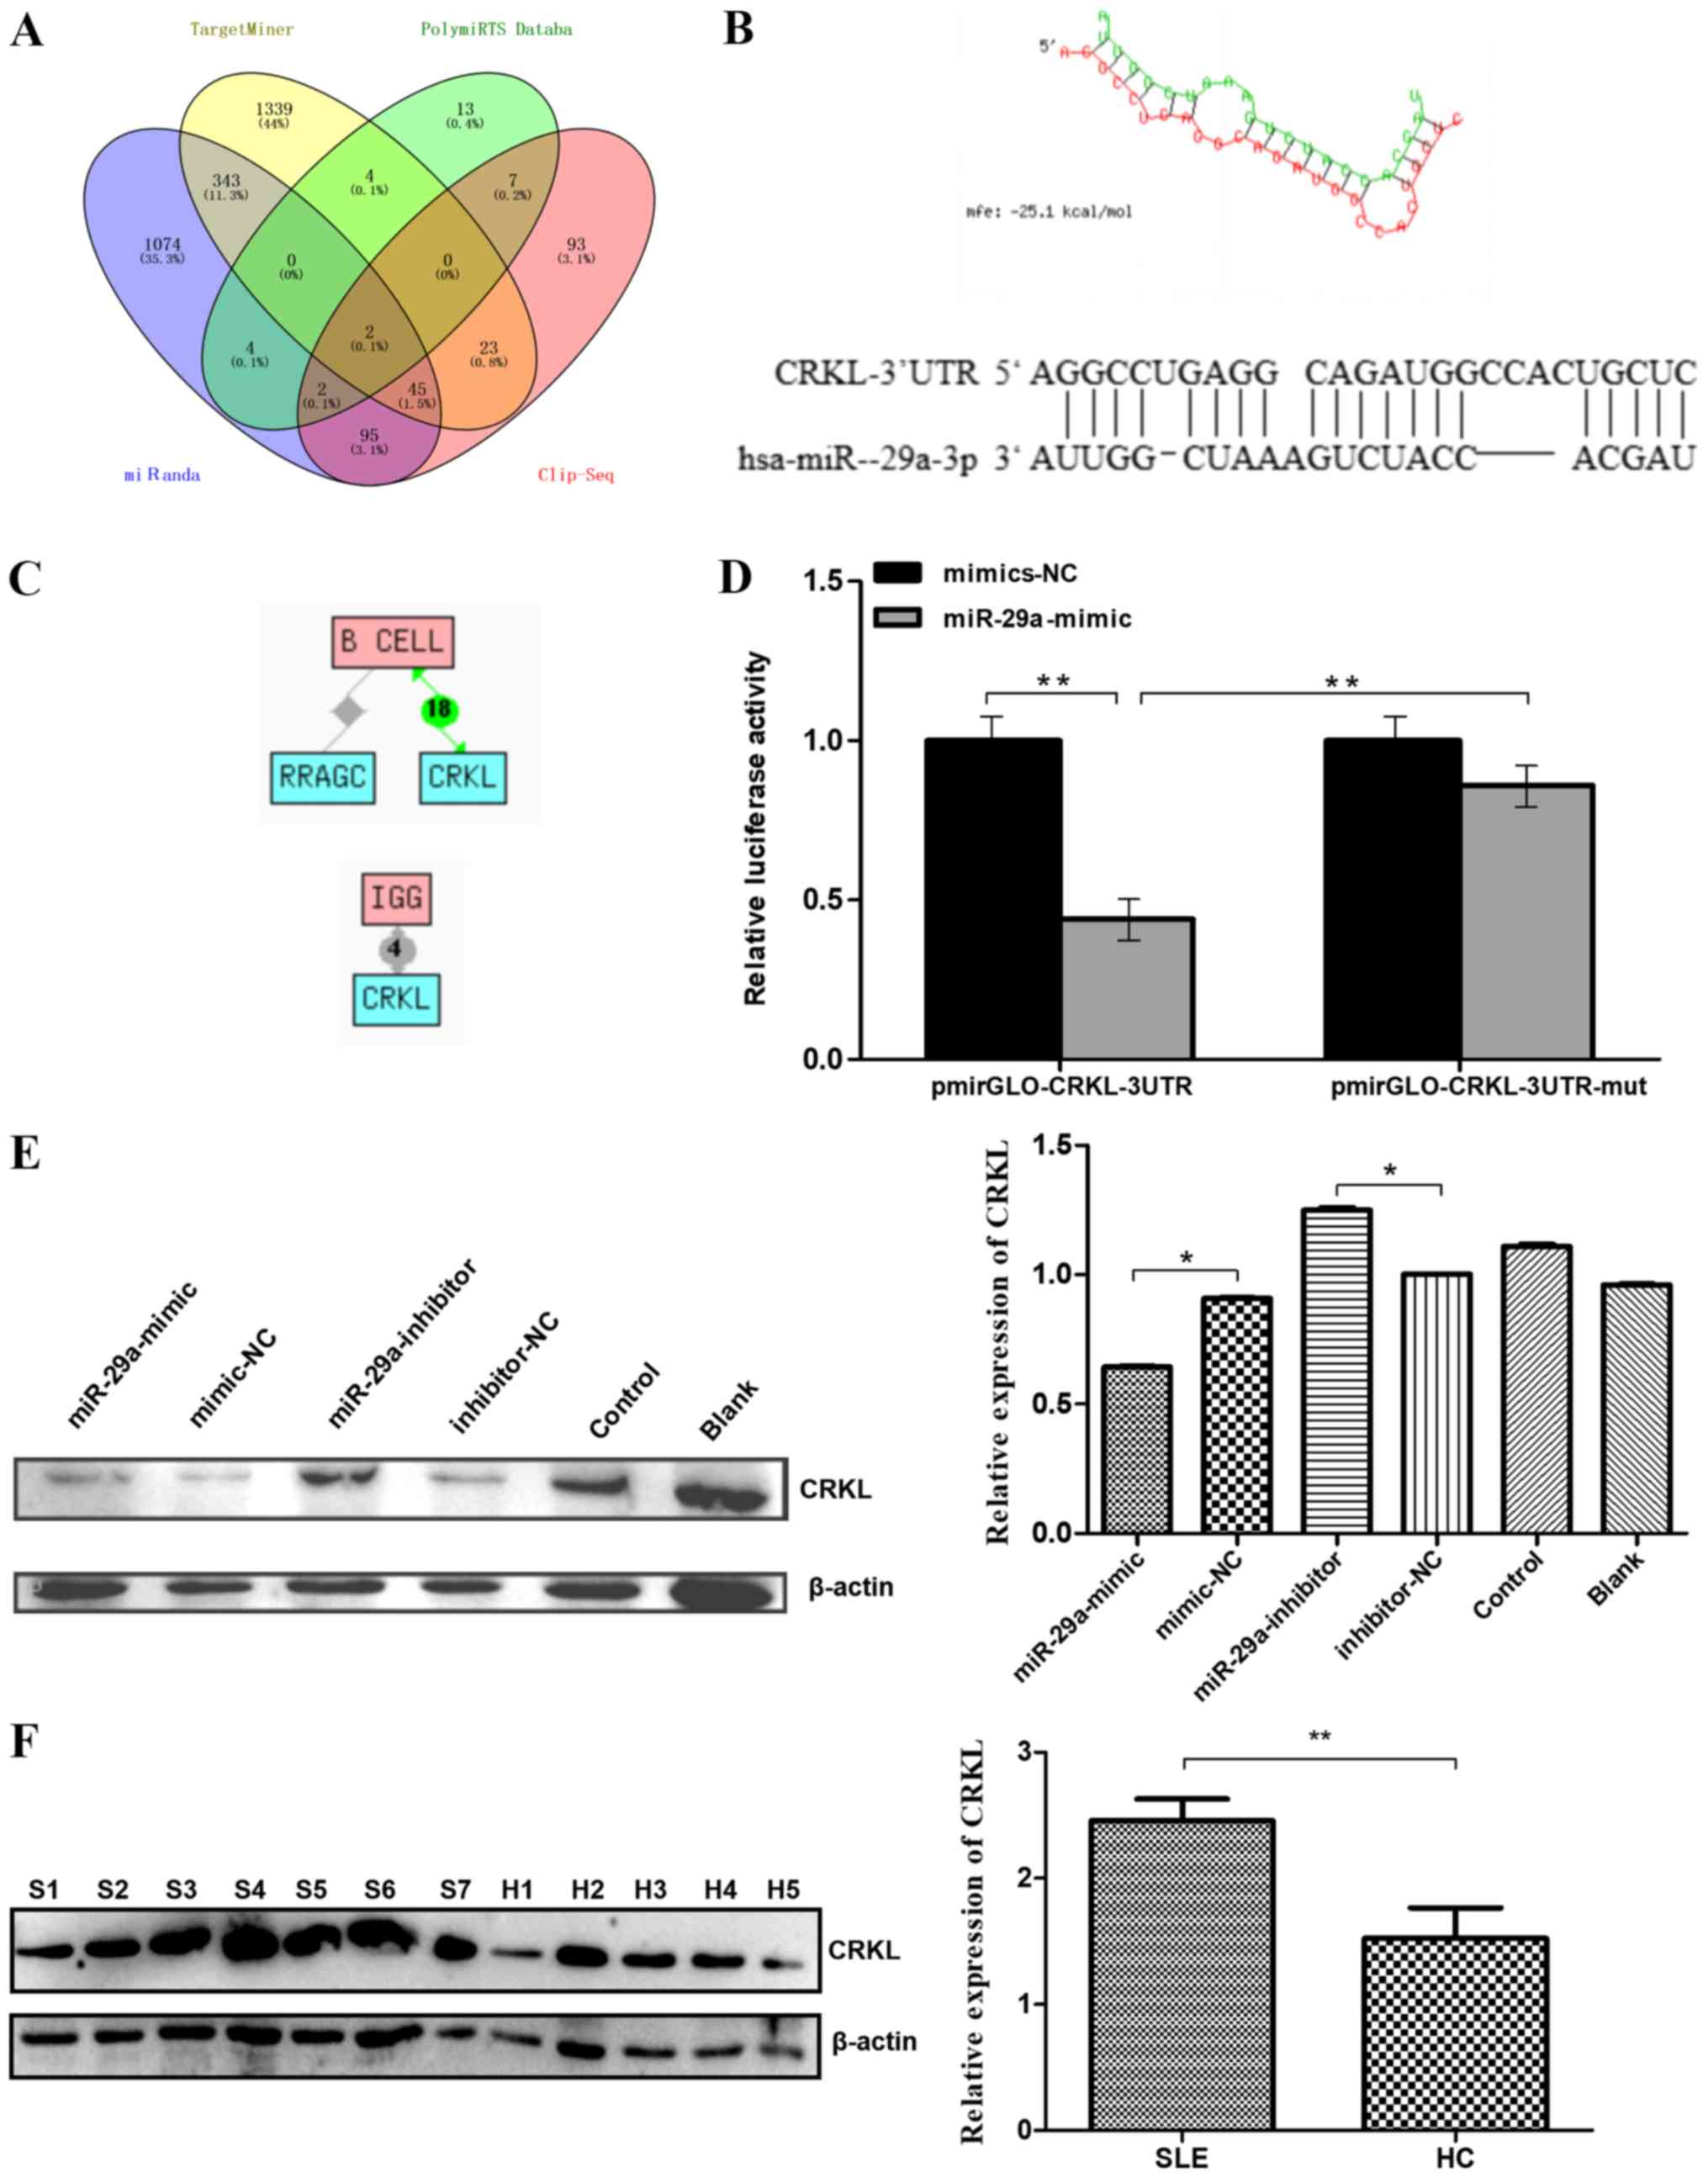 | Figure 3.Predicted miR-29a target genes and
confirmation. (A) Intersection of predicted target genes for
miR-29a-3p. The number of target genes of miR-29a-3p was predicted
by four databases to be 1565, 32, 1756 and 267. A total of two
predicted target genes were obtained as the intersection. (B)
Target position and secondary structure of the miR-29a-3p
interaction with CRKL. (C) The target gene (CRKL)
functions associated with B cell or IgG level regulation were
identified. (D) Dual-luciferase reporter assay was used to
determine that the direct binding of miR-29a to the
pmirGLO-CRKL-3′-UTR transcript repressed the luciferase activity.
(E) Western blotting was used to analyze the expression levels of
the CRKL protein. Raji cells were transfected with a miR-29a-mimic,
mimic-NC, miR-29a-inhibitor or inhibitor-NC. All values are
presented as the mean ± SD of three replicates. (F) Western
blotting was used to analyze the expression levels of CRKL protein
in the B cells of seven patients with SLE and five HCs. All values
are presented as the mean ± SD of three repeats. *P<0.05 vs.
mimic-NC or inhibitor- NC group; **P<0.01. SLE/S, systemic lupus
erythematosus; HC/H, healthy control; miR, microRNA; NC, negative
control; CRKL, Crk-like protein; UTR, untranslated region; mut,
mutant; RRAGC, Ras-related GTP-binding protein C. |
The dual-luciferase reporter assay revealed that the
direct binding of miR-29a to the pmirGLO-CRKL-3′-UTR transcript
significantly repressed the relative luciferase activity compared
with the direct binding of mimic-NC to the pmirGLO-CRKL-3′UTR
transcript (P<0.01; Fig. 3D),
which further suggested that CRKL may be a direct downstream target
of miR-29a. In addition, mutations in the miR-29a-binding region
within the 3′-UTR of CRKL abolished the decrease observed in the
relative luciferase activity between the mimic-NC- and
miR-29a-transfected groups, indicating the specificity of the
target site of CRKL (Fig. 3D).
Next, western blotting was performed to determine whether miR-29a
downregulates the protein expression level of CRKL. CRKL protein
levels were significantly decreased in Raji cells transfected with
miR-29a mimic compared with levels in cells transfected with the
mimic-NC. CRKL protein levels were significantly increased in Raji
cells transfected with miR-29a inhibitor compared with levels in
cells transfected with the inhibitor-NC (Fig. 3E). Furthermore, western blotting
analysis of the B cells of patients with SLE (n=7) and HCs (n=5)
demonstrated a significant increase in the expression levels of the
CRKL protein in the B cells of patients with SLE compared with HCs
(Fig. 3F).
Discussion
SLE is a systemic autoimmune disease caused by a
wide range of defects in the immune regulation (25,26),
including the overactivation of B cell as one of the prominent
features (26). For example,
Sherer et al (26) proposed
that SLE is caused by multiple genetic defects, resulting in the
excessive activation of B cells. In addition, Zhao et al
(27) reported that the intricate
clinical manifestations of SLE may be immune-based owing to the
loss of autoantibodies and autotolerance produced by the B
cells.
Several independent analyses of miRNA expression
levels have demonstrated marked differences in the miRNA profiles
between patients with SLE and HCs (7), which provided important information
for investigating the pathogenesis of SLE, and for developing novel
diagnostic biomarkers and treatment targets (7). The present study demonstrated that
the miR-29a expression levels in the B cells of patients with SLE
were significantly decreased compared with those in HCs. Therefore,
it was hypothesized that miR-29a expression level may be used as a
potential biomarker and a novel therapeutic target for the
treatment of active SLE.
miR-29a expression level has also been reported to
be significantly reduced in certain cancers, including
neuroblastoma (23), osteosarcoma
(19) and mantle cell lymphoma
(28), suggesting that miR-29a may
be a diagnostic and prognostic biomarker for these different
diseases. For example, Maugeri et al (23) reported that miR29a-3p expression
level was downregulated in vivo in a mouse neuroblastoma
progression model, suggesting a new therapeutic target for
neuroblastoma. However, Liu et al (29) demonstrated that the expression
level of miR-29a in non-small cell lung cancer (NSCLC) tissues was
increased compared with the normal lung tissues, whereas the
expression level of the metastasis suppressor protein 1 (MTSS1) was
significantly decreased compared with in the normal lung tissues.
The study further hypothesized that miR-29a might therefore
downregulate MTSS1 protein expression level, thereby promoting the
proliferation and invasion of NSCLC cells (29). These studies indicated that miR-29a
may have different regulatory roles in different cell lines;
however, to the best of our knowledge, there has been little
research conducted to date on the role of miR-29a in SLE. In the
present study, a bioinformatics approach was used to determine the
predicted target genes of miR-29a from four miRNA target gene
prediction sites. After taking the intersection, the candidate gene
CRKL was chosen as the target. Using western blotting and ELISA
assays, the downregulation of miR-29a expression levels in B cells
obtained from patients with SLE was suggested to enhance B cell
reactivity through the witnessed upregulation of the expression
levels of its target gene, CRKL. The dual-luciferase reporter assay
further validated the presence of miR-29a-binding sites in the
3′UTR of CRKL.
CRKL encodes the CRK-like protooncogene adaptor
protein, and the function of CRKL has been discovered to be
associated with the regulation of B cells (30) and IgG levels (31). However, to the best of our
knowledge, there are only a few reports detailing the involvement
of CRKL in the pathogenesis of SLE. In our previous study,
high-throughput sequencing analysis of RNAs from PBMCs of three
patients with SLE and three HCs demonstrated that the expression
levels of CRKL were upregulated in patients with SLE (3). The present study demonstrated that
the expression level of the CRKL protein in B cells from patients
with SLE was significantly increased compared with those in the B
cells from HCs.
In conclusion, the findings from the present study
suggested that the decreased expression levels of miR-29a in
patients with SLE may promote the expression of its downstream
target CRKL to increase the IgG secretion by B cells. Therefore,
therapeutic strategies to restore the normal expression levels of
miR-29a may serve as a potential method for the effective treatment
of SLE.
Supplementary Material
Supporting Data
Acknowledgements
Not applicable.
Funding
The present study was supported by the Zhejiang
Provincial Natural Science Foundation of China (grant no.
LY12H05003), the Zhejiang Science and Technology Bureau (grant no.
2016C33214), the Medical Health Science and Technology Project of
Zhejiang Provincial Health Commission (grant no. 2019KY453), the
Zhejiang University Student New Talents Program (grant no.
2018R413016) and the Wenzhou Municipal Science and Technology
Bureau (grant no. Y20160018).
Availability of data and materials
The datasets used and/or analyzed during the current
study are available from the corresponding author on reasonable
request.
Authors' contributions
XS, LY and SX contributed to the design and planning
of the experiments; XS and LY wrote the manuscript; XS, LY, SX, GG,
ZZ and MY performed the laboratory experiments; LZ, BL and XX
conducted experiments and provided material support; QL and XD
analyzed the data and revised the manuscript. All authors read and
approved the final manuscript.
Ethics approval and consent to
participate
This study is performed in accordance with ethical
standards. The study was approved by the Medical and Ethical
Committees of the Wenzhou Medical University (Zhejiang, China). All
participants provided written informed consent.
Patient consent for publication
Not applicable.
Competing interests
The authors declare that they have no competing
interests.
References
|
1
|
Frieri M: Mechanisms of disease for the
clinician: Systemic lupus erythematosus. Ann Allerg Asthma Im.
110:228–232. 2013. View Article : Google Scholar
|
|
2
|
Ziegelasch M, van Delft MA, Wallin P,
Skogh T, Magro-Checa C, Steup-Beekman GM, Trouw LA, Kastbom A and
Sjöwall C: Antibodies against carbamylated proteins and cyclic
citrullinated peptides in systemic lupus erythematosus: Results
from two well-defined European cohorts. Arthritis Res Ther.
18:2892016. View Article : Google Scholar : PubMed/NCBI
|
|
3
|
Guo G, Wang H, Shi X, Ye L, Wu K, Lin K,
Ye S, Li B, Zhang H, Lin Q, et al: NovelmiRNA-25 inhibits AMPD2 in
peripheral blood mononuclear cells of patients with systemic lupus
erythematosus and represents a promising novel biomarker. J Transl
Med. 16:3702018. View Article : Google Scholar : PubMed/NCBI
|
|
4
|
Jeltsch-David H and Muller S:
Neuropsychiatric systemic lupus erythematosus: Pathogenesis and
biomarkers. Nat Rev Neurol. 10:579–596. 2014. View Article : Google Scholar : PubMed/NCBI
|
|
5
|
Bernatsky S, Joseph L, Boivin JF, Gordon
C, Urowitz M, Gladman D, Fortin PR, Ginzler E, Bae SC, Barr S, et
al: The relationship between cancer and medication exposures in
systemic lupus erythaematosus: A case-cohort study. Ann Rheum Dis.
67:74–79. 2008. View Article : Google Scholar : PubMed/NCBI
|
|
6
|
Baudino L, Yoshinobu K, Morito N,
Santiago-Raber ML and Izui S: Role of endogenous retroviruses in
murine SLE. Autoimmun Rev. 10:27–34. 2010. View Article : Google Scholar : PubMed/NCBI
|
|
7
|
Luo S, Liu Y, Liang G, Zhao M, Wu H, Liang
Y, Qiu X, Tan Y, Dai Y, Yung S, et al: The role of microRNA-1246 in
the regulation of B cell activation and the pathogenesis of
systemic lupus erythematosus. Clin Epigenetics. 7:242015.
View Article : Google Scholar : PubMed/NCBI
|
|
8
|
Yu F, Haas M, Glassock R and Zhao MH:
Redefining lupus nephritis: Clinical implications of
pathophysiologic subtypes. Nat Rev Nephrol. 13:483–495. 2017.
View Article : Google Scholar : PubMed/NCBI
|
|
9
|
Xie HH, Shen H, Zhang L, Cui MY, Xia LP
and Lu J: Elevated serum interleukin-34 level in patients with
systemic lupus erythematosus is associated with disease activity.
Sci Rep. 8:34622018. View Article : Google Scholar : PubMed/NCBI
|
|
10
|
Zhou B, Zuo XX, Li YS, Gao SM, Dai XD, Zhu
HL and Luo H: Integration of microRNA and mRNA expression profiles
in the skin of systemic sclerosis patients. Sci Rep. 7:428992017.
View Article : Google Scholar : PubMed/NCBI
|
|
11
|
Luo Q, Liu J, Fu B, Zhang L, Guo Y, Huang
Z and Li J: Circular RNAs Hsa_circ_0002715 and Hsa_circ_0035197 in
peripheral blood are novel potential biomarkers for new-onset
rheumatoid arthritis. Dis Markers. 2019:20731392019. View Article : Google Scholar : PubMed/NCBI
|
|
12
|
He L and Hannon GJ: MicroRNAs: Small RNAs
with a big role in gene regulation. Nat Rev Genet. 5:522–531. 2004.
View Article : Google Scholar : PubMed/NCBI
|
|
13
|
Xiao C and Rajewsky K: microrna control in
the immune system: Basic principles. Cell. 136:26–36. 2009.
View Article : Google Scholar : PubMed/NCBI
|
|
14
|
Ma X and Liu Q: MicroRNAs in the
pathogenesis of systemic lupus erythematosus. Int J Rheum Dis.
16:115–121. 2013. View Article : Google Scholar : PubMed/NCBI
|
|
15
|
de Yébenes VG, Bartolomé-Izquierdo N and
Ramiro AR: Regulation of B-cell development and function by
microRNAs. Immunol Rev. 253:25–39. 2013. View Article : Google Scholar : PubMed/NCBI
|
|
16
|
Hong Y, Wu J, Zhao J, Wang H, Liu Y, Chen
T, Kan X, Tao Q, Shen X, Yan K and Zhai Z: miR-29b and miR-29c are
involved in Toll-like receptor control of glucocorticoid-induced
apoptosis in human plasmacytoid dendritic cells. PLoS One.
8:e699262013. View Article : Google Scholar : PubMed/NCBI
|
|
17
|
Monteleone K, Selvaggi C, Cacciotti G,
Falasca F, Mezzaroma I, D'Ettorre G, Turriziani O, Vullo V,
Antonelli G and Scagnolari C: MicroRNA-29 family expression and its
relation to antiviral immune response and viro-immunological
markers in HIV-1-infected patients. BMC Infect Dis. 15:512015.
View Article : Google Scholar : PubMed/NCBI
|
|
18
|
Sun XJ, Liu BY, Yan S, Jiang TH, Cheng HQ,
Jiang HS, Jiang HS, Cao Y and Mao AW: MicroRNA-29a promotes
pancreatic cancer growth by inhibiting tristetraprolin. Cell
Physiol Biochem. 37:707–718. 2015. View Article : Google Scholar : PubMed/NCBI
|
|
19
|
Liston A, Papadopoulou AS, Danso-Abeam D
and Dooley J: MicroRNA-29 in the adaptive immune system: Setting
the threshold. Cell Mol Life Sci. 69:3533–3541. 2012. View Article : Google Scholar : PubMed/NCBI
|
|
20
|
Wang X, Zhang C, Wu Z, Chen Y and Shi W:
CircIBTK inhibits DNA demethylation and activation of AKT signaling
pathway via miR-29b in peripheral blood mononuclear cells in
systemic lupus erythematosus. Arthritis Res Ther. 20:1182018.
View Article : Google Scholar : PubMed/NCBI
|
|
21
|
Ahluwalia JK, Khan SZ, Soni K, Rawat P,
Gupta A, Hariharan M, Scaria V, Lalwani M, Pillai B, Mitra D and
Brahmachari SK: Human cellular microRNA hsa-miR-29a interferes with
viral nef protein expression and HIV-1 replication. Retrovirology.
5:1172008. View Article : Google Scholar : PubMed/NCBI
|
|
22
|
Hochberg MC: Updating the American college
of rheumatology revised criteria for the classification of systemic
lupus erythematosus. Arthritis Rheum. 40:17251997. View Article : Google Scholar : PubMed/NCBI
|
|
23
|
Maugeri M, Barbagallo D, Barbagallo C,
Banelli B, Di Mauro S, Purrello F, Magro G, Ragusa M, Di Pietro C,
Romani M and Purrello M: Altered expression of miRNAs and
methylation of their promoters are correlated in neuroblastoma.
Oncotarget. 7:83330–83341. 2016. View Article : Google Scholar : PubMed/NCBI
|
|
24
|
Livak KJ and Schmittgen TD: Analysis of
relative gene expression data using real-time quantitative PCR and
the 2(-Delta Delta C(T)) method. Methods. 25:402–408. 2001.
View Article : Google Scholar : PubMed/NCBI
|
|
25
|
Lipsky PE: Systemic lupus erythematosus:
An autoimmune disease of B cell hyperactivity. Nat Immunol.
2:764–766. 2001. View Article : Google Scholar : PubMed/NCBI
|
|
26
|
Sherer Y, Gorstein A, Fritzler MJ and
Shoenfeld Y: Autoantibody explosion in systemic lupus
erythematosus: More than 100 different antibodies found in SLE
patients. Semin Arthritis Rheum. 34:501–537. 2004. View Article : Google Scholar : PubMed/NCBI
|
|
27
|
Zhao M, Liu Q, Liang G, Wang L, Luo S,
Tang Q, Zhao H, Su Y, Yung S, Chan TM and Lu Q: E4BP4
overexpression: A protective mechanism in CD4+ T cells from SLE
patients. J Autoimmun. 41:152–160. 2013. View Article : Google Scholar : PubMed/NCBI
|
|
28
|
Zhao JJ, Lin J, Lwin T, Yang H, Guo J,
Kong W, Dessureault S, Moscinski LC, Rezania D, Dalton WS, et al:
MicroRNA expression profile and identification of miR-29 as a
prognostic marker and pathogenetic factor by targeting CDK6 in
mantle cell lymphoma. Blood. 115:2630–2639. 2010. View Article : Google Scholar : PubMed/NCBI
|
|
29
|
Liu M, Zeng X, Lu YX, Mo YJ, Liao TH, Gan
C and Lu XQ: Study on molecular mechanism of MiRNA-29a in promoting
proliferation and invasion of non-small-cell lung cancer by
inhibiting MTSS1. Eur Rev Med Pharmacol Sci. 22:5531–5538.
2018.PubMed/NCBI
|
|
30
|
Aiello FB, Guszczynski T, Li W, Hixon JA,
Jiang Q, Hodge DL, Massignan T, Di Lisio C, Merchant A, Procopio
AD, et al: IL-7-induced phosphorylation of the adaptor Crk-like and
other targets. Cell Signal. 47:131–141. 2018. View Article : Google Scholar : PubMed/NCBI
|
|
31
|
Jankowski A, Zhu P and Marshall JG:
Capture of an activated receptor complex from the surface of live
cells by affinity receptor chromatography. Anal Biochem.
380:235–248. 2008. View Article : Google Scholar : PubMed/NCBI
|