Introduction
Gastric cancer (GC) remains the fifth most common
type of malignant tumor and is the third leading cause of
cancer-related death in the world (1). According to 2015 statistics, nearly
679,100 new cases of GC and 498,000 new mortalities due to GS were
diagnosed in China (2). Accurate
classification is helpful to the diagnosis, treatment and prognosis
of GC. Patient outcome is difficult to predict using only the
classic histological criteria and traditional histopathological
classification has limited use in guiding clinical outcomes
(3). The wide application of
next-generation sequencing (NGS) technology has facilitated the
molecular classification of numerous tumors (4). It has also helped to define the
complex genome landscape of GC more comprehensively and guide its
treatment and prognosis (5,6).
Therefore, it is particularly important to study the molecular
characteristics of GC.
In 2014, on the basis of key DNA defects and
molecular abnormalities, The Cancer Genome Atlas Consortium (TCGA)
divided GS into Epstein-Barr virus (EBV) positive type,
microsatellite instability (MSI) type, gene stable (GS) type and
chromosome instability (CIN) type (5). TCGA typing was based on Europe and
the USA populations; however, the clinical characteristics of TCGA
typing in the Asian population, and its association with clinical
parameters and prognosis remain unclear. A new classification
method has been proposed by the Asian Cancer Research Group (ACRG)
(6). Specifically, four molecular
subtypes were proposed: MSI, microsatellite stable
(MSS)/epithelial-mesenchymal transition (EMT), MSS/tumor protein 53
(TP53) active and MSS/TP53 inactive. ACRG typing was largely based
on Asian populations, mainly from Japan and Korea. However, it is
unclear whether ACRG classification standards can be applied to
Chinese populations. To reduce the costs, the ACRG recommends the
use of immunohistochemistry (IHC) for tumor classification rather
than NGS. The MSI type can be identified by MutL protein homolog 1
(MLH1) expression, while the MSS/EMT type can be identified by
assay of E-cadherin gene 1 (CDH1) expression and the
MSS/TP53+ and MSS/TP53− types can be
identified by assays of mouse double minute 2 homolog (MDM2) and
cyclin-dependent kinase inhibitor 1A (also known as P21) expression
(6). These four subtypes of GC
have different clinical correlations with TCGA subtypes (7). However, based on the Chinese
population, the clinical characteristics of TCGA typing and ACRG
typing and their predictive role in prognosis remain unclear.
In the present study, NGS technology and IHC
staining assays were used for comprehensive analyses of GC, and 65
patients with GC were classified according to different
classification criteria. The association between GC molecular
classifications, clinicopathological features and prognosis was
evaluated. It was further clarified whether TCGA typing and ACRG
typing based on IHC methods could be applied to Chinese
populations. The present study also evaluated which molecular
typing of GC could evaluate prognosis most accurately.
Materials and methods
Patients and tissue samples
A total of 65 patients with GC (age range, 43–84
years; male: female, 2.10:1) were enrolled at the Third Department
of Surgery, The Fourth Hospital of Hebei Medical University,
between August 2013 and November 2015. After surgery, all the
specimens were divided into sections. One section was sent for
clinical pathological diagnosis by pathologists. Without affecting
the clinicopathological diagnosis, the tumor tissues visible to the
human eye were formalin-fixed at room temperature overnight and
paraffin-embedded (FFPE) for routine IHC analysis; 4-µm thick
paraffin sections were prepared for subsequent experiments. For
each patient, only one piece of GC tissue was collected for the
experiment. FFPE tissue blocks from primary stomach were available
for further experiments. All diagnoses were reviewed by two
experienced pathologists and confirmed by hematoxylin for 1 min and
eosin staining for 3 min, both at room temperature. In order to
exclude the influence of preoperative adjuvant chemotherapy and
radiotherapy on the survival of patients, patients who had not
undergone preoperative adjuvant chemotherapy or radiotherapy were
selected. However, almost all patients with stage III received
chemotherapy after the operation, so patients in the present study
were in stage III. Patients with primary malignant tumors in other
organs were excluded from the study. Those whose information was
incomplete were excluded from the analysis. The clinicopathological
data were collected retrospectively from the case history of the
patients, including gender, age, Lauren classification, tumor
location and postoperative adjuvant therapy. All the patients
provided written informed consent before enrollment. The study was
approved by the Medical Ethics Committee of The Fourth Hospital of
Hebei Medical University.
RNA and DNA extraction, and
quantitative determination
Sections (10-µm) were cut from the FFPE blocks and
each section was transferred into a microcentrifuge tube.
Deparaffinization was performed by adding 1 ml xylene for 10 min
twice and 1 ml absolute ethanol for 10 min twice. RNA and DNA were
extracted from PE tissues of GC using High Pure FFPET RNA Isolation
kit (Roche Diagnostics GmbH) and DNA FFPE Tissue kit (Qiagen,
Inc.). The main steps included dewaxing, dissociation, adsorption
and elution. The RNA concentration and purity were routinely
measured by NanoDrop 2000 UV–Vis spectrophotometer (Thermo Fisher
Scientific, Inc.), and then RNA was reverse transcribed to cDNA
using the RevertAid First Strand cDNA Synthesis kit (Thermo Fisher
Scientific, Inc.) at 42°C for 60 min, 72°C for 15 min and 4°C for
preservation. The DNA concentration and quality were determined by
fluorescence quantitative PCR (qPCR) using the SYBR Green PCR
Master mix (Thermo Fisher Scientific, Inc.). The following primer
pairs were used for the qPCR: GAPDH forward,
5′-CGCTGAGTACGTCGTGGAGTC-3′ and reverse,
5′-GTGATGATCTTGAGGCTGTTGTC-3′. The following thermocycling
conditions were used for the qPCR: 94°C for 5 min; followed by 35
cycles of 94°C for 15 sec, 58°C for 30 sec and 72°C for 30 sec; and
a final extension at 72°C for 5 min. Protease digestion of the DNA
samples was performed overnight at 55°C with gentle rotation. Heat
treatment at 95°C for 30 min was included or omitted after
digestion to validate the heat treatment. All DNA samples were
purified by ethanol precipitation and dissolved in distilled water.
The DNA concentration and purity were routinely measured by
NanoDrop 2000 UV–Vis spectrophotometer (Thermo Fisher Scientific,
Inc.). RNA or DNA samples with an optical density (OD)260/OD280
ratio ranging from 1.8 to 2.1 were deemed acceptable.
Library construction and preparation
of the sequencing template
The procedure included targeted amplification of the
genome region, connection of bar codes to amplified fragments using
DNA ligases, purification of magnetic beads from the library and
quantitative analysis of the library by fluorescence qPCR.
Specimens were diluted to a suitable concentration for the mixed
library and the library was then amplified by PCR (Ion One Touch2
System; Thermo Fisher Scientific, Inc.). PCR products were
dissociated into single-strand DNA for concentrating positive
sequencing template using a template enrichment system (Ion One
Touch ES; Thermo Fisher Scientific, Inc.).
Ion Torrent PGM sequencing and
analysis
Quality control microspheres (Ion Torrent PGM™
Sequencing Reagent; Thermo Fisher Scientific, Inc.) were added to
the enriched products. Then, sequencing primers were annealed and
extended, and finally incubated with PCR (paired end (PE) read 1
sequencing primer, 5′-ACACTCTTTCCCTACACGACGCTCTTCCGATCT-3′ and PE
read 2 sequencing primer,
5′-CGGTCTCGGCATTCCTGCTGAACCGCTCTTCCGATCT-3′. The above sequencing
system was loaded on an Ion Torrent chip (Thermo Fisher Scientific,
Inc.), and then the chip was placed on the Ion Torrent PGM™
instrument for sequencing. The average sequencing depth was
>2,500X. The original data obtained from sequencing were
analyzed by automatic bioinformatics software (ACCB-BIO 2.301;
Beijing ACCB Biotech Ltd.), and gene mutations were screened and
annotated (mutation abundance threshold, 1%; positive reads number,
>5). The results of gene variation analysis by ACCB-BIO 2.301
were confirmed by a comprehensive genomics viewer (Integrative
Genomics Viewer; Broad Institute; http://software.broadinstitute.org/software/igv), and
clinically analyzable results were generated (8).
IHC staining of the FFPE tissue
blocks
The protein expression of MLH1, MDM2, P21,
E-cadherin and vimentin was detected with a streptavidin-biotin
peroxidase kit (SP-9001/9002; OriGene Technologies, Inc.),
according to the manufacturer's protocol. Briefly, non-specific
sites were blocked with normal sheep serum (Reagent A from the kit)
for 1 h at 37°C. MLH1 (1:50; clone EPR3894; cat. no. ab92312;
Abcam), MDM2 (1:100; clone SMP14; cat. no. sc-965; Santa Cruz
Biotechnology, Inc.), P21 (1:100; clone EPR362; cat. no. ab109520;
Abcam), E-cadherin (1:100; clone 5F133; cat. no. sc-71007; Santa
Cruz Biotechnology, Inc.) and vimentin (1:50; clone V9; cat. no.
sc-6260; Santa Cruz Biotechnology, Inc.) rabbit/mouse anti-human
antibodies were incubated with the sections at 4°C overnight.
Biotinylated goat anti-rabbit/mouse antibody (Reagent B from the
kit) and horseradish peroxidase-labeled streptase ovalbumin (3rd
antibody; Reagent C from the kit) were incubated with the sections
at 37°C for 30 min each. Following staining with diaminobenzidine
reagent (ZLI-9018; OriGene Technologies, Inc.), the slices were
counterstained with hematoxylin for 2 min at room temperature and
sealed with neutral gum.
Scoring criteria and molecular
classification
The final results were independently observed and
graded by two pathologists double blinded to the experiment. A
total of 5 fields of vision were randomly selected from each
section and 100 cells were counted in each field under high-power
light microscopy observation (magnification, ×200). IHC staining
intensity and proportion of positive cells were evaluated by the
scoring method of Sinicrope et al (9). The scores of positive cells were
assessed as follows: ≤5% stained cells, 0; 6–25% stained cells, 1;
26–50% stained cells, 2; 51–75% stained cells, 3; and 75% stained
cells, 4. The scores of intensity were as follows: Negative
staining, 0; weak staining, 1; moderate staining, 2; and strong
staining, 3 (Fig. S1). By
multiplying the scores of positive cells and intensity, the final
score of each tumor specimen was obtained.
For MLH1 expression, a final score ≥1 was defined as
positive expression (10,11). For MDM2, p21, E-cadherin and
vimentin expression, a final score of 0–2 was defined as negative
expression, while 3–12 was defined as positive expression (5). According to the ACRG molecular
classification, GC cases with MLH1 negative expression were
categorized as MSI, while GC cases with MLH1 positive expression
were categorized as MSS. Among the MSS cases, GC with E-cadherin
(−) and vimentin (+) were categorized as MSS/EMT, while those with
MDM2 (−) and P21 (+) were categorized as MSS/TP53+. GC
cases with MDM2 (+) and P21 (−) were categorized as
MSS/TP53− (6).
According to TCGA molecular classification, EBV-positive GC cases
were classified as the EBV+ subtype. Among the
EBV-negative specimens, MSI-high stable GC was categorized as MSI.
The other specimens were categorized as GS or CIN subtype according
to their degree of aneuploidy (5).
Statistical analysis
SPSS 23.0 software (IBM Corp.) was used for all the
statistical analyses. Frequency data were analyzed by χ2
or Fisher's exact test for categorical variables, as appropriate.
Overall survival (OS) was calculated from the time of diagnosis to
the time of death from any cause or to the last follow-up date. The
Kaplan-Meier method, log-rank test and Cox's proportional hazards
regression model were used for univariate survival analysis. The
logistic regression model was used to analyze the single factors,
while multivariate analysis was used during stepwise regression for
statistically significant variables in single factor analysis.
Multivariate survival analysis was performed by the Cox's
proportional hazards regression model. Heat maps were used to
assess the overall mutation pattern, amplification pattern and the
patterns by type. All statistical tests were two-sided and
P<0.05 was considered to indicate as statistically significant
difference.
Results
Patient baseline characteristics
A cohort of 65 patients, comprising 44 males (67.7%)
and 21 females (32.3%), with a median of 62 years of age and a
range of 45–80 years of age, were included. All patients enrolled
in the study received surgical treatment and were pathologically
diagnosed with GC carcinoma. In total, 44.62% (29/65) of the tumors
were located at the gastroesophageal junction and 55.38% (36/65) of
the tumors were located at the distal stomach. None of the patients
received preoperative adjuvant radiotherapy or neoadjuvant therapy;
33 patients received capecitabine combined with oxaliplatin (XELOX)
postoperative adjuvant chemotherapy and 32 patients received S1
combined with oxaliplatin postoperative adjuvant chemotherapy.
There were no perioperative mortalities. According to the eighth
edition of the AJCC Cancer Staging Manual, all patients were in
stage III and 18 (27.7%) patients were diagnosed with diffuse
Lauren classification tumors, 29 (44.6%) patients were diagnosed
with intestinal Lauren classification tumors and 18 (27.7%)
patients were diagnosed with mixed Lauren classification
tumors.
TCGA molecular subtypes of GC and
their association with clinicopathological features
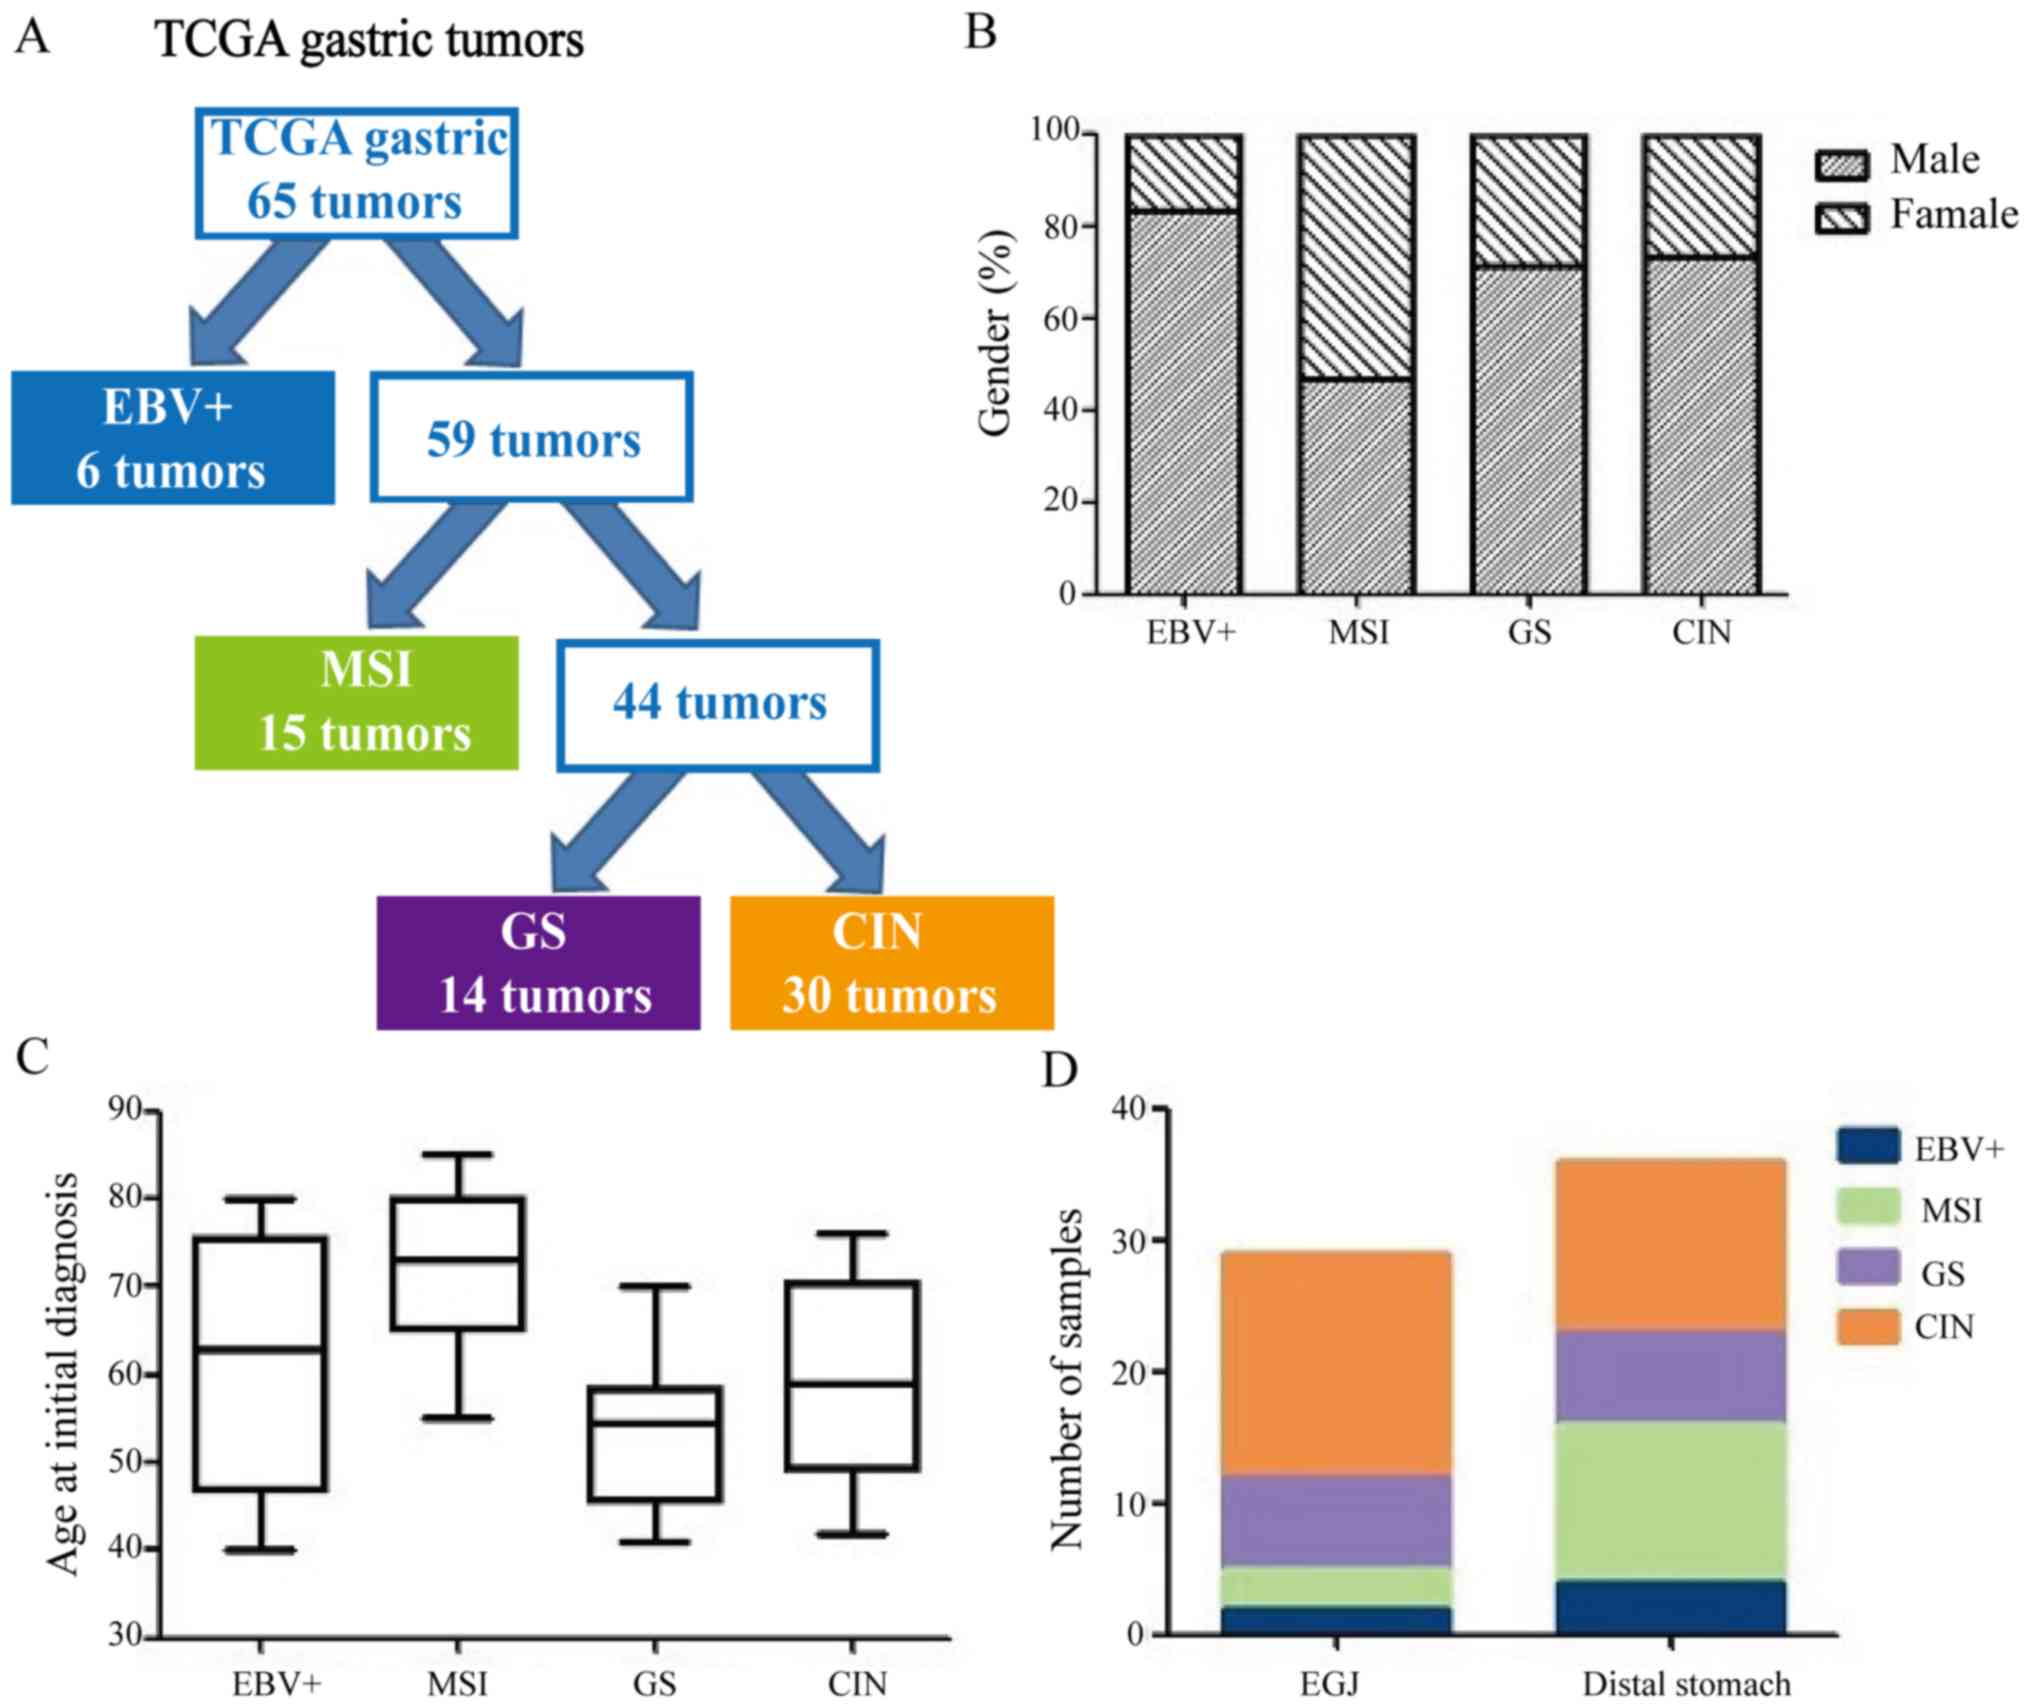
The results of 65 cases of GC according to TCGA
classification criteria are shown in Table I. Of the 65 GC cases, 6 (9.2%) were
EBV+ subtype, 15 (23.1%) were MSI subtype, 14 (21.5%)
were GS subtype and 30 (46.2%) were CIN subtype (Fig. 1A). Table II shows TCGA molecular subtypes
and their clinicopathological factors. The MSI subtype was more
common in females (53.3%), while the EBV+ subtype was
more common in males (83.3%, P=0.021; Fig. 1B). The GS subtype was diagnosed at
relatively younger ages (median age, 54 years), whereas the MSI
subtype was diagnosed at relatively older ages (median age, 72
years; Fig. 1C). The CIN subtype
tumors were more common in the gastroesophageal junction (58.6%,
P=0.008; Fig. 1D). There were no
significant differences in gender, Lauren classification or which
postoperative adjuvant therapy the patients with GC received in
four TCGA subtypes (P>0.05; Table
II).
 | Table I.The Cancer Genome Atlas molecular
subtypes by sequencing. |
Table I.
The Cancer Genome Atlas molecular
subtypes by sequencing.
| Molecular
subtype | Index | Positive
result |
|---|
| EBV+ | EBV positive | 6 |
|
| PLK3CA
mutation | 0 |
|
|
Hypermethylation | 0 |
|
| JAK2
amplification | 0 |
|
| CD274
(PD-L1) amplification | 0 |
|
| PDCD1LG2
(PD-L2) amplification | 0 |
| MSI | MSI status | 15 |
|
| Hypermutated | 0 |
|
|
Hypermethylation | 0 |
| GS | RHOA
mutation | 0 |
|
|
CLDN18-ARHGAP26 rearrangement | 0 |
|
|
CLDN18-ARHGAP6 rearrangement | 0 |
|
| Absence of
extensive somatic copy-number aberrations | 14 |
| CIN | Copy Number Cluster
(Aneuploidy) | 30 |
|
| Focal amplification
of receptor tyrosine kinases (vascular endothelial growth factor
receptor 2) | 0 |
| Table II.The Cancer Genome Atlas molecular
subtypes and characteristics of patients with GC. |
Table II.
The Cancer Genome Atlas molecular
subtypes and characteristics of patients with GC.
| Clinicopathological
factors | EBV+, n
(%) | MSI, n (%) | GS, n (%) | CIN, n (%) | P-value |
|---|
| Sex |
|
|
|
| 0.238 |
|
Male | 5 (7.7) | 7
(10.8) | 10 (15.4) | 22 (33.8) |
|
|
Female | 1 (1.5) | 8
(12.3) | 4 (6.2) | 8
(12.3) |
|
| Age/year |
|
|
|
| <0.001 |
|
≤60 | 3 (4.6) | 1 (1.5) | 12 (18.5) | 18 (27.7) |
|
|
>60 | 3 (4.6) | 14 (21.5) | 2 (3.1) | 12 (18.5) |
|
| Tumor location |
|
|
|
| 0.008 |
|
EGJ | 2 (3.1) | 3 (4.6) | 7
(10.8) | 17 (26.2) |
|
| Distal
stomach | 4 (6.2) | 12 (18.5) | 7
(10.8) | 13 (20.0) |
|
| Lauren
classification |
|
|
|
| 0.582 |
|
Diffuse | 2 (3.1) | 3 (4.6) | 5 (7.7) | 8
(12.3) |
|
|
Intestinal | 2 (3.1) | 5 (7.8) | 6 (9.2) | 16 (24.6) |
|
|
Mixed | 2 (3.1) | 7
(10.8) | 3 (4.6) | 6 (9.2) |
|
| Adjuvant
therapy |
|
|
|
| 0.833 |
|
XELOX | 3 (4.6) | 7
(10.8) | 6 (9.2) | 17 (26.2) |
|
|
SOX | 3 (4.6) | 8
(12.3) | 8
(12.3) | 13 (20.0) |
|
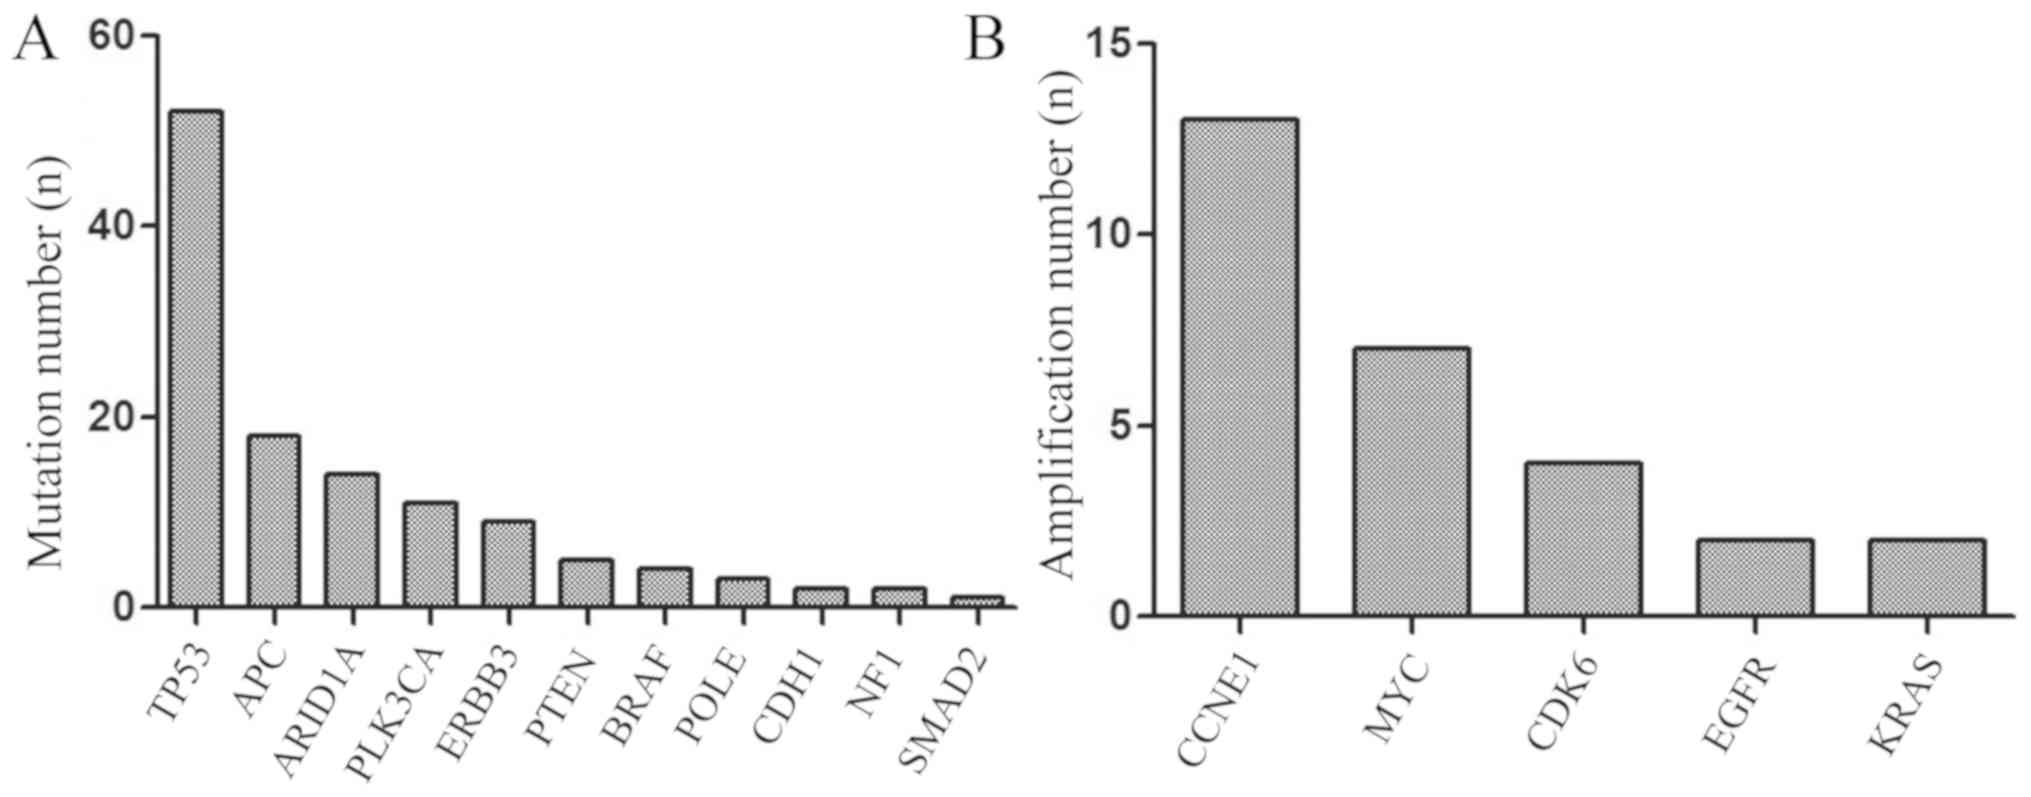
NGS revealed that the mutation rate of TP53
was 80.0% (52/65), APC 27.7% (18/65), AT-rich interactive
domain 1A (ARID1A) 21.5% (14/65), of PLK3CA 16.9%
(11/65), of ERBB3 13.8% (9/65), of PTEN 7.7% (5/65),
of BRAF 6.2% (4/65), of POLE 4.6% (3/65), of
CDH1 3.1% (2/65), of NF1 3.1% (2/65) of SMAD2
1.5% (1/65; Fig. 2A). TP53
and PLK3CA are the most frequently mutated genes in human
tumors, and are associated with poor prognosis in various cancer
types, since they play a vital role in tumor immune regulation.
Mutations in APC would lead to alterations in cell signal
transduction, differentiation, mediation of intercellular adhesion,
stabilization of the cytoskeleton, and regulation of the cell cycle
and apoptosis. ARID1A mutations could increase immune
activity in gastrointestinal cancer. The results of the present
study also revealed that the amplification percentage of
CCNE1 was 20.0% (13/65), of MYC 10.8% (7/65), of
CDK6 6.2% (4/65), of EGFR 3.1% (2/65) and of
KRAS 1.5% (2/65) (Fig. 2B).
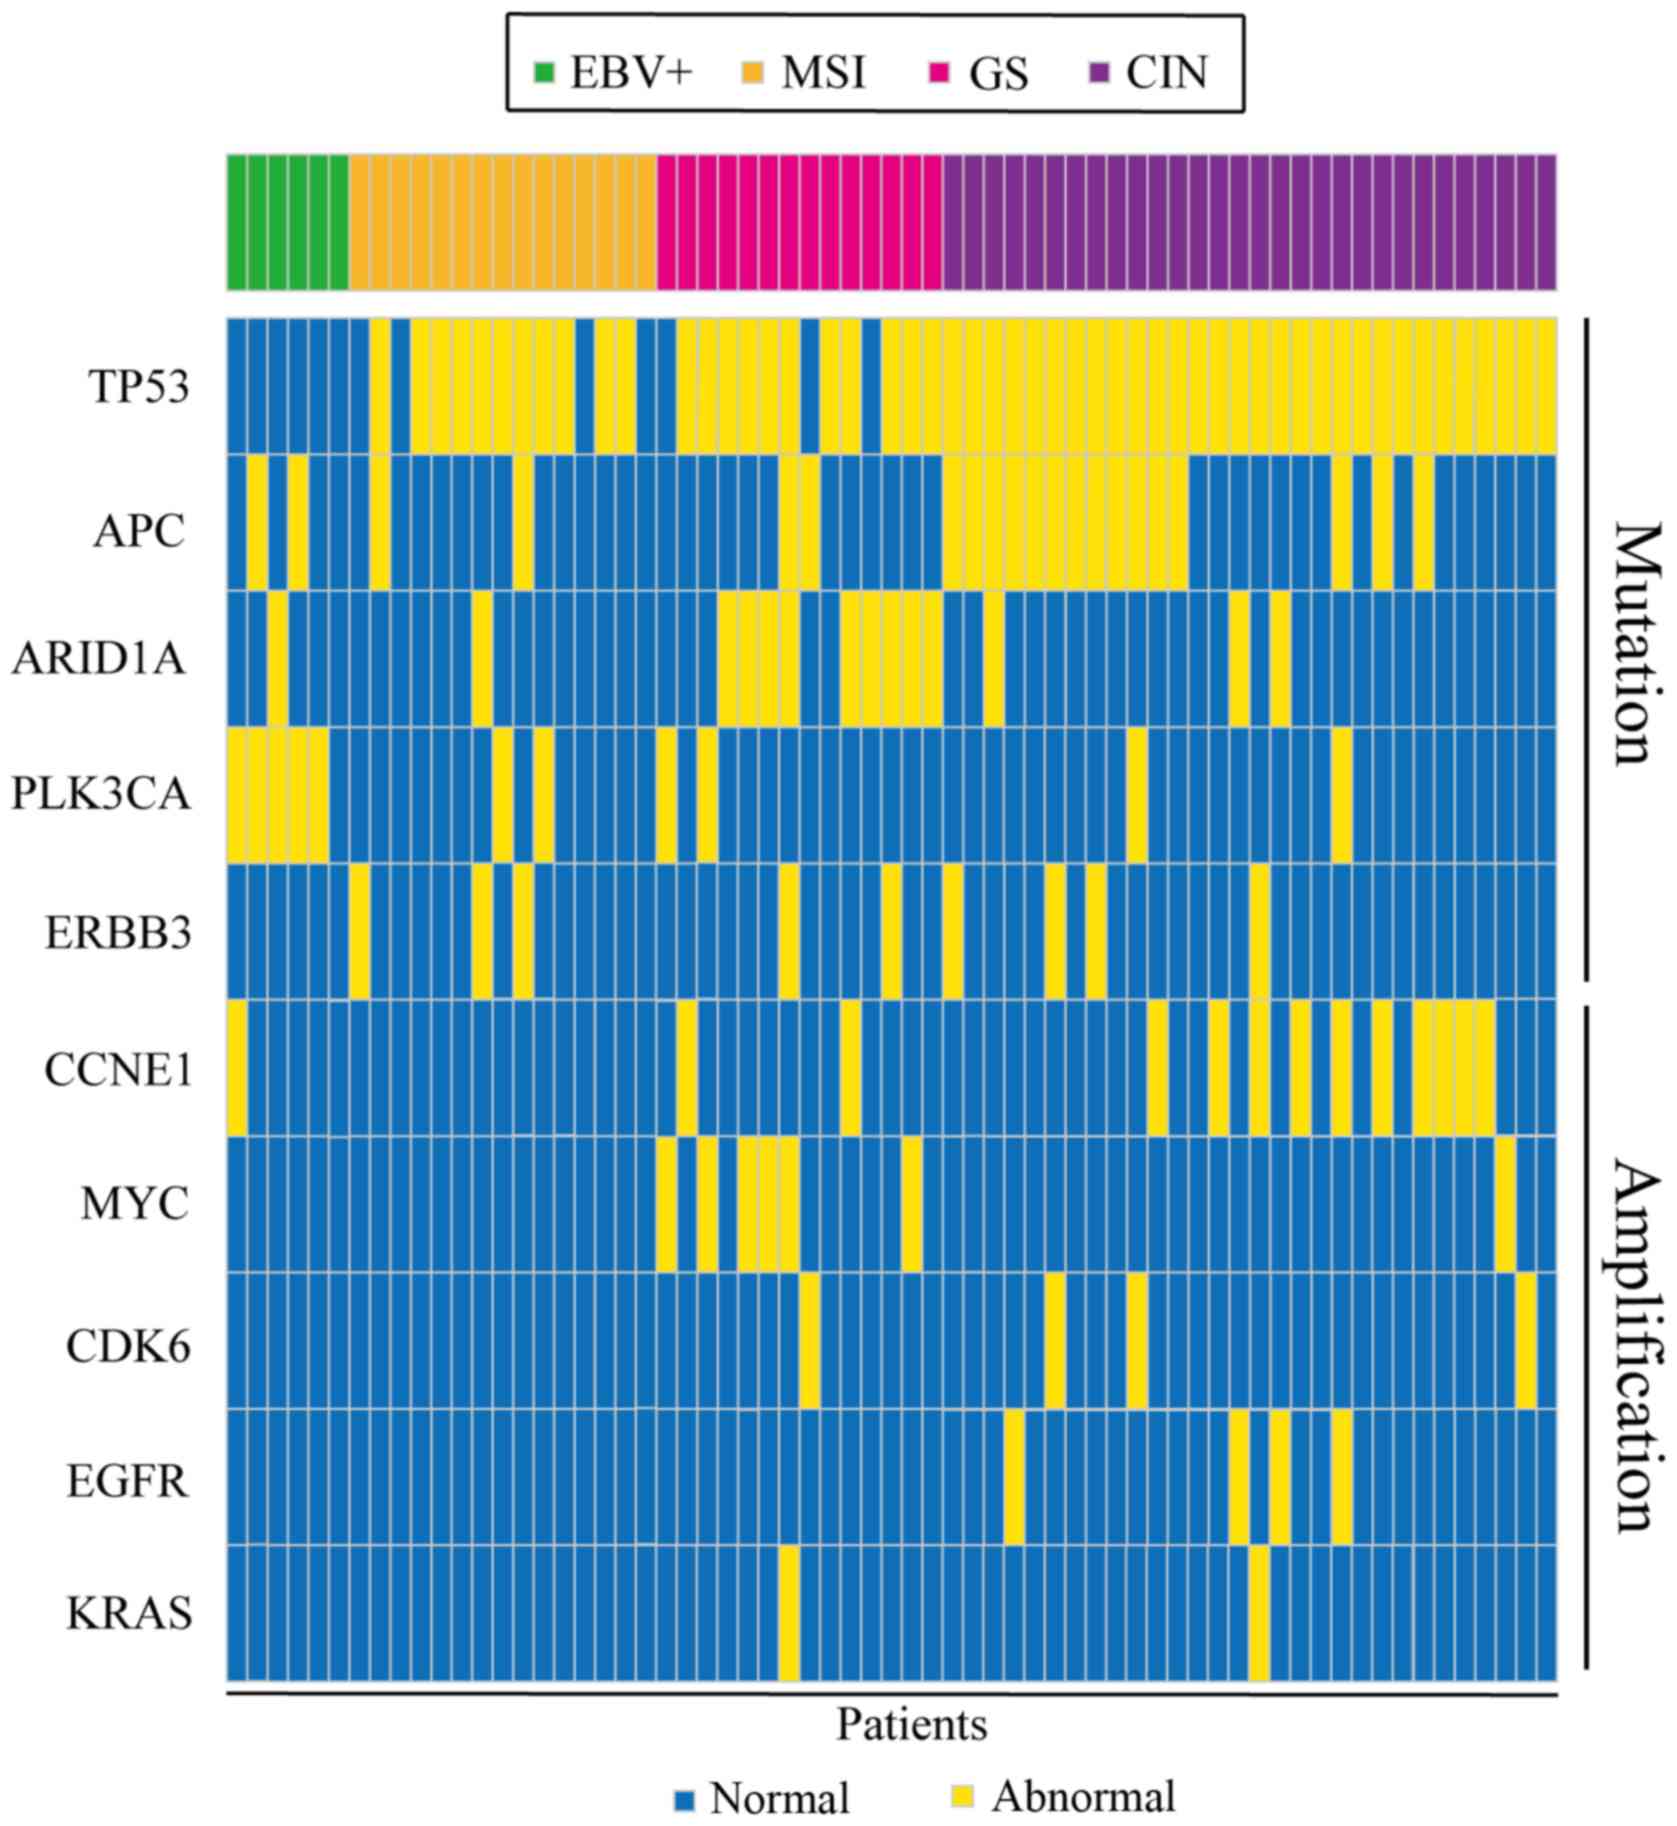
Gene mutations and gene amplification are shown in Fig. 3. The distribution of mutated genes
and amplified genes in gastric cancer typing is shown in Table SI: As demonstrated in Fig. 3, TP53 mutations were mostly
identified in patients with CIN, with a mutation percentage of
57.7% (Table SI), and similar
results were obtained for APC (66.7%; Table SI) and ERBB3 (44.4%;
Table SI). ARID1A
mutations were mainly identified in the GS type (64.3%; Table SI) and PLK3CA mutations in
the EBV+ type (45.5%; Table SI). In addition, CCNE1
amplification was predominantly found in patients with CIN (76.9%;
Fig. 3; Table SI), with similar results obtained
for CDK6 and EGFR (75 and 100% respectively; Table SI). Conversely, MYC amplifications
were predominantly identified in the GS type (85.7%; Table SI).
ACRG molecular subtypes of GC and
their association with clinicopathological features
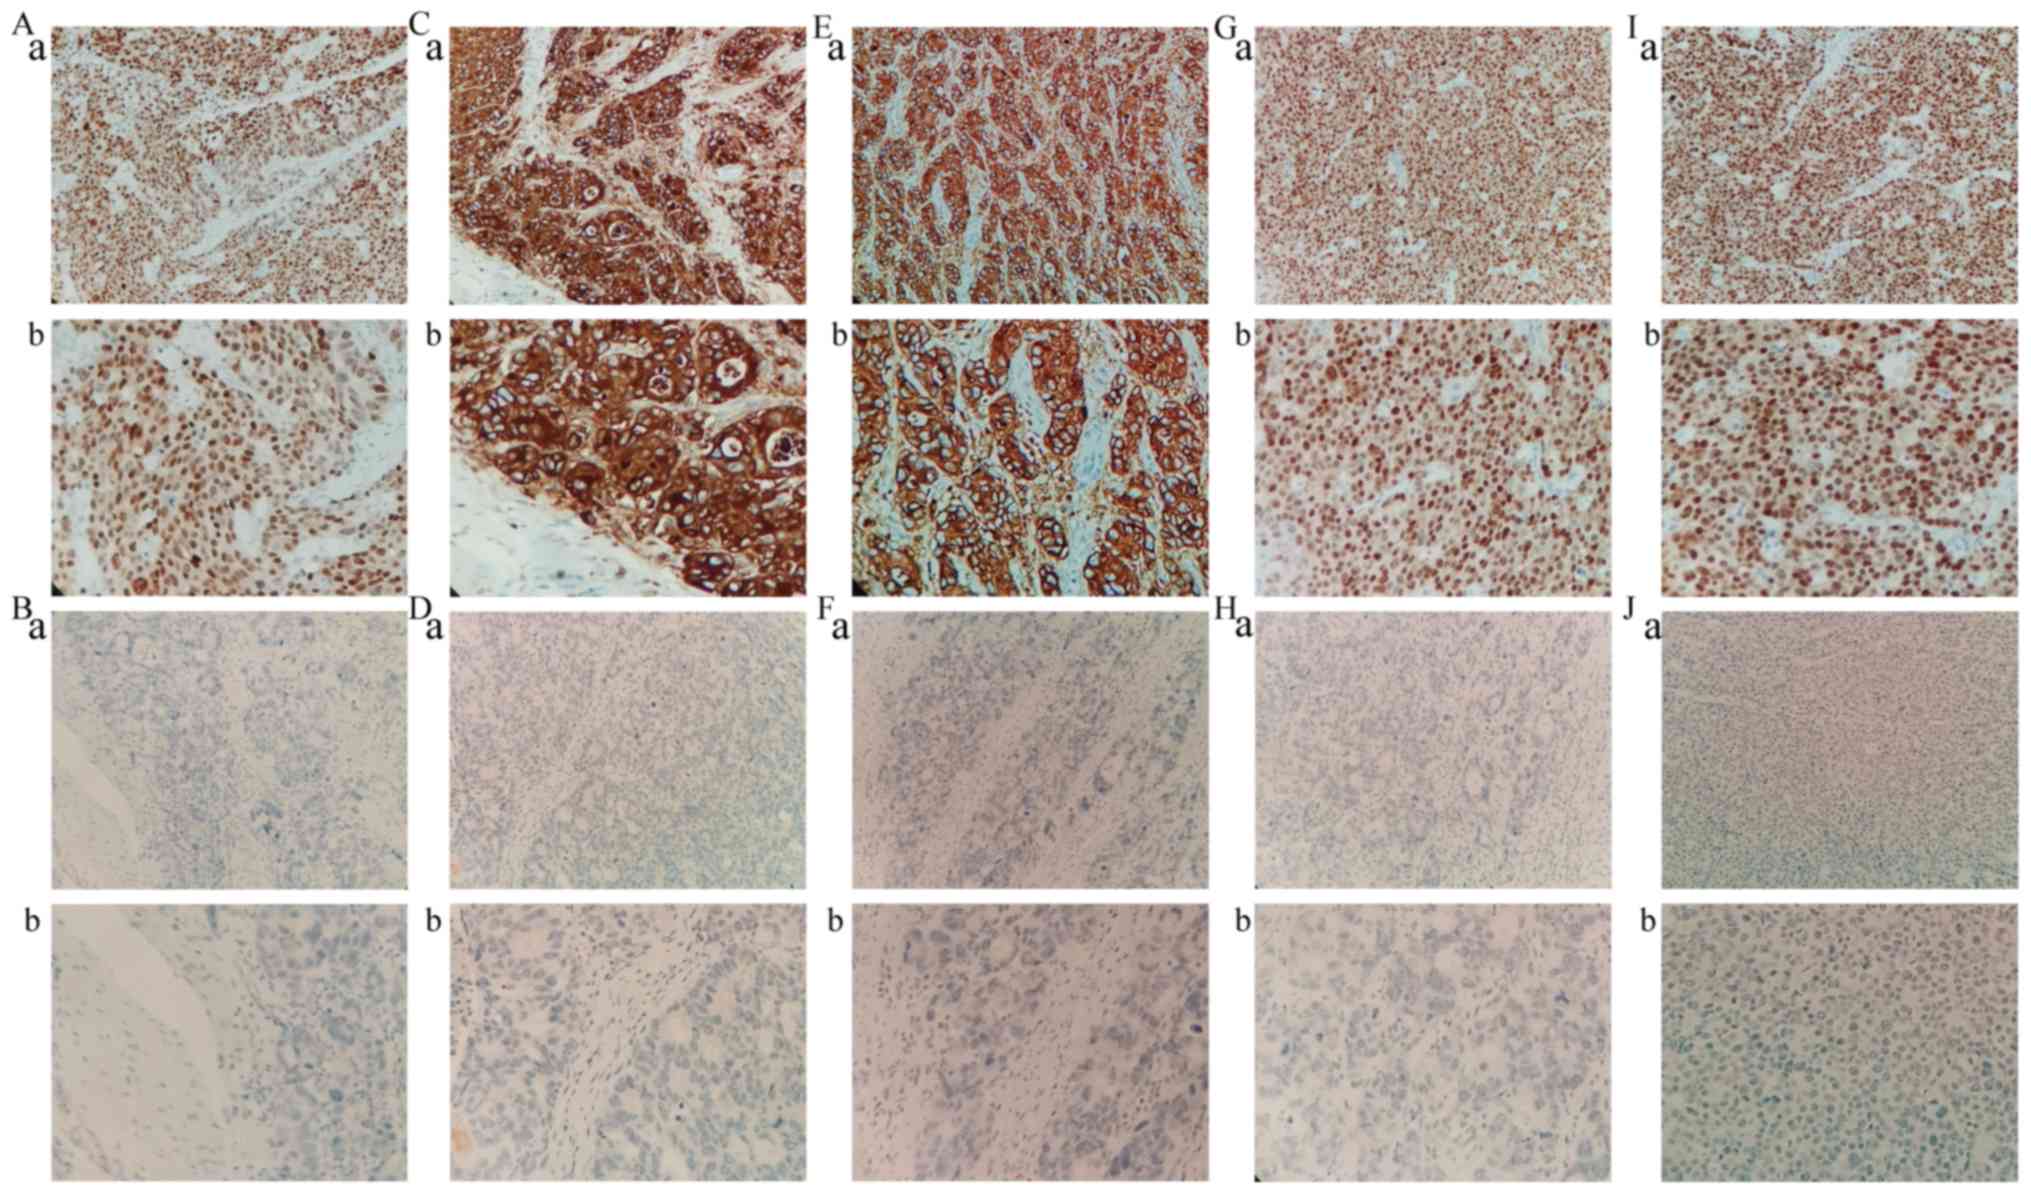
IHC staining revealed that MLH1, MDM2 and P21
proteins were mainly located in the nucleus, whereas E-cadherin and
vimentin proteins were mainly expressed in the cellular cytoplasm
and membrane of tumor cells (Fig.
4). The expression of MLH1, MDM2, P21, E-cadherin and vimentin,
as well as the clinicopathological characteristics of patients, are
shown in Table III. MLH1 and
MDM2 proteins were significantly associated with age (P<0.05).
E-cadherin and vimentin proteins were significantly associated with
tumor location (P<0.05). Table
IV shows the ACRG molecular subtypes and their
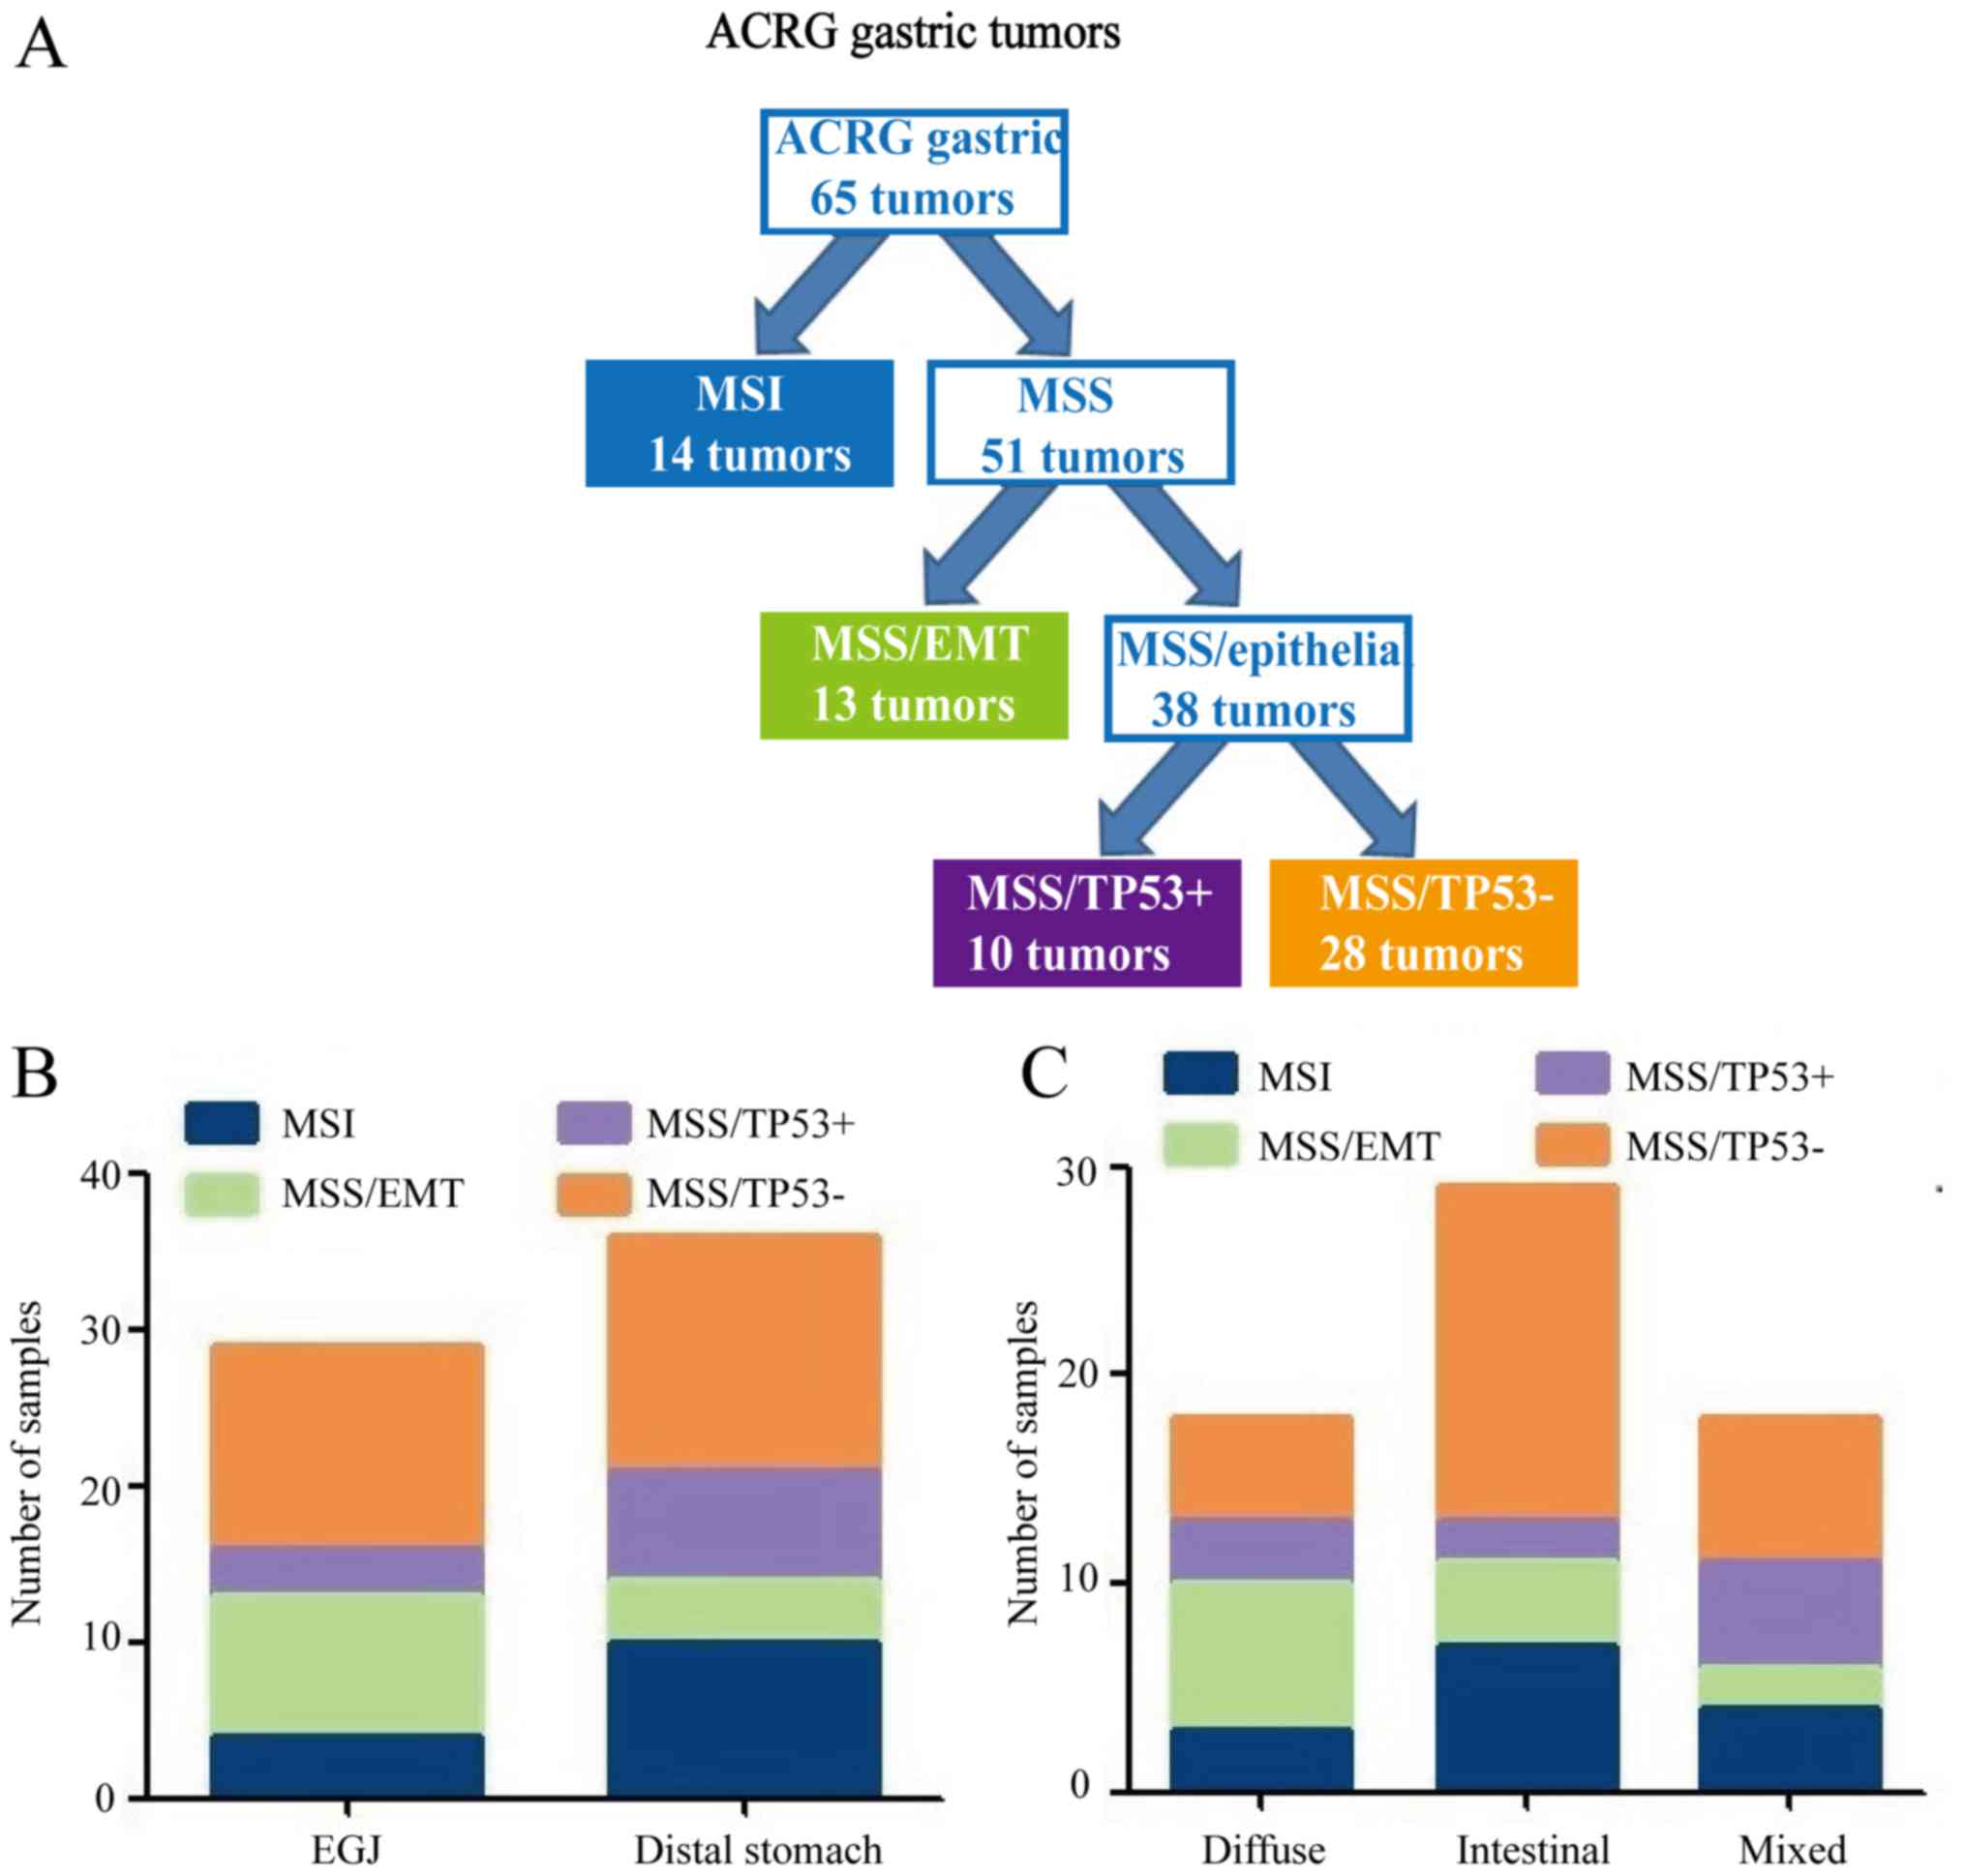
clinicopathological features. Among the 65 GC cases, 14 (21.5%)
were MSI subtype, 13 (20.0%) were MSS/EMT subtype, 10 (15.4%) were
MSS/TP53+ subtype and 28 (43.1%) were
MSS/TP53− subtype (Fig.
5A). MSS/TP53+ tumors showed low frequency in
gastro-esophageal junction (EGJ) (10.3%), whereas the majority of
MSS/TP53− tumors were present in the distal stomach
(41.7%) (Fig. 5B). Patients with
MSS/EMT GC tended to be of diffuse type (53.8%), while patients
with MSS/TP53− GC were of intestinal type (57.1%;
Fig. 5C). There were no obvious
differences in gender, age, tumor location, Lauren classification
or type of postoperative adjuvant therapy received by patients with
GC in the four TCGA subtypes (P>0.05; Table IV).
| Table III.MLH, E-cadherin, Vimentin, MDM2 and
P21 status in relation to clinicopathological variables. |
Table III.
MLH, E-cadherin, Vimentin, MDM2 and
P21 status in relation to clinicopathological variables.
|
| MLH, n (%) |
| E-cadherin, n
(%) |
| Vimentin, n
(%) |
| MDM2, n (%) |
| P21, n (%) |
|
|---|
|
|
|
|
|
|
|
|
|
|
|
|
|---|
| Clinicopathological
factors | Positive | Negative | P-value | Positive | Negative | P-value | Positive | Negative | P-value | Positive | Negative | P-value | Positive | Negative | P-value |
|---|
| Sex |
|
| 0.341 |
|
| 0.478 |
|
| 0.178 |
|
| 0.368 |
|
| 0.870 |
|
Male | 36 (55.4) | 8
(12.3) |
| 21 (32.3) | 23 (35.4) |
| 26 (40.0) | 18 (27.7) |
| 22 (33.8) | 22 (33.8) |
| 24 (36.9) | 20 (30.8) |
|
|
Female | 15 (23.1) | 6 (9.2) |
| 12 (18.5) | 9
(13.8) |
| 16 (24.6) | 5 (7.7) |
| 13 (20.0) | 8
(12.3) |
| 11 (16.9) | 10 (15.4) |
|
| Age/year |
|
| 0.045 |
|
| 0.714 |
|
| 0.987 |
|
| 0.019 |
|
| 0.180 |
|
≤60 | 30 (46.2) | 4 (6.2) |
| 18 (27.7) | 16 (24.6) |
| 22 (33.8) | 12 (18.5) |
| 23 (35.4) | 11 (16.9) |
| 21 (32.3) | 13 (20.0) |
|
|
>60 | 21 (32.3) | 10 (15.4) |
| 15 (23.1) | 16 (24.6) |
| 20 (30.8) | 11 (16.9) |
| 12 (18.5) | 19 (29.2) |
| 14 (21.5) | 17 (26.2) |
|
| Tumor location |
|
| 0.091 |
|
| 0.004 |
|
| 0.013 |
|
| 0.061 |
|
| 0.070 |
|
EGJ | 25 (38.5) | 4 (6.2) |
| 9
(13.8) | 20 (30.6) |
| 14 (21.5) | 15 (23.1) |
| 14 (22.2) | 19 (29.2) |
| 12 (18.5) | 17 (26.2) |
|
| Distal
stomach | 26 (40.0) | 10 (15.4) |
| 24 (36.9) | 12 (18.5) |
| 28 (43.1) | 8
(12.3) |
| 21 (32.3) | 11 (16.9) |
| 23 (35.4) | 13 (20.0) |
|
| Lauren
classification |
|
| 0.069 |
|
| 0.376 |
|
| 0.631 |
|
| 0.184 |
|
| 0.682 |
|
Diffuse | 26 (40.0) | 3 (4.6) |
| 12 (18.5) | 17 (19.4) |
| 20 (30.8) | 9
(13.8) |
| 12 (18.5) | 17 (26.2) |
| 14 (38.9) | 15 (23.1) |
|
|
Intestinal | 11 (21.5) | 7
(10.8) |
| 10 (15.4) | 8
(12.3) |
| 12 (18.5) | 6 (9.2) |
| 11 (16.9) | 7
(10.8) |
| 10 (15.4) | 8
(12.3) |
|
|
Mixed | 14 (21.5) | 4 (6.2) |
| 11 (16.9) | 7
(10.8) |
| 10 (15.4) | 8
(12.3) |
| 12 (18.5) | 6 (9.2) |
| 11 (16.9) | 7
(10.8) |
|
| Adjuvant
therapy |
|
| 0.948 |
|
| 0.062 |
|
| 0.492 |
|
| 0.181 |
|
| 0.267 |
|
XELOX | 26 (40.0) | 7
(10.8) |
| 13 (20.0) | 20 (30.8) |
| 20 (30.8) | 13 (20.0) |
| 22 (33.8) | 11 (16.9) |
| 20 (30.8) | 13 (20.0) |
|
|
SOX | 25 (38.5) | 7
(10.8) |
| 20 (30.8) | 12 (18.5) |
| 22 (33.8) | 10 (15.4) |
| 26 (40.0) | 6 (9.2) |
| 15 (23.1) | 17 (26.2) |
|
| Table IV.Asian Cancer Research Group molecular
subtypes and characteristics of gastric cancer patients. |
Table IV.
Asian Cancer Research Group molecular
subtypes and characteristics of gastric cancer patients.
| Clinicopathological
factors | MSI, n (%) | MSS/EMT, n (%) |
MSS/TP53+, n (%) |
MSS/TP53−, n (%) | P-value |
|---|
| Sex |
|
|
|
| 0.818 |
|
Male | 8
(12.3) | 9
(13.8) | 7
(10.8) | 20 (30.8) |
|
|
Female | 6 (9.2) | 4 (6.2) | 3 (4.6) | 8
(12.3) |
|
| Age/year |
|
|
|
| 0.066 |
|
≤60 | 4 (6.2) | 10 (15.4) | 4 (6.2) | 16 (24.6) |
|
|
>60 | 10 (15.4) | 3 (4.6) | 6 (9.2) | 12 (18.5) |
|
| Tumor location |
|
|
|
| 0.136 |
|
EGJ | 4 (6.2) | 9
(13.8) | 3 (4.6) | 13 (20.0) |
|
| Distal
stomach | 10 (15.4) | 4 (6.2) | 7
(10.8) | 15 (23.1) |
|
| Lauren
classification |
|
|
|
| 0.125 |
|
Diffuse | 3 (4.6) | 7
(10.8) | 3 (4.6) | 5 (7.7) |
|
|
Intestinal | 7
(10.8) | 4 (6.2) | 2 (3.1) | 16 (24.6) |
|
|
Mixed | 4 (6.2) | 2 (3.1) | 5 (7.7) | 7
(10.8) |
|
| Adjuvant
therapy |
|
|
|
| 0.996 |
|
XELOX | 7
(10.8) | 7
(10.8) | 5 (7.7) | 14 (21.5) |
|
|
SOX | 7
(10.8) | 6 (9.2) | 5 (7.7) | 14 (21.5) |
|
TCGA and ACRG molecular subtypes of GC
are associated with OS
The median follow-up time was 31 months (range, 6–69
months) and the median survival time was 31 months. Kaplan-Meier
plots revealed that the patients with diffuse type, GS molecular
subtype, MSS/EMT subtype and those who accepted XELOX adjuvant
chemotherapy had the worst outcome (Fig. 6A-D). The OS of four ACRG subtypes
was further analyzed. MSI subtype vs. MSS/EMT subtype demonstrated
an obviously different prognosis (P<0.001), as did MSS/EMT
subtype vs. MSS/TP53− subtype (P<0.001). The MSS/EMT
subtype had the worst prognosis, followed by MSS/TP53−,
MSS/TP53+ and MSI. The EBV+ subtype exhibited
an obvious different prognosis vs. the GS subtype (P=0.032), while
there was no obvious difference in prognosis between the
EBV+ and CIN subtypes (P=0.088). The EBV+
subtype had the best prognosis, followed by MSI, CIN and GS.
Univariate analysis revealed that only ARCG molecular subtype
(P=0.045), Lauren classification (P=0.001) and adjuvant therapy
(P=0.013) were associated with the OS of GC. These three indicators
were considered in the regression model for multivariate analysis,
which revealed that ARCG molecular subtype (P=0.010) and Lauren
classification (P=0.011) were associated with the OS of GC
(Table V). These results revealed
that Lauren classification and ARCG subtype are independent
prognostic predictors for GC.
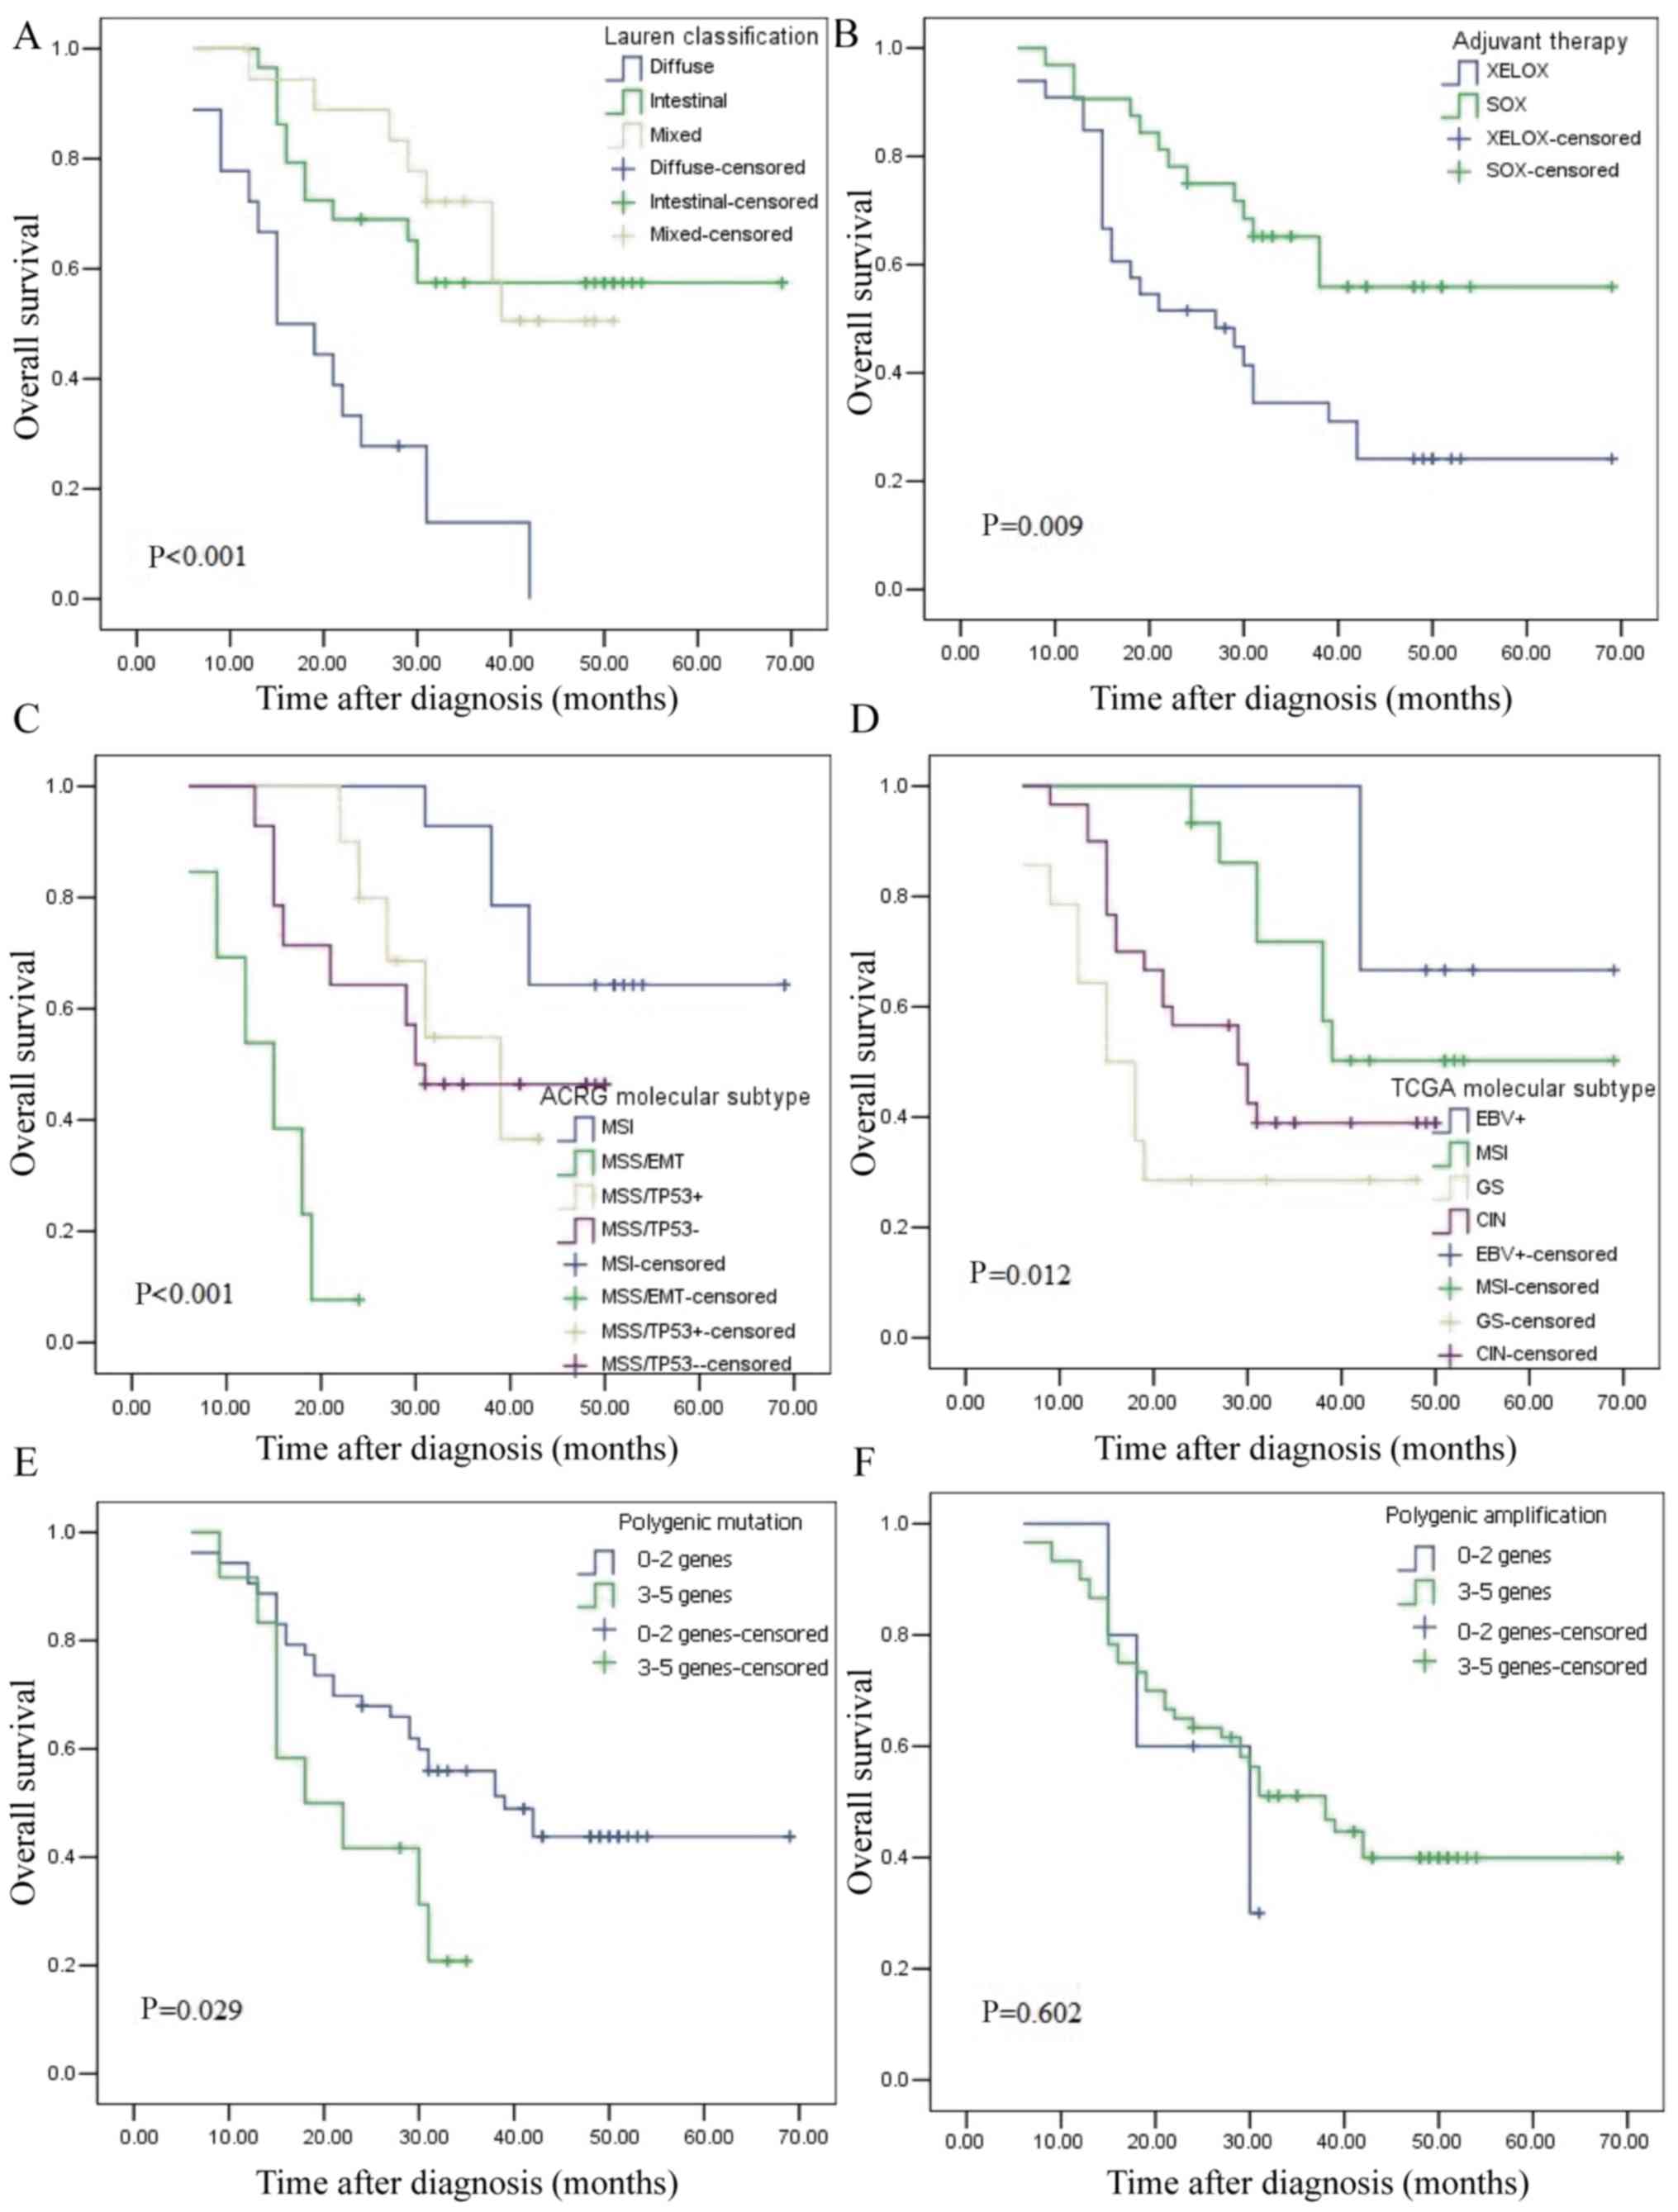 | Figure 6.Kaplan-Meier curves for the overall
survival of 65 patients with gastric cancer. (A) Lauren
classification, (B) postoperative adjuvant chemotherapy, (C) ACRG
molecular subtypes, (D) TCGA molecular subtypes, (E) Polygenic
mutation and (F) Polygenic amplification. XELOX, capecitabine
combined with oxaliplatin; SOX, S1 combined with oxaliplatin; MSI,
microsatellite instability; MSS, microsatellite stable; EMT,
epithelial-mesenchymal transition; TP53, tumor protein 53; EBV,
Epstein-Barr virus; MSI, microsatellite instability; GS, gene
stable; CIN, chromosome instability. |
| Table V.Univariate analysis and multivariate
analysis of prognostic factors in gastric cancer for overall
survival. |
Table V.
Univariate analysis and multivariate
analysis of prognostic factors in gastric cancer for overall
survival.
|
| Univariate
analysis | Multivariate
analysis |
|---|
|
|
|
|
|---|
| Variable | HR | P-value | 95% CI | HR | P-value | 95% CI |
|---|
| TCGA molecular
subtype | 1.070 | 0.600 | 0.832–1.376 |
|
|
|
|
EBV+ vs. MSI vs. GS
vs. CIN |
|
|
|
|
|
|
| ACRG molecular
subtype | 1.381 | 0.045 | 1.007–1.894 | 1.514 | 0.010 | 1.106–2.073 |
| MSI vs.
MSS/EMT vs. MSS/TP53+ vs. MSS/TP53− |
|
|
|
|
|
|
| Sex | 1.267 | 0.512 | 0.626–2.564 |
|
|
|
| Male
vs. Female |
|
|
|
|
|
|
| Age (years) | 1.142 | 0.688 | 0.598–2.179 |
|
|
|
| ≤60 vs.
>60 |
|
|
|
|
|
|
| Tumor location | 1.417 | 0.290 | 0.743–2.705 |
|
|
|
| EGJ vs.
Distal stomach |
|
|
|
|
|
|
| Lauren
classification | 4.424 | 0.001 |
1.884–10.388 | 3.321 | 0.011 | 1.311–8.414 |
|
Intestinal vs. Diffuse vs.
Mixed |
|
|
|
|
|
|
| Adjuvant
therapy | 2.373 | 0.013 | 1.204–4.676 | 2.002 | 0.068 | 0.950–4.219 |
| XELOX
vs. SOX |
|
|
|
|
|
|
The association between abnormal genes and prognosis
was further analyzed. Kaplan-Meier plots revealed that patients
with polygenic mutation had a worse outcome (Fig. 6E). Univariate and multivariate
analyses (Tables VI and VII) revealed that patients with
TP53 mutation (hazard ratio = 4.193, 95% confidence interval
= 1.260–13.945) had a poor survival time. These results indicated
that TP53 mutation is an independent prognostic predictor
for GC.
| Table VI.Univariate analysis and multivariate
analysis of mutant genes in gastric cancer for overall
survival. |
Table VI.
Univariate analysis and multivariate
analysis of mutant genes in gastric cancer for overall
survival.
|
| Univariate
analysis | Multivariate
analysis |
|---|
|
|
|
|
|---|
| Variable | HR | P-value | 95% CI | HR | P-value | 95% CI |
|---|
| TP53 | 4.797 | 0.010 |
1.465–15.707 | 4.193 | 0.019 | 1.260–13.945 |
| Normal
vs. abnormal |
|
|
|
|
|
|
| APC | 1.180 | 0.655 | 0.571–2440 |
|
|
|
| Normal
vs. abnormal |
|
|
|
|
|
|
| ARID1A | 1.516 | 0.262 |
0.733–3.135 |
|
|
|
| Normal
vs. abnormal |
|
|
|
|
|
|
| PLK3CA | 2.768 | 0.010 |
1.274–6.013 | 2.114 | 0.061 | 0.966–4.626 |
| Normal
vs. abnormal |
|
|
|
|
|
|
| ERBB3 | 1.269 | 0.596 |
0.526–3.060 |
|
|
|
| Normal
vs. abnormal |
|
|
|
|
|
|
| Table VII.Univariate analysis and multivariate
analysis of amplified genes in gastric cancer for overall
survival. |
Table VII.
Univariate analysis and multivariate
analysis of amplified genes in gastric cancer for overall
survival.
|
| Univariate
analysis | Multivariate
analysis |
|---|
|
|
|
|
|---|
| Variable | HR | P-value | 95% CI | HR | P-value | 95% CI |
|---|
| CCNE1 | 2.190 | 0.035 | 1.058–4.535 | 1.891 | 0.101 | 0.883–4.054 |
| Normal
vs. abnormal |
|
|
|
|
|
|
| MYC | 1.468 | 0.472 | 0.515–4.186 |
|
|
|
| Normal
vs. abnormal |
|
|
|
|
|
|
| CDK6 | 3.996 | 0.013 | 1.333–11.983 |
|
|
|
| Normal
vs. abnormal |
|
|
|
|
|
|
| EGFR | 21.235 | 0.475 | 0.005–92105.54 | 3.071 | 0.054 | 0.983–9.593 |
| Normal
vs. abnormal |
|
|
|
|
|
|
| KRAS | 2.279 | 0.260 | 0.544–9.550 |
|
|
|
| Normal
vs. abnormal |
|
|
|
|
|
|
Discussion
The present study used NGS technology and IHC
staining for comprehensive analyses of GC and classified them
according to different classification criteria. It also evaluated
the association between GC molecular classifications,
clinicopathological features and prognosis. The results revealed
that Lauren classification, adjuvant therapy, ARCG molecular
subtype, TCGA molecular subtype and polygenic mutation were
associated with poor prognosis of patients with GC. Furthermore, it
was observed that ACRG classification of GC could evaluate
prognosis more accurately than TCGA classification.
In total, 6 cases (9.2%) were EBV+ type
out of 65 GC specimens and patients with EBV+ type had
the best overall prognosis in the present study. This is consistent
with previous studies reporting that the EBV+ type of GC
accounted for ~9% (5). A previous
study suggested that, in contrast to EBV− GC, the
EBV+ type of GC has a better prognosis (12). This may depend on the immune
response to EBV infection in humans. According to TCGA reports
(5), programmed death 1 is
frequently amplified in the EBV+ type of GC, suggesting
the high immunogenicity of this type. In the present study, the MSI
type accounted for ~21.5% of all GC cases, was diagnosed at
relatively older ages and was more common in females. Previous
studies have shown that the majority of patients with MSI type
exhibited intestinal-type GC predominantly located in the distal
stomach; the majority of these patients were female and displayed
an association with age (5,13,14).
In the present study, sequencing revealed that the mutation rate of
ARID1A and CDH1 were 21.5 and 3.1%, respectively.
According to previous TCGA reports (5), the GS type is mainly characterized by
somatic gene mutations, including CDH1 and ARID1A.
Unlike those TCGA reports, the mutation rate of CDH1 is
lower in GS typing based on Chinese populations. Due to the limited
number of mutations, the association between CDH1 mutations
and prognosis had not been studied. However, Li et al
(15) reported that patients with
GC and CDH1 mutation had worse outcomes. According to the
results of the present study, ARID1A mutation showed poor
prognosis, which was consistent with Ashizawa et al
(16). Silencing the expression of
the ARID1A gene in GC cells could increase cell
proliferation (17). These results
suggested that the ARID1A gene could inhibit the
proliferation of cancer cells, thus acting as a tumor-suppressor
gene. The clinical value of the ARID1A gene should be
further evaluated. CIN-subtype tumors accounted for 46.2% of 65
patients with GC, which occurred mainly at EGJ. This is similar to
the results of Lim et al (18). In the present study, the abnormal
amplification rate of EGFR in the CIN type of GC was 3.1%,
which was lower than that described in previous TCGA reports.
EGFR plays a crucial role in the occurrence and development
of GC. A previous study demonstrated that the EGFR gene was
overexpressed in 32.7% of the samples and EGFR amplification
occurred in 14.1% of the samples (19). The study also showed that
EGFR gene amplification was associated with the invasive
ability of tumors (19). Its
conclusions are basically the same as TCGA typing based on European
populations in terms of proportion and clinical characteristics,
but there are differences in gene amplification and gene
mutation.
The MSI subtype has the best OS and lowest
recurrence rate of all ACRG subtypes. Similar results were reported
in the ACRG cohort (6). In the
present study, low expression of CDH1 was defined as MSS/EMT type.
The MSS/EMT type accounted for 20.0% of GC and its prognosis was
the worst. These results are consistent with the clinical features
of the MSS/EMT type in the ACRG cohort (6). Notably, MSS/EMT patients tended to be
of diffuse type based on the Chinese population. Analysis of NGS
and IHC revealed that there was no association between CDH1 and
intestinal GC (20). This may be
due to ethnic differences. In the present study, the mutation rate
of TP53 was as high as 80.06% and TP53 mutation was
an independent prognostic factor for GC. A number of studies have
reported that TP53 is the most common mutant gene based on
NGS and molecular profiling and contributes to the genesis and
development of GC tumors (5,6,20).
The median OS of MSS/TP53+ was 29.5 months, which was
slightly shorter than that of MSS/TP53−, with a median
OS of 30.5 months. Similarly, the MSS/TP53+ type had a
better outcome in the ACRG cohort vs. the MSS/TP53− type
(6). Compared with TCGA typing,
ARCG typing could better predict prognosis and was an independent
prognostic factor for patients with GC. In the present study, the
MSS/TP53− type was the most common (43.1%), followed by
the MSI type (21.5%). In the ACRG cohort, the MSS/TP53−
type was the most common subtype (43.75%), followed by the
MSS/TP53− type (28.13%). The clinicopathological
characteristics were not significantly correlated with the
molecular typing of ACRG. In the ACRG cohort study, GC molecular
subtype is significantly correlated with clinicopathological
characteristics (6). These
differences may be the result of a small sample size or individual
differences. Recurrence is significantly associated with ACRG
classification (21). Due to the
lack of recurrence information, these analyses have not been
performed in the present study although its results suggest that
IHC can be used to replace NGS for ACRG typing of patients with GC.
There were several differences in clinical characteristics and
proportions between the present study and the ACRG cohort based on
Japanese and Korean populations.
The number of cases collected in the present study
is relatively small and the sample size needs to be expanded for
further evaluation. Clinical case information needs to be further
improved. In future studies, detailed stratified design based on
EGFR amplification should be performed to evaluate the
clinical efficacy of anti-EGFR gene drugs in patients with
GC.
In conclusion, the molecular classification of ACRG
can be classified by IHC and TCGA classification based on Chinese
populations is basically the same as TCGA typing based on European
populations in regard to proportion and clinical characteristics,
but there are differences in gene amplification and gene
mutation.
Supplementary Material
Supporting Data
Acknowledgements
Not applicable.
Funding
The present study was supported by Hebei Science and
Technology Subject Fund (grant no. 17397706D awarded to QZ) and the
Excellent Clinial Medical Talents Training Program of Hebei
Province (grant no.2019-139).
Availability of data and materials
TCGA datasets generated and/or analyzed during the
current study are available in the NCBI database, https://www.ncbi.nlm.nih.gov/sra/PRJNA587325. The
datasets used and/or analyzed during the current study are
available from the corresponding author on reasonable request.
Authors' contributions
QW and QX performed the experiments. YL, HG, YR and
JL analyzed the data. QW and QZ designed the experiments and
drafted the manuscript. All authors read and approved the final
manuscript.
Ethics approval and consent to
participate
The present study was approved by the Medical Ethics
Committee of The Fourth Hospital of Hebei Medical University and
all patients provided informed consent.
Patient consent for publication
Not applicable.
Competing interests
The authors declare that they have no competing
interests.
References
|
1
|
Bray F, Ferlay J, Soerjomataram I, Siegel
RL, Torre LA and Jemal A: Global cancer statistics 2018: GLOBOCAN
estimates of incidence and mortality worldwide for 36 cancers in
185 countries. CA Cancer J Clin. 68:394–424. 2018. View Article : Google Scholar : PubMed/NCBI
|
|
2
|
Chen W, Zheng R, Baade PD, Zhang S, Zeng
H, Bray F, Jemal A, Yu XQ and He J: Cancer statistics in China,
2015. CA Cancer J Clin. 66:115–132. 2016. View Article : Google Scholar : PubMed/NCBI
|
|
3
|
Lee HS, Cho SB, Lee HE, Kim MA, Kim JH,
Park DJ, Kim JH, Yang HK, Lee BL and Kim WH: Protein expression
profiling and molecular classification of gastric cancer by the
tissue array method. Clin Cancer Res. 13:4154–4163. 2007.
View Article : Google Scholar : PubMed/NCBI
|
|
4
|
Shabani Azim F, Houri H, Ghalavand Z and
Nikmanesh B: Next generation sequencing in clinical oncology:
Applications, challenges and promises: A review article. Iran J
Public Health. 47:1453–1457. 2018.PubMed/NCBI
|
|
5
|
Cancer Genome Atlas Research Network, .
Comprehensive molecular characterization of gastric adenocarcinoma.
Nature. 513:202–209. 2014. View Article : Google Scholar : PubMed/NCBI
|
|
6
|
Cristescu R, Lee J, Nebozhyn M, Kim KM,
Ting JC, Wong SS, Liu J, Yue YG, Wang J, Yu K, et al: Molecular
analysis of gastric cancer identifies subtypes associated with
distinct clinical outcomes. Nat Med. 21:449–456. 2015. View Article : Google Scholar : PubMed/NCBI
|
|
7
|
Zou L, Wu Y, Ma K, Fan Y, Dong D, Geng N
and Li E: Molecular classification of esophagogastric junction
carcinoma correlated with prognosis. Onco Targets Ther.
10:4765–4772. 2017. View Article : Google Scholar : PubMed/NCBI
|
|
8
|
Robinson JT, Thorvaldsdóttir H, Wenger AM,
Zehir A and Mesirov JP: Variant Review with the integrative
genomics viewer. Cancer Res. 77:e31–e34. 2017. View Article : Google Scholar : PubMed/NCBI
|
|
9
|
Sinicrope FA, Ruan SB, Cleary KR, Stephens
LC, Lee JJ and Levin B: bcl-2 and p53 oncoprotein expression during
colorectal tumorigenesis. Cancer Res. 55:237–241. 1995.PubMed/NCBI
|
|
10
|
Thibodeau SN, French AJ, Roche PC,
Cunningham JM, Tester DJ, Lindor NM, Moslein G, Baker SM, Liskay
RM, Burgart LJ, et al: Altered expression of hMSH2 and hMLH1 in
tumors with microsatellite instability and genetic alterations in
mismatch repair genes. Cancer Res. 56:4836–4840. 1996.PubMed/NCBI
|
|
11
|
Thibodeau SN, French AJ, Cunningham JM,
Tester D, Burgart LJ, Roche PC, McDonnell SK, Schaid DJ, Vockley
CW, Michels VV, et al: Microsatellite instability in colorectal
cancer: Different mutator phenotypes and the principal involvement
of hMLH1. Cancer Res. 58:1713–1718. 1998.PubMed/NCBI
|
|
12
|
Kim SY, Park C, Kim HJ, Park J, Hwang J,
Kim JI, Choi MG, Kim S, Kim KM and Kang MS: Deregulation of immune
response genes in patients with Epstein-Barr virus-associated
gastric cancer and outcomes. Gastroenterology. 148:137–147.e9.
2015. View Article : Google Scholar : PubMed/NCBI
|
|
13
|
Martinez-Ciarpaglini C,
Fleitas-Kanonnikoff T, Gambardella V, Llorca M, Mongort C, Mengual
R, Nieto G, Navarro L, Huerta M, Rosello S, et al: Assessing
molecular subtypes of gastric cancer: Microsatellite unstable and
Epstein-Barr virus subtypes. Methods for detection and clinical and
pathological implications. ESMO Open. 4:e0004702019. View Article : Google Scholar : PubMed/NCBI
|
|
14
|
Velho S, Fernandes MS, Leite M, Figueiredo
C and Seruca R: Causes and consequences of microsatellite
instability in gastric carcinogenesis. World J Gastroenterol.
20:16433–16442. 2014. View Article : Google Scholar : PubMed/NCBI
|
|
15
|
Li X, Wu WK, Xing R, Wong SH, Liu Y, Fang
X, Zhang Y, Wang M, Wang J, Li L, et al: Distinct subtypes of
gastric cancer defined by molecular characterization include novel
mutational signatures with prognostic capability. Cancer Res.
76:1724–1732. 2016. View Article : Google Scholar : PubMed/NCBI
|
|
16
|
Ashizawa M, Saito M, Min AKT, Ujiie D,
Saito K, Sato T, Kikuchi T, Okayama H, Fujita S, Endo H, et al:
Prognostic role of ARID1A negative expression in gastric cancer.
Sci Rep. 9:67692019. View Article : Google Scholar : PubMed/NCBI
|
|
17
|
Hetmanski JHR, Schwartz JM and Caswell PT:
Rationalizing Rac1 and Rho AGTPase signaling: A mathematical
approach. Small GTPase. 9:224–229. 2018. View Article : Google Scholar
|
|
18
|
Lim B, Kim JH, Kim M and Kim SY: Genomic
and epigenomic heterogeneity in molecular subtypes of gastric
cancer. World J Gastroenterol. 22:1190–1201. 2016. View Article : Google Scholar : PubMed/NCBI
|
|
19
|
Birkman EM, Ålgars A, Lintunen M,
Ristamäki R, Sundström J and Carpén O: EGFR gene amplification is
relatively common and associates with outcome in intestinal
adenocarcinoma of the stomach, gastro-oesophageal junction and
distal oesophagus. BMC Cancer. 16:4062016. View Article : Google Scholar : PubMed/NCBI
|
|
20
|
Bria E, Pilotto S, Simbolo M, Fassan M, de
Manzoni G, Carbognin L, Sperduti I, Brunelli M, Cataldo I,
Tomezzoli A, et al: Comprehensive molecular portrait using next
generation sequencing of resected intestinal-type gastric cancer
patients dichotomized according to prognosis. Sci Rep. 6:229822016.
View Article : Google Scholar : PubMed/NCBI
|
|
21
|
Wang Q, Liu G and Hu C: Molecular
classification of gastric adenocarcinoma. Gastroenterology Res.
12:275–282. 2019. View Article : Google Scholar : PubMed/NCBI
|