Introduction
Type 2 diabetes mellitus (T2DM) is a metabolic
disease with a complex etiology in which patients show a
chronically high blood sugar level (1). A previous study demonstrated that the
number of adults with diabetes worldwide was ~425,000,000 in 2015
(1). The incidence rate is
predicted to reach 629,000,000 by 2040 (1). The pathogenesis of T2DM is complex,
with it primarily being caused by decreased insulin secretion from
pancreatic islet β cells following the development of insulin
resistance (IR) in target organs and tissues (primarily the liver,
muscle and fat) (2). As a key site
of glycogen metabolism in the human body, the liver is also the
primary organ of gluconeogenesis. It can regulate the
insulin-inhibiting and glucagon-stimulated hepatic gluconeogenesis
pathway, as well as maintain the body's blood sugar within normal
levels. IR can lead to relative or absolute deficiency of insulin;
additionally, unrestricted gluconeogenesis leads to prolonged
hyperglycemia and eventually diabetes (3). Therefore, decreasing hepatic glucose
production and hepatic insulin resistance may be useful for
treating T2DM.
Resveratrol (RSV) is a natural polyphenolic compound
mainly derived from red grapes, blueberries, mulberries, peanuts
and other plants (4). This
compound has numerous pharmacological activities, can protect the
cardiovascular and nervous systems, and exerts antitumor,
anti-inflammatory and immunoregulatory effects (5). In the past decade, studies have
demonstrated that RSV can activate insulin signaling pathways to
improve the effects of IR and protect pancreatic islet β cells
(6,7). RSV can also play a beneficial role in
improving insulin sensitivity including histone deacetylase 4 and
decreasing liver endoplasmic reticulum stress (8,9).
Resveratrol promotes the translocation of histone deacetylase 4
from the nucleus to the cytoplasm, and histone deacetylase 4 may be
an agonist of resveratrol (9).
Long non-coding RNAs (lncRNAs) are RNA molecules
>200 nucleotides in length that do not encode proteins. These
molecules are involved in regulating proliferation, differentiation
and apoptosis (10). A previous
study showed that lncRNA plays a role in the development of T2DM
and can be used as a target for the diagnosis and treatment of
diabetes (10). The expression
levels of lncRNA H19 were significantly decreased in the skeletal
muscle of patients with type 2 diabetes and insulin-resistant
animals (11). As both RSV and
lncRNAs are involved in the development of T2DM and improve IR,
there may be an association between these molecules. Little is
currently known about whether lncRNAs are involved in the
RSV-mediated effects of improving IR in the liver. The present
study analyzed the expression level profile of RSV in the liver of
insulin-resistant lncRNAs in mice induced by a high-fat diet (HFD),
and investigated the role of RSV in improving IR via lncRNAs.
Reverse transcription-quantitative (RT-q) PCR was performed to
verify the expression levels of eight lncRNAs, providing a
foundation for the prevention and treatment of diabetes.
Materials and methods
Materials
A total of 36 6-week-old C57BL/6J male mice (21–25
g) were purchased from Beijing Weitong Lihua Experimental Animal
Center [license no. SCXK (Beijing) 2016–0006; Beijing, China] and
housed in the animal laboratory barrier system of Hebei Provincial
People's Hospital (20-25°C, relative humidity 40–60%, 12-h
light/dark cycle and access to food/water provided ad
libitum). Following 1 week of acclimation, the mice were
divided into control (CON; n=12) and HFD groups (n=24) (CON feed
D12450J: 3.85 kcal/g; protein, 20; carbohydrate, 70; fat, 10%; HFD
feed D12492: 5.24 kcal/g; protein, 20; carbohydrate, 20; fat, 60%).
The feed was purchased from Beijing Huafukang Biotechnology Co.,
Ltd. Following 8 weeks of feeding, the rats were injected with an
intraperitoneal glucose tolerance test for 12 h: According to the
body weight of mice, 2 g/kg glucose saline (50% glucose injection:
0.9% sodium chloride solution prepared in a 1:1 ratio) was injected
intraperitoneally at 0, 15, 30, 60 and 120 min. The blood glucose
at the corresponding time point was measured, and the degree of
insulin resistance and the success of establishing the insulin
resistance model were evaluated. The IR model was successfully
established from the HFD group according to calculation of the area
under the curve. A total of 12 mice in the HFD group continued
high-fat feeding, and 12 mice were treated with HFD+RSV. RSV was
dissolved in DMSO (both from Sigma-Aldrich; Merck KGaA), diluted
with 0.9% sodium chloride solution, and administered at 100 mg/kg
per day intragastrically (12).
Next, the remaining two groups of mice were administered 0.1% DMSO
in 0.9% sodium chloride solution for intragastric delivery
intervention. Following 6 weeks of resveratrol treatment, the mice
were fasted for 12 h overnight. A total of three mice were randomly
selected from each group to inject 1.5 IU/40 g of insulin
(Sigma-Aldrich; Merck KGaA) intraperitoneally 20 min before
anesthesia. All mice were sacrificed by cervical dislocation. The
liver was dissected in all mice, and a small piece of the liver was
fixed in 4% paraformaldehyde (4°C for 24 h). The remaining tissue
was frozen in liquid nitrogen and stored at −80°C. These liver
tissues can be maintained for at least 6 months. The experiment was
supervised and approved by the Ethics Committee of the People's
Hospital of Hebei Province (approval no. 201920) and performed in
accordance with the Regulations on the Administration of Laboratory
Animals.
High-throughput sequencing
A total of four segments were selected from each of
the liver samples in the CON group, HFD group and HFD+RSV group for
extraction of total RNA using the RNeasy mini kit (Qiagen GmbH).
The sequencing library was constructed using TruSeq™ RNA (Illumina,
Inc.). The purified cDNA was amplified by removing the ribosomal
RNA, replicating the first-strand cDNA, and synthesizing the
second-strand cDNA to generate the final cDNA library. This was
performed according to the manufacturer's instructions. The insert
size was verified using Qubit® 2.0 (Thermo Fisher
Scientific, Inc.) and Agilent 2100 Bioanalyzer (Agilent
Technologies, Inc.), and molar concentrations were calculated and
then sequenced using a NovaSeq 6000 (Illumina, Inc.). Library
construction and sequencing were performed by Shanghai Sinomics
Corporation. Both lncRNA and mRNA were analyzed using databases;
lncRNA was evaluated using RefSeq, Ensembls and Genebank, and mRNA
was evaluated using Noncode and Ensembls. The high-throughput
sequencing results were uploaded to the Gene Expression Omnibus
database (accession no. GSE137840) (12).
Expression level analysis of lncRNAs
and mRNAs
Fragments of each gene segment were compared using
Stringtie (13) software, and the
fragments per kilobase of million mapped reads (FPKM) value of each
gene was calculated using the trimmed mean of P-value. Differences
in gene expression levels between groups were analyzed using edgeR
(14) software. The P-value
corrected after multiple comparison tests is termed Q-value and
these parameters are used to statistically screen differential
genes. Additionally, the differential expression level fold-change
was calculated according to the FPKM value, and the log2
(fold-change) was calculated for subsequent screening of
differential genes (15).
Reverse transcription-quantitative PCR
(RT-qPCR)
Total RNA was extracted with TRIzol®
reagent (Thermo Fisher Scientific, Inc.) from mice liver tissues,
and the RNA concentration and purity were determined using a
NanoDrop 2000 (Thermo Fisher Scientific, Inc.). RNA was
reverse-transcribed into cDNA using HiScript II Q RT SuperMix for
qPCR (RR047A; Takara Bio, Inc.). Amplification was performed using
the SYBR® Premix Ex TaqTM II kit (RR820A; Takara Bio,
Inc.). PCR was performed using Applied Biosystems 7900 apparatus
(Thermo Fisher Scientific, Inc.) at 95°C for 10 min, followed by 40
cycles for 15 sec at 95°C, 15 sec at 95°C and 15 sec at 60°C. Gene
expression levels were normalized to those of β-actin using the
2−ΔΔCq method (16).
The primer sequences are listed in Table I.
 | Table I.Reverse transcription-quantitative
PCR primers. |
Table I.
Reverse transcription-quantitative
PCR primers.
| Gene | Forward primer,
5′-3′ | Reverse primer,
5′-3′ |
|---|
| β-actin |
GGCGCTTTTGACTCAGGATT |
GGGATGTTTGCTCCAACCAA |
|
NONMMUT119418.1 |
GGTCATTCTAAGGCTGTCTAAGGG |
CTACCCTGTTCCTGTGCATTCC |
|
NONMMUT058999.2 |
AGTCCTCCCTCCTCACCAACCT |
GGCCGCAGGTAAGGGAGATT |
|
NONMMUT068763.2 |
CGCACTTCAGGTTCAGCATCTC |
GACCCGGCTTCATTCATCTTTC |
|
NONMMUT051901.2 |
CTCACTCAGGCCCTGGATCA |
CACCCAGCTTATTCCAGTCCTCT |
|
NONMMUT010559.2 |
ATCAGCAGACCTTCTAAATCGCA |
TGGAGGCTTTACCAGATGTGAG |
|
NONMMUT059852.2 |
GAAATGAGTGAGCCAAAGAAGGG |
ACCTACACGAAGCCATCCAAAA |
|
NONMMUT027048.2 |
CACAGCCAATTCCTCAACTTCTT |
CATAAATGGAGGTTAGTAGGTGGC |
|
NONMMUT001352.2 |
GCAAAGAAATGGGACACTACCTG |
ATGGCTGCATCATATCAGTTGG |
| FOXO1 |
AAGGCCATCGAGAGCTCAGC |
GATTTTCCGCTCTTGCCTCC |
| G6PC |
TTGCATTCCTGTATGGTAGTGG |
TAGGCTGAGGAGGAGAAAACTG |
| SOCS3 |
CTGCTTTGTCTCTCCTATGTGG |
GAATCCCTCAACTCTCTGCCTA |
| PEPCK |
GTGCTGGAGTGGATGTTCGG |
CTGGCTGATTCTCTGTTTCAGG |
Western blotting analysis
Protein was extracted with 1.4% SDS and
concentration was determined using a BCA kit (Thermo Fisher
Scientific, Inc.). SDS-PAGE gels (Beijing Solarbio Technology Co.,
Ltd.) were prepared at different concentrations (8, 10 and 12%).
The amount of protein loaded per lane was ~30–50 µg. The protein
was transferred to a PVDF membrane using electrophoresis and then
blocked with 5% skimmed milk for 3 h at 4°C. After diluting the
primary antibodies (20% Tween TBST dissolved in 5% skimmed milk,
20% Tween TBST dissolved in 5% BSA for phosphorylated proteins),
the membrane was incubated with the antibody at 4°C overnight,
followed by washing three times (10 min each time) with TBST (20%
Tween), incubation with the secondary antibody for ~50 min at room
temperature, and washing three times (10 min each time). Finally,
the protein band was observed with a gel imager (GDS8000; UVP
Products) and the grey value was read using the ImageJ 1.8.0
(National Institutes of Health) software. Standardization was
performed by incubating the antibody with β-actin. The primary
antibodies were as follows: Anti-β-actin (mouse; 1:1,000; cat. no.
3700S; Cell Signaling Technology, Inc.); anti-forkhead box O1
(FOXO1; 1:1,000; cat. no. 18592-1-AP); anti-glucose-6-phosphatase
catalytic subunit (G6PC; 1:2,000; cat. no. 22169-1-AP);
anti-suppressor of cytokine signaling 3 (SOCS3; 1:1,000; cat. no.
14025-1-AP) (all rabbit antibodies from ProteinTech Group, Inc.);
rabbit anti-phosphoenolpyruvate carboxykinase (PEPCK; 1:1,000; cat.
no. 702748; Thermo Fisher Scientific, Inc.); horseradish peroxidase
(HRP)-labelled goat anti-rabbit IgG antibody and goat anti-mouse
IgG antibody (1:8,000; cat. no. L3012-2; and 1:3,000, cat. no.
L3032-2 respectively; both from Signalway Antibody LLC).
Establishment of cell model and
analysis
Mouse liver cancer cells (Hepa) were purchased from
the cell bank of the Chinese Academy of Sciences (Beijing, China).
Hepa cells were cultured in DMEM (Gibco; Thermo Fisher Scientific,
Inc.) supplemented with 10% fetal bovine serum (HyClone; GE
Healthcare Life Sciences), 1% non-essential amino acids (Gibco;
Thermo Fisher Scientific, Inc.) and 1% streptomycin (HyClone; GE
Healthcare Life Sciences). In order to establish the IR model, the
cells were transferred to DMEM with 0.25 mmol L-1 palmitic acid
(PA) upon reaching ~80% confluency (17). The cells were transfected in an
incubator at 37°C for 24 h. The transfection complex 200 Opti-MEM
(Gibco; Thermo Fisher Scientific, Inc.), 5 RNA oligo (Suzhou
Pharmaceutical Technology Co., Ltd) stock solution and 10 µl
siRNA-mate transfection reagent (Suzhou Pharmaceutical Technology
Co., Ltd) was added to the medium at a final concentration of 50 nM
siRNA. The cells were divided into two groups:
siRNA-NONMMUT058999.2 [forward primer, 5′-3′-GGCCUGACUUAAGAGUUAAGU;
reverse primer, 5′-3′-UUAACUCUUAAGUCAGGCCAG; Suzhou Pharmaceutical
Technology Co., Ltd. (negative control, NC) and
siRNA-NONMMUT058999.2 knockdown (knockdown)]. The groups were
treated with 200 µl of transfection complex in 1.8 ml of medium per
well, and the final siRNA concentration was ~50 nM. The cells were
cultured at 37°C for 24 h. Then RNA was extracted and the success
of NONMMUT058999.2 knockdown verified by RT-qPCR. After knockdown
of NONMMUT058999.2, Hepa cells were seeded in 6-well plates, 24 h
after transfection. PA and RSV 30 µM were added to the
corresponding groups (18).
Proteins were extracted for western blotting 40 min following
insulin stimulation.
lncRNA-miRNA-mRNA co-expression
network
Competing endogenous (ce)RNA analysis is based on
the expression value of genes. Using regression model analysis and
seed sequence matching methods, a regulatory network of microRNA
sponge adsorption was established to find the core ceRNAs (19,20).
Statistical analysis
All data were processed using SPSS 21.0 software
(SPSS, Inc.) and the results were expressed as the mean ± standard
deviation (SD). Multiple groups were compared using one-way
analysis of variance (ANOVA) followed by least significant
difference or Tamhane's test. P<0.05 was considered to indicate
a statistically significant difference. For lncRNAs and mRNAs,
significant levels of change were expressed as a Q value <0.05
and log2 (fold-change) ≥1.
Results
Expression level profiles of lncRNAs
and mRNAs
High-throughput sequencing was performed to detect
the expression levels of lncRNAs and mRNAs in the liver samples
from each group. A total of 51,024 lncRNAs and 31,055 mRNAs were
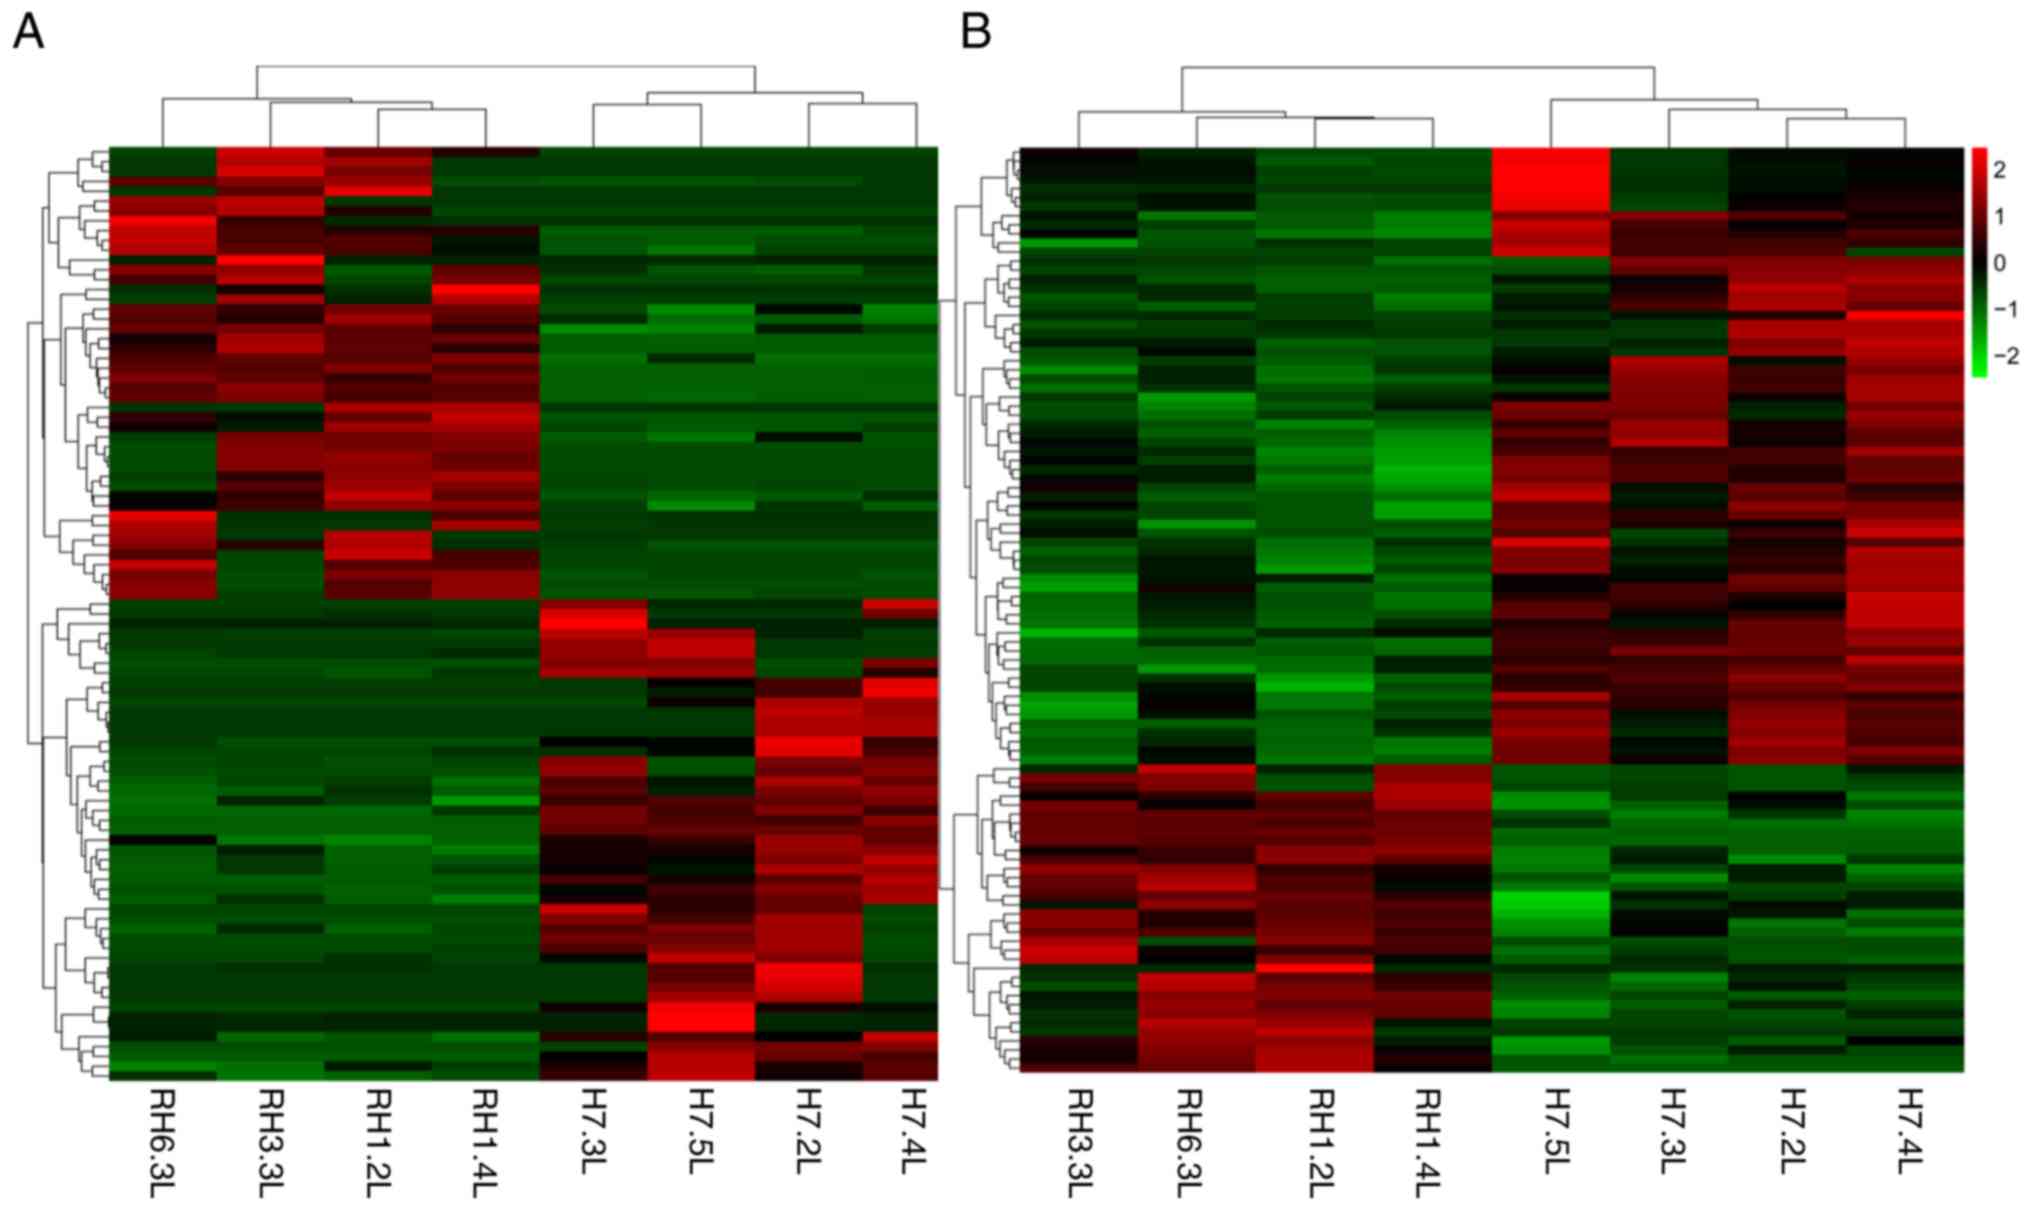
detected. Additionally, 58 differences were detected between the
HFD + RSV and HFD groups. The expressed lncRNAs (28 upregulated and
30 downregulated) and 96 differentially expressed mRNAs (30
upregulated and 66 downregulated) were determined (Tables II and III). The distribution and trend of
differential expression levels of lncRNAs and mRNAs was observed
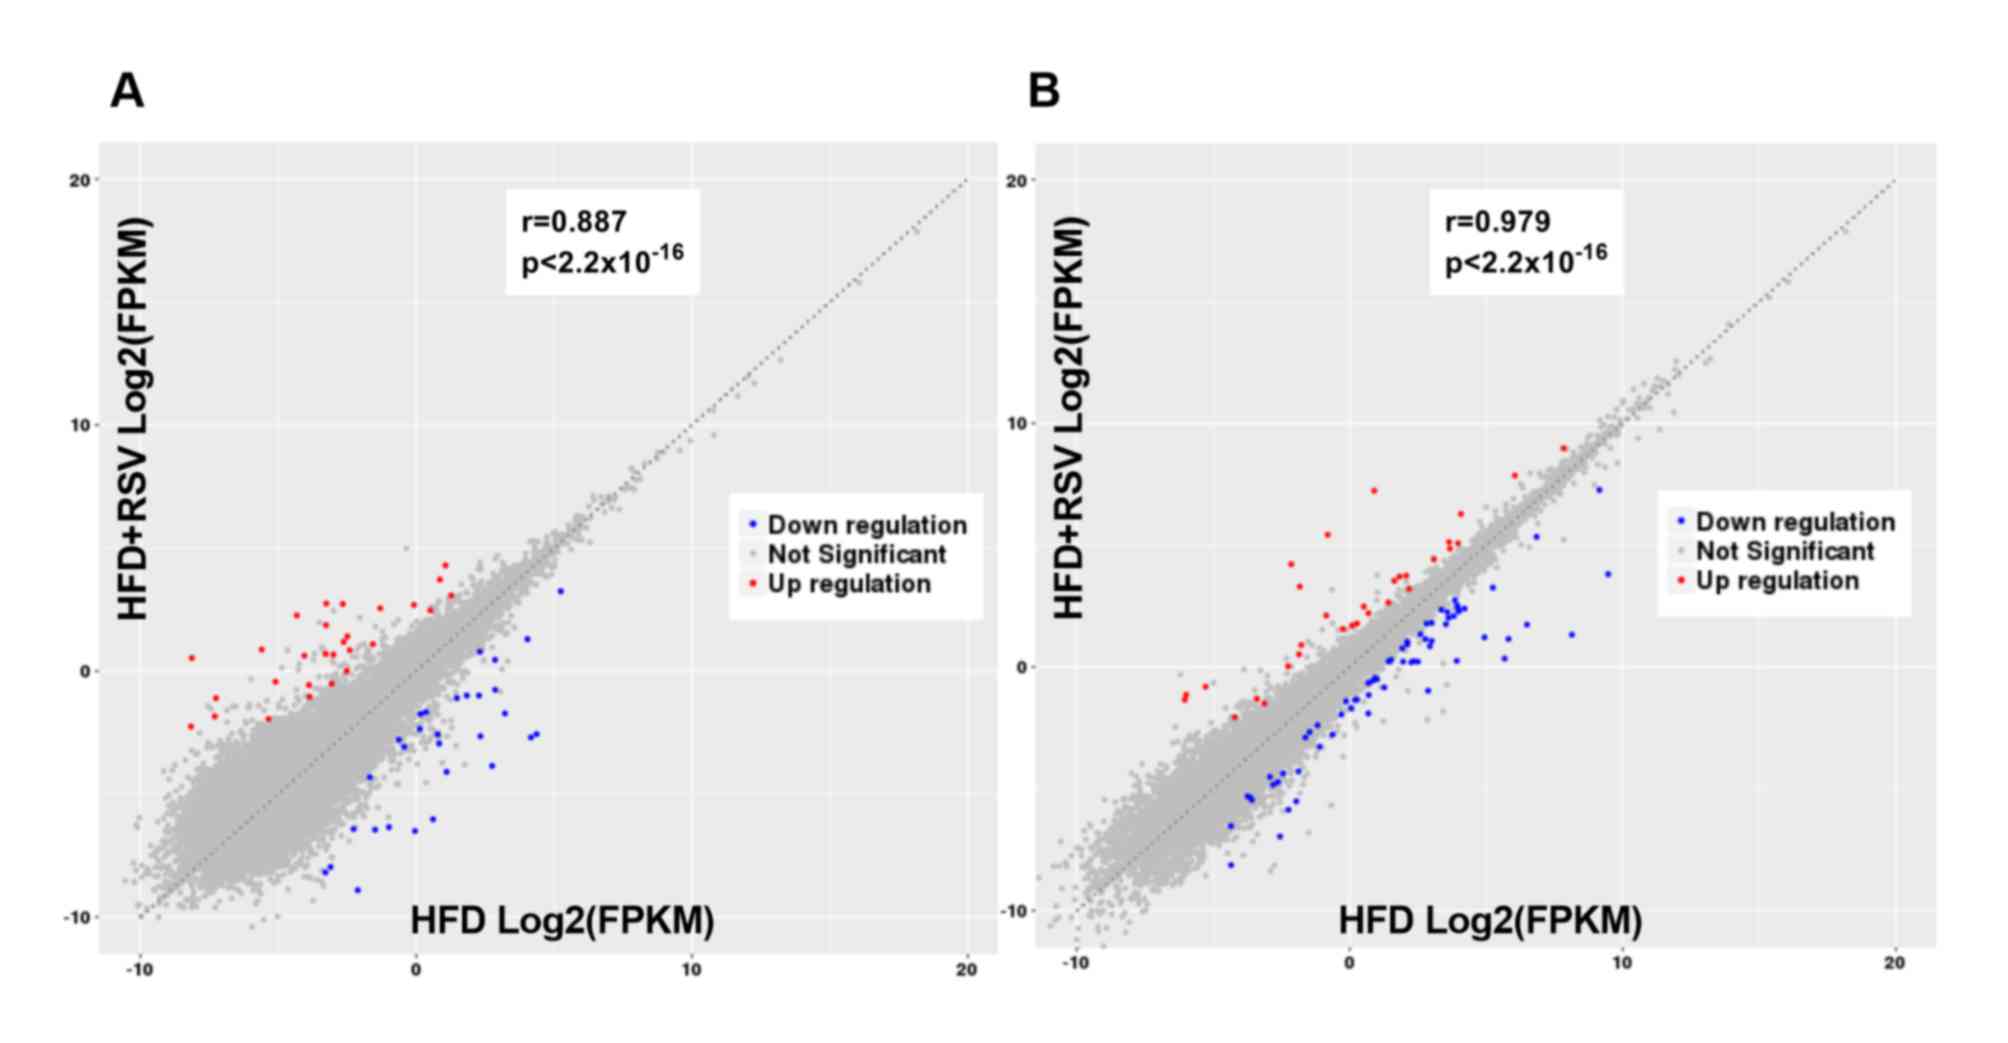
using a heat map (Fig. 1). The
scatter plot displays the distribution and approximate number of
lncRNAs and mRNAs showing >2-fold-change in expression levels
(Fig. 2A).
| Table II.Expression level patterns of lncRNAs
in HFD + RSV vs. HFD mice. |
Table II.
Expression level patterns of lncRNAs
in HFD + RSV vs. HFD mice.
| Gene | Log2,
fold-change | Q-value | Regulation, HFD +
RSV vs. HFD |
|---|
|
ENSMUST00000180982 | 8.66426 |
2.38×10⁻⁵ | Up |
|
NONMMUT034345.2 | 6.58843 |
5.82×10⁻⁷ | Up |
|
NONMMUT053361.2 | 6.47468 |
1.03×10⁻² | Up |
|
NONMMUT057779.2 | 6.15313 |
1.03×10⁻² | Up |
|
NONMMUT069202.2 | 6.00386 |
4.06×10⁻² | Up |
|
NONMMUT147866.1 | 5.91096 |
4.01×10⁻³ | Up |
|
NONMMUT154084.1 | 5.46016 |
1.55×10⁻³ | Up |
|
NONMMUT010559.2 | 5.39012 |
6.08×10⁻²¹ | Up |
|
NONMMUT059852.2 | 5.13583 |
1.12×10⁻¹² | Up |
|
NONMMUT039378.2 | 4.67745 |
1.66×10⁻² | Up |
|
ENSMUST00000193029 | 4.66360 |
3.98×10⁻⁷ | Up |
|
NONMMUT050350.2 | 3.97316 |
2.56×10⁻² | Up |
|
NONMMUT057244.2 | 3.90189 |
1.55×10⁻³ | Up |
|
NONMMUT027048.2 | 3.85579 |
2.97×10⁻² | Up |
|
NONMMUT001352.2 | 3.81448 |
6.36×10⁻⁷ | Up |
|
NONMMUT062675.2 | 3.67421 |
4.45×10⁻³ | Up |
|
NONMMUT069358.2 | 3.40734 |
1.01×10⁻² | Up |
|
NONMMUT077969.1 | 3.31443 |
3.29×10⁻² | Up |
|
NONMMUT035436.2 | 3.25810 |
2.83×10⁻² | Up |
|
NONMMUT001470.2 | 3.22941 |
2.31×10⁻⁴ | Up |
|
NONMMUT017329.2 | −1.52654 |
2.83×10⁻² | Down |
|
NONMMUT153837.1 | −1.90270 |
2.29×10⁻² | Down |
|
ENSMUST00000156612 | −2.00163 |
2.15×10⁻² | Down |
|
NONMMUT044184.2 | −2.01973 |
4.38×10⁻² | Down |
|
ENSMUST00000194058 | −2.15526 |
4.01×10⁻³ | Down |
| MSTRG.5260.1 | −2.40263 |
4.01×10⁻³ | Down |
|
NONMMUT010788.2 | −2.48785 |
3.09×10⁻² | Down |
|
NONMMUT119418.1 | −2.57853 |
3.51×10⁻² | Down |
|
NONMMUT059480.2 | −2.63681 |
2.13×10⁻² | Down |
|
NONMMUT047505.2 | −2.64522 |
1.53×10⁻² | Down |
| MSTRG.16066.11 | −2.73949 |
6.82×10⁻³ | Down |
|
NONMMUT031874.2 | −2.83355 |
3.91×10⁻³ | Down |
|
NONMMUT058999.2 | −3.27548 |
4.24×10⁻² | Down |
|
NONMMUT149177.1 | −3.35448 |
2.38×10⁻⁵ | Down |
|
NONMMUT068763.2 | −3.62327 |
1.03×10⁻² | Down |
|
NONMMUT031873.2 | −3.78681 |
1.71×10⁻⁵ | Down |
|
ENSMUST00000181265 | −4.15283 |
4.42×10⁻³ | Down |
|
NONMMUT142728.1 | −4.85759 |
3.13×10⁻² | Down |
|
NONMMUT001350.2 | −4.89458 |
1.59×10⁻² | Down |
|
NONMMUT051901.2 | −4.94198 |
1.18×10⁻² | Down |
| Table III.Expression level patterns of mRNAs in
HFD + RSV vs. HFD mice. |
Table III.
Expression level patterns of mRNAs in
HFD + RSV vs. HFD mice.
| Gene name | Log2,
fold-change | Q-value | Regulation, HFD +
RSV vs. HFD |
|---|
| Rnu3b4 | 6.33208 |
3.88×10⁻⁹ | Up |
| mir8114 | 6.22832 |
3.19×10⁻² | Up |
| Gm27640 | 5.12685 |
2.59×10⁻¹⁶ | Up |
| Gm45753 | 4.84454 |
2.92×10⁻⁹ | Up |
| Gm28373 | 4.68876 |
1.59×10⁻² | Up |
| Capn11 | 4.46449 |
1.51×10⁻³ | Up |
| Usf3 | 2.97090 |
1.67×10⁻¹⁰ | Up |
| Gm20427 | 2.66816 |
1.06×10⁻² | Up |
| Gm38283 | 2.37695 |
1.23×10⁻² | Up |
| Gm45301 | 2.28532 |
5.97×10⁻³ | Up |
| Igfbp1 | 2.20251 |
2.31×10⁻³ | Up |
| 4933431G14Rik | 2.15402 |
3.09×10⁻² | Up |
| Pitx3 | 2.07722 |
4.26×10⁻² | Up |
| Gm43314 | 1.96046 |
5.51×10⁻⁶ | Up |
| Gm38357 | 1.90174 |
6.14×10⁻³ | Up |
| Cyp2b10 | 1.88210 |
4.76×10⁻⁶ | Up |
| Gm28323 | 1.79929 |
3.89×10⁻⁵ | Up |
| Gm15344 | 1.67885 |
1.31×10⁻³ | Up |
| Noct | 1.62225 |
7.22×10⁻³ | Up |
| Gm45792 | 1.61784 |
1.59×10⁻² | Up |
| Gpc1 | −1.01448 |
8.54×10⁻³ | Down |
| Fdps | −1.03416 |
7.48×10⁻³ | Down |
| Rhbg | −1.08002 |
3.09×10⁻² | Down |
| Calm1 | −1.11653 |
8.91×10⁻⁴ | Down |
| 2510016D11Rik | −1.16015 |
1.06×10⁻² | Down |
| Gm5873 | −1.18954 |
1.59×10⁻² | Down |
| Nrep | −1.18980 |
2.27×10⁻³ | Down |
| Mesd | −1.19613 |
8.22×10⁻³ | Down |
| Camk2b | −1.20313 |
1.73×10⁻² | Down |
| Mki67 | −1.21546 |
6.09×10⁻⁴ | Down |
| Wfdc2 | −1.22930 |
7.48×10⁻³ | Down |
| Pcsk9 | −1.24132 |
3.49×10⁻² | Down |
| Synj2 | −1.27207 |
1.41×10⁻⁴ | Down |
| Neurl1b | −1.27456 |
3.05×10⁻² | Down |
| Gm3571 | −1.32982 |
3.77×10⁻³ | Down |
| Rgs3 | −1.34144 |
5.51×10⁻⁶ | Down |
| Cntnap1 | −1.39291 |
2.68×10⁻² | Down |
| Socs2 | −1.41122 |
7.95×10⁻⁴ | Down |
| Gm27702 | −1.41732 |
2.79×10⁻² | Down |
| Phlda1 | −1.50249 |
2.39×10⁻⁵ | Down |
RT-qPCR to verify the expression
levels of miRNAs
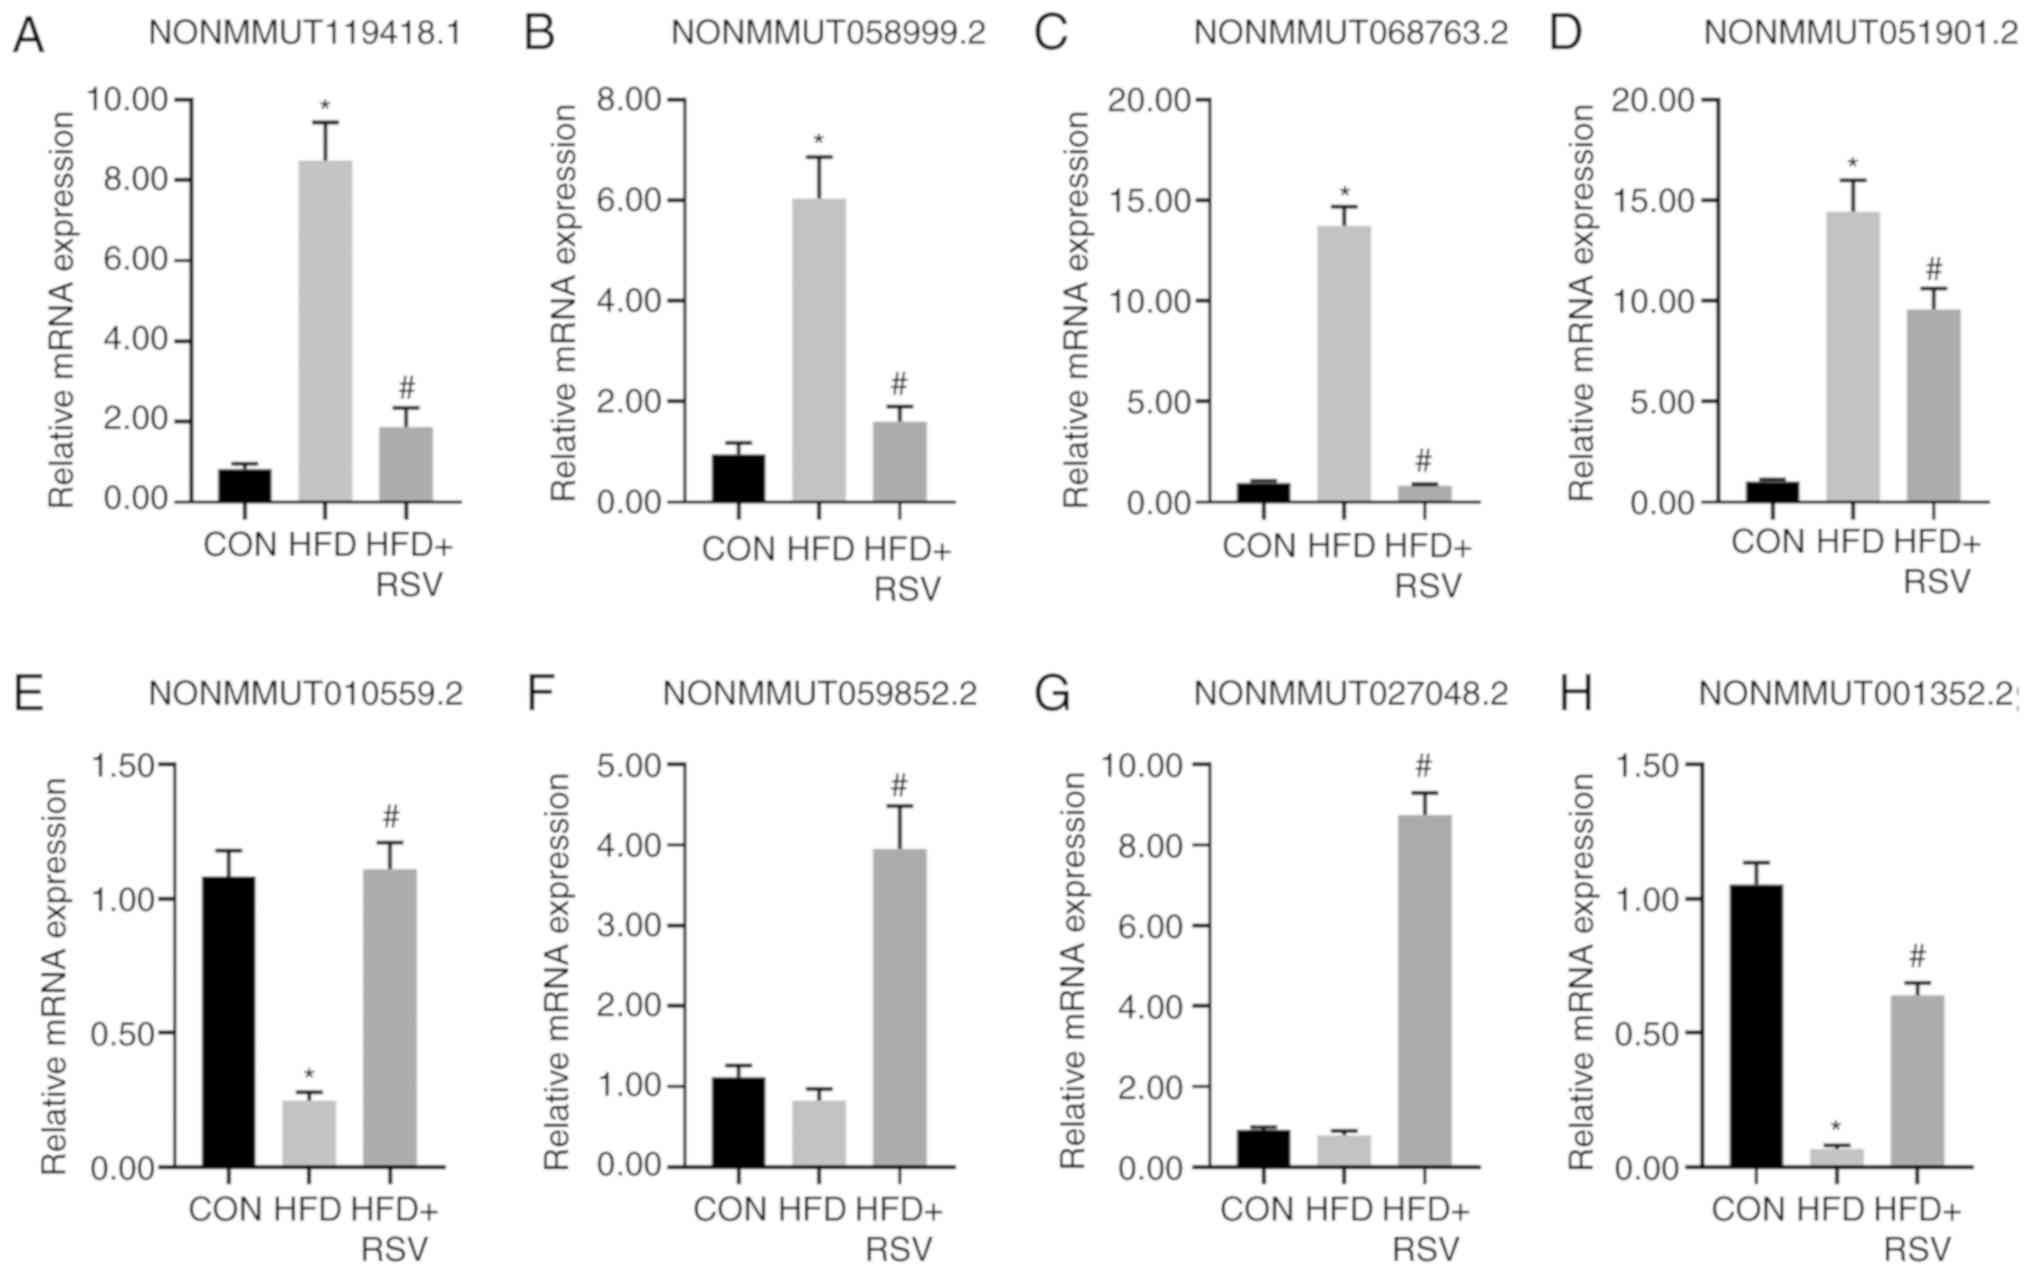
A total of four downregulated lncRNAs
(NONMMUT119418.1, NONMMUT058999.2, NONMMUT068763.2 and
NONMMUT051901.2) and four upregulated lncRNAs (NONMMUT010559.5.2,
NONMMUT059852.2, NONMMUT027048.2 and NONMMUT001352.2) randomly
selected from the 58 lncRNAs showing differential expression levels
in the HFD + RSV and HFD groups following RSV intervention were
evaluated using RT-qPCR to verify the sequencing results. The
expression levels of these eight lncRNAs were consistent with those
demonstrated by sequencing analysis of the HFD + RSV and HFD
groups. Compared with the CON group, there was no significant
difference in the expression levels of lncRNAs in the HFD group
except for those of NONMMUT059852.2 and NONMMUT027048.2 (Fig. 3). Although these two sets of
verification results were inconsistent with the sequencing results,
similar trends were obtained. The discrepancy may be related to the
selection of samples and the size of the sample size.
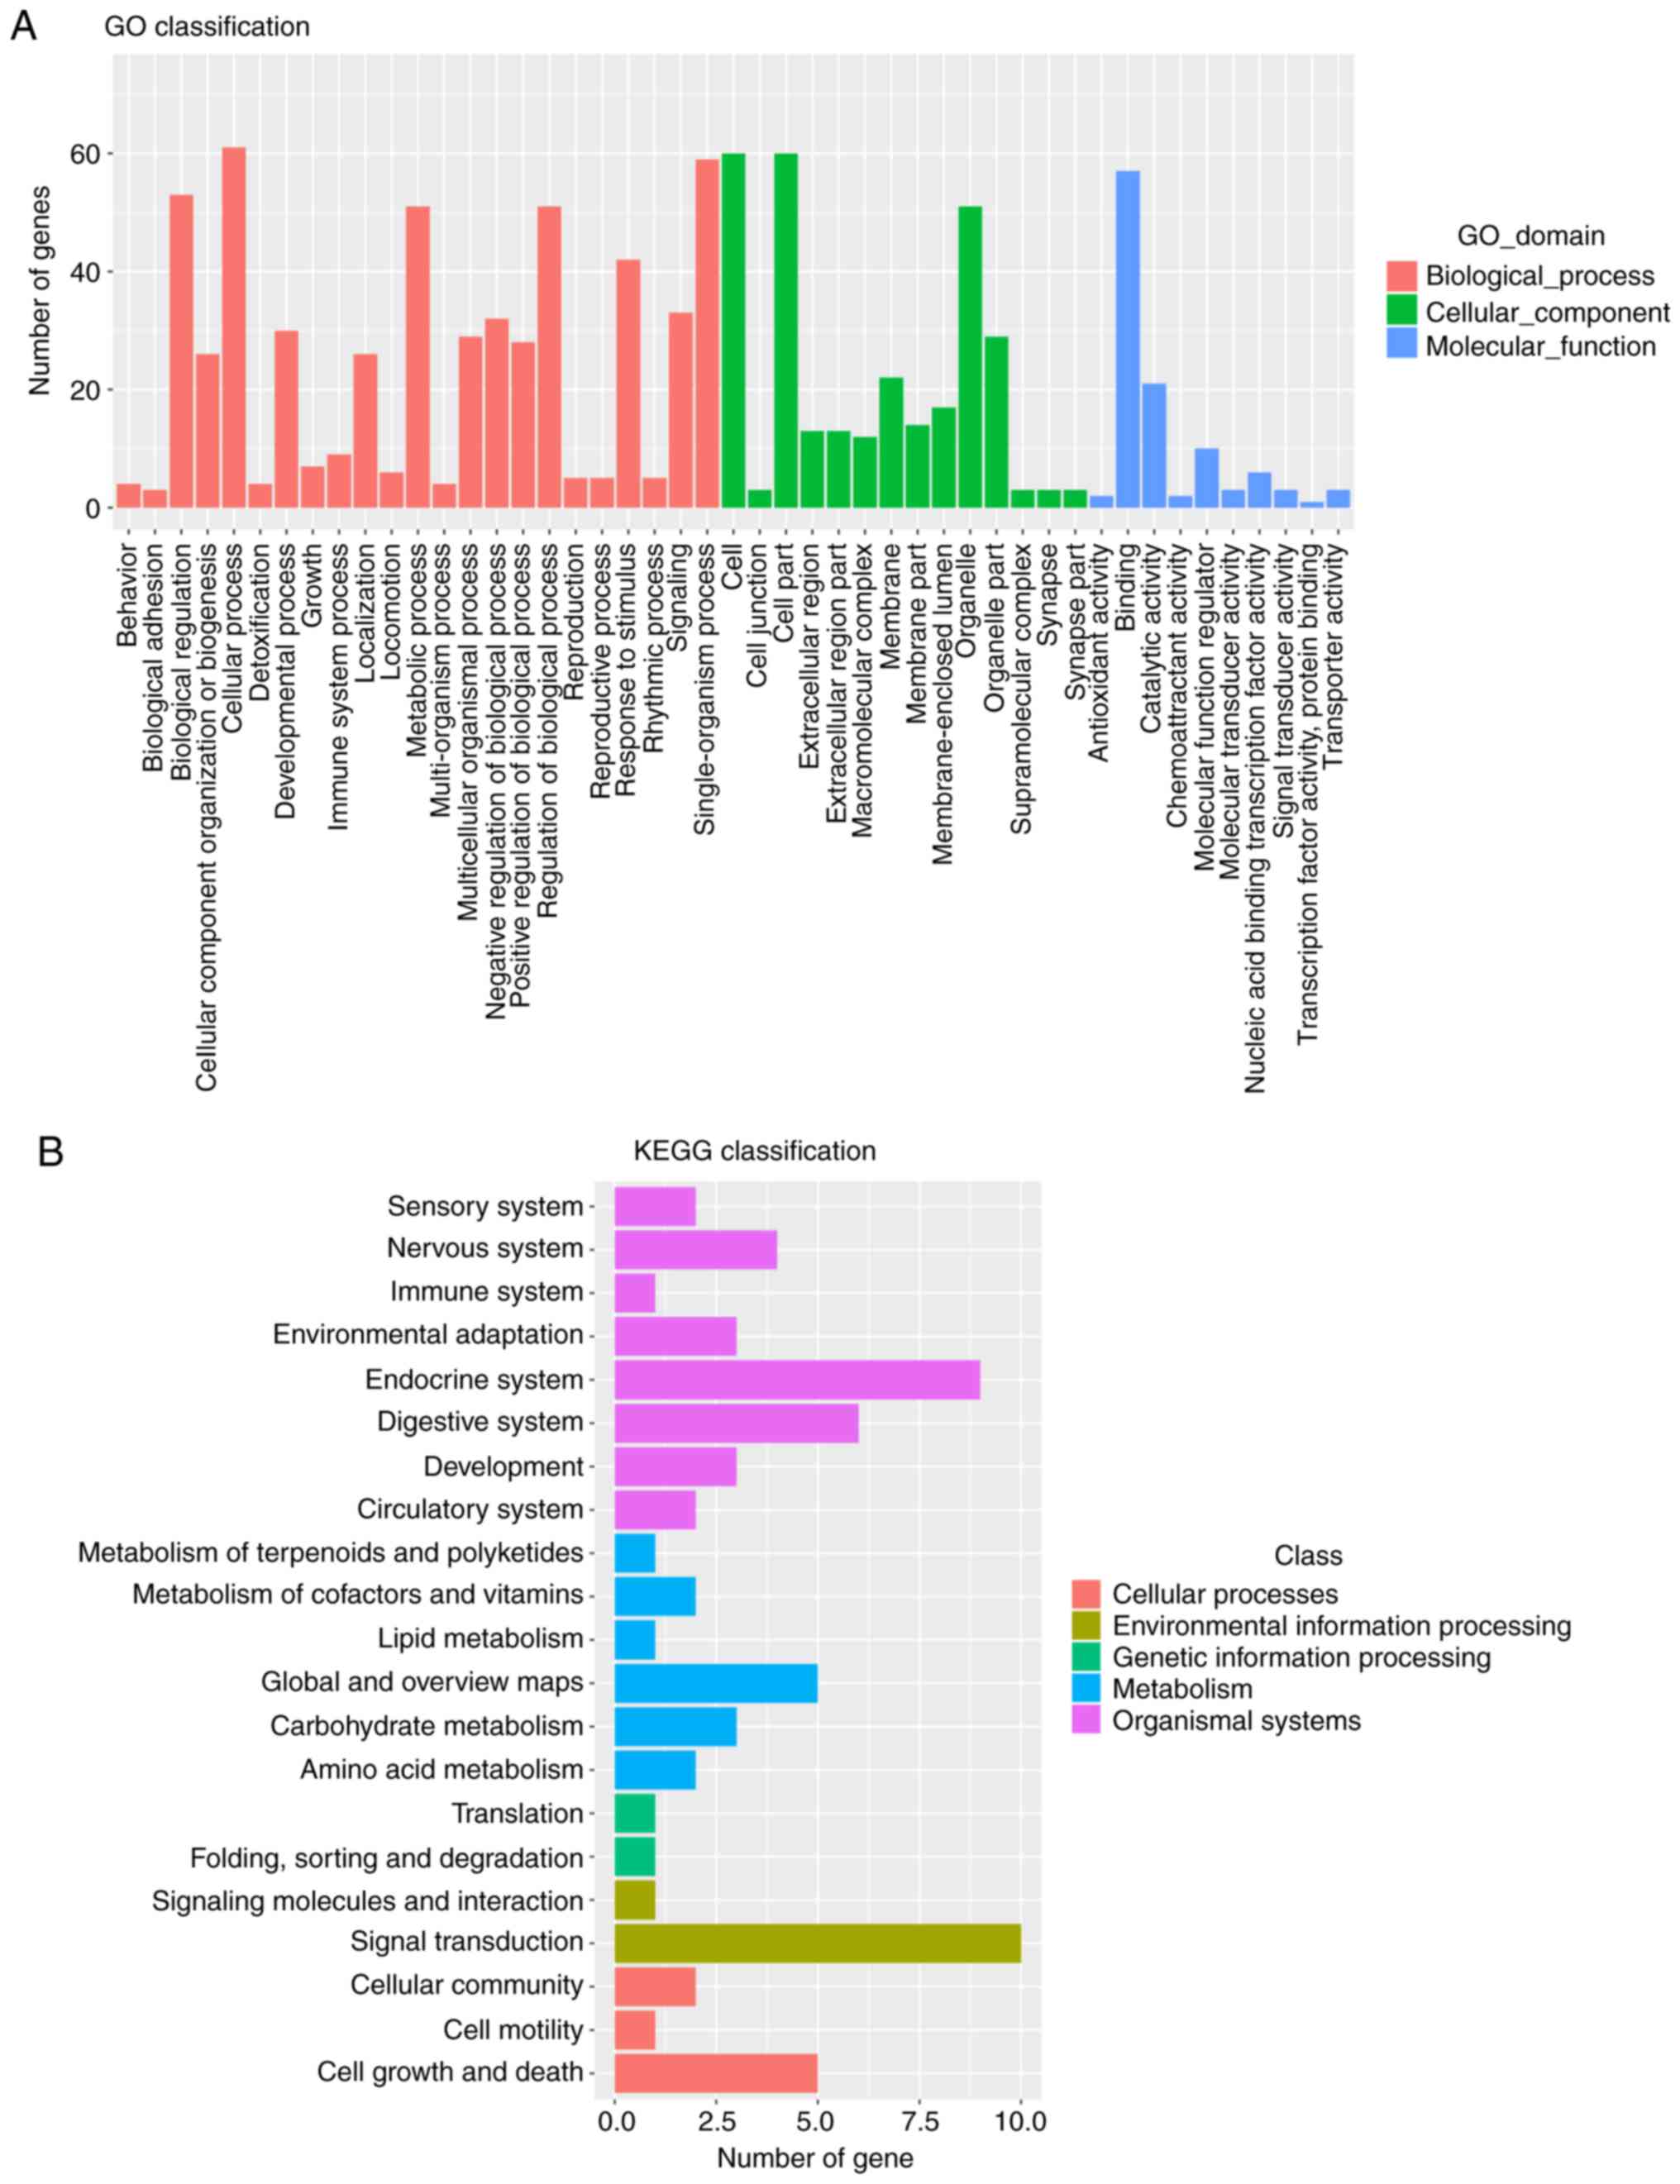
The sequencing company produced only second-level
results. The distribution of enriched differential genes at the
three levels of GO is presented as a histogram, showing the
second-level results in the GO database. The significant BPs in the
GO classification included the ‘cellular process’, ‘single-organism
process’ and ‘biological regulation’. CC primarily included the
‘cell’, ‘organizer’ and ‘membrane’. MF included ‘binding’,
‘catalytic activity’ and ‘molecular function regulator’ (Fig. 4A). The differential gene-associated
classes of the KEGG database included cellular processes,
environmental information processing, genetic information
processing, metabolism and organizational systems (Fig. 4B).
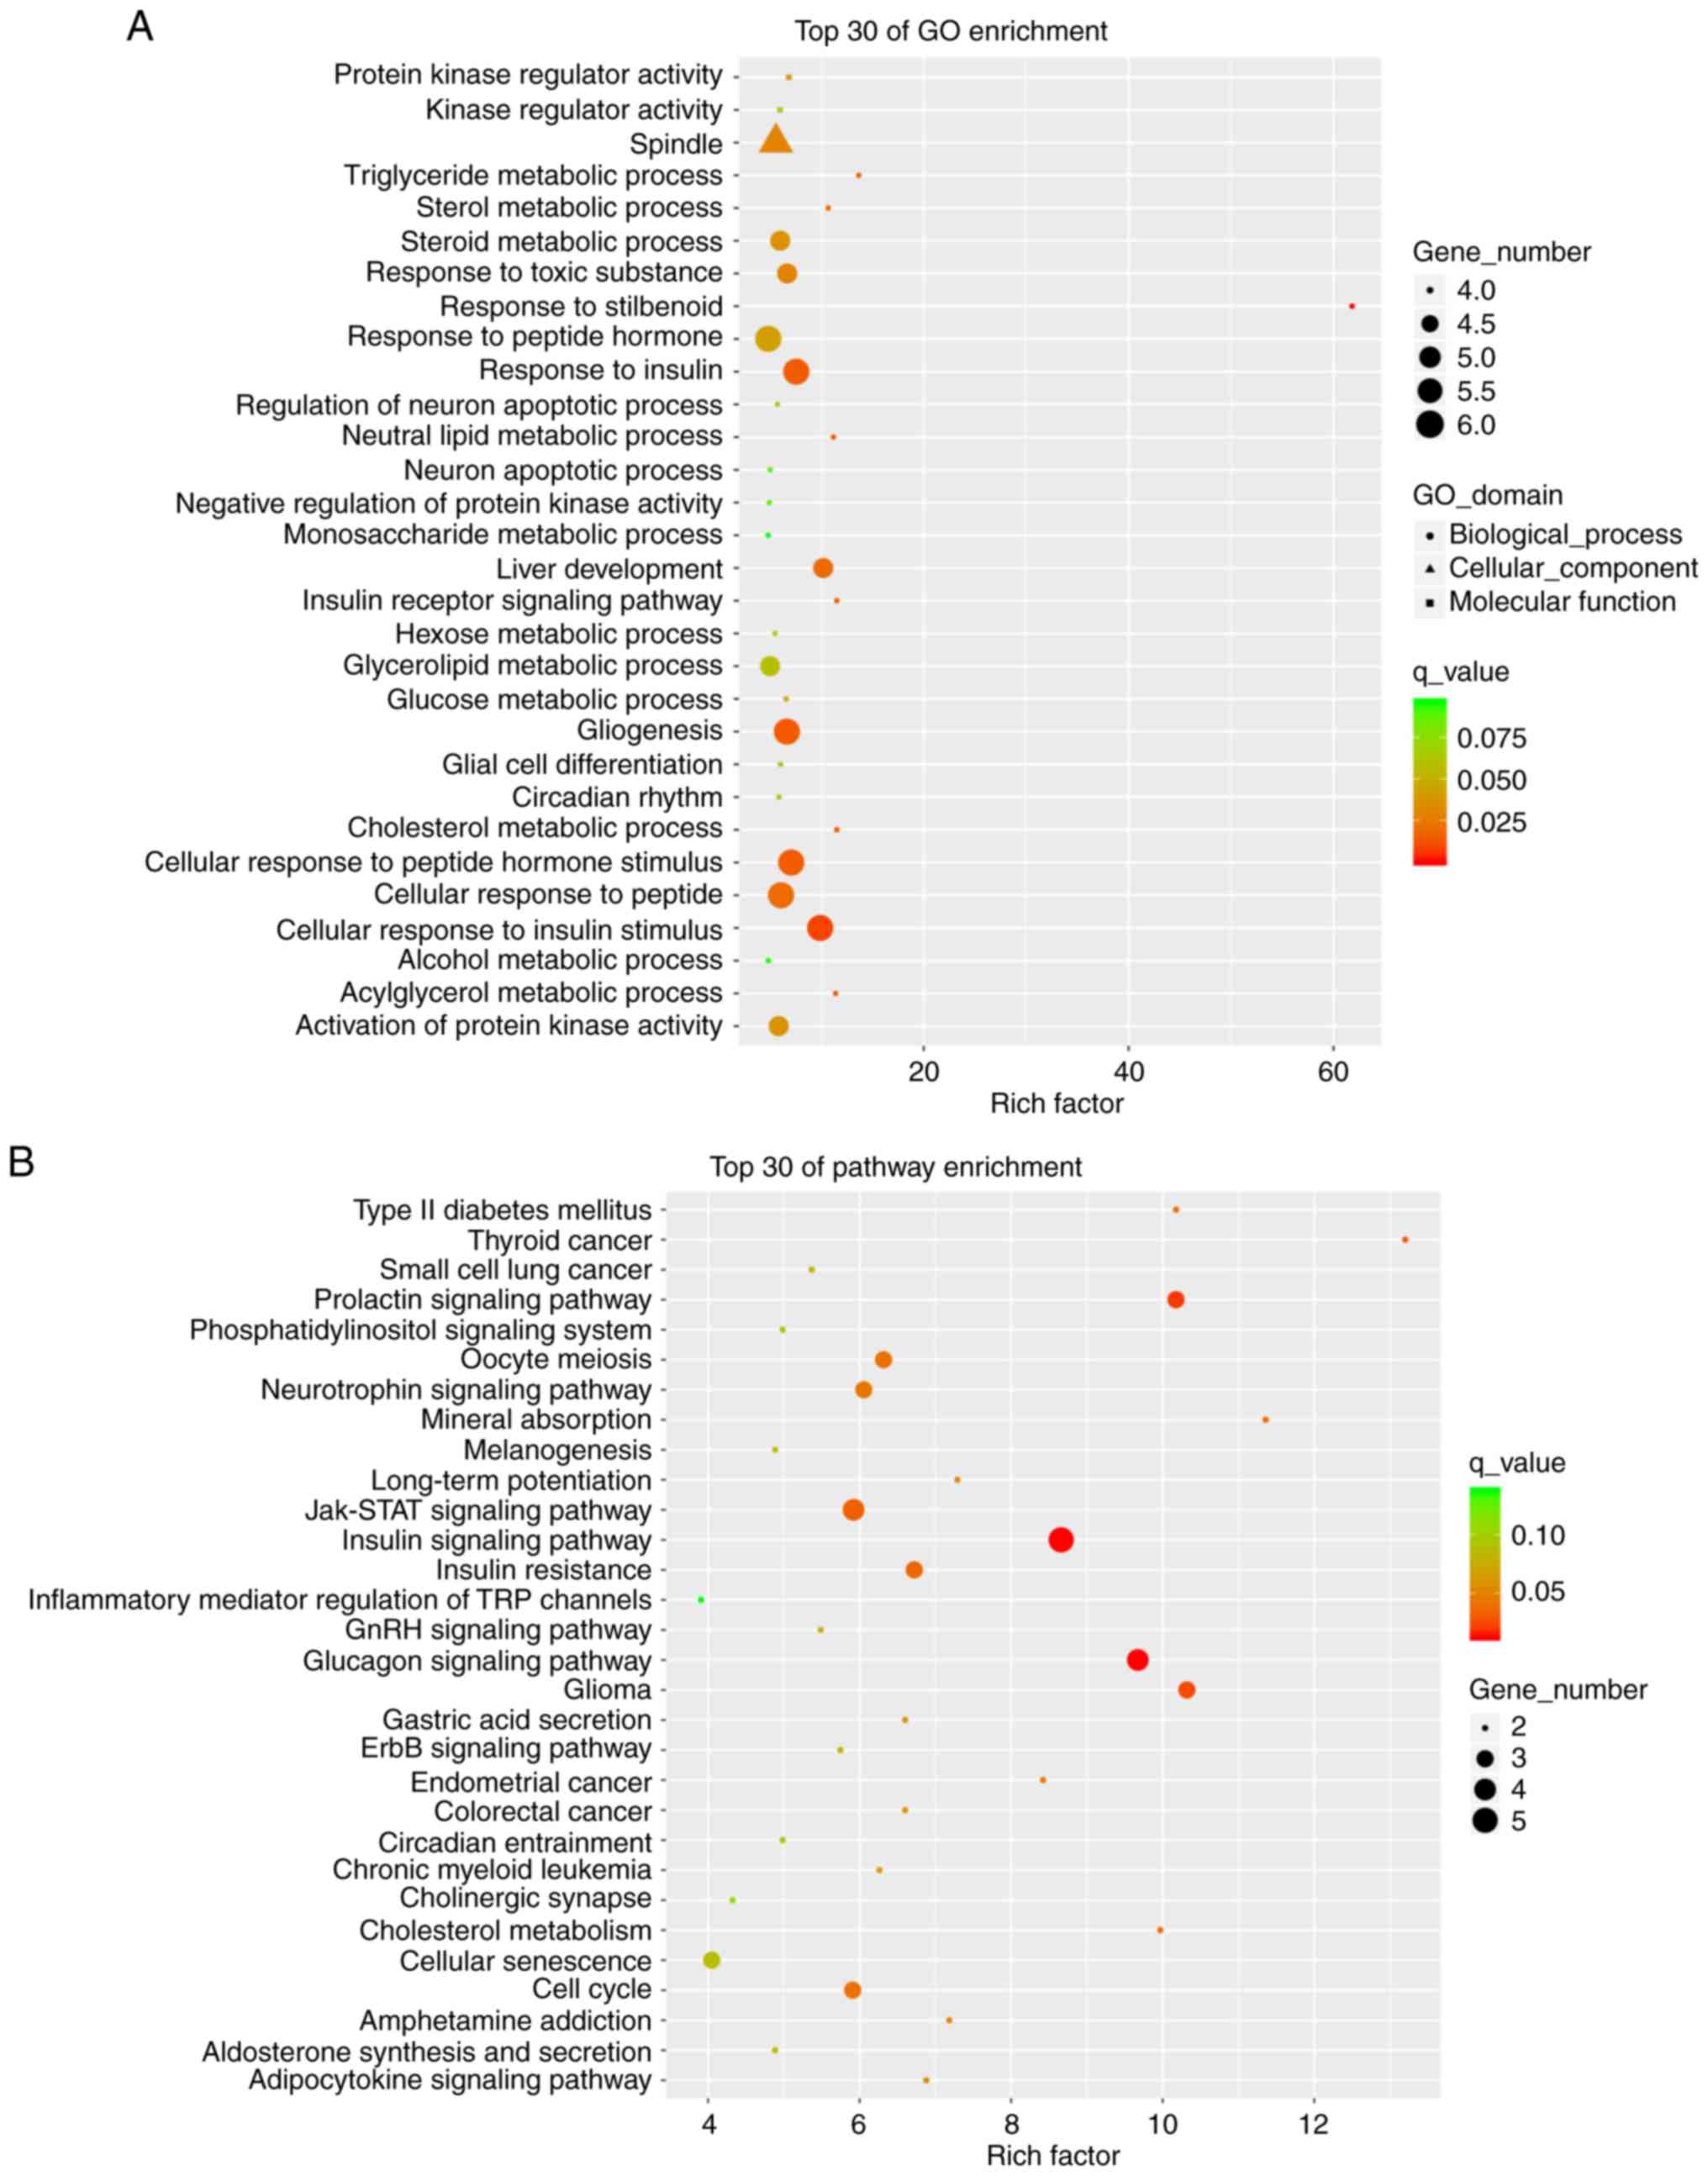
Enrichment analysis of GO and
KEGG
The significant BPs in the top 30 GO enrichment
analysis of mRNAs included ‘steroid metabolic process’, ‘response
to insulin’, ‘cellular response to insulin stimulus’. CC included
the ‘spindle’, and MF included ‘protein kinase regulator activity’
and ‘kinase regulator activity’ (Fig.
5A). mRNA KEGG pathway analysis was performed on the signaling
pathways involving differentially expressed miRNAs. The top 30
pathway enrichments included the ‘insulin’, ‘glucagon’,
‘prolactin’, ‘Jak-STAT’, ‘insulin resistance’ and ‘neurotrophin
signaling’ pathways. Among these, the insulin signaling pathway
showed the highest score and was associated with the animal model
of insulin resistance (Fig. 5B).
This pathway was selected and the associated target genes SOCS3,
G6PC, FOXO1 and PEPCK were predicted by pathway analysis (21). Through sequencing it was also found
that among the eight verified lncRNAs, NONMMUT058999.2 is
associated with SOCS3 and NONMMUT051901.2 is associated with
G6PC.
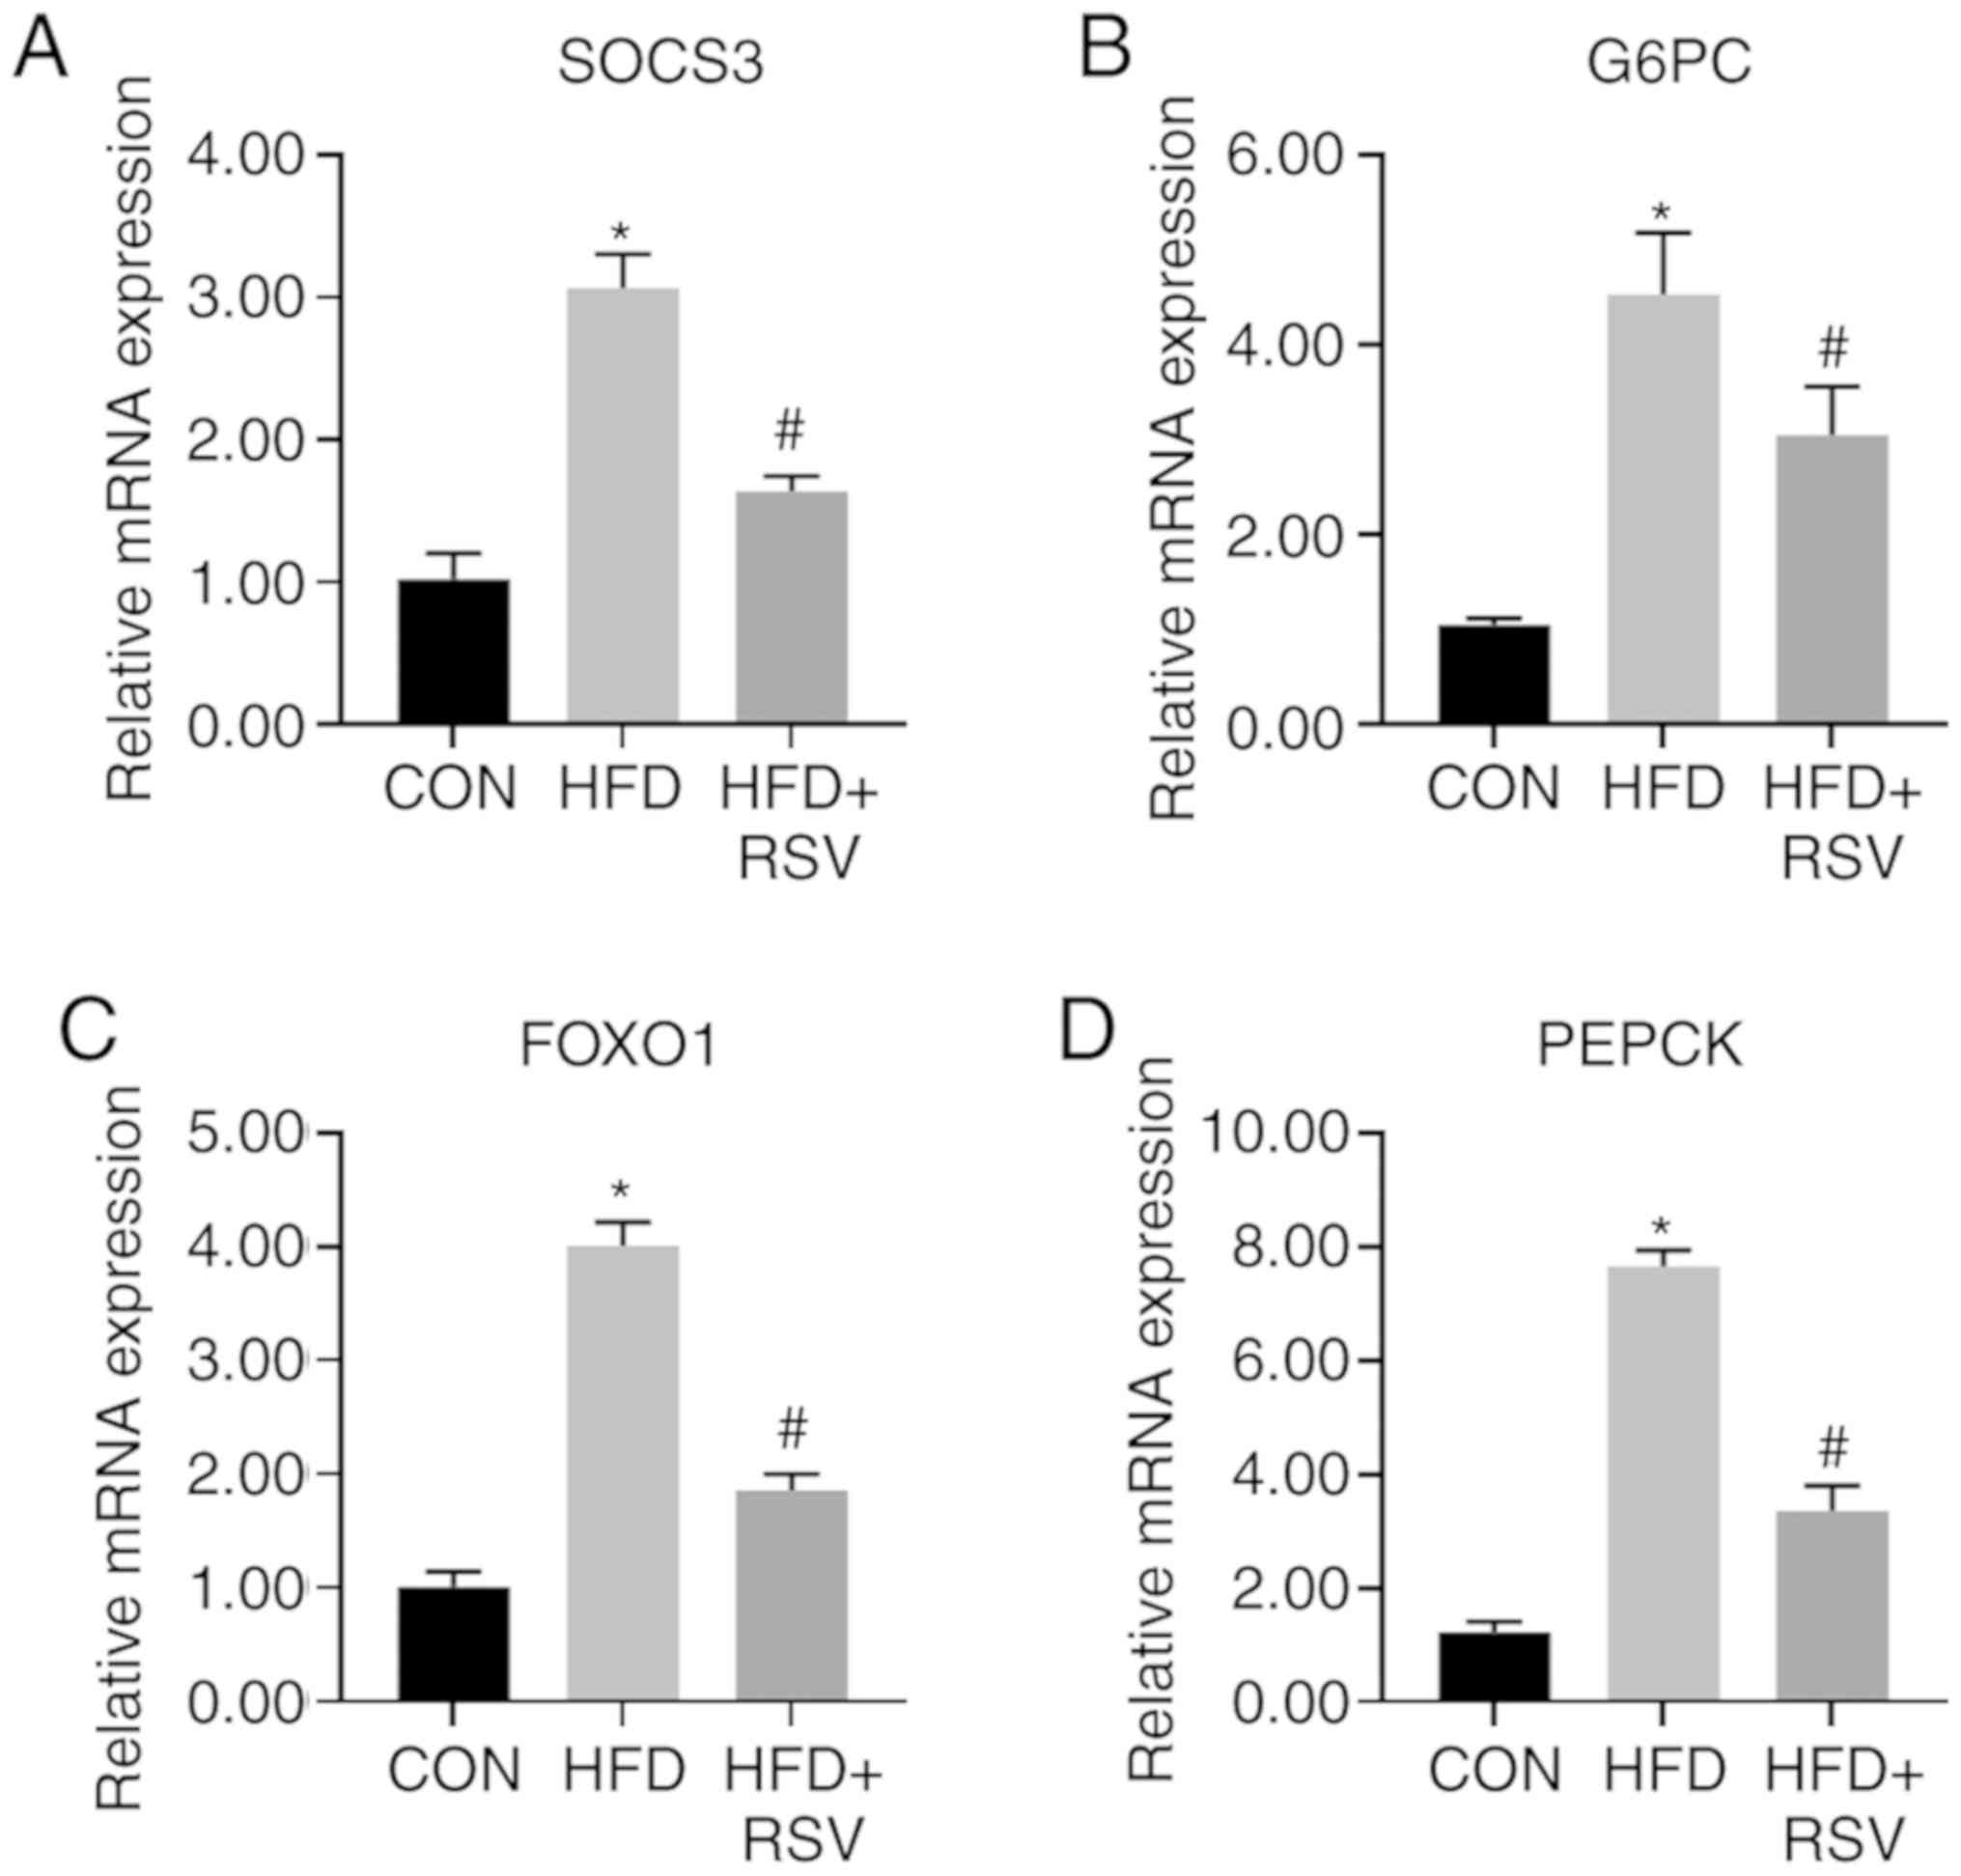
Comparison of mRNA levels of insulin
signaling pathway-associated genes
Compared with the CON group, the mRNA levels of
SOCS3, G6PC, FOXO1, and PEPCK in the HFD group were significantly
increased. The mRNA levels of SOCS3, G6PC, FOXO1 and PEPCK in the
HFD + RSV group were significantly lower than those in the HFD
group (Fig. 6).
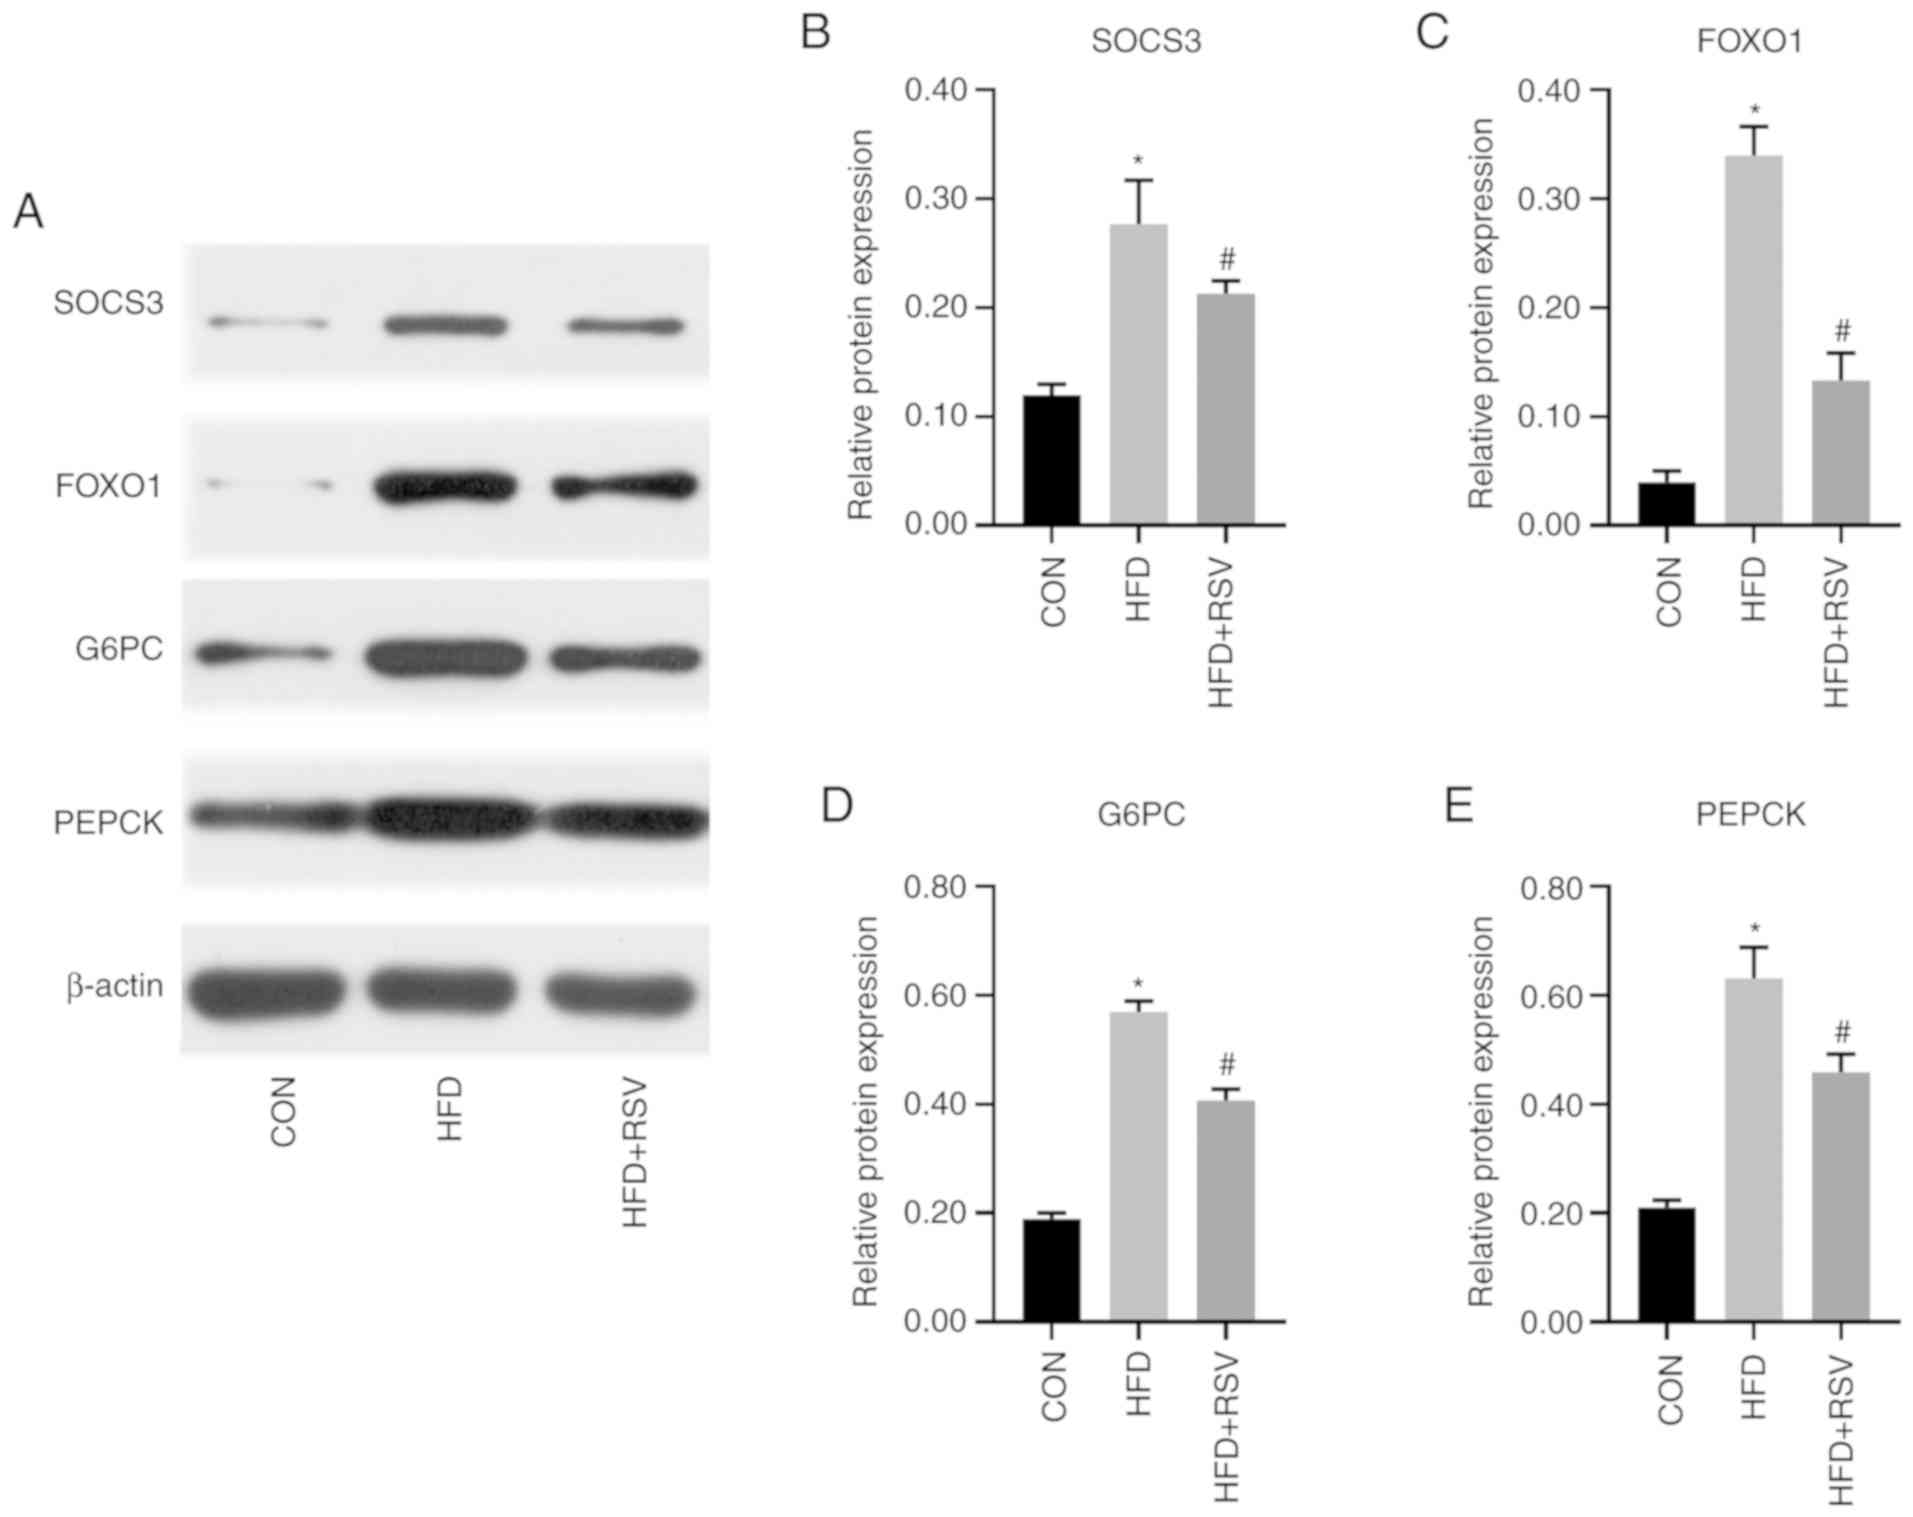
Comparison of protein expression
levels of insulin signaling pathway-associated genes
Compared with the CON group, the expression levels
of SOCS3, FOXO1, G6PC and PEPCK in the HFD group were significantly
increased. Compared with the HFD group, the expression levels of
SOCS3, FOXO1, G6PC and PEPCK were significantly decreased in the
HFD + RSV group (Fig. 7).
Combined analysis of differentially
expressed lncRNAs and mRNAs
The sections belonging to differential mRNAs in the
target genes of differential lncRNAs were isolated and assessed for
enrichment in the GO and KEGG databases. A total of nine lncRNAs
and mRNAs were simultaneously differentially expressed (Table IV).
| Table IV.Combined analysis of differential
lncRNAs and mRNAs in HFD + RSV vs. HFD mice. |
Table IV.
Combined analysis of differential
lncRNAs and mRNAs in HFD + RSV vs. HFD mice.
| Gene | log2
FC-lncRNAs | Regulation | Gene name | log2
FC-mRNAs | Regulation |
|---|
|
NONMMUT119418.1 | −2.578527568 | Down | Aacs | −1.812654567 | Down |
|
NONMMUT031874.2 | −2.833546204 | Down | Nrep | −1.189799355 | Down |
|
NONMMUT031873.2 | −3.786814191 | Down | Nrep | −1.189799355 | Down |
|
ENSMUST00000156612 | −2.001634041 | Down | Apoa4 | −1.881578742 | Down |
| MSTRG.5260.1 | −2.402628858 | Down | Camk2b | −1.203129759 | Down |
|
NONMMUT144314.1 | −6.791820344 | Down | Knl1 | −1.569105399 | Down |
|
NONMMUT059480.2 | −2.636807826 | Down | Bhlhe41 | −1.54587736 | Down |
|
ENSMUST00000181265 | −4.152826048 | Down | Dlgap5 | −2.180235362 | Down |
|
NONMMUT149177.1 | −3.354476528 | Down | Aacs | −1.812654567 | Down |
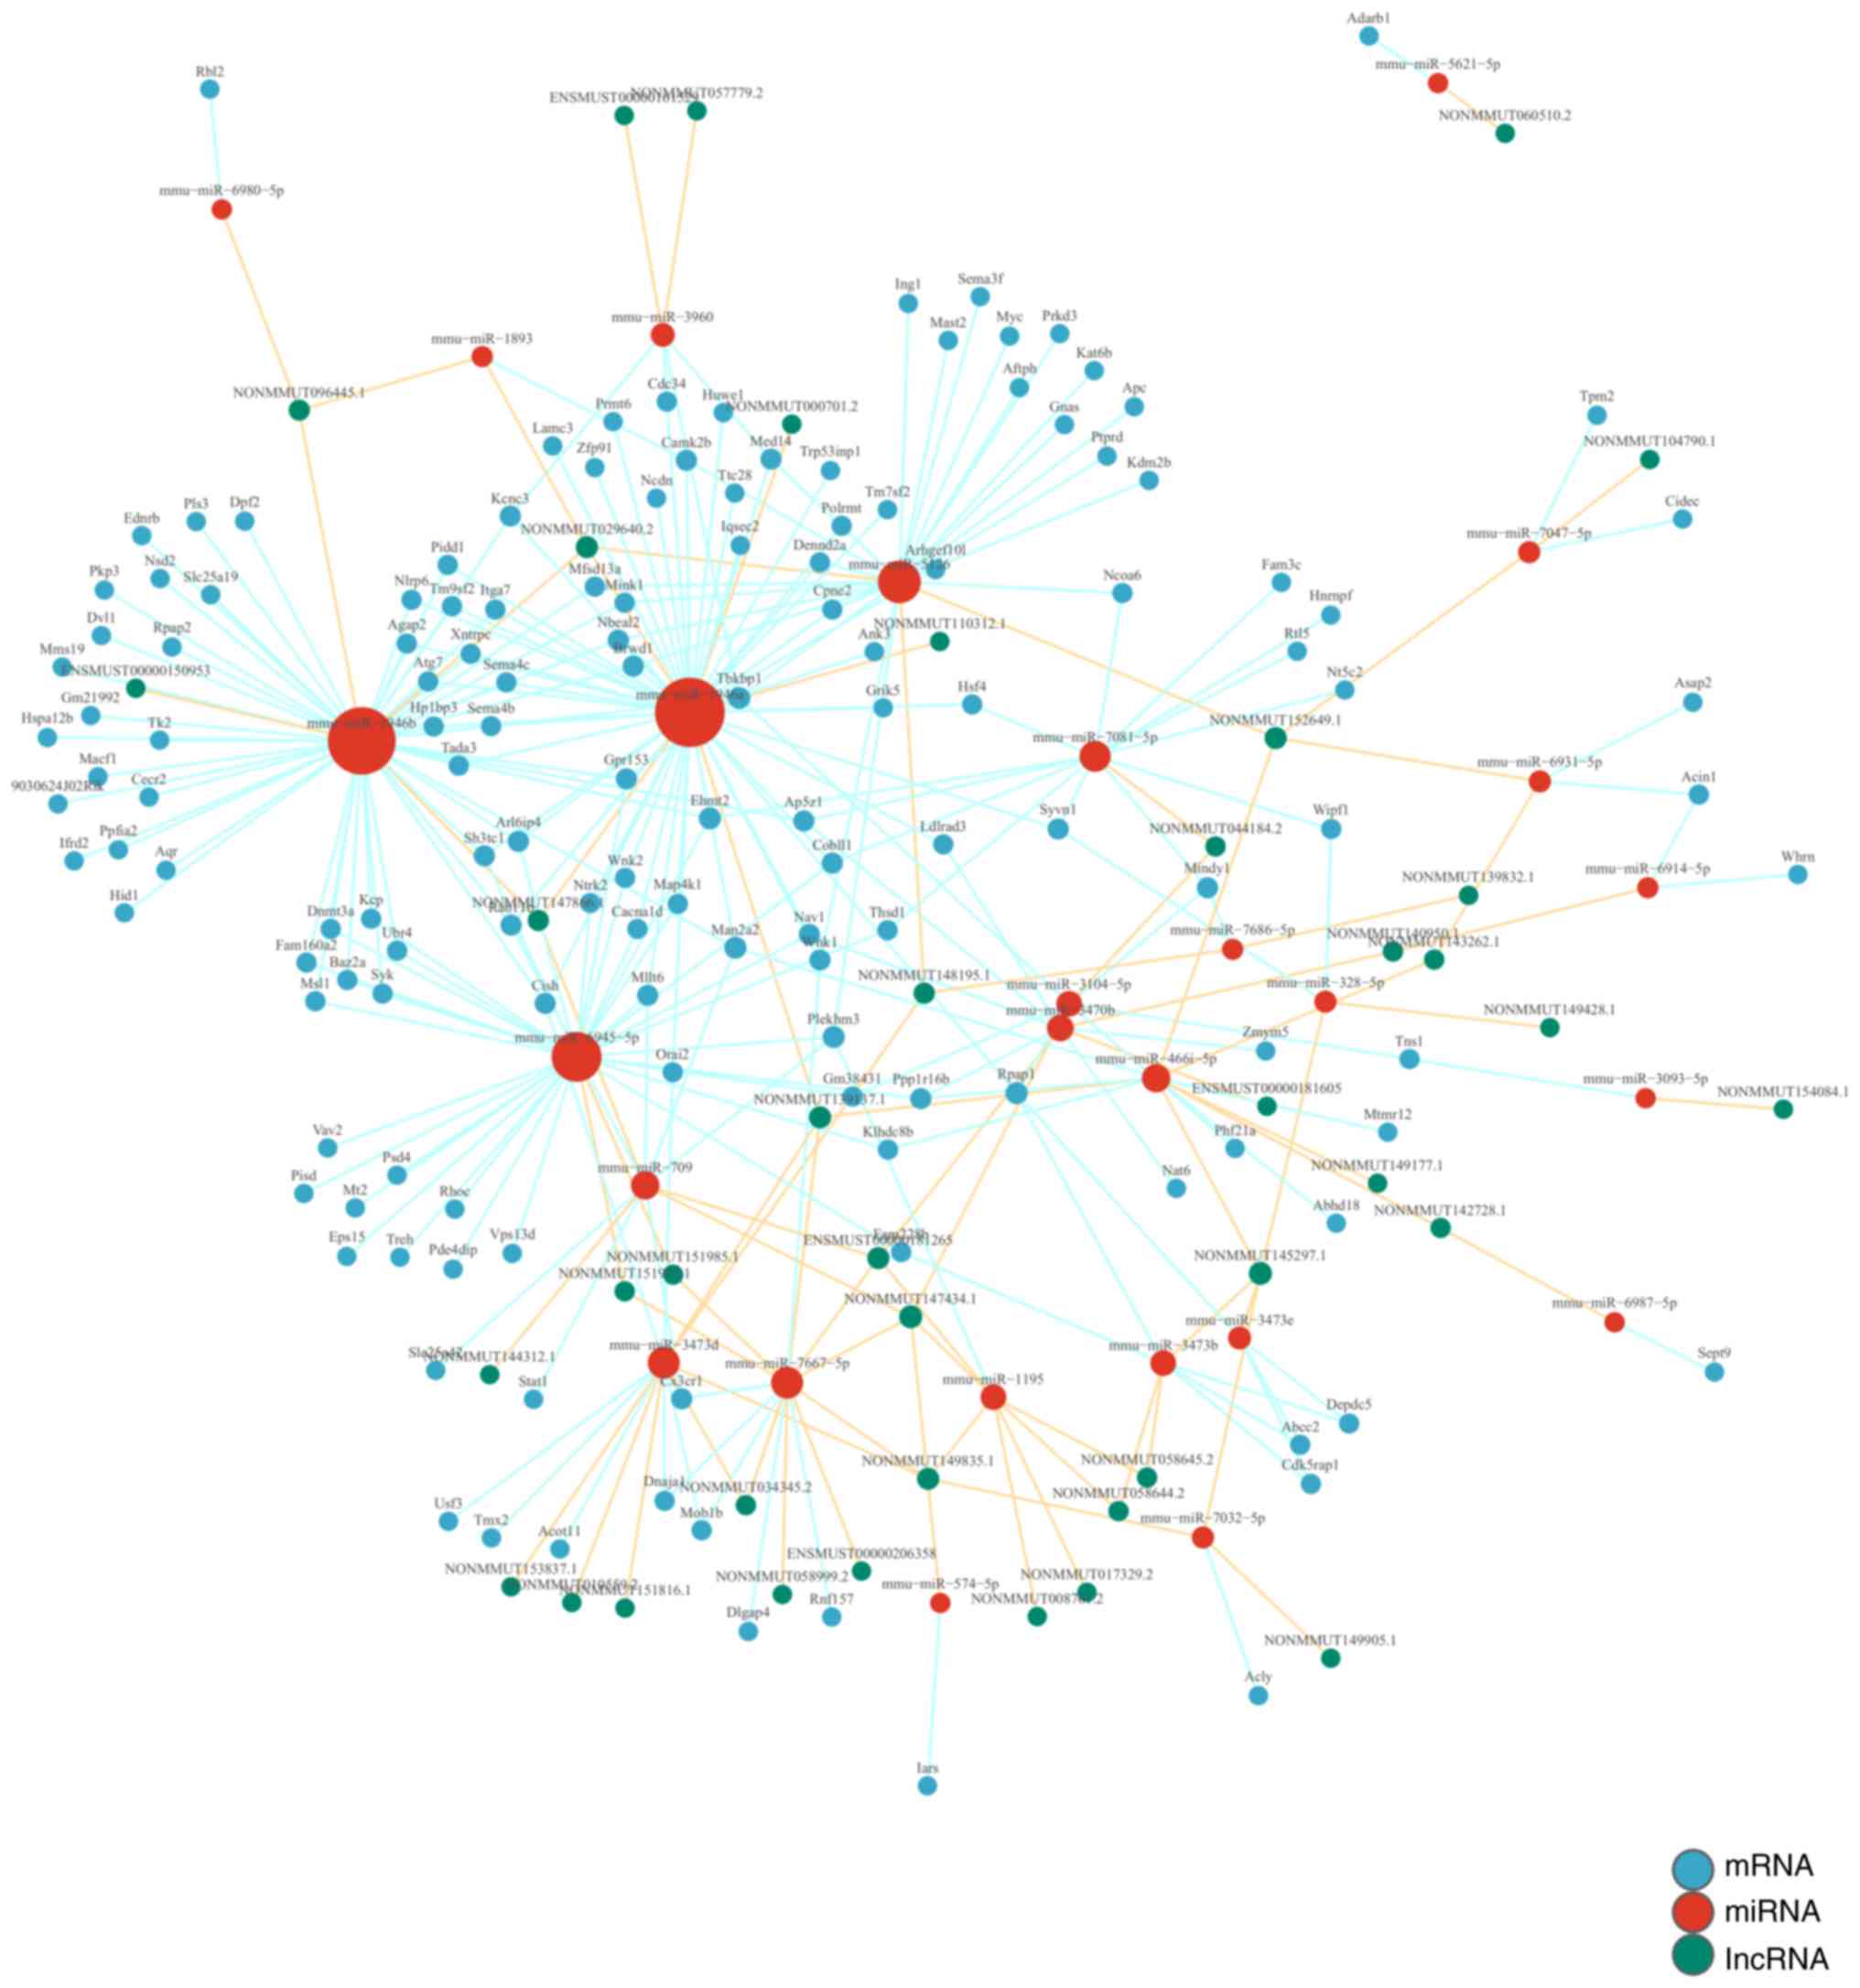
lncRNA-miRNA-mRNA co-expression
network
By calculating the dynamic gene expression levels in
the HFD + RSV and HFD groups and calculating the co-expression
association between genes, the present study constructed a network
map of associated lncRNAs, miRNAs and mRNAs. This demonstrated that
the lncRNAs NONMMUT147434.1 and NONMMUT145297.1 regulate the
majority of miRNAs in this network. NONMMUT147434.1 regulates miRNA
mmu-miR-1195, mmu-miR-3104-5p, mmu-miR-709, mmu-miR-7667-5p and
mmu-miR-574-5p. NONMMUT145297.1 regulates mmu-miR-3473b,
mmu-miR-3473e, mmu-miR-7032-5p, mmu-miR-328-5p and mmu-miR-466i-5p
(Fig. 8).
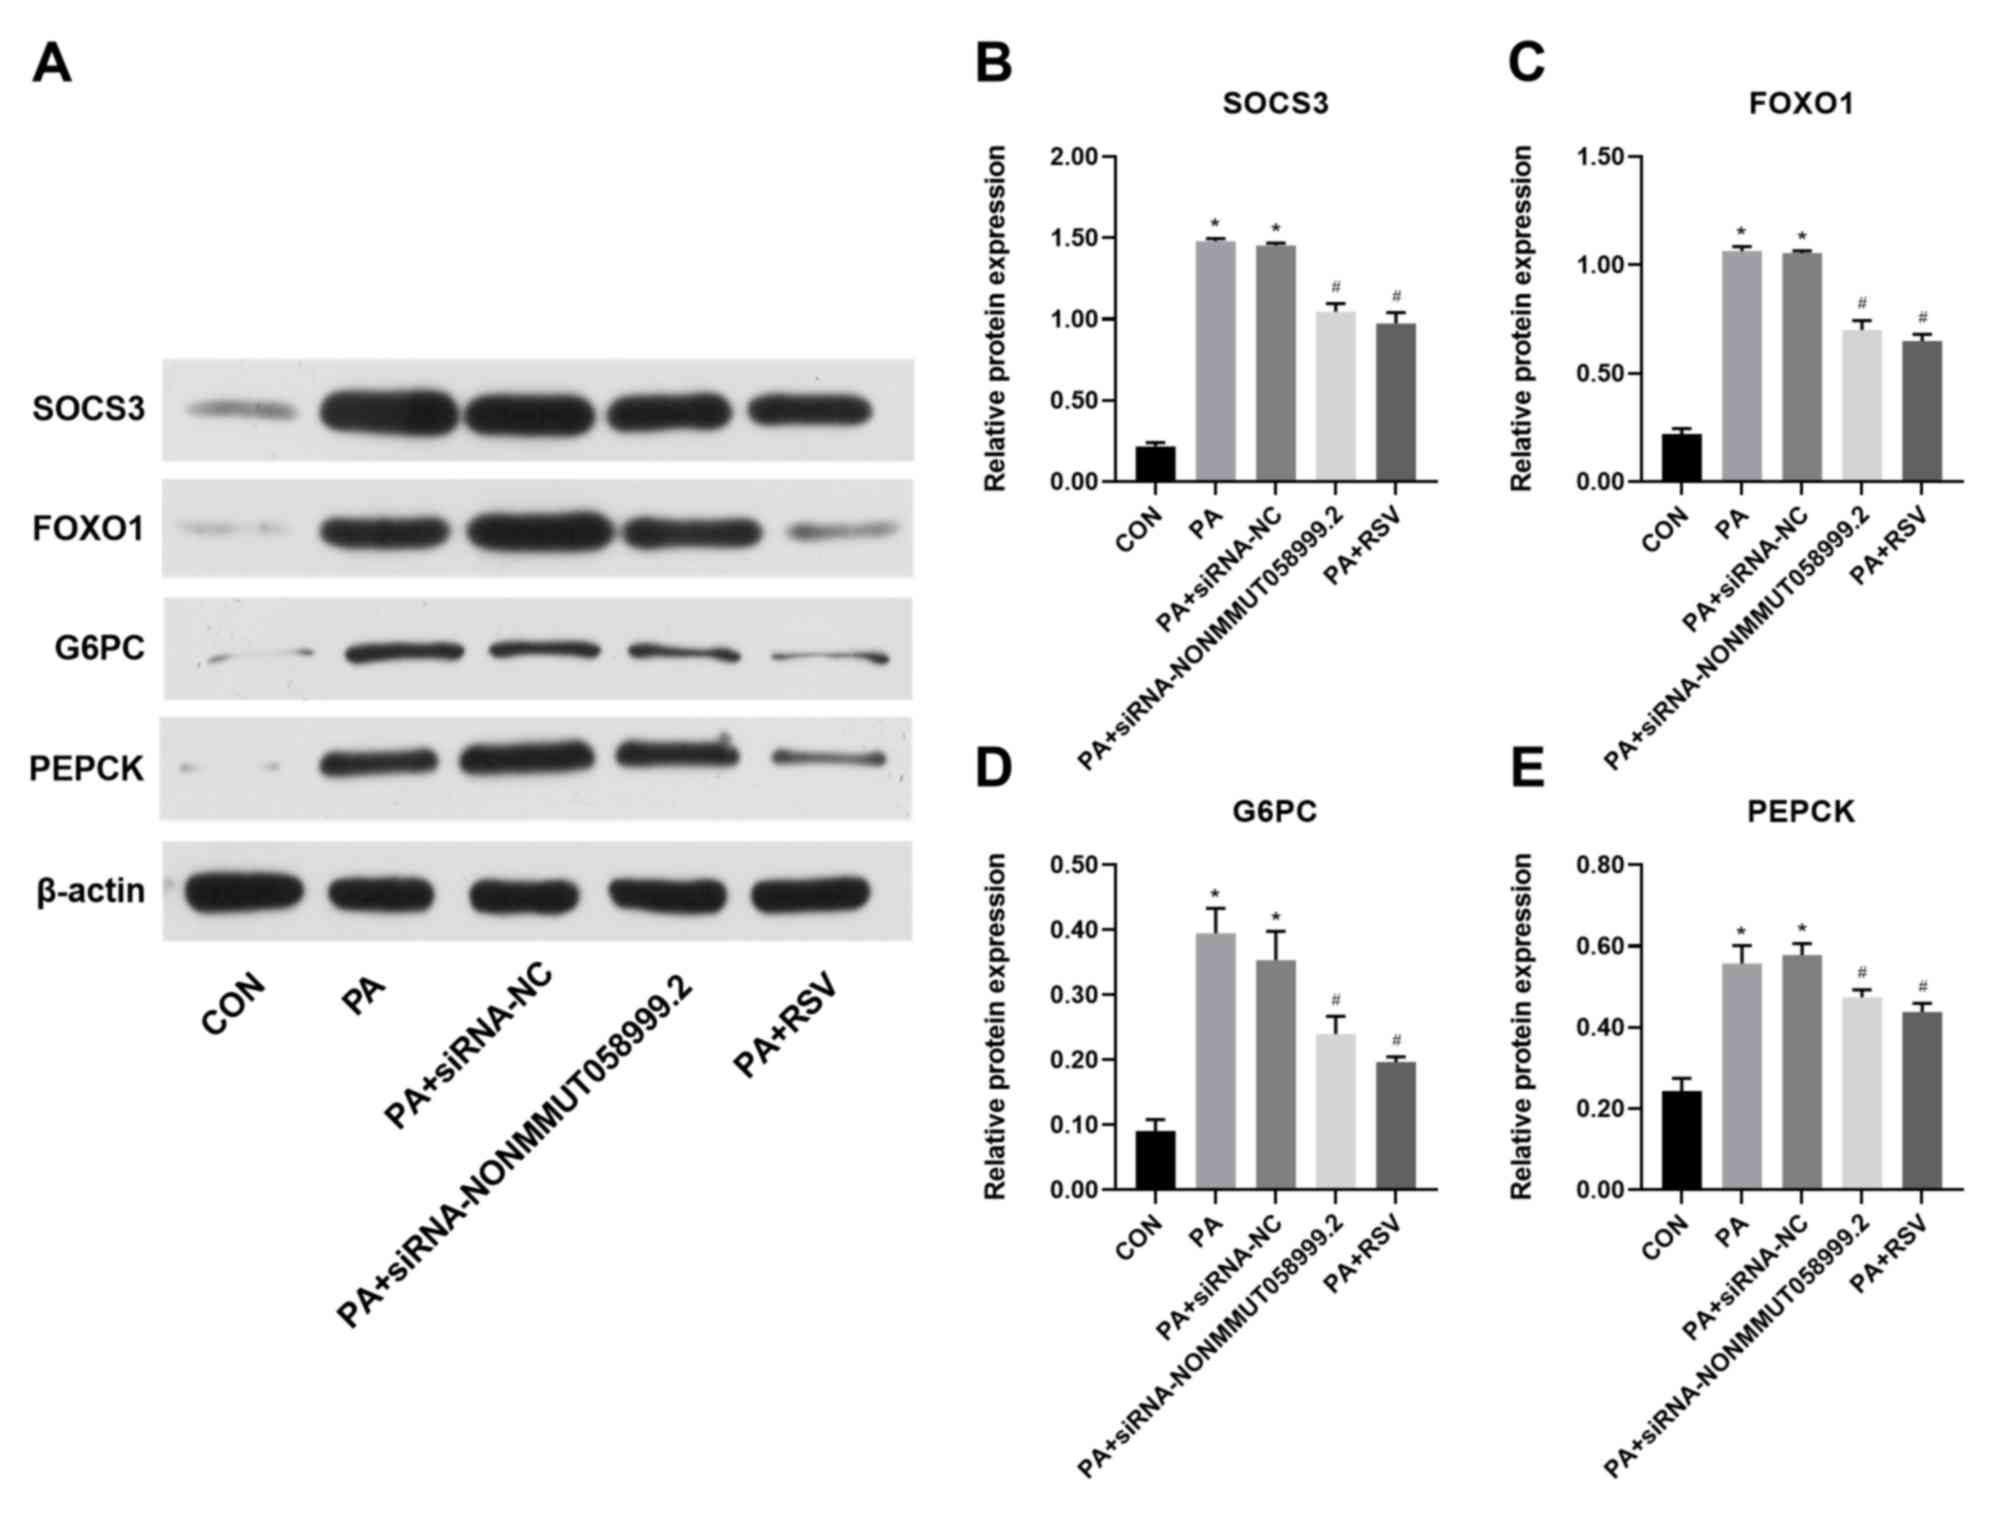
Effect of RSV on insulin signaling
pathway following knockdown of NONMMUT058999.2
From the eight selected lncRNAs, NONMMUT058999.2
exhibited the highest FPKM value. The pathway analysis revealed
that SOCS3 was associated with NONMMUT058999.2, presenting a
consistent trend. Following knockdown of NONMMUT058999.2, the
expression levels of SOCS3, FOXO1, G6PC and PEPCK were
significantly higher in PA compared with the CON group.
Furthermore, knockdown of NONMMUT058999.2 significantly decreased
the expression levels of SOCS3, FOXO1, G6PC and PEPCK. The
expression levels of SOCS3, FOXO1, G6PC and PEPCK were
significantly lower in the PA + RSV than in the PA group. Compared
with knockdown of NONMMUT058999.2, no significant changes in the
expression levels were observed for SOCS3, FOXO1, G6PC, and PEPCK
in the PA + RSV group (Fig.
9).
Discussion
RSV, a phytoalexin of polyphenols, has potential for
improving insulin resistance and treating metabolic diseases such
as diabetes (22). A previous
study demonstrated that RSV can activate insulin signaling
pathways, increase insulin sensitivity, protect pancreatic islet β
cells, decrease lipid production, stimulate fatty acid oxidation
and regulate intestinal flora (23). The liver is the primary site of
glucose and lipid metabolism and is sensitive to insulin. Metabolic
disorders associated with the liver can cause numerous metabolic
syndromes, the most common of which are obesity, diabetes and
non-alcoholic fatty liver disease (24). In type 2 diabetes, excessive
gluconeogenesis increases endogenous processes in grape skin
production, elevates blood sugar levels and induces IR (25). The gluconeogenesis pathway is
regulated by two rate-limiting enzymes, G6PC and PEPCK, which are
regulated by FOXO1 (26). FOXO1 is
a key molecule in the insulin signaling pathway and is regulated by
PI3K-AKT. Phosphorylated PI3K activates AKT, which affects
downstream pathways. AKT phosphorylation inhibits FOXO1
transcription, decreasing its expression level and further
inhibiting G6PC and PEPCK, thus lowering blood glucose levels and
improving IR (27). SOCS3 is a
negative feedback regulator of the cytokine activation pathway
(28). A previous study showed
that IR in diabetic mice is significantly improved following SOCS3
knockdown (29). The expression
level of SOCS3 in an insulin-resistant obese mice model was higher
than that in a normal group (30).
The expression level of SOCS3 is higher in patients with type 2
diabetes than that in the normal population (31). These studies suggest that SOCS3 is
associated with IR (32). SOCS3
can decrease phosphorylation or degrade protein expression levels
by competitively binding insulin receptor substrate 1 (IRSs-1),
decreasing the binding of IRSs-1 to PI3K, thus preventing
PI3K-Akt-FOXO1 signaling. The insulin signaling pathway increases
the expression levels of G6PC and PEPCK, which elevates blood
glucose and induces IR (33).
Previous studies have shown that lncRNA can adsorb
miRNAs by sponge adsorption. This forms competitive endogenous RNA
and affects the function of associated target genes, indirectly
regulating gene expression levels (34). In this way, lncRNAs are involved in
regulating epigenetics, and play a key role in human disease
(35). In type 2 diabetes, 55
lncRNAs were found to be differentially expressed in the blood of
patients with type 2 diabetes and normal healthy people, with the
three most significant differences associated with glycated
hemoglobin (36). A number of
lncRNAs are associated with IR and glucose levels in the peripheral
blood of patients with type 2 diabetes (36). However, to the best of our
knowledge, there have been few previous studies that have
demonstrated that lncRNAs in the hepatic insulin signaling pathway
are affected by RSV. The present study demonstrated the regulation
of lncRNAs in the insulin signaling pathway in a mouse model of IR
induced by HFD and RSV following HFD.
As demonstrated by high-throughput sequencing, there
were 58 differentially expressed lncRNAs and 96 differentially
expressed mRNAs in the HFD + RSV group compared with the HFD group.
Studies have shown that RSV can inhibit gluconeogenesis and improve
IR (37,38). A total of eight lncRNAs were
selected to verify that the RT-qPCR results were consistent with
the sequencing results, which showed that RSV altered the
expression levels of liver lncRNAs to improve IR. GO and KEGG
enrichment analysis of these 58 mRNAs reversed by RSV showed that
the insulin signaling pathway was most significantly associated
with these lncRNAs. The present study used pathway analysis to
predict which target genes SOCS3, G6PC, FOXO1 and PEPCK, are
associated with the insulin signaling pathway, which were then
verified using RT-qPCR and western blotting. Notably, lncRNA
NONMMUT058999.2 is associated with mRNA SOCS3, lncRNA
NONMMUT051901.2 and mRNA G6PC, which showed similar expression
level patterns. This suggests that RSV plays a role in improving IR
via NONMMUT058999.2 and NONMMUT051901.2, thus affecting the insulin
signaling pathway. Following NONMMUT058999.2 knockdown, the present
study analyzed changes in the insulin signaling pathway. RSV
improved IR via regulating the expression levels of SOCS3, FOXO1,
G6PC and PEPCK. Compared with knocked-down NONMMUT058999.2, no
significant changes in the expression levels were observed for
SOCS3, FOXO1, G6PC and PEPCK in PA+RSV. These results indicate that
the pharmacological effects of RSV are similar to the
downregulation of NONMMUT058999.2. RSV improves HFD-induced IR by
regulating NONMMUT058999.2. Similarly, RSV can improve IR via other
lncRNAs.
lncRNAs regulate mRNA expression levels via
cis and trans interactions and competitive binding
with miRNA (39). By combining
differential lncRNAs with differential mRNAs, the present study
found that HFD-induced downregulation of nine lncRNAs and their
corresponding mRNAs was reversed following RSV administration.
Additionally, the co-expression network suggests inter-regulation
of lncRNAs, miRNA and mRNAs. The present study demonstrated that
two lncRNAs, NONMMUT147434.1 and NONMMUT145297.1, regulate the
majority of miRNAs in this network. NONMMUT147434.1 regulates
mmu-miR-1195, mmu-miR-3104-5p, mmu-miR-709, mmu-miR-7667-5p and
mmu-miR-574-5p. NONMMUT145297.1 regulates mmu-miR-3473b,
mmu-miR-3473e, mmu-miR-7032-5p, mmu-miR-328-5p and mmu-miR-466i-5p.
A previous study showed that lncRNAs regulate mRNA expression
levels via competitive binding with miRNA (40). These core lncRNAs may play a key
role in improving IR (41).
Although the exact mechanism of action of these lncRNAs remains
unknown, the results of the present study provide a foundation for
the development of novel diabetes treatments.
In conclusion, high-throughput sequencing revealed
that lncRNAs were abnormally expressed following RSV intervention.
These lncRNAs may be involved in the incidence and progression of
type 2 diabetes. Further analysis suggested that lncRNAs play a
role in the insulin signaling pathway, and that RSV may improve
hepatic IR by regulating lncRNAs. The present study identified a
novel biomarker or intervention target for RSV in the treatment of
diabetes and contributes to understanding of the hypoglycemic
mechanism of RSV. However, the functions and precise regulatory
mechanisms of specific lncRNAs involved in improving IR require
further investigation.
RSV can improve hepatic IR by regulating lncRNAs.
RSV-regulated lncRNAs are potential therapeutic targets for type 2
diabetes.
Acknowledgements
Not applicable.
Funding
The present study was funded by the Natural Science
Foundation of Hebei Province (grant no. H2018307071).
Availability of data and materials
The datasets used and/or analyzed during the current
study are available from the corresponding author on reasonable
request.
Authors' contributions
LS performed the experiments, analyzed the data and
wrote the manuscript. GH performed the experiments and prepared the
figures. HZ and WH established the mouse model. GS and HM designed
the study and edited drafts of the manuscript. All authors
contributed to data analysis, drafting or revising the article and
agreed to be accountable for all aspects of the work. All authors
read and approved the final manuscript.
Ethics approval and consent to
participate
The experiment was supervised and approved by the
Ethics Committee of the People's Hospital of Hebei Province
(approval no. 201920) and performed in accordance with the
Regulations on the Administration of Laboratory Animals.
Patient consent for publication
Not applicable.
Competing interests
The authors declare that they have no competing
interests.
Glossary
Abbreviations
Abbreviations:
|
BP
|
biological process
|
|
CC
|
cellular component
|
|
FOXO1
|
forkhead box O1
|
|
G6PC
|
glucose-6-phosphatase catalytic
subunit
|
|
HFD
|
high-fat diet
|
|
MF
|
molecular function
|
|
miRNA
|
microRNA
|
|
PEPCK
|
phosphoenolpyruvate carboxykinase
|
|
SOCS3
|
suppressor of cytokine signaling 3
|
References
|
1
|
Ogurtsova K, da Rocha Fernandes JD, Huang
Y, Linnenkamp U, Guariguata L, Cho NH, Cavan D, Shaw JE and
Markaroff LE: IDF Diabetes Atlas: Global estimates for the
prevalence of diabetes for 2015 and 2040. Diabetes Res Clin Pract.
128:40–50. 2017. View Article : Google Scholar : PubMed/NCBI
|
|
2
|
Akash MSH, Rehman K and Liaqat A: Tumor
necrosis factor-alpha: Role in development of insulin resistance
and pathogenesis of type 2 diabetes mellitus. J Cell Biochem.
119:105–110. 2018. View Article : Google Scholar : PubMed/NCBI
|
|
3
|
Rehman K, Akash MSH, Liaqat A, Kamal S,
Qadir MI and Rasul A: Role of interleukin-6 in development of
insulin resistance and type 2 diabetes mellitus. Crit Rev Eukaryot
Gene Expr. 27:229–236. 2017. View Article : Google Scholar : PubMed/NCBI
|
|
4
|
Ku CR, Lee HJ, Kim SK, Lee EY, Lee MK and
Lee EJ: Resveratrol prevents streptozotocin-induced diabetes by
inhibiting the apoptosis of pancreatic β-cell and the cleavage of
poly (ADP-ribose) polymerase. Endocr J. 59:103–109. 2012.
View Article : Google Scholar : PubMed/NCBI
|
|
5
|
Li Q, Yue Y, Chen L, Xu C, Wang Y, Du L,
Xue X, Liu Q, Wang Y and Fan F: Resveratrol sensitizes
carfilzomib-induced apoptosis via promoting oxidative stress in
multiple myeloma cells. Front Pharmacol. 9:3342018. View Article : Google Scholar : PubMed/NCBI
|
|
6
|
Zhu X, Wu C, Qiu S, Yuan X and Li L:
Effects of resveratrol on glucose control and insulin sensitivity
in subjects with type 2 diabetes: Systematic review and
meta-analysis. Nutr Metab (Lond). 14:602017. View Article : Google Scholar : PubMed/NCBI
|
|
7
|
Abbasi Oshaghi E, Goodarzi MT, Higgins V
and Adeli K: Role of resveratrol in the management of insulin
resistance and related conditions: Mechanism of action. Crit Rev
Clin Lab Sci. 54:267–293. 2017. View Article : Google Scholar : PubMed/NCBI
|
|
8
|
Zhao H, Shu L, Huang W, Song G and Ma H:
Resveratrol affects hepatic gluconeogenesis via histone deacetylase
4. Diabetes Metab Syndr Obes. 12:401–411. 2019. View Article : Google Scholar : PubMed/NCBI
|
|
9
|
Hang Z, Yunjia Z, Linyi S, Guangyao S and
Huijuan M: Resveratrol reduces liver endoplasmic reticulum stress
and improves insulin sensitivity in vivo and in vitro. Drug Des Dev
Ther. 13:1473–1485. 2019. View Article : Google Scholar
|
|
10
|
Wang X, Chang X, Zhang P, Fan L, Zhou T
and Sun K: Aberrant expression of long non-coding RNAs in newly
diagnosed type 2 diabetes indicates potential roles in chronic
inflammation and insulin resistance. Cell Physiol Biochem.
43:2367–2378. 2017. View Article : Google Scholar : PubMed/NCBI
|
|
11
|
Gao Y, Wu F, Zhou J, Yan L, Jurczak MJ,
Lee HY, Yang L, Mueller M, Zhou XB, Dandolo L, et al: The H19/let-7
double-negative feedback loop contributes to glucose metabolism in
muscle cells. Nucleic Acids Res. 42:13799–13811. 2014. View Article : Google Scholar : PubMed/NCBI
|
|
12
|
Shu L, Zhao H, Huang W, Hou G, Song G and
Ma H: Resveratrol Upregulates mmu-miR-363-3p via the PI3K-Akt
pathway to improve insulin resistance induced by a high-fat diet in
mice. Diabetes Metab Syndr Obes. 13:391–403. 2020. View Article : Google Scholar : PubMed/NCBI
|
|
13
|
Buchfink B, Xie C and Huson DH: Fast and
sensitive protein alignment using DIAMOND. Nat Methods. 12:59–60.
2015. View Article : Google Scholar : PubMed/NCBI
|
|
14
|
Robinson MD, McCarthy DJ and Smyth GK:
edgeR: A Bioconductor package for differential expression analysis
of digital gene expression data. Bioinformatics. 26:139–140. 2010.
View Article : Google Scholar : PubMed/NCBI
|
|
15
|
Zou Q, Mao Y, Hu L, Wu Y and Ji Z:
miRClassify: An advanced web server for miRNA family classification
and annotation. Comput Biol Med. 45:157–160. 2014. View Article : Google Scholar : PubMed/NCBI
|
|
16
|
Livak KJ and Schmittgen TD: Analysis of
relative gene expression data using real-time quantitative PCR and
the 2(-Delta Delta C(T)) method. Methods. 25:402–408. 2001.
View Article : Google Scholar : PubMed/NCBI
|
|
17
|
Zhang H, Ge Z, Tang S, Meng R, Bi Y and
Zhu D: Erythropoietin ameliorates PA-induced insulin resistance
through the IRS/AKT/FOXO1 and GSK-3β signaling pathway, and
inhibits the inflammatory response in HepG2 cells. Mol Med Rep.
16:2295–2301. 2017. View Article : Google Scholar : PubMed/NCBI
|
|
18
|
Shu L, Hou G, Zhao H, Huang W, Song G and
Ma H: Resveratrol improves high-fat diet-induced insulin resistance
in mice by downregulating the lncRNA NONMMUT008655.2. Am J Transl
Res. 12:1–18. 2020.PubMed/NCBI
|
|
19
|
Li B and Dewey C: RSEM: Accurate
transcript quantification from RNA-Seq data with or without a
reference genome. BMC Bioinformatics. 12:3232011. View Article : Google Scholar : PubMed/NCBI
|
|
20
|
Grabherr MG, Haas BJ, Yassour M, Levin JZ,
Thompson DA, Amit I, Adiconis X, Fan L, Raychowdhury R, Zeng Q, et
al: Trinity: Reconstructing a full-length transcriptome without a
genome from RNA-Seq data. Nat Biotechnol. 29:644–652. 2011.
View Article : Google Scholar : PubMed/NCBI
|
|
21
|
Brasnyó P, Molnár GA, Mohás M, Markó L,
Laczy B, Cseh J, Mikolás E, Szijártó IA, Mérei A, Halmai R, et al:
Resveratrol improves insulin sensitivity, reduces oxidative stress
and activates the Akt pathway in type 2 diabetic patients. Br J
Nutr. 106:383–389. 2011. View Article : Google Scholar : PubMed/NCBI
|
|
22
|
Thiel G and Rössler OG: Resveratrol
regulates gene transcription via activation of stimulus-responsive
transcription factors. Pharmacol Res. 117:166–176. 2017. View Article : Google Scholar : PubMed/NCBI
|
|
23
|
Rezaei Farimani A, Goodarzi MT, Saidijam
M, Yadegarazari R, Zarei S and Asadi S: Effect of resveratrol on
SNARE proteins expression and insulin resistance in skeletal muscle
of diabetic rats. Iran J Basic Med Sci. 22:1408–1414.
2019.PubMed/NCBI
|
|
24
|
Kim J, Bilder D and Neufeld TP: Mechanical
stress regulates insulin sensitivity through integrin-dependent
control of insulin receptor localization. Genes Dev. 32:156–164.
2018. View Article : Google Scholar : PubMed/NCBI
|
|
25
|
Hatting M, Tavares CDJ, Sharabi K, Rines
AK and Puigserver P: Insulin regulation of gluconeogenesis. Ann N Y
Acad Sci. 1411:21–35. 2018. View Article : Google Scholar : PubMed/NCBI
|
|
26
|
Langlet F, Haeusler RA, Lindén D, Ericson
E, Norris T, Johansson A, Cook JR, Aizawa K, Wang L, Buettner C and
Accili D: Selective inhibition of FOXO1 activator/repressor balance
modulates hepatic glucose handling. Cell. 171:824–835.e18. 2017.
View Article : Google Scholar : PubMed/NCBI
|
|
27
|
McCurdy CE, Schenk S, Holliday MJ, Philip
A, Houck JA, Patsouris D, MacLean PS, Majka SM, Klemm DJ and
Friedman JE: Attenuated Pik3r1 expression prevents insulin
resistance and adipose tissue macrophage accumulation in
diet-induced obese mice. Diabetes. 61:2495–505. 2012. View Article : Google Scholar : PubMed/NCBI
|
|
28
|
Ma Z, Gong Y, Patel V, Karner CM, Fischer
E, Hiesberger T, Carroll TJ, Pontoglio M and Igarashi P: Mutations
of HNF-1beta inhibit epithelial morphogenesis through dysregulation
of SOCS-3. Proc Natl Acad Sci USA. 104:20386–20391. 2007.
View Article : Google Scholar : PubMed/NCBI
|
|
29
|
Galic S, Sachithanandan N, Kay TW and
Steinberg GR: Suppressor of cytokine signalling (SOCS) proteins as
guardians of inflammatory responses critical for regulating insulin
sensitivity. Biochem J. 461:177–188. 2014. View Article : Google Scholar : PubMed/NCBI
|
|
30
|
Fang S, Feng J, Zhang H, Li P, Zhang Y,
Zeng Y, Cai Y, Lin X, Xue Y and Guan M: MiR-455 targeting SOCS3
improve liver lipid disorders in diabetic mice. Adipocyte.
9:179–188. 2020. View Article : Google Scholar : PubMed/NCBI
|
|
31
|
Pedroso JA, Buonfiglio DC, Cardinali LI,
Furigo IC, Ramos-Lobo AM, Tirapegui J, Elias CF and Donato J Jr:
Inactivation of SOCS3 in leptin receptor-expressing cells protects
mice from diet-induced insulin resistance but does not prevent
obesity. Mol Metab. 3:608–618. 2014. View Article : Google Scholar : PubMed/NCBI
|
|
32
|
Abo El-Nasr NME, Saleh DO, Mahmoud SS,
Nofal SM, Abdelsalam RM, Safar MM and El-Abhar HS: Olmesartan
attenuates type 2 diabetes-associated liver injury: Cross-talk of
AGE/RAGE/JNK, STAT3/SCOS3 and RAS signaling pathways. Eur J
Pharmacol. 874:1730102020. View Article : Google Scholar : PubMed/NCBI
|
|
33
|
Terán-Cabanillas E and Hernández J: Role
of leptin and SOCS3 in inhibiting the type I interferon response
during obesity. Inflammation. 40:58–67. 2017. View Article : Google Scholar : PubMed/NCBI
|
|
34
|
Qi X, Zhang DH, Wu N, Xiao JH, Wang X and
Ma W: ceRNA in cancer: Possible functions and clinical
implications. J Med Genet. 52:710–718. 2015. View Article : Google Scholar : PubMed/NCBI
|
|
35
|
Dong C, Liu S, Li Y and Cui Y: Serum
lncRNA HAND2-AS1 is downregulated in diabetic patients with chronic
renal failure and ameliorates cell apoptosis. Diabetol Metab Syndr.
12:392020. View Article : Google Scholar : PubMed/NCBI
|
|
36
|
Sathishkumar C, Prabu P, Mohan V and
Balasubramanyam M: Linking a role of lncRNAs (long non-coding RNAs)
with insulin resistance, accelerated senescence, and inflammation
in patients with type 2 diabetes. Hum Genomics. 12:412018.
View Article : Google Scholar : PubMed/NCBI
|
|
37
|
Zhao H, Chen S, Gao K, Zhou Z, Wang C,
Shen Z, Guo Y, Li Z, Wan Z, Liu C and Mei X: Resveratrol protects
against spinal cord injury by activating autophagy and inhibiting
apoptosis mediated by the SIRT1/AMPK signaling pathway.
Neuroscience. 348:241–251. 2017. View Article : Google Scholar : PubMed/NCBI
|
|
38
|
González-Rodríguez Á, Santamaría B,
Mas-Gutierrez JA, Rada P, Fernández-Millán E, Pardo V, Álvarez C,
Cuadrado A, Ros M, Serrano M and Valverde AM: Resveratrol treatment
restores peripheral insulin sensitivity in diabetic mice in a
sirt1-independent manner. Mol Nutr Food Res. 59:1431–1442. 2015.
View Article : Google Scholar : PubMed/NCBI
|
|
39
|
Guttman M and Rinn JL: Modular regulatory
principles of large non-coding RNAs. Nature. 482:339–346. 2012.
View Article : Google Scholar : PubMed/NCBI
|
|
40
|
Ren XY, Han YD and Lin Q: Long non-coding
RNA MIR155HG knockdown suppresses cell proliferation, migration and
invasion in NSCLC by upregulating TP53INP1 directly targeted by
miR-155-3p and miR-155-5p. Eur Rev Med Pharmacol Sci. 24:4822–4835.
2020.PubMed/NCBI
|
|
41
|
Chen K, Ma Y, Wu S, Zhuang Y, Liu X, Lv L
and Zhang G: Construction and analysis of a lncRNA-miRNA-mRNA
network based on competitive endogenous RNA reveals functional
lncRNAs in diabetic cardiomyopathy. Mol Med Rep. 20:1393–1403.
2019.PubMed/NCBI
|