Introduction
Human intestinal barriers are important in
facilitating the absorption of nutrients and the prevention of
bacterial invasion (1). However,
numerous pathological conditions, including severe acute
pancreatitis (2), inflammatory
bowel disease (3) and infectious
diarrheal syndromes, may lead to intestinal barrier dysfunction
(IBD). Furthermore, macrophages have an important role in IBD. One
of the major pathophysiological changes in IBD is the
overactivation of the inflammatory response, with intestinal
macrophages acting as the most important effector cells in this
response. Macrophages are the core cells that initiate and regulate
the inflammatory reaction, and therefore, their activation and
dysfunction are associated with IBD development (4).
Protein-coding genes only represent a small portion
of the human genome (<2%), while the majority of the genome is
transcribed into non-coding RNAs (ncRNAs) (5–7).
Long ncRNA (lncRNA) transcripts lack significant open reading
frames and are composed of molecules >200 nucleotides in length
(8). Initially, lncRNAs were
considered as transcriptional artifacts; however, they were then
revealed to have important regulatory roles that remain to be fully
elucidated in detail. With the development of lncRNA microarrays,
high-throughput sequencing and bioinformatics, an increasing number
of lncRNAs have been identified. LncRNAs have attracted
considerable attention in the research fields of molecular biology
and biomedical science. Functionally, lncRNAs regulate gene
expression at the epigenetic, transcriptional and
post-transcriptional levels and are involved in several biological
processes, including genomic imprinting, chromosome dosage
compensation, X chromosome silencing, chromosome modification,
intra-nuclear transport and transcriptional activation (4,9).
Recent studies have suggested that lncRNAs participate in various
complex human diseases, including aging, hematopoiesis,
neurobiology, cancer, muscle biology and immunology (10–16).
Several studies have indicated that lncRNA H19 may regulate the
intestinal epithelial barrier (17,18),
whereas the expression of lncRNA cyclin-dependent kinase inhibitor
2B antisense 1 has been associated with inflammatory bowel disease
and intestinal barrier formation (19).
Macrophages have been considered to be important
effectors of the inflammatory response, which in turn may be
regulated by lncRNAs (20,21). However, the potential association
between lncRNAs and macrophages/monocytes in post-IBD has remained
to be fully investigated. Therefore, in the present study, an in
vitro cell model was established to investigate the expression
profiles of lncRNAs and mRNAs in macrophages. The aim of the
present study was to determine the expression profiles of lncRNAs
and mRNAs in lipopolysaccharide (LPS)-induced rat macrophages and
to provide a direction for further studies.
Materials and methods
Materials
A total of six Sprague-Dawley (SD) rats (female and
male, 6–8 weeks, weight, 200–250 g) were provided by the Yangzhou
University Experimental Animal Center. RPMI-1640 medium, fetal
bovine serum (FBS), penicillin and streptomycin were purchased from
Hyclone (Cytiva). Isotonic cell separation solution (Percoll
solution) and collagenase IV were obtained from Worthington
Biochemical Corp. The primary rabbit polyclonal antibody against
CD14 (cat. no. AF2128; Beyotime Institute of Biotechnology) was
diluted at 1:300 prior to use, whereas the secondary
FITC-conjugated goat anti-rabbit IgG (H+L) (Beyotime Institute of
Biotechnology) was diluted at 1:50.
Furthermore, total RNA was extracted with a TRIzol
reagent (Invitrogen; Thermo Fisher Scientific, Inc.) according to
the manufacturer's protocol. RNA quantity and quality were measured
using the NanoDrop ND-1000 spectrophotometer (PeqLab). RNA
integrity was evaluated by agarose gel electrophoresis on the
Agilent 2100 Bioanalyzer (Agilent Technologies, Inc.). In the
present study, the following materials were also used:
Primers/probes; TRIzol reagent (cat. no. 15596-026); diethyl
pyrocarbonate-treated H2O (cat. no. 750024),
SuperScriptIII reverse transcriptase (cat. no. R250-01); SYBR-Green
I (cat. no. CS7561); oligo Dt/random primers/specific primers;
Platinum Taq DNA polymerase (cat. no. 10966034); 100 mM
deoxyribonucleoside triphosphates (cat. no. 18427013; all from
Invitrogen; Thermo Fisher Scientific, Inc.); miRNAeasy Mini kit
(cat. no. 217184; Qiagen); avantin; and RNase inhibitor (cat. no.
E00381; Fermentas; Thermo Fisher Scientific, Inc.).
Isolation of intestinal
macrophages
SD rats were housed in individual cages and
maintained at 21–23°C and 60±10% humidity on a 12 h light/dark
schedule. The rats were acclimatized for one week prior to any
experimental procedure and had free access to standard rat chow and
water. All animal experiments were approved by the Ethics Committee
of the Affiliated Hospital of Jiangsu University (Zhenjiang, China)
and were performed in compliance with the guidelines specified by
the Institutional Ethics Board. All animal experiments were also in
compliance with the Animal Research: Reporting of In Vivo
Experiments guidelines (22,23).
All efforts were made to minimize the number of animals used and
their suffering. Rats were anesthetized with an intraperitoneal
injection of 40 mg/kg sodium pentobarbital and were subsequently
dissected to remove the whole intestine. Following the isolation of
the entire small intestine from a rat by a 5-min experimental
procedure, the SD rats were sacrificed by decapitation. The
experimental time for isolation of intestinal macrophages from the
six rats was 1 week. Each rat was processed individually for
sampling. Intestines were opened longitudinally, washed with cold
PBS (pH 7.4), placed in Hank's balanced salt solution (HBSS)
containing 1 g/l EDTA and incubated in a 37°C water bath with
gentle agitation for 60 min. The supernatant was subsequently
discarded, collagenase IV (5 g/l) was added and the tissue was
incubated for an additional 2 h. The mixture was poured through a
400-mesh screen filter and subsequently, the resulting cells were
washed with HBSS, suspended in 500 g/l cell separation isotonic
solution (Beyotime Institute of Biotechnology) and centrifuged at
733 × g at 4°C for 15 min. The resulting pellet containing the
intestinal macrophages was washed three times with HBSS without
calcium and magnesium and cells were stained with trypan blue. The
viability of macrophages following treatment was ~85%. Intestinal
macrophages were cultured in RPMI-1640 medium supplemented with 10
g/l FBS, 100 µg/ml penicillin and 100 U/ml streptomycin. Following
dilution to a density of 5×l05 cells/ml, 2 ml and 200 µl
of macrophage suspension were seeded into 6 and 96-well culture
plates, respectively. The plates were then incubated at 37°C in a
humidified incubator with 5% CO2. Macrophages were
divided into two groups, namely the control group (without LPS) and
the experimental group (treated with LPS at a concentration of 1
mg/l). A total of three experimental and three control groups were
used for repeated experiments, so that that one experimental and
one control group with three samples each were used. Following the
addition of LPS, cells were cultured for 6 h and total RNA was
extracted. The LPS concentration was selected according to a
previous study (24).
Identification of intestinal
macrophages
In general, intestinal macrophages lack the
expression of the innate immune receptor CD14 and do not secrete
pro-inflammatory cytokines in response to commensal bacterial
infection. In a previous study, a unique macrophage subset in the
human intestine was identified. This macrophage subset secreted
larger amounts of CD14-associated pro-inflammatory cytokines
compared with typical intestinal resident CD14−
CD33+ macrophages (25).
For the identification of intestinal macrophages,
cells were seeded into 24-well plates and allowed to attach. Once
optimal cell growth was achieved (the density was moderate, the
cells were connected in a spindle shape, the adhesion was good, and
the confluence had reached ~95%), the culture medium was removed,
cells were rinsed twice with PBS for 10 min and fixed with 1 ml of
4°C pre-cooled methanol. Subsequently, cells were incubated with
CD14 rabbit polyclonal antibody (dilution, 1:300) overnight at 4°C.
Cells were then incubated with FITC-conjugated goat anti-rabbit IgG
(H+L; dilution, 1:50) at 37°C for 1 h, washed three times with PBS
and images were captured under a fluorescence microscope. Green
fluorescence indicated a positive signal.
Total RNA extraction
Cells were cultured in the presence of LPS (1 mg/ml)
for 6 h and total RNA was extracted using a TRIzol reagent
according to the manufacturer's protocol. RNA quality was
determined using a Nanodrop 2000 Spectrometer (Thermo Fisher
Scientific, Inc.) and RNA integrity was assessed by visualization
of the 28S and 18S ribosomal (r)RNA bands on an agarose gel.
Following removal of rRNA, the purified RNA was amplified and
reverse transcribed into fluorescent complementary (c)DNA using a
Quick Amp Labeling kit (Agilent Technologies, Inc.) according to
the manufacturer's protocol.
Microarray analysis
GeneChip Mouse Transcriptome Array 1.0 (Affymetrix;
Thermo Fisher Scientific, Inc.) is considered as the most powerful
and flexible tool for measuring a broad range of expression
profiles across the whole mouse transcriptome. Therefore, this tool
was used in the present study.
Differentially expressed (DE) lncRNAs and mRNAs
demonstrating statistical significances were identified by volcano
plot filtering and hierarchical clustering. Subsequently, the
purified RNA was reverse-transcribed into cDNA according to the
requirements set by GMINIX BioTech. The cDNA was then fragmented,
labeled with fluorescent dyes and hybridization was performed in a
GeneChip Hybridization Oven 645 (Affymetrix; Thermo Fisher
Scientific, Inc.). Following chip washing, arrays were scanned with
the GeneChip Scanner (Affymetrix; Thermo Fisher Scientific, Inc.)
to determine fluorescence intensity. Imaging data were saved and
probe summarization was performed using the Expression Console
software (v.1.3.1.187; Affymetrix; Thermo Fisher Scientific, Inc.).
The significance analysis of the microarray data was used to
identify DE lncRNAs and mRNAs. Following significant and
false-discovery rate analyses, the significance threshold for the
upregulated and downregulated genes was set to a fold change of
>1.5 and P≤0.05. In the present study, variance was relatively
low; therefore, cut-off values were set to ≥1.5-fold and ≤0.66-fold
change for upregulated and downregulated genes, respectively
(26,27). Fold modification provided more
significant insight, with 1.5 considered as a good eliminator of
background noise. As the fold change level increased to ≥2, the
number of genes significantly decreased.
Gene Ontology (GO) analysis
GO analysis (http://www.geneontology.org) was applied to analyze
the function of DE genes (DEGs). GO is the key functional
classification tool associated with the National Center for
Biotechnology Information. It organizes genes into hierarchical
categories to determine the gene regulatory networks in the
categories biological process, molecular function and cellular
component.
Pathway enrichment analysis
Pathway enrichment analysis was used to determine
the significant pathways associated with DEGs according to Kyoto
Encyclopedia of Genes and Genomes (KEGG) (http://www.genome.jp/kegg/pathway.html), Biocarta
(https://cgap.nci.nih.gov/Pathways/BioCarta_Pathways)
and Reactome databases (https://reactome.org/).
lncRNA-mRNA network
A lncRNA-mRNA network was constructed to identify
the interactions between genes and lncRNAs. Pearson's correlation
coefficient (PCC) was calculated and the R-value was used to
compare the PCC of the correlation between lncRNAs and coding
genes. Network structure analysis was further performed to identify
the core regulatory factors (genes). Finally, a coding-non-coding
gene co-expression network was constructed by selecting the
significantly co-expressed lncRNAs and mRNAs.
Reverse transcription-quantitative PCR
(RT-qPCR) analysis
Total RNA from treated cells was isolated using
TRIzol reagent and reverse-transcribed into cDNA with SuperScript
III reverse transcriptase (both from Invitrogen; Thermo Fisher
Scientific, Inc.). The expression levels of lncRNAs or mRNAs were
detected using RT-qPCR. The specific primers are listed in Table I. lncRNA expression levels were
normalized to the expression of 18S rRNA according to the
double-standard curves method (8).
The primers for β-actin amplification are mentioned in Table I. Calculations were performed in
Excel 15.0.5249.1001 (Microsoft Corp.) using equations provided by
Applied Biosystems (Thermo Fisher Scientific, Inc.). The SYBR-Green
(GMINIX BioTech) dye detection method and a CFX96™ Real-Time System
(Bio-Rad Laboratories, Inc.) were used to perform qPCR analysis.
The qPCR conditions were as follows: 95°C for 2 min and 40 cycles
of 10 sec at 95°C, 60°C for 30 sec and 70°C for 45 sec. Melting
curve analysis was performed at 65–95°C for 10 sec, with a 0.5°C
increment per read and a hold time of 5 sec. Three samples in the
experimental group and three samples in the control group were
analyzed. All samples were normalized to β-actin and each
experiment was repeated three times.
 | Table I.Primer sequences used to detect the
expression of long non-coding RNA and mRNA by quantitative PCR. |
Table I.
Primer sequences used to detect the
expression of long non-coding RNA and mRNA by quantitative PCR.
| Primer name | Sequences
(5′→3′) |
|---|
|
NONMMUT047081-F |
TCAATTCCAGGACTCTGGATGC |
|
NONMMUT047081-R |
GGATGGGTCTTCTAATTGCACC |
|
NONMMUT024673-F |
TGTTGGGATGTCAGCTCTGC |
|
NONMMUT024673-R |
TGGGCTGTGACGGACTAAAC |
| MUS-TNF-F |
ACCGTCAGCCGATTTGCTAT |
| MUS-TNF-R |
CTCCAAAGTAGACCTGCCCG |
| MUS-MALT1-F |
CATCCCAAGCTTAAAGCGCC |
| MUS-MALT1-R |
TTCATAACCGTGCCCTGCAT |
| MUS-TLR4-F |
CTGGGGAGGCACATCTTCTG |
| MUS-TLR4-R |
TCAGGTCCAAGTTGCCGTTT |
| MUS-IL15-F |
GGGCTGTGTCAGTGTAGGTC |
| MUS-IL15-R |
GACAGAGTGCTGTTTGCAAGG |
| β-actin-F |
AGCGAGCATCCCCCAAAGTT |
| β-actin-R |
GGGCACGAAGGCTCATCATT |
Statistical analysis
The random variance model (RVM)-modified t-test,
combining a two-samples t-test with RVM, was performed to analyze
DE lncRNAs and mRNAs using the BRB-arrayTools package (v.4.3.2;
Biometrics Research Branch National Cancer Institute). DE lncRNAs
were further analyzed by hierarchical clustering using the cluster
3.0 (http://bonsai.hgc.jp/~mdehoon/software/cluster/software.htm)
and TreeView tools (http://jtreeview.sourceforge.net/). Furthermore, GO
and pathway enrichment analyses were performed and data were
analyzed by Fisher's exact test. A paired-samples t-test was used
to analyze the RT-qPCR results (GraphPad Prism 5.00; GraphPad
Software, Inc.). P<0.05 was considered to indicate a
statistically significant difference.
Results
Isolation and identification of
intestinal macrophages
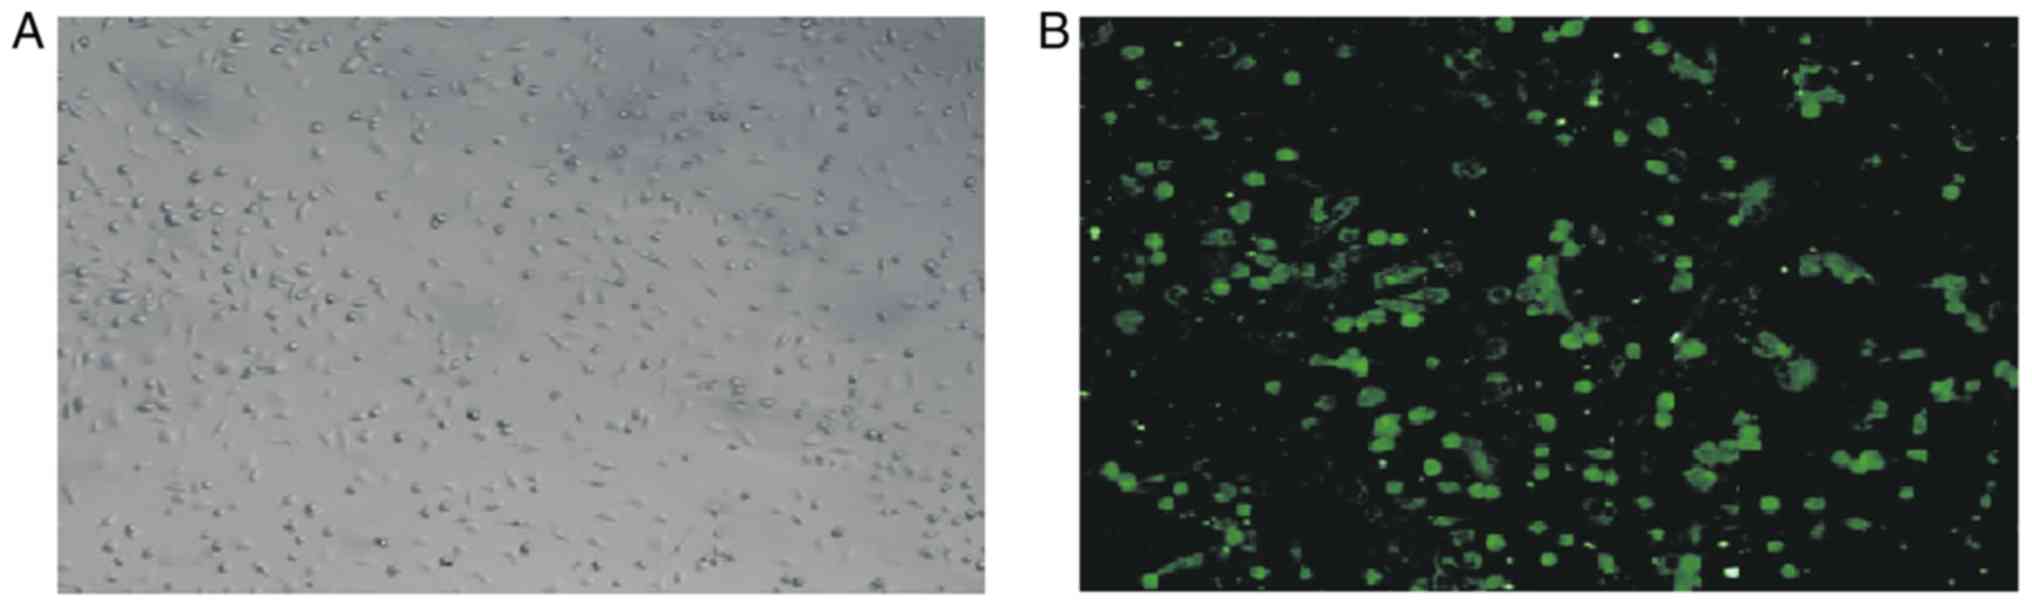
Intestinal macrophages were identified by their
cellular morphology under a microscope (Fig. 1A). A positive signal for intestinal
macrophages was indicated by green fluorescence of FITC-labeled
CD14 under a fluorescence microscope (Fig. 1B).
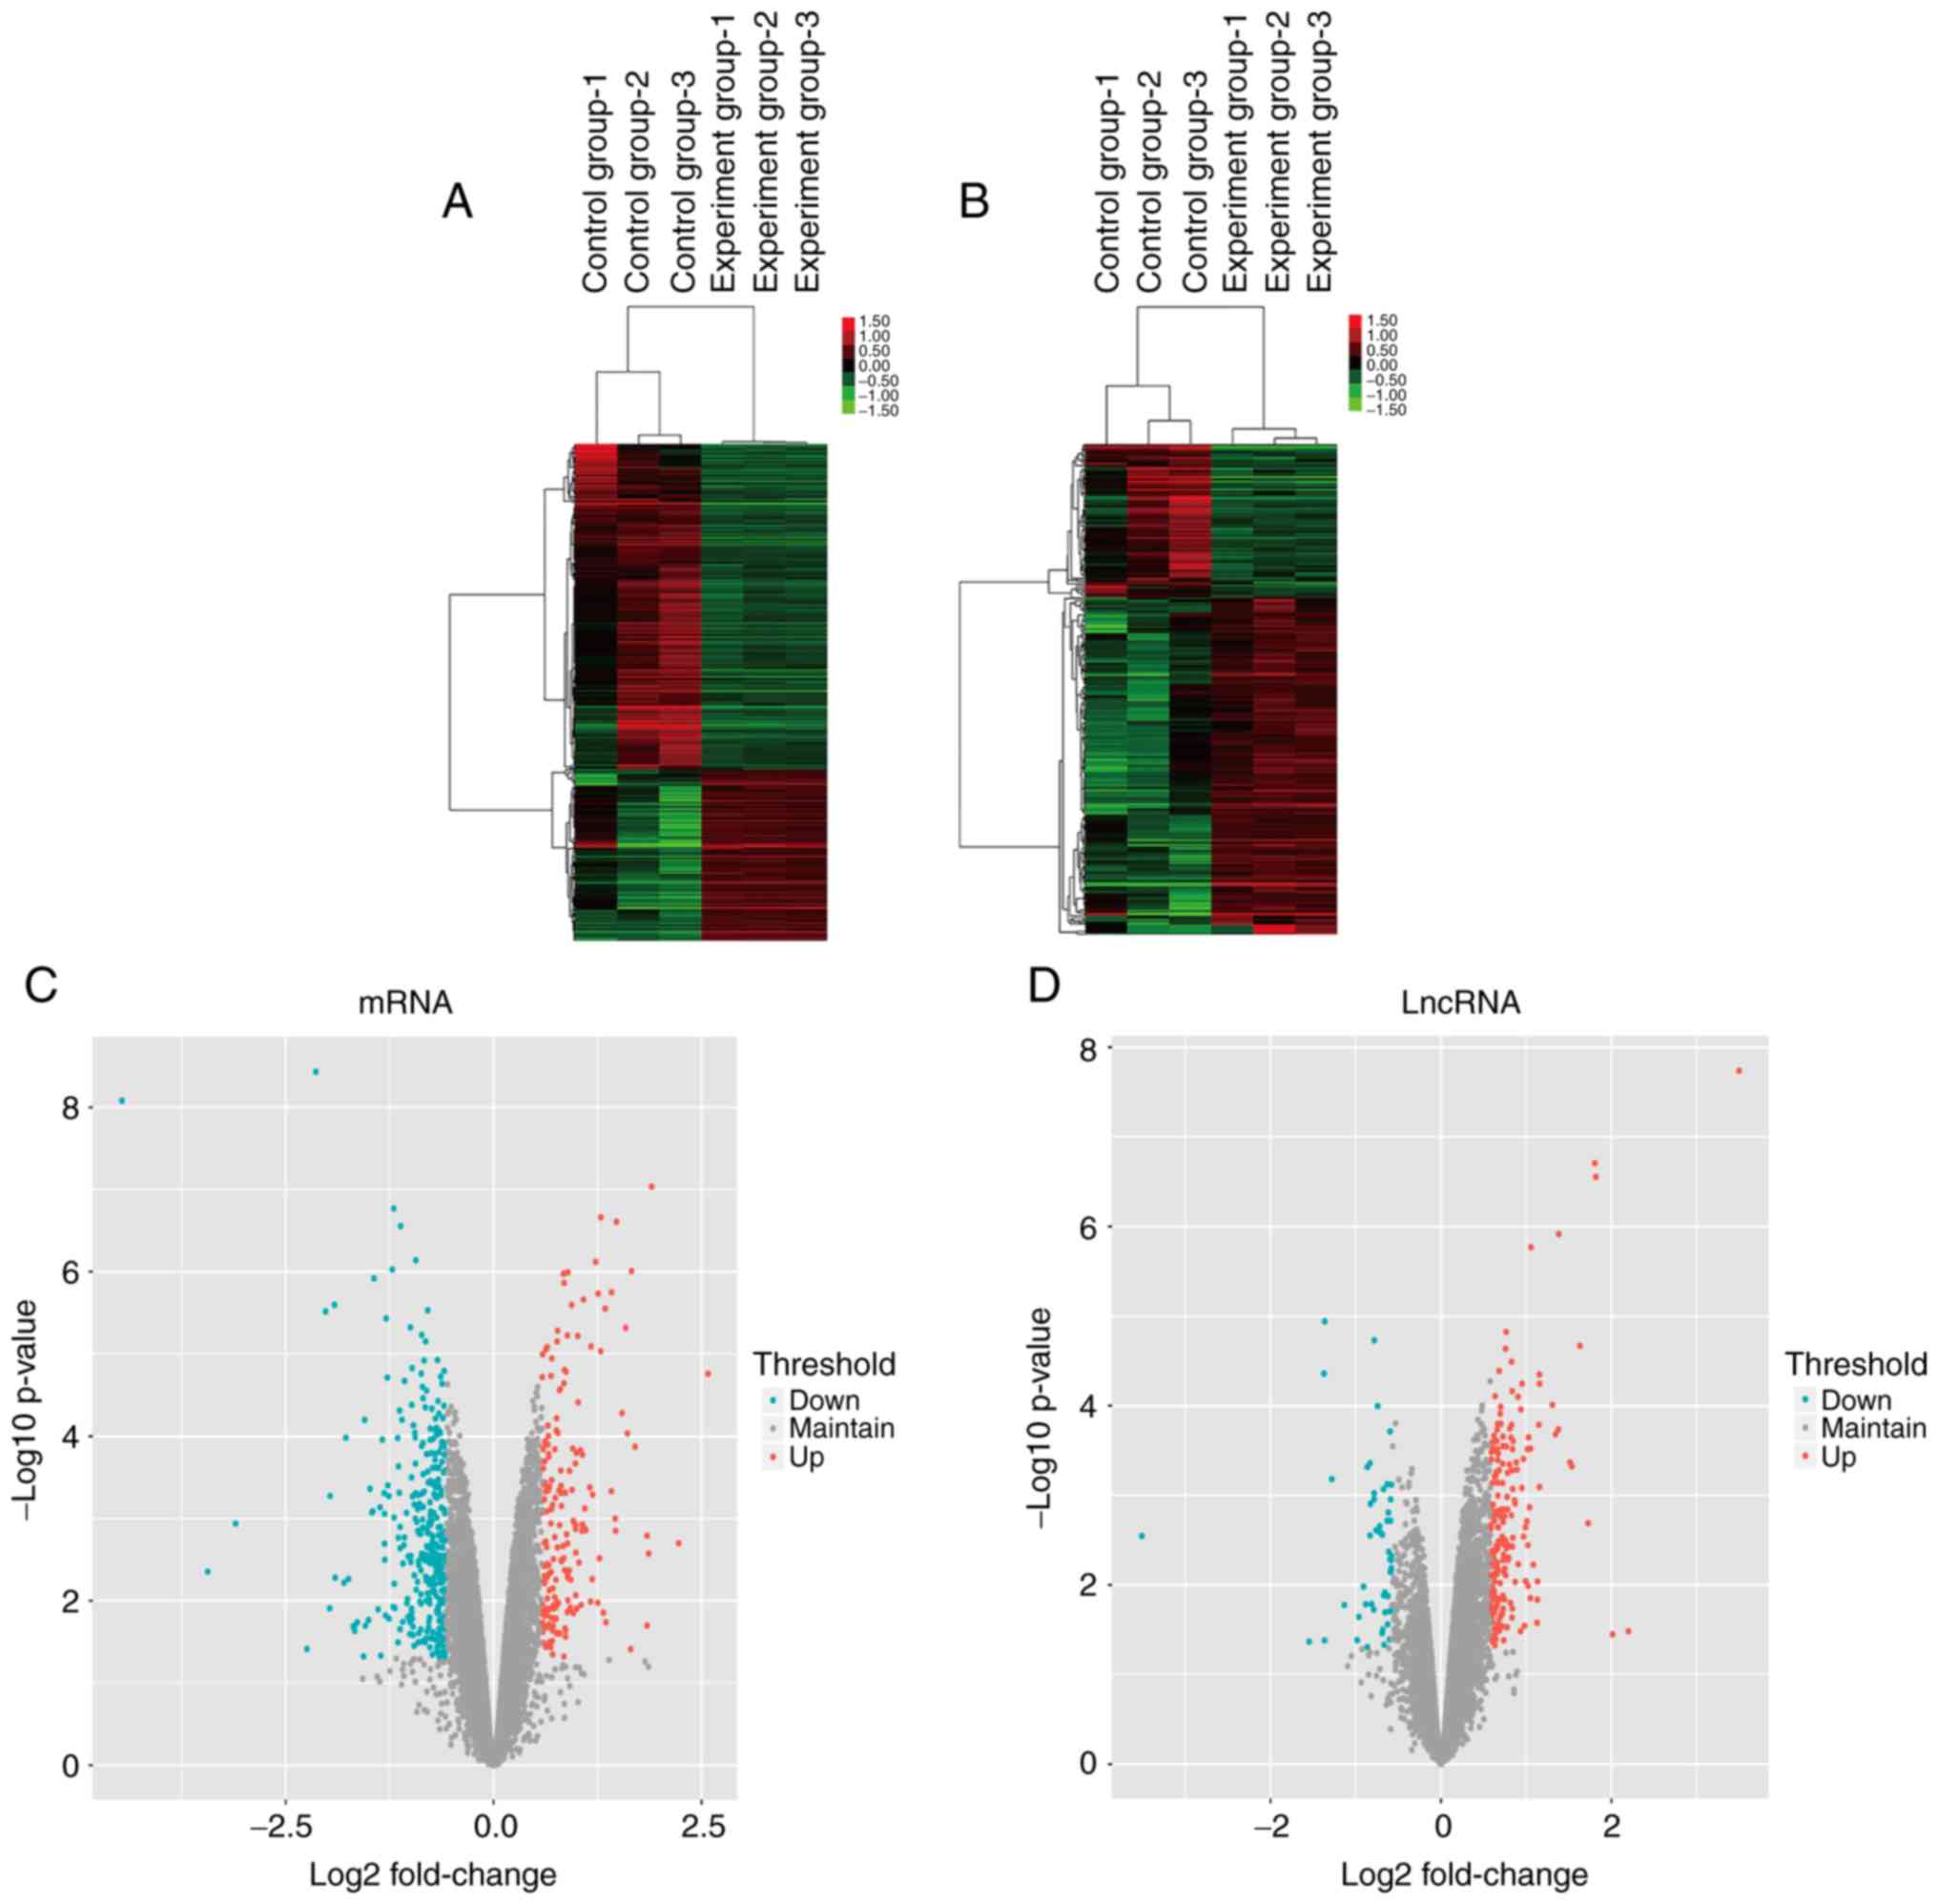
Microarray profiling of lncRNAs
Microarray analysis was used to examine differences
in the expression profiles of lncRNAs and mRNAs between the control
macrophage and LPS-treated macrophage groups for the identification
of lncRNAs with biological roles during IBD progression. A total of
357 DE lncRNAs were identified with a fold-change of at least 1.5
(Fig. 2). Among the samples from
the control group, inter-individual differences were detected by
chip testing. Although there were more significant inter-individual
differences across samples from the same group, overall, the
differences in the control group were more significant than those
within the experimental group; therefore, the trend of the overall
differences reflected by them was significant. Among these lncRNAs,
245 were upregulated and 112 were downregulated in the LPS-treated
macrophage group compared with the control group, with a
fold-change threshold of 1.5 (P<0.05; Tables II and III).
| Table II.Top 20 upregulated lncRNAs in the
macrophage + lipopolysaccharide group compared with the macrophage
group. Results were filtered using fold-change >1.5 as the
threshold. |
Table II.
Top 20 upregulated lncRNAs in the
macrophage + lipopolysaccharide group compared with the macrophage
group. Results were filtered using fold-change >1.5 as the
threshold.
| Accession no. | P-value | FDR | Fold-change | Chromosome |
|---|
| NONMMUT067603 |
1.43×10⁻² | 0.001 | 11.08 | 8 |
| NONMMUT016061 |
2.26×10⁻² | 0.269 | 4.52 | 12 |
| NONMMUT016098 |
2.49×10⁻² | 0.282 | 3.97 | 12 |
| NONMMUT059063 |
1.00×10⁻⁷ | 0.001 | 3.50 | 6 |
| NONMMUT065205 |
1.00×10⁻⁷ | 0.001 | 3.42 | 8 |
| NONMMUT057311 |
9.90×10⁻⁴ | 0.060 | 3.24 | 6 |
| NONMMUT028346 |
9.10×10⁻⁶ | 0.009 | 3.04 | 17 |
| NONMMUT054995 |
1.95×10⁻⁴ | 0.032 | 2.87 | 5 |
| NONMMUT028345 |
9.73×10⁻⁵ | 0.034 | 2.81 | 17 |
| NONMMUT023770 |
2.26×10⁻⁴ | 0.025 | 2.58 | 15 |
| NONMMUT053098 |
9.28×10⁻⁴ | 0.001 | 2.56 | 5 |
| NONMMUT003807 |
2.00×10⁻⁷ | 0.025 | 2.50 | 1 |
| NONMMUT047081 |
1.01×10⁻⁴ | 0.020 | 2.43 | 4 |
| NONMMUT031303 |
4.89×10⁻⁵ | 0.014 | 2.37 | 18 |
| NONMMUT022922 |
2.22×10⁻⁵ | 0.010 | 2.21 | 15 |
| NONMMUT044804 |
2.72×10⁻⁴ | 0.016 | 2.21 | 3 |
| NONMMUT017063 |
1.07×10⁻⁵ | 0.044 | 2.21 | 13 |
| NONMMUT009063 |
2.96×10⁻⁵ | 0.024 | 2.18 | 11 |
| NONMMUT028242 |
6.49×10⁻³ | 0.148 | 2.17 | 17 |
| NONMMUT068342 |
7.31×10⁻⁵ | 0.246 | 2.16 | 9 |
| Table III.Downregulated lncRNAs in the
macrophage + lipopolysaccharide group compared with the macrophage
group. Results were filtered using fold-change >2 as the
threshold. |
Table III.
Downregulated lncRNAs in the
macrophage + lipopolysaccharide group compared with the macrophage
group. Results were filtered using fold-change >2 as the
threshold.
| Accession no. | P-value | FDR | Fold-change | LncRNA name | Chromosome |
|---|
| NR_028499 |
1.52×10⁻³ | 0.074 | 11.49 | Fxyd2 | 9 |
|
KnowTID_00004330 |
1.00×10⁻⁷ | 0.002 | 5.07 | – | 2 |
|
ENSMUST00000117094 |
2.96×10⁻³ | 0.102 | 4.55 | Gm11914 | 4 |
| NONMMUT041835 |
1.35×10⁻³ | 0.288 | 2.94 | – | 2 |
| NONMMUT046238 |
3.15×10⁻² | 0.314 | 2.94 | – | 4 |
|
ENSMUST00000181818 |
2.82×10⁻⁴ | 0.035 | 2.78 | Kansl2-ps | 7 |
| NONMMUT065008 |
1.80×10⁻⁵ | 0.013 | 2.63 | – | 8 |
| NONMMUT055602 |
3.90×10⁻⁶ | 0.006 | 2.56 | – | 6 |
| uc029szy.1 |
3.44×10⁻³ | 0.110 | 2.56 | – | 17 |
| NONMMUT022580 |
3.08×10⁻² | 0.311 | 2.56 | – | 15 |
| NONMMUT005859 |
3.28×10⁻⁴ | 0.038 | 2.50 | – | 10 |
| NONMMUT000091 |
1.10×10⁻² | 0.193 | 2.22 | – | 1 |
|
ENSMUST00000122180 |
4.79×10⁻² | 0.381 | 2.22 | Gm12138 | 11 |
| NONMMUT052111 |
4.71×10⁻² | 0.378 | 2.08 | – | 5 |
|
ENSMUST00000172263 |
8.96×10⁻⁵ | 0.025 | 2.01 | Gm1848 | X |
| NONMMUT024673 |
2.89×10⁻² | 0.302 | 2.06 | – | 15 |
Gene expression profiling by
microarray analysis
DE mRNAs were identified following comparison
between the LPS-treated and control macrophage groups. A total of
187 upregulated and 355 downregulated mRNAs were obtained with a
fold change of ≥1.5 (P<0.05; Tables IV and V). Hierarchical clustering and volcano
plot filtering were utilized to analyze the data (Fig. 2). Thereby, DE mRNAs and lncRNAs
were identified between the LPS-treated and control macrophage
groups.
| Table IV.Top 20 upregulated mRNAs in the
macrophage + lipopolysaccharide group compared with the macrophage
group. The results were filtered using a fold-change of >1.5 as
the threshold. |
Table IV.
Top 20 upregulated mRNAs in the
macrophage + lipopolysaccharide group compared with the macrophage
group. The results were filtered using a fold-change of >1.5 as
the threshold.
| Accession no. | P-value | FDR | Fold-change | Gene name | Chromosome |
|---|
| NM_022415 |
1.67×10⁻⁴ | 0.170 | 2.47 | Ptges | 2 |
| NM_019472 |
7.00×10⁻⁷ | 0.030 | 2.63 | Myo10 | 15 |
| NM_001145799 |
4.26×10⁻⁴ | 0.002 | 2.64 | Ctla2a | 13 |
| NM_001276764 |
6.24×10⁻⁴ | 0.040 | 2.72 | Dst | 1 |
| NM_008311 |
1.00×10⁻⁷ | 0.049 | 2.72 | Htr2b | 1 |
| NM_011158 |
1.40×10⁻⁵ | 0.001 | 2.73 | Prkar2b | 12 |
| NM_009690 |
9.00×10⁻⁷ | 0.012 | 2.87 | Cd5l | 3 |
| NM_008491 |
4.34×10⁻⁵ | 0.002 | 2.94 | Lcn2 | 2 |
| NM_010554 |
2.75×10⁻² | 0.019 | 3.02 | Il1a | 2 |
| NM_010329 |
2.00×10⁻⁷ | 0.295 | 3.09 | Pdpn | 4 |
| NM_008768 |
5.71×10⁻⁵ | 0.001 | 3.10 | Orm1 | 4 |
| NM_010766 |
4.04×10⁻² | 0.021 | 3.19 | Marco | 1 |
| BC019760 |
7.54×10⁻⁴ | 0.352 | 3.49 | Igk | 6 |
| NM_018866 |
1.31×10⁻² | 0.053 | 3.52 | Cxcl13 | 5 |
| NM_010016 |
1.66×10⁻³ | 0.208 | 3.55 | Cd55 | 1 |
|
ENSMUST00000109711 |
4.81×10⁻² | 0.076 | 3.57 | Ighv1-2 | 12 |
| NM_008903 |
9.65×10⁻⁴ | 0.382 | 3.57 | Ppap2a | 13 |
|
ENSMUST00000103461 |
9.57×10⁻⁴ | 0.058 | 4.59 | Ighv7-3 | 12 |
| NM_138648 |
4.30×10⁻⁶ | 0.063 | 5.86 | Olr1 | 6 |
| BC055906 |
2.80×10⁻² | 0.298 | 7.55 | Igk | 6 |
| Table V.Top 20 downregulated mRNAs in the
macrophage + lipopolysaccharide group compared with the macrophage
group. The results were filtered using a fold-change >1.5. |
Table V.
Top 20 downregulated mRNAs in the
macrophage + lipopolysaccharide group compared with the macrophage
group. The results were filtered using a fold-change >1.5.
| Accession no. | P-value | FDR | Fold-change | Gene name | Chromosome |
|---|
|
ENSMUST00000081924 |
1.71×10⁻⁵ | 0.007 | 22.22 | Ifitm6 | 7 |
| NM_133661 |
2.48×10⁻³ | 0.093 | 10.87 | Slc6a12 | 6 |
| NM_009801 |
5.58×10⁻⁴ | 0.046 | 8.33 | Car2 | 3 |
| NM_001145959 |
2.74×10⁻² | 0.294 | 4.76 | Ndrg2 | 14 |
| NM_008969 |
2.20×10⁻⁶ | 0.003 | 4.35 | Ptgs1 | 2 |
| NM_011198 |
1.00×10⁻⁶ | 0.002 | 4.21 | Ptgs2 | 1 |
| NM_001204203 |
2.57×10⁻⁴ | 0.035 | 4.61 | Spp1 | 5 |
| NM_008361 |
6.87×10⁻³ | 0.153 | 4.93 | Il1b | 2 |
| NM_001038614 |
8.00×10⁻⁷ | 0.002 | 3.85 | Olfm1 | 2 |
| NM_001134475 |
2.59×10⁻³ | 0.096 | 3.75 | Vcan | 13 |
| NM_008035 |
4.42×10⁻⁵ | 0.020 | 3.45 | Folr2 | 7 |
| NM_016710 |
3.50×10⁻³ | 0.111 | 3.45 | Hmgn5 | X |
| NM_008278 |
3.24×10⁻³ | 0.107 | 3.33 | Hpgd | 8 |
| NM_011311 |
1.33×10⁻² | 0.209 | 3.23 | S100a4 | 3 |
| NM_017391 |
1.35×10⁻² | 0.210 | 3.23 | Slc5a3 | 16 |
| NM_009250 |
1.56×10⁻² | 0.225 | 3.23 | Serpini1 | 3 |
| NM_148933 |
1.23×10⁻² | 0.202 | 3.13 | Slco4a1 | 2 |
| NM_009644 |
1.57×10⁻⁵ | 0.013 | 2.94 | Ahrr | 13 |
| NM_010330 |
1.20×10⁻² | 0.013 | 2.94 | Emb | 13 |
| NM_178767 |
3.48×10⁻² | 0.330 | 2.94 | Agmo | 12 |
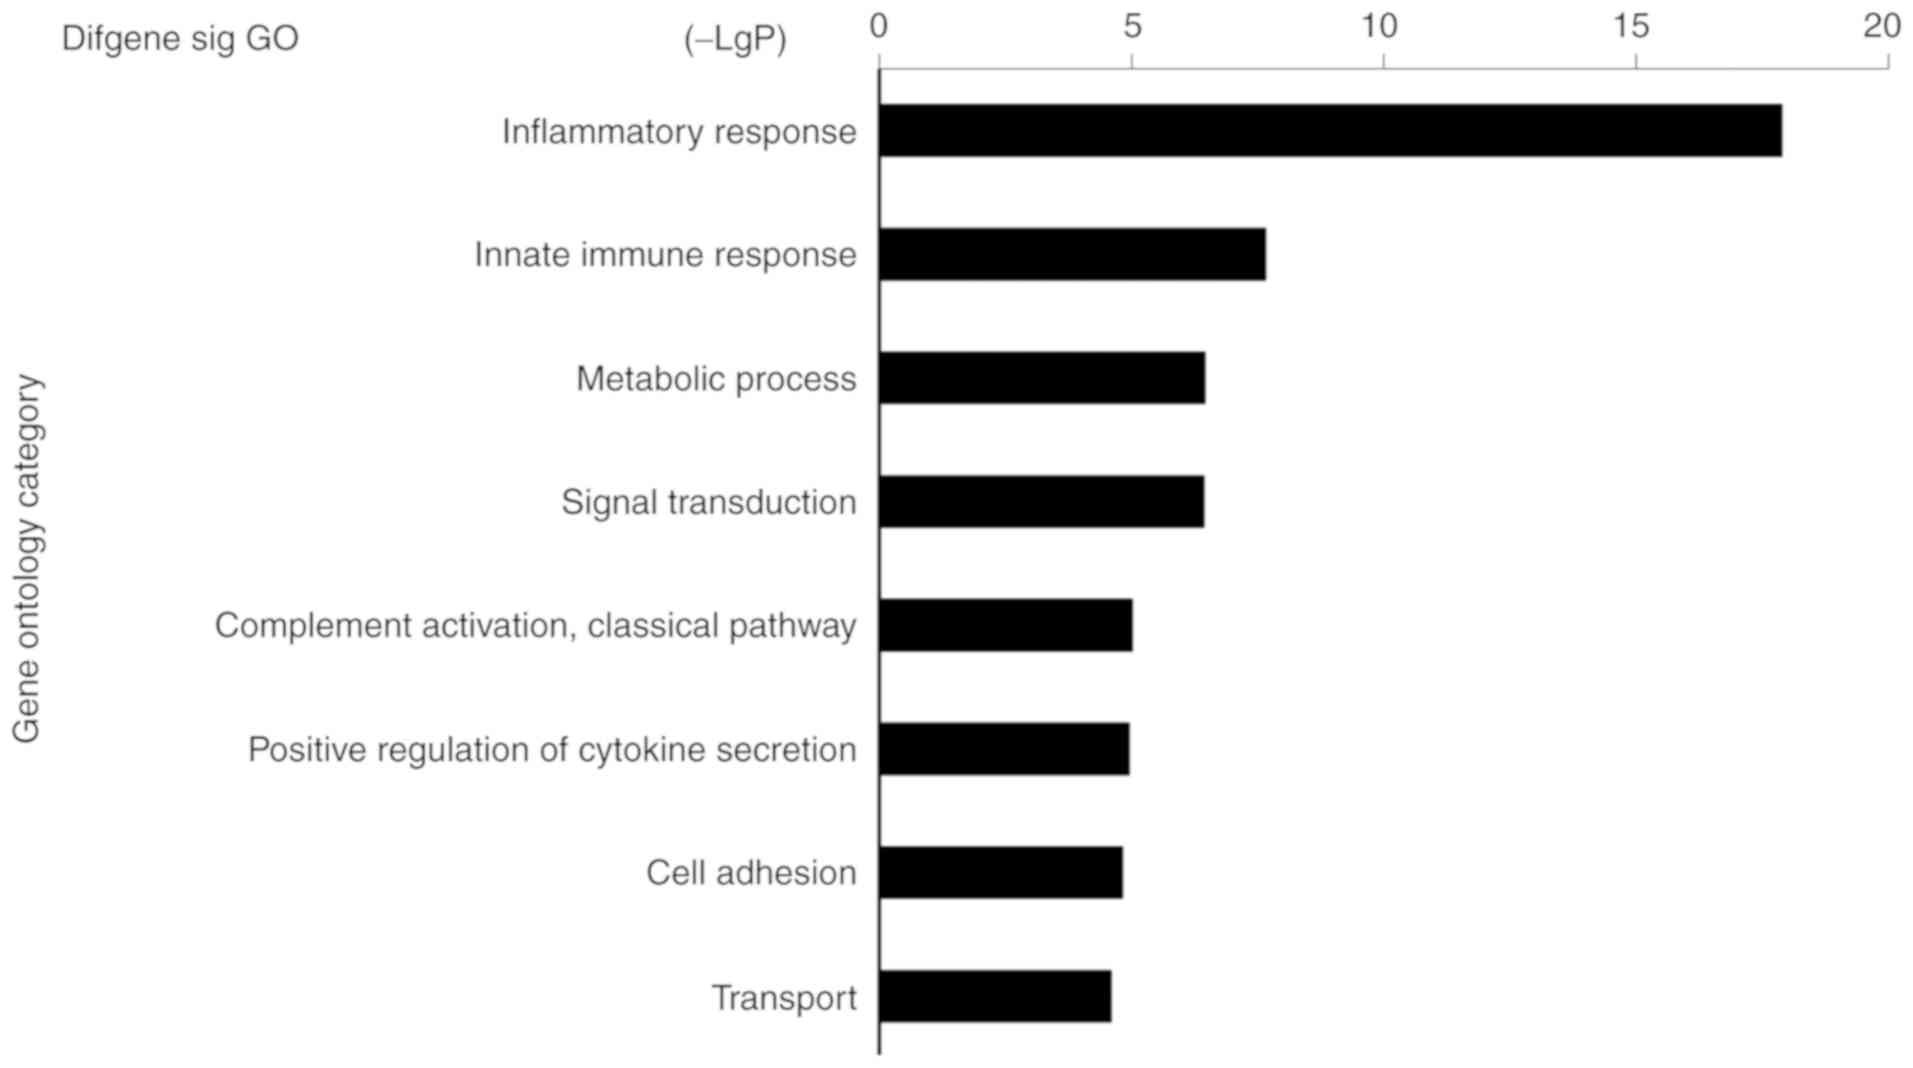
GO analysis of DEGs
To determine the roles of DEGs in the categories
biological process and molecular function, GO analysis was
performed. A total of 303 GO terms were enriched by the upregulated
genes (Fig. 3; P≤0.05), with the
most significantly enriched terms being associated with
inflammatory responses. Therefore, DE mRNAs were associated with
IL-1α, NLR family pyrin domain-containing 3, lymphocyte antigen 96
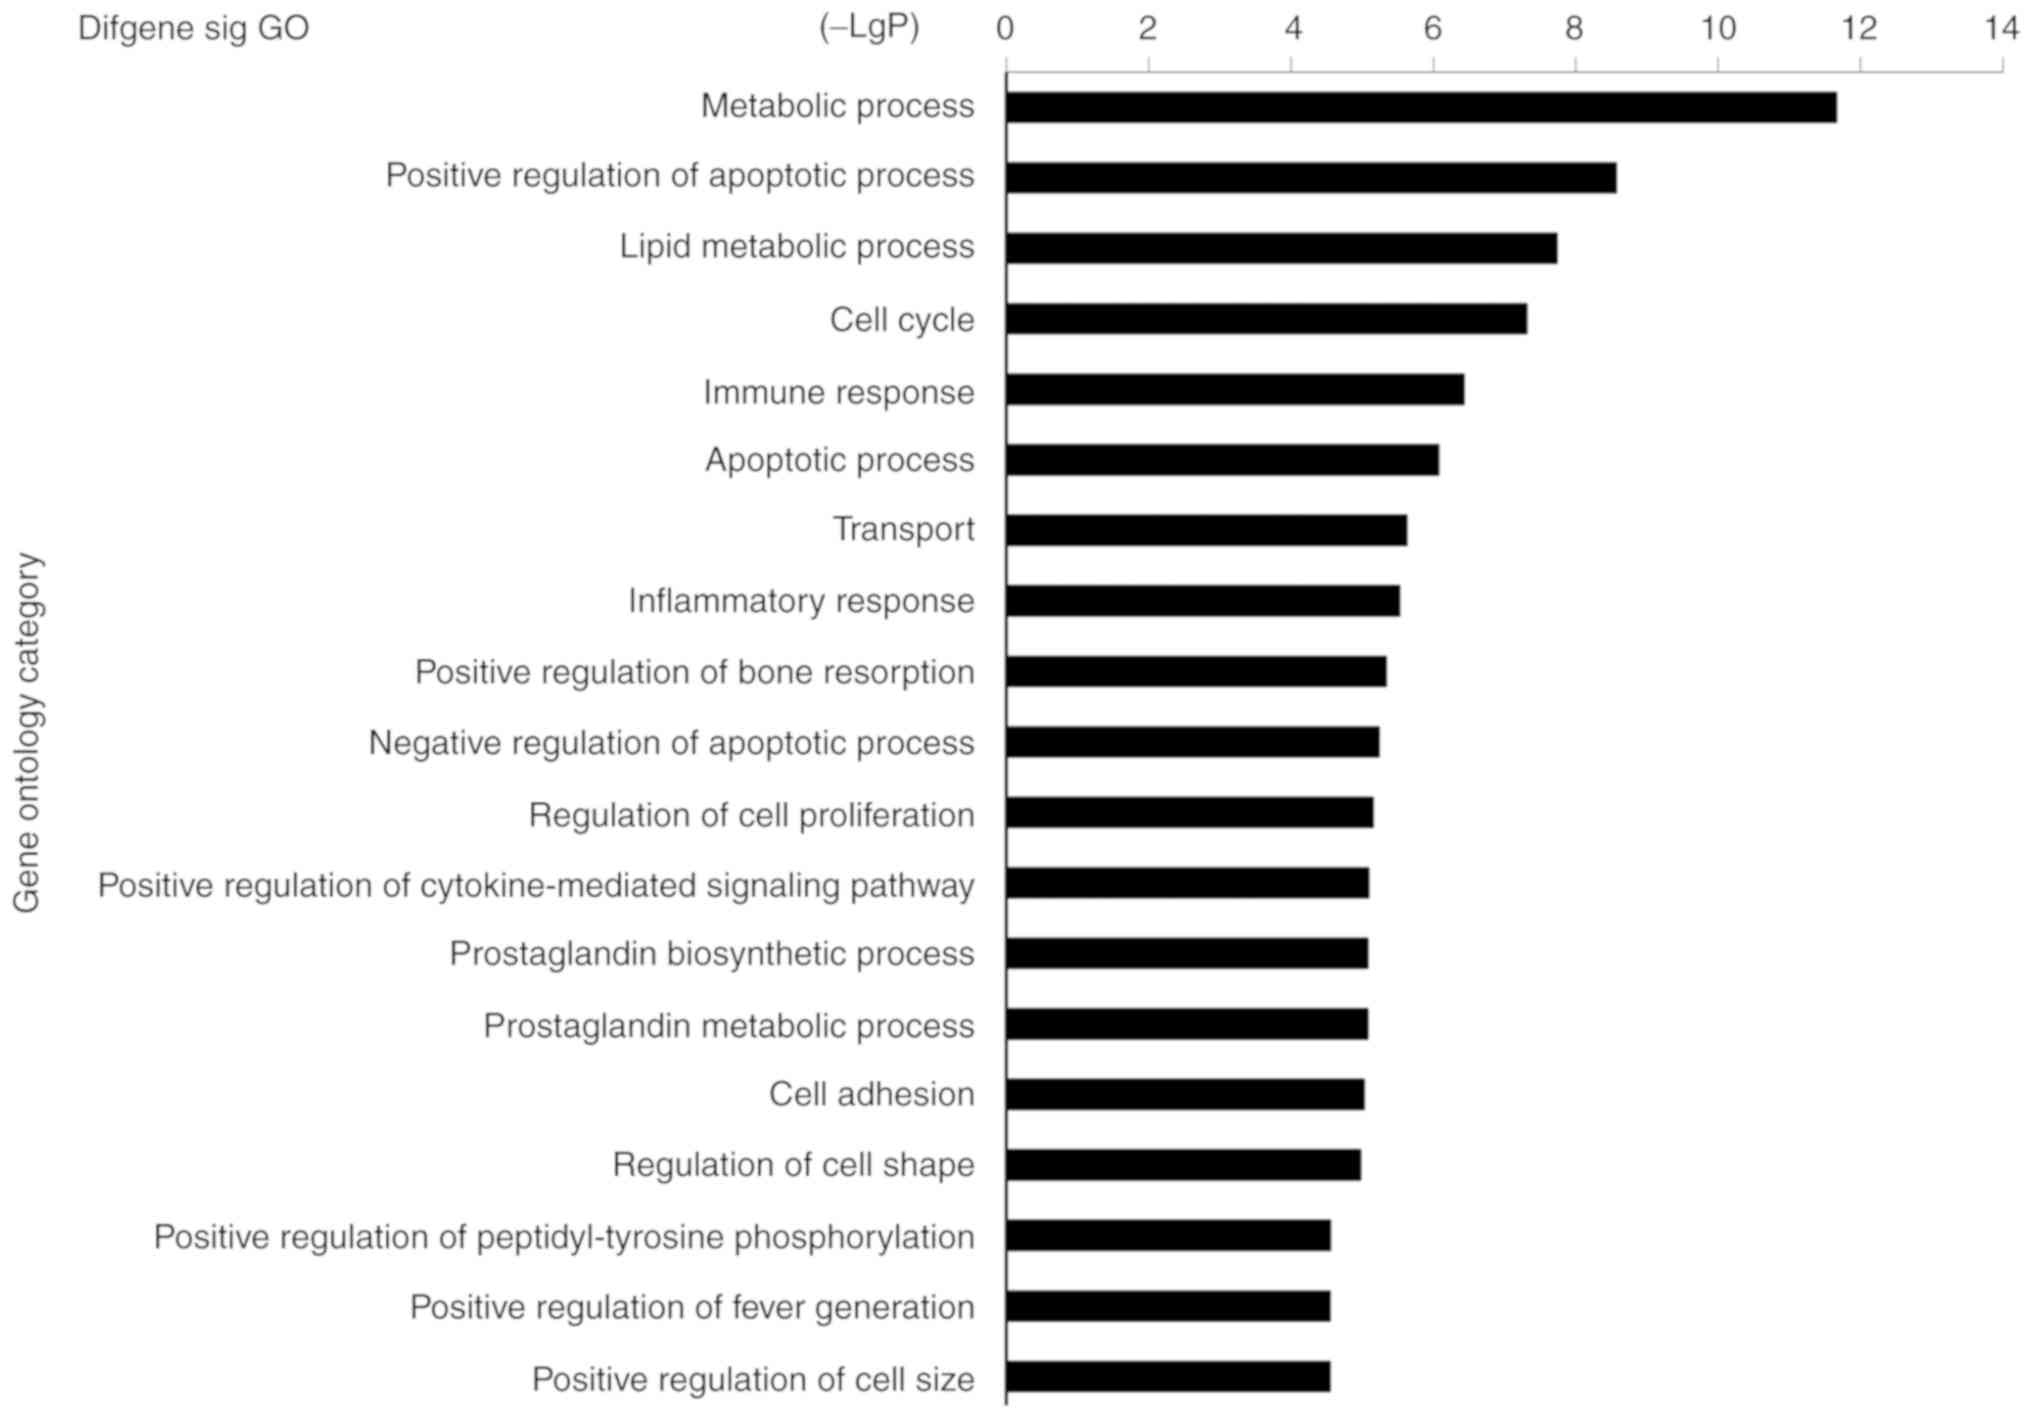
and TNF. Furthermore, 366 GO terms were enriched by the
downregulated genes, including lipid metabolic processes,
inflammatory response, positive regulation of apoptotic processes
and immune responses (Fig. 4).
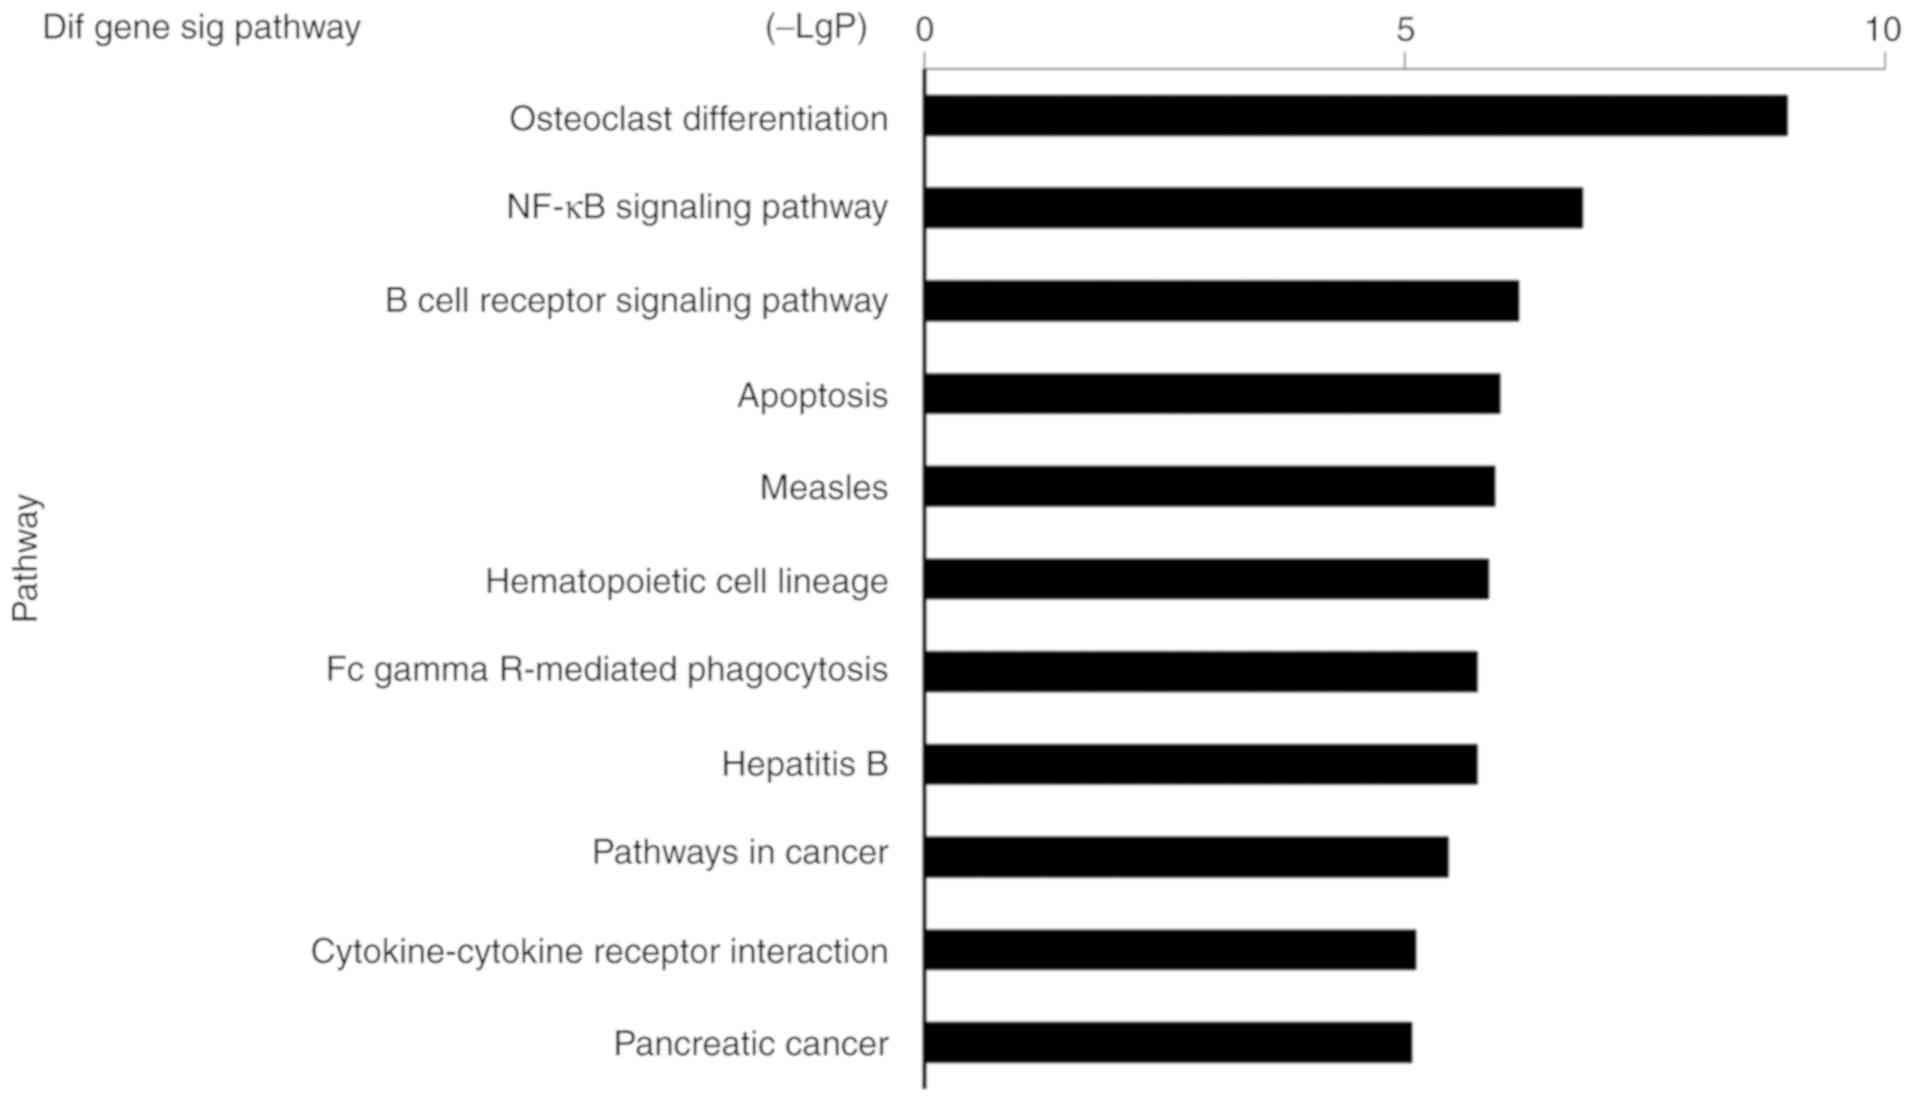
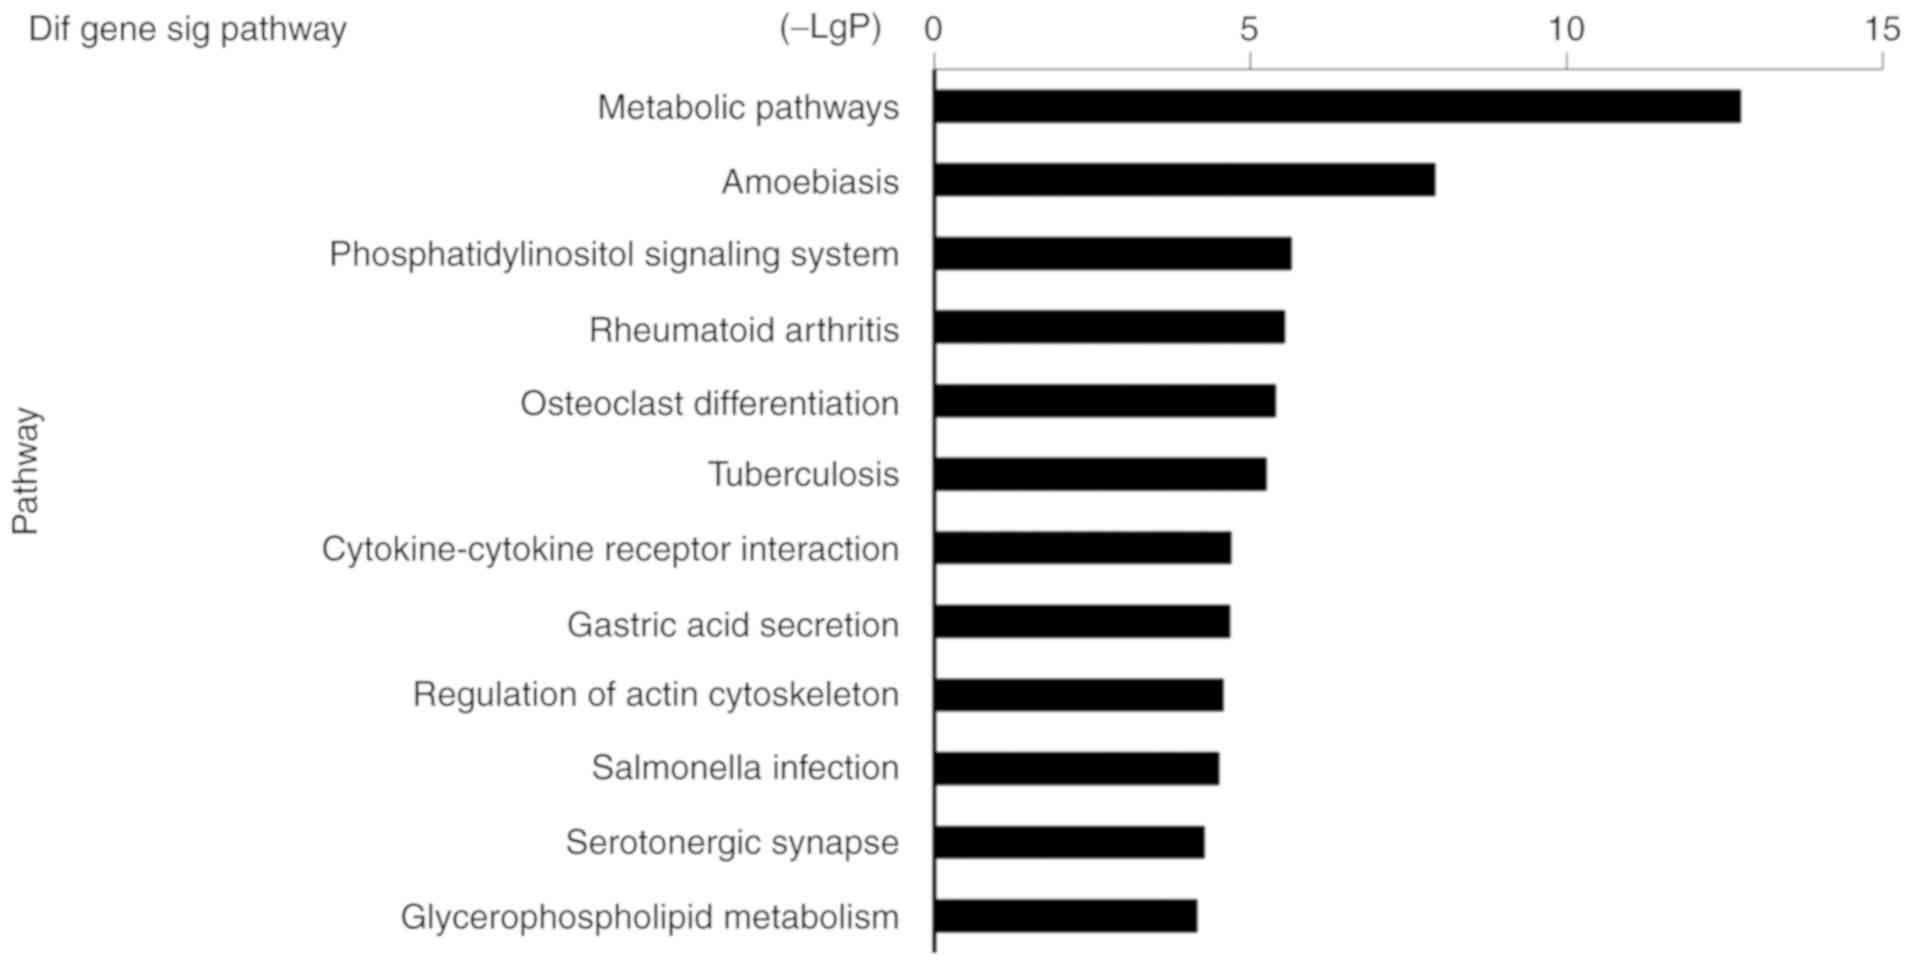
Pathway enrichment analysis of
DEGs
Pathway enrichment analysis of DE mRNAs was
performed to provide insight into the cellular pathways associated
with the selected mRNAs. A total of 61 and 76 pathways were
associated with the upregulated and downregulated genes,
respectively, the most relevant pathway was ‘osteoclast
differentiation’ (Fig. 5). The
results were significant in the LPS-treated macrophage group, the
most relevant was ‘metabolic pathways’ (Fig. 6). These findings suggested that
these pathways were associated with the pathogenesis and
biochemical characteristics of macrophages involved in IBD.
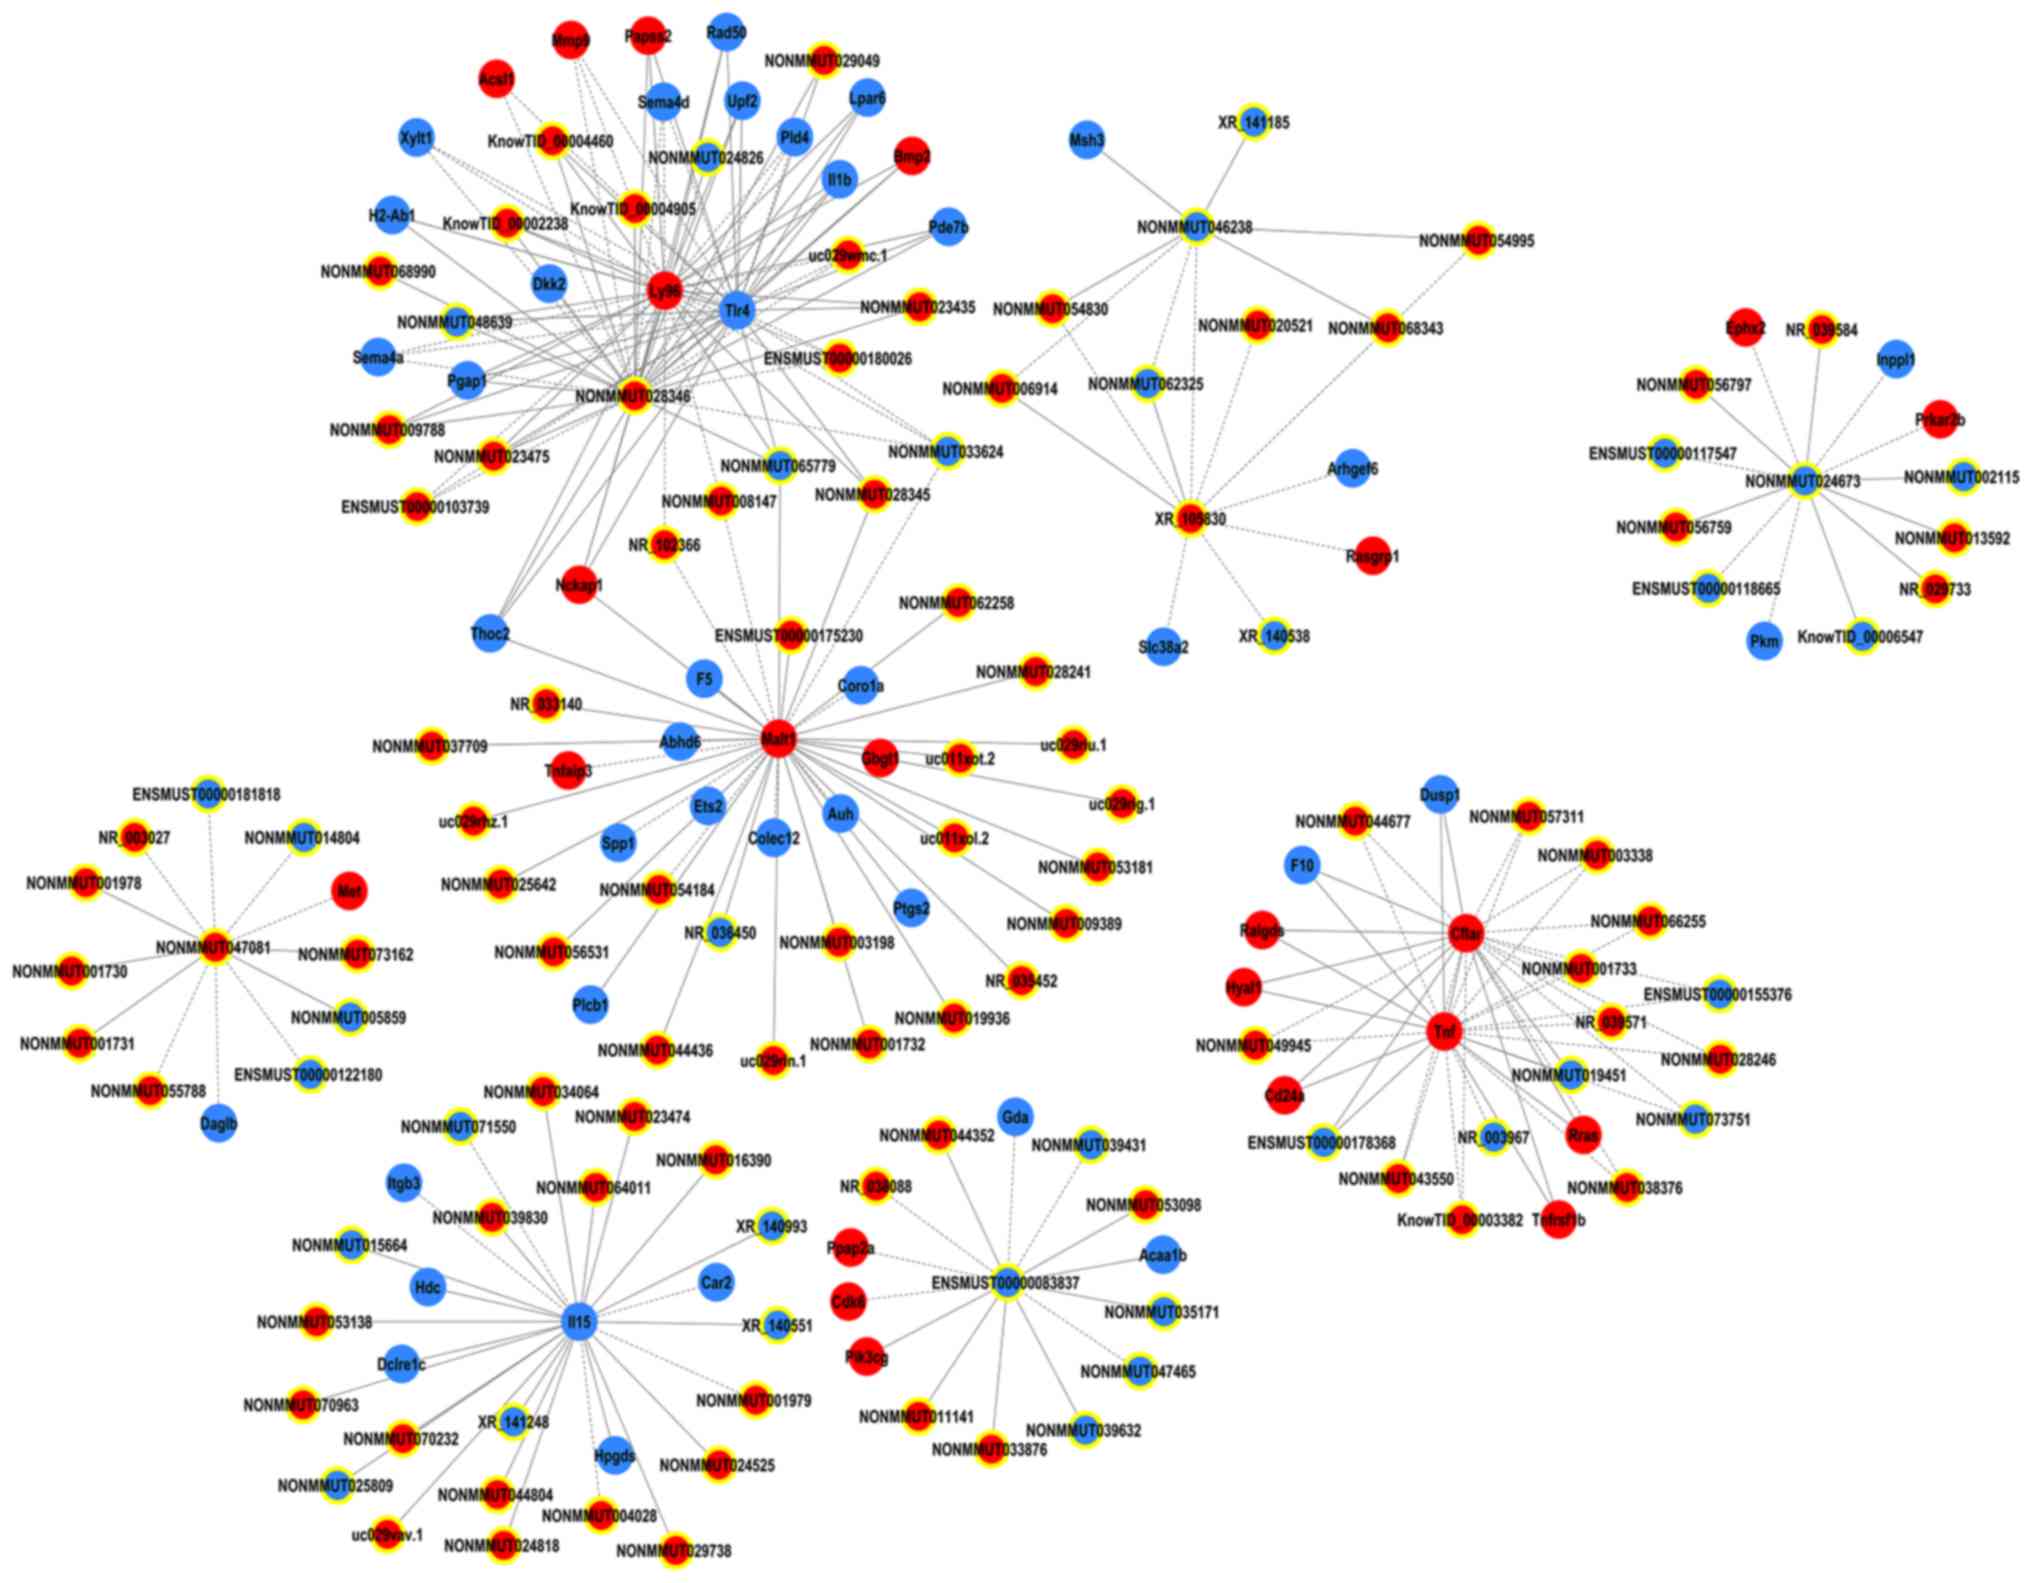
lncRNA-mRNA network
To identify the lncRNAs and mRNAs that are involved
in intestinal macrophage-mediated inflammation, an lncRNA-mRNA
interaction network was individually constructed for the
LPS-treated and control groups, and their differences were then
analyzed. For the coding-non-coding gene co-expression network,
five DE lncRNAs and mRNAs were selected. Furthermore, six lncRNAs
and mRNAs were selected by combining the co-expression network
results with the microarray data. The results indicated that
several lncRNAs, including NONMMUT028346, NONMMUT047081, XR_105830,
NONMMUT024673, n-R5s54-F and NONMMUT046238 may serve an important
role with the highest degree of interaction in the gene
co-expression network (Fig. 7).
The aforementioned coding genes were involved in several biological
processes, including inflammatory response, apoptosis and cell
death.
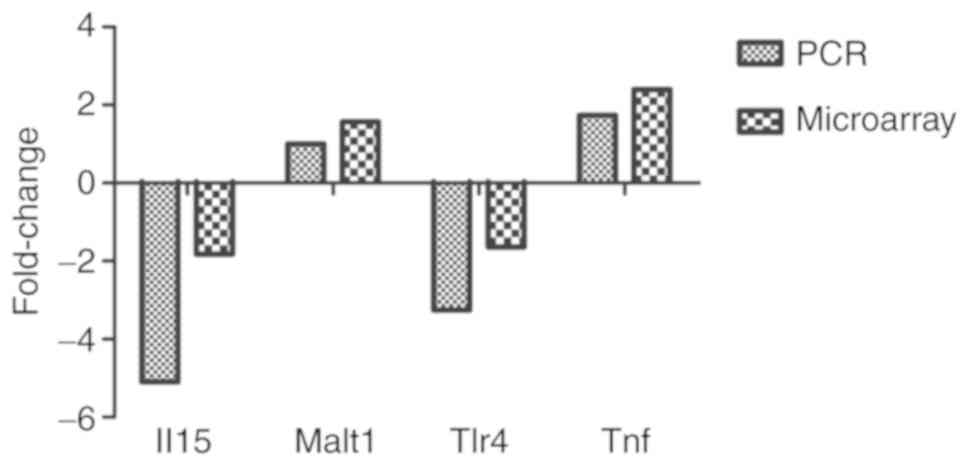
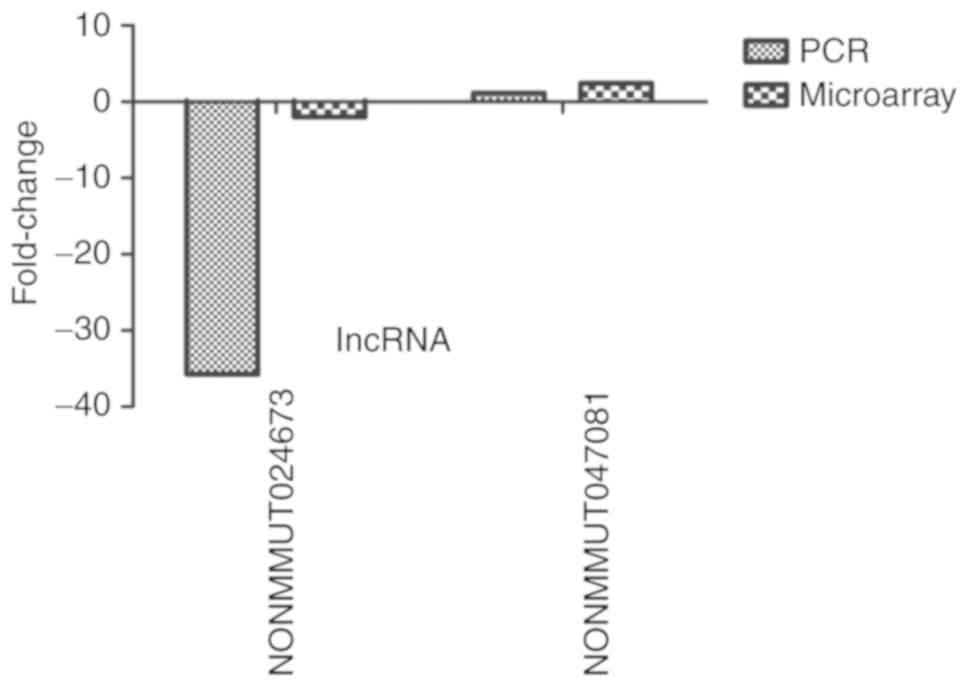
RT-qPCR verification
To further validate the microarray results, two DE
lncRNAs and four DE mRNAs were selected from the lncRNA-mRNA
network. Subsequently, RT-qPCR analysis was performed on two
additional independent intestinal macrophage groups. The microarray
results for the lncRNA and mRNA transcripts were consistent with
those obtained using RT-qPCR analysis (Figs. 8 and 9).
Discussion
Emerging evidence has revealed that thousands of
lncRNAs are encoded by the human genome. lncRNAs function as
transcriptional and post-transcriptional regulators, may directly
act on chromatin-modifying complexes and affect several cellular
and developmental pathways (28).
The intestinal mucosal barrier is involved in the protection of the
human body; however, several pathogenic factors may contribute to
IBD (29–32). Among the numerous types of
inflammatory cells, macrophages may exert pro-inflammatory and
anti-inflammatory properties. Intestinal macrophages in the lamina
propria mucosa represent the largest pool of tissue macrophages in
the human body. These macrophages have an important role in the
regulation of the intestinal barrier function. Studies have
indicated that intestinal macrophages inhibit overactivation of the
inflammatory response to protect the intestinal mucosal barrier
(33,34). Several immunological and
non-immunological components contribute to intestinal barrier
function. The epithelial barrier is one of the most important
non-immunological components. A previous study by our group
demonstrated that the expression of triggering receptor expressed
on myeloid cells-1 (TREM-1) was downregulated by its selective
inhibitor LP17 in intestinal macrophages, whereas TREM-1 expression
inhibited the invasive ability of intestinal macrophages into the
intestinal epithelium. Therefore, TREM-1 may be considered as a
novel target for the treatment of IBD (28). In the present study, cells were
analyzed from SD rats, but the microarray kit and the PCR primers
used were specifically for mice. We have optimized our PCR primer
with the aforementioned sequence, and it worked and amplified the
target sequence efficiently, so therefore in our opinion, this
primer sequence can be used for the amplification of genes from SD
rat cells.
LncRNAs serve as transcriptional and
post-transcriptional regulators and may bind to chromatin-modifying
complexes to guide them to specific locations. In addition, lncRNAs
have been reported to affect several cellular and developmental
pathways. Therefore, it is not surprising that the dysregulation of
lncRNAs appears to be a significant feature of several complex
human diseases. Although rapid progress has been made in associated
research fields, the role of lncRNAs in the regulation of
inflammatory responses is only now becoming apparent. Carpenter
et al (35) confirmed that
murine lncRNA cytochrome C oxygenase II interacted with
heterogeneous nuclear ribonucleoproteins to facilitate the
activation and inhibition of immune response-associated genes. Cui
et al (36) also
demonstrated that lncRNA IL-7 receptor (IL7R), overlapping with the
3′-untranslated region of the human IL7R α-subunit gene,
contributed to the regulation of inflammatory responses.
Furthermore, downregulation of lncRNA nuclear paraspecle assembly
transcript 1 attenuated the inflammatory response in IBD via
modulating the intestinal epithelial barrier and exosome-mediated
polarization of macrophages (37).
The present study aimed to investigate the
differential expression profiles of lncRNAs between non-LPS and
LPS-treated intestinal macrophages. Several lncRNAs were identified
in intestinal macrophages, whose expression was altered in response
to LPS treatment. The RT-qPCR and microarray analyses were used to
validate the expression profiles of lncRNAs. The results indicated
that lncRNAs in intestinal macrophages were able to regulate the
inflammatory response to LPS. Furthermore, GO analysis revealed
that the upregulated coding genes were predominantly involved in
inflammatory and innate immune responses, while the downregulated
ones were involved in the positive regulation of the apoptotic
process, and immune and inflammatory responses. In addition,
pathway enrichment analysis suggested that inflammation-associated
pathways, including the NF-κB and Toll-like receptor (TLR)
signaling pathways, were enriched in the upregulated transcripts
associated with rheumatoid arthritis. Ma et al (38) indicated that lncRNA TNF-α-induced
protein 3, as a regulator of NF-κB, modulates
inflammation-associated gene transcription in mouse
macrophages.
Studies have also demonstrated that lncRNAs may
serve a vital role in regulating the transcription of neighboring
coding genes (39). The present
study predicted that lncRNAs NONMMUT024673 and NONMMUT047081 are
able to regulate the inflammatory response via modulating the
expression of coding genes. Therefore, bioinformatics analysis may
be useful in detecting target genes. Furthermore, the lncRNA-mRNA
network revealed that lncRNA NONMMUT028346 interacted with the TLR4
gene. TLR4 is involved in several inflammatory pathways. Based on
the co-expression network and microarray data, lncRNAs
NONMMUT047081 and NONMMUT024673 were selected to further evaluate
their predicted value in LPS-induced intestinal
macrophages-mediated inflammatory responses. Therefore, RT-qPCR
analysis was performed. The relative expression levels of lncRNAs
NONMMUT024673 and NONMMUT047081 were significantly downregulated
and upregulated, respectively, in the LPS-treated intestinal
macrophage group compared with the control group.
In conclusion, in the present study, DE lncRNAs
between LPS-treated and untreated rat intestinal macrophages were
identified. The genomic data obtained in the present study may
improve the understanding of the role of lncRNAs in the intestinal
macrophage-mediated induction of inflammatory responses. However,
further studies are required to elucidate the exact regulatory
mechanisms of these DE lncRNAs. In addition, the microarray results
provided a novel mechanism of macrophage-mediated regulation of
IBD.
Acknowledgements
Not applicable.
Funding
This study was supported by a grant from the Six
Talent Peaks Project in Jiangsu Province (grant no. 2016-WSN-007),
the Jiangsu 333 Project Foundation (grant no. BRA2017560) and the
Zhenjiang Science and Technology Committee (grant no. SH 2019061).
The funding bodies had no role in the design of the study, the
collection, analysis and interpretation of data or in writing the
manuscript.
Availability of data and materials
All data generated or analyzed during this study are
included in this published article.
Authors' contributions
SD and LL conceived and supervised the study; LL,
SC, QN, XX, XW and SD designed the experiments; QN, JC, JQ and LC
performed the experiments and had a major role in the acquisition
of data; LC and SD analyzed the data; SD, QN, LL and SC, QN, XX, XW
revised the manuscript for intellectual content, designed the
figures, contributed to interpreting the data and wrote the
manuscript with input from all authors. All authors read and
approved the final manuscript.
Ethics approval and consent to
participate
All protocols for animal experimentation were
approved by the Institutional Animal Care and Use Committees of
Jiangsu University (Zhenjiang, China) and experiments were
performed according to the Regulation on Animal Experimentation at
Jiangsu University (Zhenjiang, China).
Patient consent for publication
Not applicable.
Competing interests
The authors declare that they have no competing
interests.
Glossary
Abbreviations
Abbreviations:
|
LPS
|
lipopolysaccharide
|
|
lncRNA
|
long non-coding RNA
|
|
IBD
|
intestinal barrier dysfunction
|
References
|
1
|
Shen L, Su L and Turner JR: Mechanisms and
functional implications of intestinal barrier defects. Dig Dis.
27:443–449. 2009. View Article : Google Scholar : PubMed/NCBI
|
|
2
|
Xu GF, Guo M, Tian ZQ, Wu GZ, Zou XP and
Zhang WJ: Increased of serum high-mobility group box chromosomal
protein 1 correlated with intestinal mucosal barrier injury in
patients with severe acute pancreatitis. World J Emerg Surg.
9:612014. View Article : Google Scholar : PubMed/NCBI
|
|
3
|
Lee SH: Intestinal permeability regulation
by tight junction: Implication on inflammatory bowel diseases.
Intest Res. 13:11–18. 2015. View Article : Google Scholar : PubMed/NCBI
|
|
4
|
Zhang JX, Wang K, Mao ZF, Fan X, Jiang DL,
Chen M, Cui L, Sun K and Dang SC: Application of liposomes in drug
development-focus on gastroenterological targets. Int J
Nanomedicine. 8:1325–1334. 2013. View Article : Google Scholar : PubMed/NCBI
|
|
5
|
ENCODE Project Consortium: An integrated
encyclopedia of DNA elements in the human genome. Nature.
489:57–74. 2012. View Article : Google Scholar : PubMed/NCBI
|
|
6
|
Dunne MC and Barnes DA: Schematic
modelling of peripheral astigmatism in real eyes. Ophthalmic
Physiol Opt. 7:235–239. 1987. View Article : Google Scholar : PubMed/NCBI
|
|
7
|
Derrien T, Johnson R, Bussotti G, Tanzer
A, Djebali S, Tilgner H, Guernec G, Martin D, Merkel A, Knowles DG,
et al: The GENCODE v7 catalog of human long noncoding RNAs:
Analysis of their gene structure, evolution, and expression. Genome
Res. 22:1775–1789. 2012. View Article : Google Scholar : PubMed/NCBI
|
|
8
|
Song X, Cao G, Jing L, Lin S, Wang X,
Zhang J, Wang M, Liu W and Lv C: Analysing the relationship between
lncRNA and protein-coding gene and the role of lncRNA as ceRNA in
pulmonary fibrosis. J Cell Mol Med. 18:991–1003. 2014. View Article : Google Scholar : PubMed/NCBI
|
|
9
|
Wilusz JE, Sunwoo H and Spector DL: Long
noncoding RNAs: Functional surprises from the RNA world. Genes Dev.
23:1494–1504. 2009. View Article : Google Scholar : PubMed/NCBI
|
|
10
|
Nakagawa T, Endo H, Yokoyama M, Abe J,
Tamai K, Tanaka N, Sato I, Takahashi S, Kondo T and Satoh K: Large
noncoding RNA HOTAIR enhances aggressive biological behavior and is
associated with short disease-free survival in human non-small cell
lung cancer. Biochem Biophys Res Commun. 436:319–324. 2013.
View Article : Google Scholar : PubMed/NCBI
|
|
11
|
Ponting CP, Oliver PL and Reik W:
Evolution and functions of long noncoding RNAs. Cell. 136:629–641.
2009. View Article : Google Scholar : PubMed/NCBI
|
|
12
|
Moran VA, Perera RJ and Khalil AM:
Emerging functional and mechanistic paradigms of mammalian long
non-coding RNAs. Nucleic Acids Res. 40:6391–6400. 2012. View Article : Google Scholar : PubMed/NCBI
|
|
13
|
Sun M and Kraus WL: From discovery to
function: The expanding roles of long non-coding RNAs in physiology
and disease. Endocr Rev. 36:25–64. 2015. View Article : Google Scholar : PubMed/NCBI
|
|
14
|
Satpathy AT and Chang HY: Long noncoding
RNA in hematopoiesis and immunity. Immunity. 42:792–804. 2015.
View Article : Google Scholar : PubMed/NCBI
|
|
15
|
Kim J, Kim KM, Noh JH, Yoon JH,
Abdelmohsen K and Gorospe M: Long noncoding RNAs in diseases of
aging. Biochim Biophys Acta. 1859:209–221. 2016. View Article : Google Scholar : PubMed/NCBI
|
|
16
|
Kung JT, Colognori D and Lee JT: Long
noncoding RNAs: Past, present, and future. Genetics. 193:651–669.
2013. View Article : Google Scholar : PubMed/NCBI
|
|
17
|
Chen SW, Wang PY, Liu YC, Sun L, Zhu J,
Zuo S, Ma J, Li TY, Zhang JL, Chen GW, et al: Effect of long
noncoding RNA H19 overexpression on intestinal barrier function and
its potential role in the pathogenesis of ulcerative colitis.
Inflamm Bowel Dis. 22:2582–2592. 2016. View Article : Google Scholar : PubMed/NCBI
|
|
18
|
Zou T, Jaladanki SK, Liu L, Xiao L, Chung
HK and Wang JY, Xu Y, Gorospe M and Wang JY: H19 long noncoding RNA
regulates intestinal epithelial barrier function via MicroRNA 675
by interacting with RNA-binding protein HuR. Mol Cell Biol.
36:1332–1341. 2016. View Article : Google Scholar : PubMed/NCBI
|
|
19
|
Rankin CR, Lokhandwala ZA, Huang R, Pekow
J, Pothoulakis C and Padua D: Linear and circular CDKN2B-AS1
expression is associated with inflammatory bowel disease and
participates in intestinal barrier formation. Life Sci.
231:1165712019. View Article : Google Scholar : PubMed/NCBI
|
|
20
|
Carpenter S and Fitzgerald KA:
Transcription of inflammatory genes: Long noncoding RNA and beyond.
J Interferon Cytokine Res. 35:79–88. 2015. View Article : Google Scholar : PubMed/NCBI
|
|
21
|
Marques-Rocha JL, Samblas M, Milagro FI,
Bressan J, Martinez JA and Marti A: Noncoding RNAs, cytokines, and
inflammation-related diseases. FASEB J. 29:3595–3611. 2015.
View Article : Google Scholar : PubMed/NCBI
|
|
22
|
Kilkenny C, Browne WJ, Cuthi I, Emerson M
and Altman DG: Improving bioscience research reporting: The ARRIVE
guidelines for reporting animal research. Vet Clin Pathol.
41:27–31. 2012. View Article : Google Scholar : PubMed/NCBI
|
|
23
|
McGrath JC, Drummond GB, McLachlan EM,
Kilkenny C and Wainwright CL: Guidelines for reporting experiments
involving animals: The ARRIVE guidelines. Br J Pharmacol.
160:1573–1576. 2010. View Article : Google Scholar : PubMed/NCBI
|
|
24
|
Zhang JX, Wang K, Zhu WR, Shen Y, Wang PJ
and Dang SC: Effect of TREM-1 expression in intestinal macrophages
on their invasion and proliferation of intestinal epithelial cells.
Shijie Huaren Xiaohua Zazhi. 21:471–477. 2013.(In Chinese).
|
|
25
|
Kamada N, Hisamatsu T, Okamoto S, Chinen
H, Kobayashi T, Sato T, Sakuraba A, Kitazume MT, Sugita A, Koganei
K, et al: Unique CD14 intestinal macrophages contribute to the
pathogenesis of crohn disease via IL-23/IFN-gamma axis. J Clin
Invest. 118:2269–2280. 2008.PubMed/NCBI
|
|
26
|
Dalman MR, Deeter A, Nimishakavi G and
Duan ZH: Fold change and p-value cutoffs significantly alter
microarray interpretations. BMC Bioinformatics. 13 (Suppl
2):S112012. View Article : Google Scholar : PubMed/NCBI
|
|
27
|
Kim CH, Lillehoj HS, Hong YH, Keeler CL Jr
and Lillehoj EP: Analysis of global transcriptional responses of
chicken following primary and secondary eimeria acervulina
infections. BMC Proc. 5 (Suppl 4):S122011. View Article : Google Scholar : PubMed/NCBI
|
|
28
|
Shi Q and Yang X: Circulating MicroRNA and
long noncoding RNA as biomarkers of cardiovascular diseases. J Cell
Physiol. 231:751–755. 2016. View Article : Google Scholar : PubMed/NCBI
|
|
29
|
Rahman SH, Ammori BJ, Holmfield J, Larvin
M and McMahon MJ: Intestinal hypoperfusion contributes to gut
barrier failure in severe acute pancreatitis. J Gastrointest Surg.
7:26–36. 2003. View Article : Google Scholar : PubMed/NCBI
|
|
30
|
Zhang XP, Zhang J, Song QL and Chen HQ:
Mechanism of acute pancreatitis complicated with injury of
intestinal mucosa barrier. J Zhejiang Univ Sci B. 8:888–895. 2007.
View Article : Google Scholar : PubMed/NCBI
|
|
31
|
Fillon S, Robinson ZD, Colgan SP and
Furuta GT: Epithelial function in eosinophilic gastrointestinal
diseases. Immunol Allergy Clin North Am. 29:171–178, xii-xiii.
2009. View Article : Google Scholar : PubMed/NCBI
|
|
32
|
Leveau P, Wang X, Sun Z, Börjesson A,
Andersson E and Andersson R: Severity of pancreatitis-associated
gut barrier dysfunction is reduced following treatment with the PAF
inhibitor lexipafant. Biochem Pharmacol. 69:1325–1331. 2005.
View Article : Google Scholar : PubMed/NCBI
|
|
33
|
Zhang JX, Dang SC, Yin K and Jiang DL:
Protective effect of clodronate-containing liposomes on intestinal
mucosal injury in rats with severe acute pancreatitis.
Hepatobiliary Pancreat Dis Int. 10:544–551. 2011. View Article : Google Scholar : PubMed/NCBI
|
|
34
|
Yin K, Dang SC and Zhang JX: Relationship
between expression of triggering receptor-1 on myeloid cells in
intestinal tissue and intestinal barrier dysfunction in severe
acute pancreatitis. World J Emerg Med. 2:216–221. 2011. View Article : Google Scholar : PubMed/NCBI
|
|
35
|
Carpenter S, Aiello D, Atianand MK, Ricci
EP, Gandhi P, Hall LL, Byron M, Monks B, Henry-Bezy M, Lawrence JB,
et al: A long noncoding RNA mediates both activation and repression
of immune response genes. Science. 341:789–792. 2013. View Article : Google Scholar : PubMed/NCBI
|
|
36
|
Cui H, Xie N, Tan Z, Banerjee S,
Thannickal VJ, Abraham E and Liu G: The human long noncoding RNA
lnc-IL7R regulates the inflammatory response. Eur J Immunol.
44:2085–2095. 2014. View Article : Google Scholar : PubMed/NCBI
|
|
37
|
Liu R, Tang A, Wang X, Chen X, Zhao L,
Xiao Z and Shen S: Inhibition of lncRNA NEAT1 suppresses the
inflammatory response in IBD by modulating the intestinal
epithelial barrier and by exosome-mediated polarization of
macrophages. Int J Mol Med. 42:2903–2913. 2018.PubMed/NCBI
|
|
38
|
Ma S, Ming Z, Gong AY, Wang Y, Chen X, Hu
G, Zhou R, Shibata A, Swanson PC and Chen XM: A long noncoding RNA,
lincRNA-Tnfaip3, acts as a coregulator of NF-kB to modulate
inflammatory gene transcription in mouse macrophages. FASEB J.
31:1215–1225. 2017. View Article : Google Scholar : PubMed/NCBI
|
|
39
|
Zhao F, Qu Y, Liu J, Liu H, Zhang L, Feng
Y, Wang H, Gan J, Lu R and Mu D: Microarray profiling and
co-expression network analysis of LncRNAs and mRNAs in neonatal
rats following hypoxic-ischemic brain damage. Sci Rep. 5:138502015.
View Article : Google Scholar : PubMed/NCBI
|