Introduction
Hypertrophic cardiomyopathy (HCM) is one of the most
commonly inherited heart diseases, with a prevalence of one in 167
people (1). It is the leading
cause of sudden cardiac death among adolescents and young adults,
especially athletes (2). HCM is an
autosomal dominant genetic disorder caused predominantly by
mutations in sarcomere genes, such as myosin binding protein C3
(MYBPC3) and myosin heavy chain 7 (MYH7) (3). However, disease-causing sarcomere
mutations are absent in ~70% of patients with established disease,
and sarcomere gene carriers can live to advanced ages without
developing disease (4). Thus,
expanding the focus of HCM research beyond DNA mutations towards
epigenetic determinants, such as noncoding RNA, may provide insight
into the pathogenesis of this disease (4).
Long noncoding RNAs (lncRNAs) constitute a
heterogeneous class of transcripts >200 nucleotides in length
(5). Compared with coding mRNA,
most lncRNAs cannot code proteins and have previously been regarded
as genomic transcriptional noise. Nevertheless, increasing evidence
suggests that lncRNAs are involved in several biological processes
and diseases, such as heart failure, acute myocardial fibrosis and
atherosclerosis (6). lncRNAs have
been implicated in the pathological processes of HCM, including
myocardial hypertrophy, cardiomyocyte disarrangement and
interstitial fibrosis (7). A
previous microarray study identified several dysregulated lncRNAs
in myocardial tissue from patients with HCM, compared with control
subjects (8). However, changes in
circulating extracellular lncRNAs, which are an emerging class of
biomarkers relevant to myocardial biology (9), have not been determined in HCM.
Weighted gene co-expression network analysis (WGCNA)
is a novel and powerful systems biology method that is increasingly
used in bioinformatics analysis of microarray profiling data
(10). Using this method, highly
correlated genes are clustered into modules, and several modules
form a gene co-expression network. After relating modules to
clinical traits, biologically relevant modules can be identified in
any given disease. Compared with standard comparative analysis,
WGCNA can identify critical genes with key roles in the phenotype
and development of a disease from interesting modules associated
with important clinical traits (11). Despite the strengths and popularity
of network analysis, WGCNA has not been employed to analyse lncRNA
microarray data in HCM. Therefore, in the present study, WGCNA and
further analyses were performed to identify circulating hub lncRNAs
associated with HCM. The aim of the study was to identify potential
biomarkers and therapeutic targets for improved diagnosis and
treatment of HCM.
Materials and methods
Study population
The study population consisted of 14 HCM patients
and 7 healthy control subjects at Sun Yat-sen Memorial Hospital of
Sun Yat-sen University from October 2018 to May 2019. HCM diagnosis
was carried out according to the European Society of Cardiology
Guidelines (12). HCM was defined
as wall thickness ≥15 mm in one or more left ventricular myocardial
segments in individuals with no history of HCM, or a wall thickness
≥13 mm in one or more left ventricular myocardial segments in
individuals with an HCM history in a first-degree relative, as
measured by echocardiography or cardiac magnetic resonance
(12). Patients with a history of
ventricular septal surgery, valvular heart disease, coronary artery
disease, atrial fibrillation, systemic hypertension, diabetes,
surgery or trauma within six months, cancer or renal dysfunction
were excluded from the study.
This study was carried out in accordance with the
recommendations of the ethics committee of Sun Yat-sen Memorial
Hospital, and all subjects provided written informed consent in
accordance with the Declaration of Helsinki.
Plasma collection and microarray
Whole blood was collected in venous blood collection
tubes containing EDTA after overnight fasting, and plasma was
separated by centrifugation. Total RNA (250 ng) was isolated using
a Plasma RNA Purification Mini kit (Norgen Biotek Corp.) according
to the manufacturer's instructions and purified using an RNeasy
Mini kit (Qiagen GmbH). RNA integrity was examined using an Agilent
Bioanalyzer 2100 (Agilent Technologies, Inc.). RNA samples from
each group were then used to generate biotinylated cRNA targets for
the LC Human ceRNA array (version 1.0; LC-Bio Technology Co.,
Ltd.). In brief, RNA was reverse transcribed into first strand of
cDNA with Promoter Primer by AffinityScript-RT Kit (Agilent
Technologies, Inc.). The second strand of cDNA was generated with
Anti-sense Promotor. This cDNA was used as a template to synthesize
cRNA by the T7 RNA polymerase mix. The biotinylated cRNA targets
were then hybridized with slides for 17 h at 65°C. After
hybridization, the slides were scanned on an Agilent Microarray
Scanner (Agilent Technologies, Inc.). Data were extracted using
Feature Extraction software (version 12.0.3.1; Agilent
Technologies, Inc.). Raw data were normalized with the quantile
algorithm using Genespring software (version 14.8, Agilent
Technologies, Inc.). The microarray experiments were performed
following the protocol of Agilent Technologies Inc. by LC Sciences
Corporation. All microarray data have been uploaded in the Gene
Expression Omnibus (GEO) database under the accession number
GSE143786 (https://www.ncbi.nlm.nih.gov/geo/query/acc.cgi?acc=GSE143786).
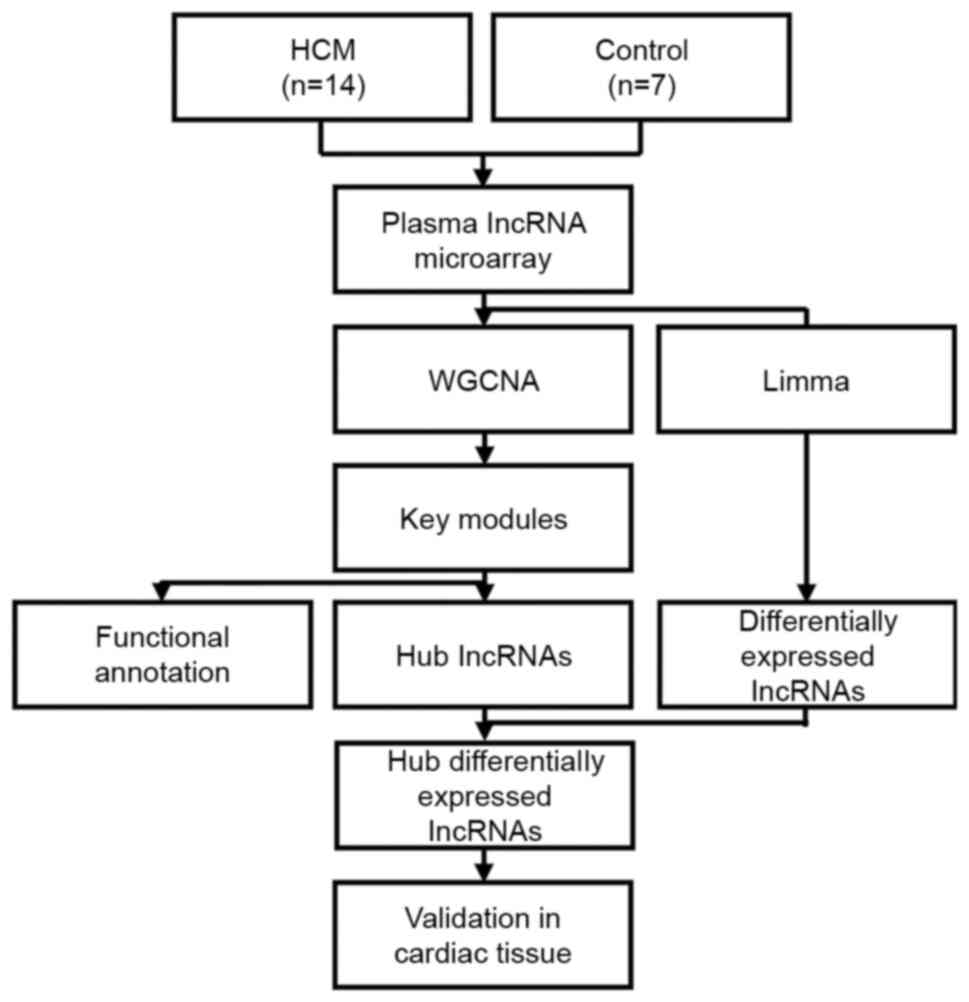
After microarray data collection, bioinformatic analysis and
validation were performed according to the flow chart presented in
Fig. 1.
WGCNA
The WGCNA R package (version 1.68, http://cran.r-project.org/web/packages/WGCNA/index.html)
was used to construct a weighted correlation network between
lncRNAs, as described previously (10). In the network, pairwise Pearson
coefficients were calculated to evaluate the weighted co-expression
relationship between all genes in the adjacency matrix. To ensure a
scale-free network, a soft threshold of β was used to guarantee the
minimum scale free topology fitting index R2 as 0.8. The
topological overlap measure (TOM) was used to represent the network
interconnectedness. Gene modules consisting of genes with high
correlation were detected using the hierarchical clustering method,
based on a TOM-based dissimilarity measure (1-TOM) (13). Each module was assigned a unique
colour. Hierarchical clustering dendrograms were identified using
the dynamic branch cut method in WGCNA (14).
Identification of clinically relevant
modules and functional annotation
Gene significance (GS), module significance (MS) and
module eigengene (ME) were calculated. Briefly, GS was defined
as-log (P-value) of a gene, MS was the average GS across the
module, and the ME was the first principal component of a given
module. The significance between the ME and interested clinical
trait was also calculated, as modules with high trait significance
(P<0.05) may be highly associated with disease (15). Modules from hierarchical clustering
with significant correlations with clinical traits were selected as
key modules, under the criteria of correlation efficient ≥0.55 and
P<0.05, for subsequent analysis. For each key module,
intramodular analysis was carried out to evaluate the association
between module membership (correlation efficient between lncRNA
expression and ME) and GS for HCM, thickness, obstruction, and left
atrial diameter using Pearson correlation method. Gene ontology
(GO) functional annotation using the ClueGO app in Cytoscape
(version 3.7.2; http://cytoscape.org/) was performed to identify the
potential functions and underlying mechanisms associated with
selected modules (16,17).
Identification and validation of
differentially expressed hub lncRNAs
Hub genes in key modules were defined as genes with
an absolute value of the module membership >0.8, the correlation
efficient between lncRNA and clinical trait >0.2 and the
weighted P-value of association with the trait <0.01 (18). Differentially expressed lncRNAs
were identified using the Linear Models for Microarray data (Limma)
package (version 3.34.9) in R (19). Volcano plot and heatmap were
generated using R tool to shown differential expressed lncRNAs
explicitly. The z-score for each lncRNA was calculated by
subtracting the mean level from the raw expression level, then
dividing the difference by the standard deviation. Differentially
expressed hub lncRNAs were obtained by mapping hub lncRNAs against
differentially expressed lncRNAs. The GSE68316 lncRNA microarray
was obtained from the GEO database using cardiac samples and used
for validation of these differentially expressed hub lncRNAs using
the Limma package in R. Each differentially expressed hub lncRNA in
our own dataset was evaluated whether it was also significantly
dysregulated in GSE68316 dataset. Benjamini-Hochberg adjustment for
P-values was applied to the Limma analysis.
Statistical analysis
Categorical variables are presented as n (%), and
continuous variables as the mean ± SD. Student's t-test and
Fisher's exact probability test were used to compare differences
between the HCM group and the control group. All statistical
analyses were performed with the R tool (version 3.6.1; http://www.r-project.org/). P<0.05 was considered
to indicate a statistically significant difference.
Results
Baseline characteristics of the study
participants
A total of 14 patients with HCM patients and seven
control subjects were enrolled in the present study. The average
age of all enrolled subjects was 58.85±2.12 years (data not shown).
No significant differences in age, sex, or body mass index were
observed between the two groups. Total cholesterol levels were
significantly increased (P<0.001), and blood glucose levels
significantly reduced (P=0.028) in the HCM group, compared with the
control group. Cardiac ultrasound examination indicated that the
maximum left ventricular wall thickness was significantly increased
in patients with HCM, compared with healthy controls (20.00±4.52
and 9.28±1.25 mm, respectively; P<0.001; Table SI).
Data pre-processing and co-expression
network construction
To construct a co-expression network, all 16,996
lncRNAs obtained with 21 plasma samples by microarray were used in
the following analysis. In the present study, the soft-thresholding
power was determined to be β=7, where the scale-free topology fit
curve first reached R2=0.8, to construct a weighted
network based on a scale-free topology criterion, aiming to help
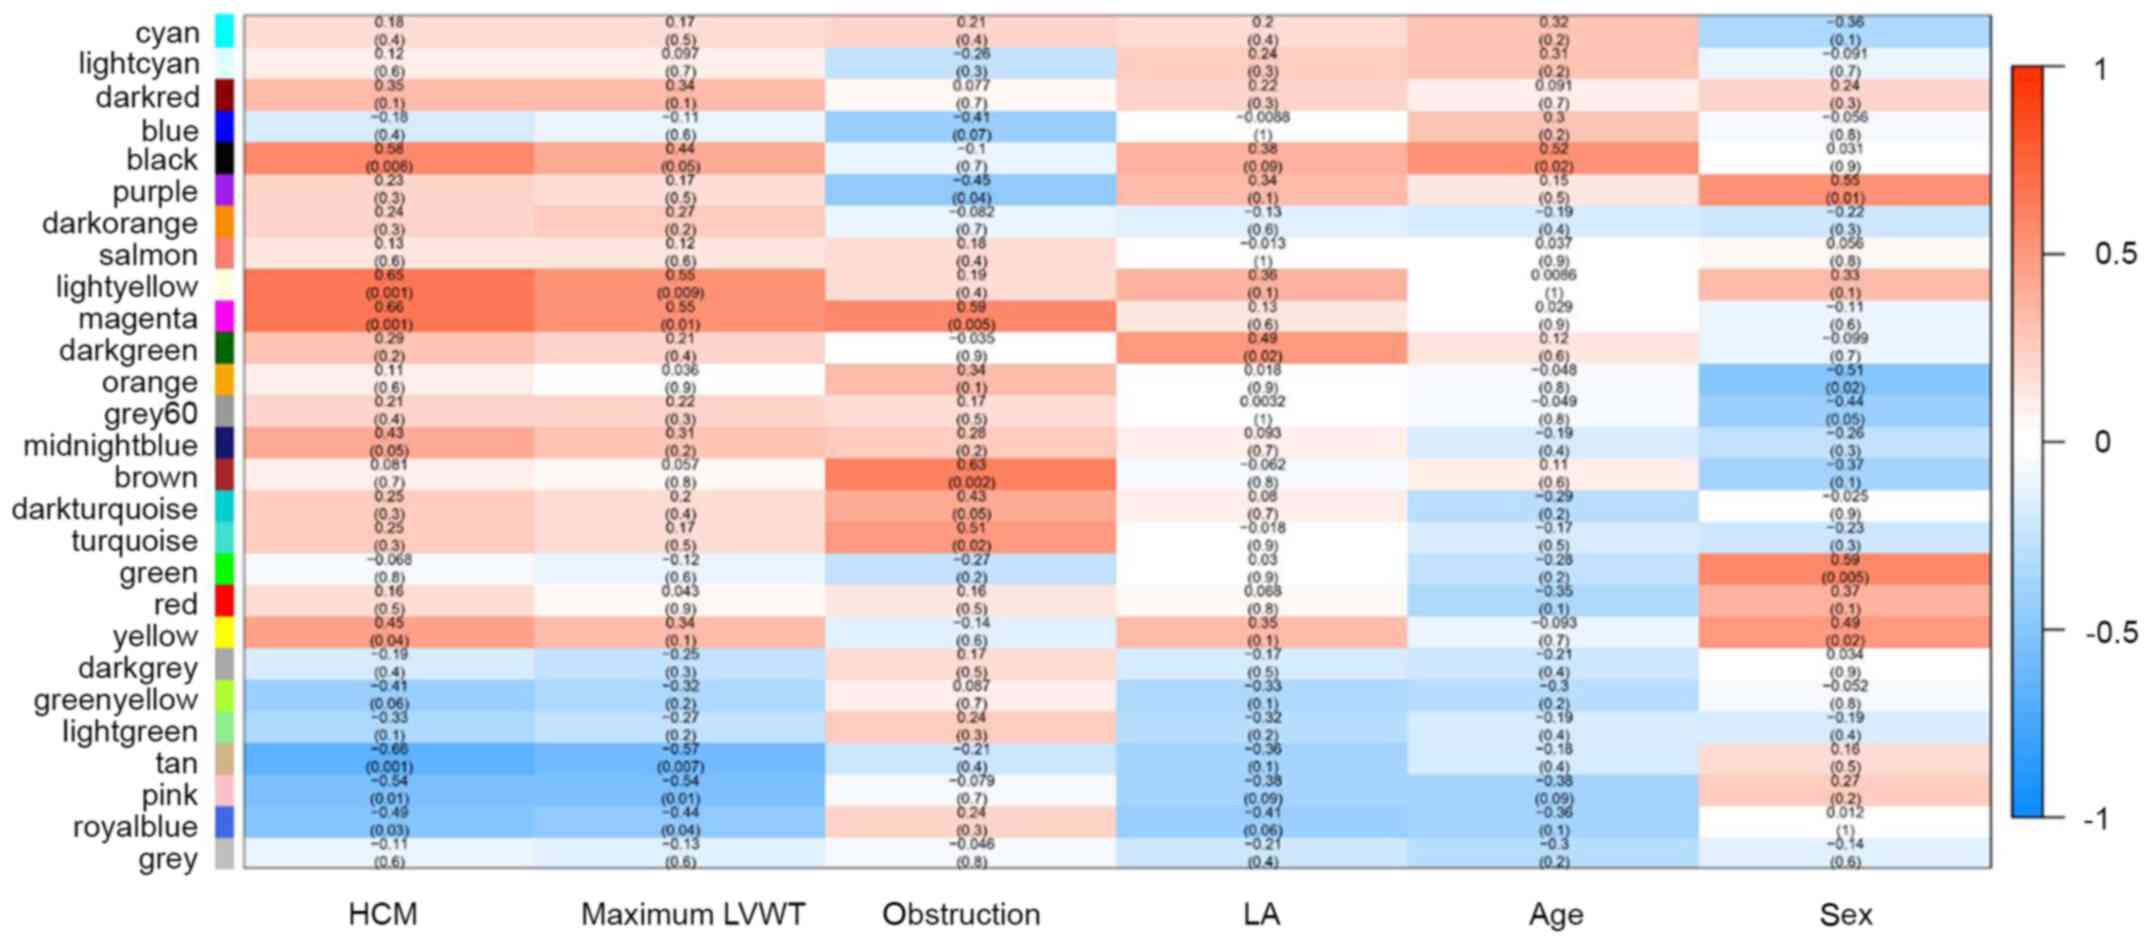
detect modules in following hierarchical clustering (Fig. S1). A total of 27 modules were
detected through the dynamic tree cutting method (Fig. S2). The turquoise module was the
largest module, consisting of 5,630 lncRNAs, while the dark orange
module was the smallest module, with only 35 lncRNAs.
Identification of clinically relevant
modules associated with HCM
After mapping modules to clinical traits,
correlations and significance were observed for the HCM trait,
maximum left ventricular wall thickness, left ventricular outflow
tract obstruction, and left atrial diameter (Fig. 2). The highest correlations with the
HCM trait were observed in the magenta (r=0.66; P=0.001) and tan
module (r=−0.66; P=0.001). Maximum left ventricular wall thickness
was significantly correlated with the light-yellow (r=0.55;
P=0.009), magenta (r=0.55; P=0.01) and tan modules (r=−0.57;
P=0.007). The magenta (r=0.59; P=0.005) and brown modules (r=0.63;
P=0.002) were significantly correlated with left ventricular
outflow tract obstruction.
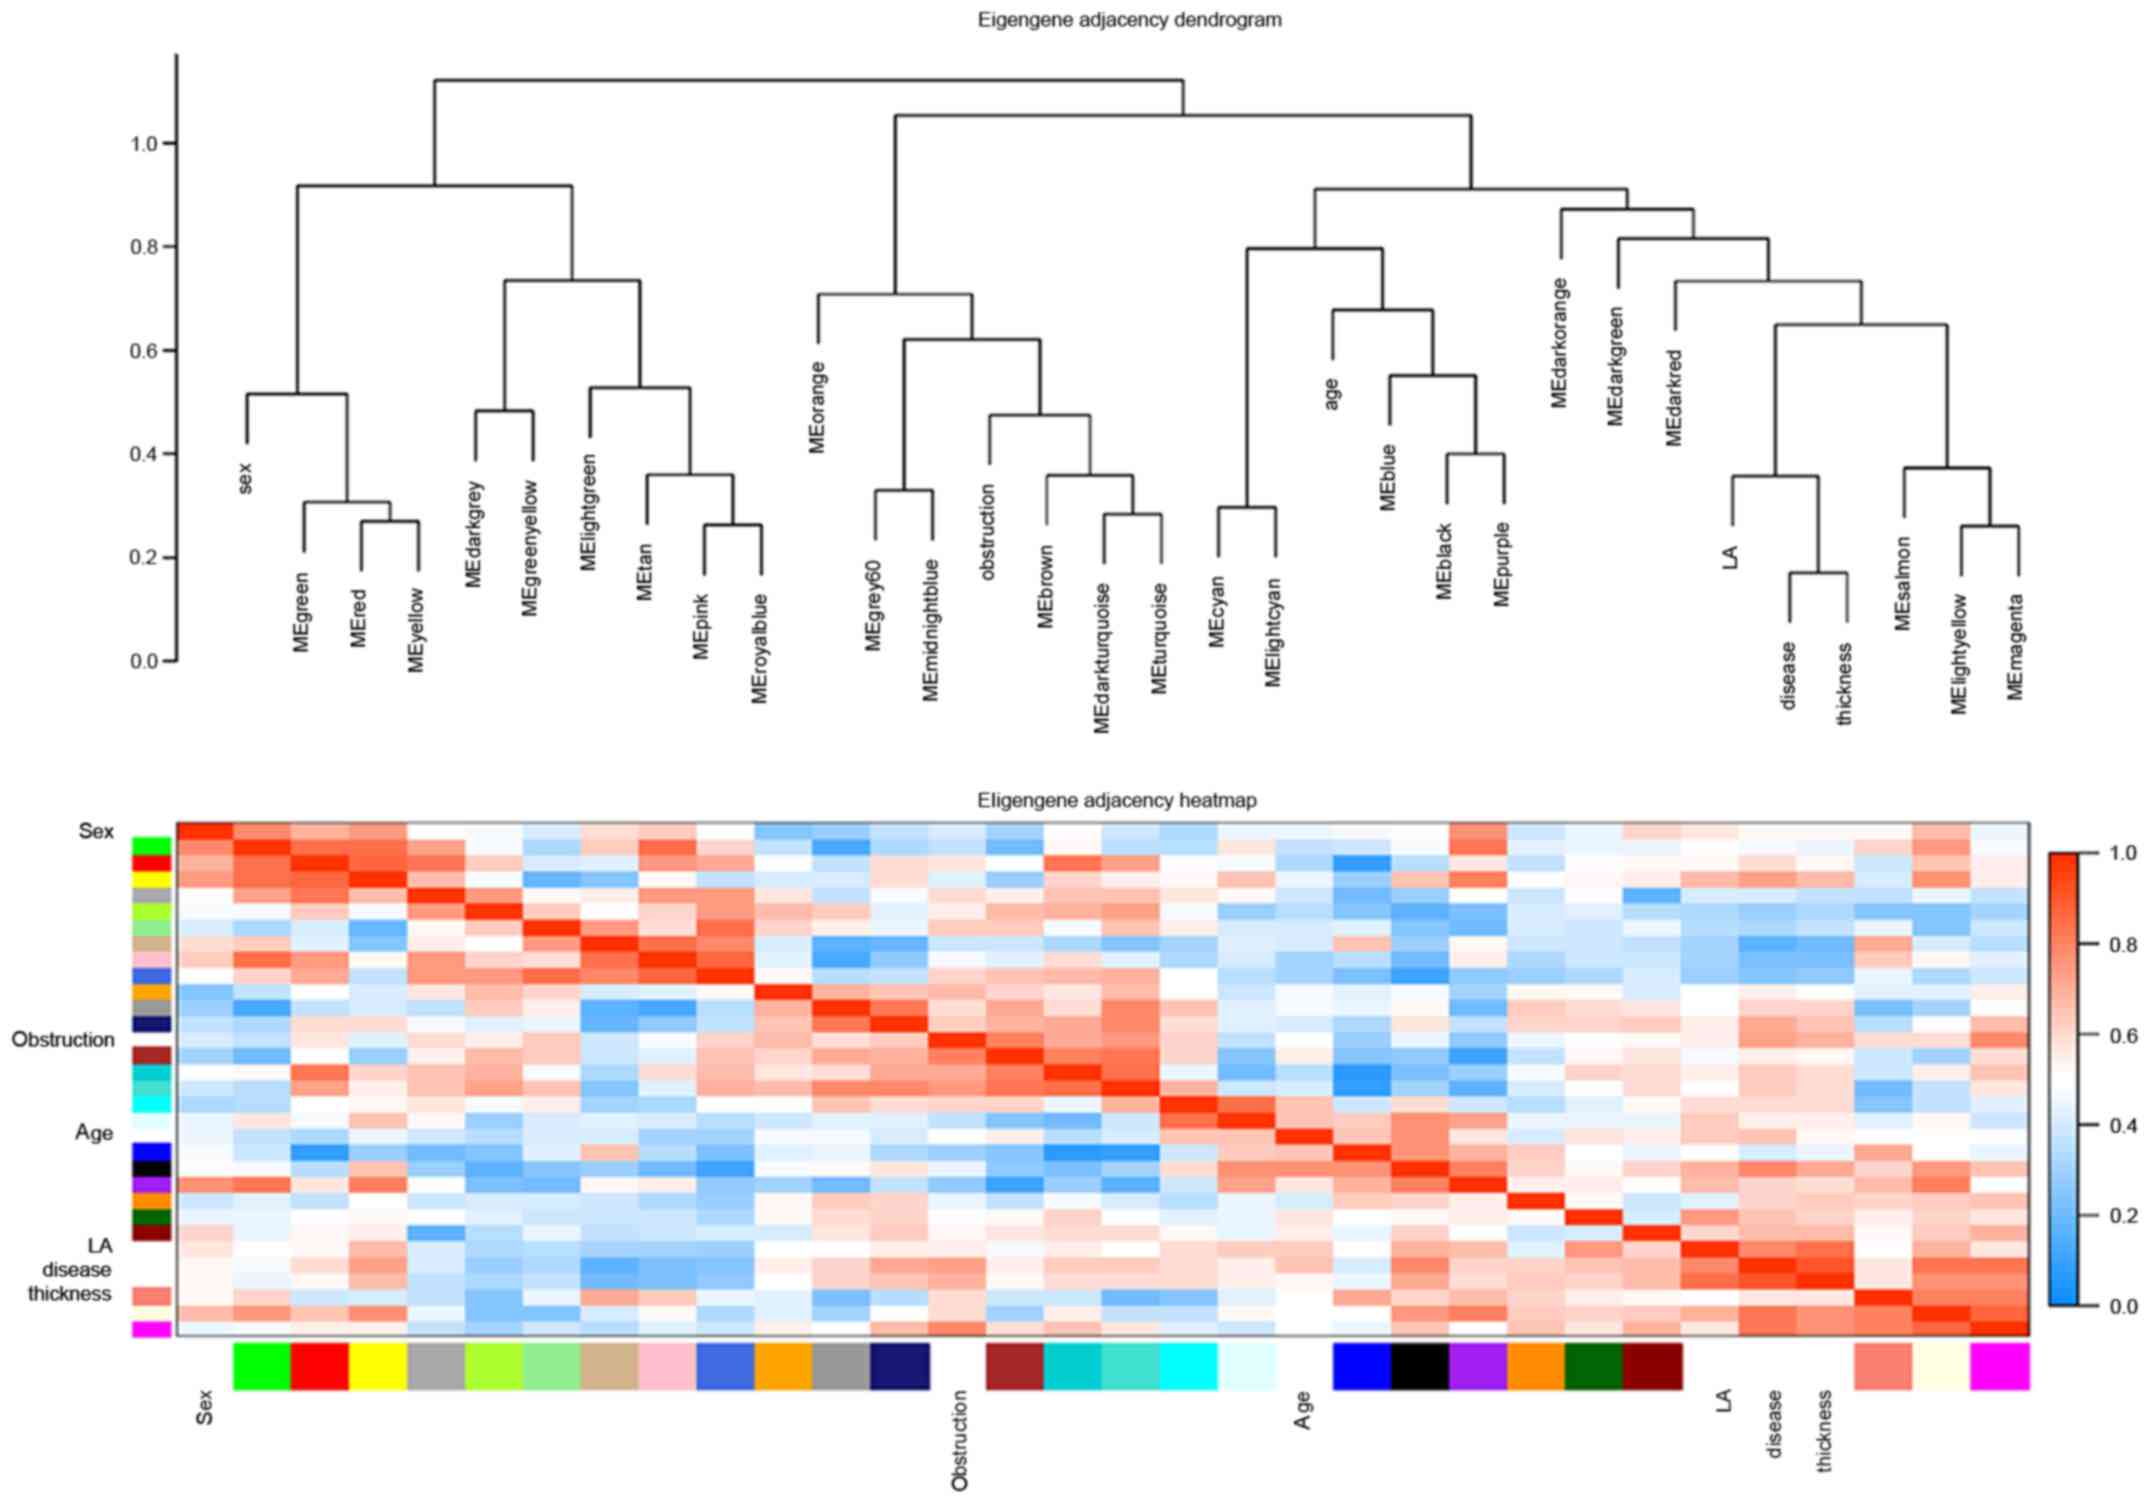
Similarly, in eigengene adjacency dendrograms, the
magenta, light-yellow and salmon modules were associated with HCM,
maximum left ventricular wall thickness, and left ventricular
outflow tract obstruction. Heatmap plot of the adjacencies in the
eigengene network showed a high adjacency between HCM and magenta
module (Fig. 3).
Given the evidence from both module-trait
correlations and eigengene adjacency dendrograms, the magenta and
the light-yellow modules were selected for subsequent analysis.
Intramodular analysis and functional
annotation of modules
For 446 lncRNAs in the magenta module, module
membership positively corelated with GS for HCM (r=0.33;
P=8.1×10⁻¹³), thickness (r=0.36; P=4.0×10⁻¹⁵)
and obstruction (r=0.51; P=5.7×10⁻³¹). A negative
correlation was observed between module membership and GS for left
atrial diameter (r=−0.27; P=6.6×10⁻⁹), according to
intramodular analysis (Fig.
S3).
Similarly, for 65 lncRNAs in the light-yellow
module, positive correlations were observed between module
membership and gene significance for HCM (r=0.42,
P=5×10⁻⁴) and thickness (r=0.31; P=0.012; Fig. S4). Functional annotation
demonstrated that the magenta module was enriched in GO terms, such
as ‘heart growth’, ‘cardiac muscle tissue growth’ and ‘regulation
of coagulation’ (adjusted P<0.05; Fig. S5).
Identification and validation of
differentially expressed hub lncRNAs
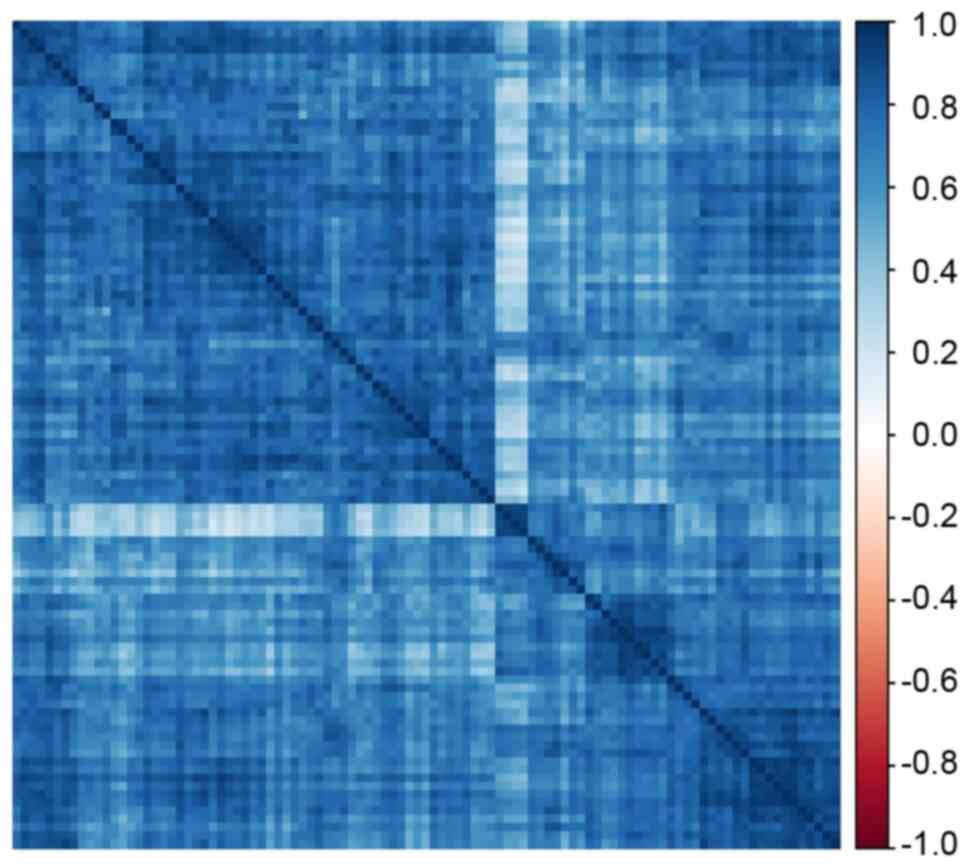
Based on the screening criteria for hub lncRNA, 74
hub lncRNAs and 42 hub lncRNAs were selected from the magenta
module and light-yellow module, respectively (Tables SII and SIII). A correlation heatmap for these
116 hub lncRNAs indicated general positive correlations between
each two hub lncRNAs (Fig. 4).
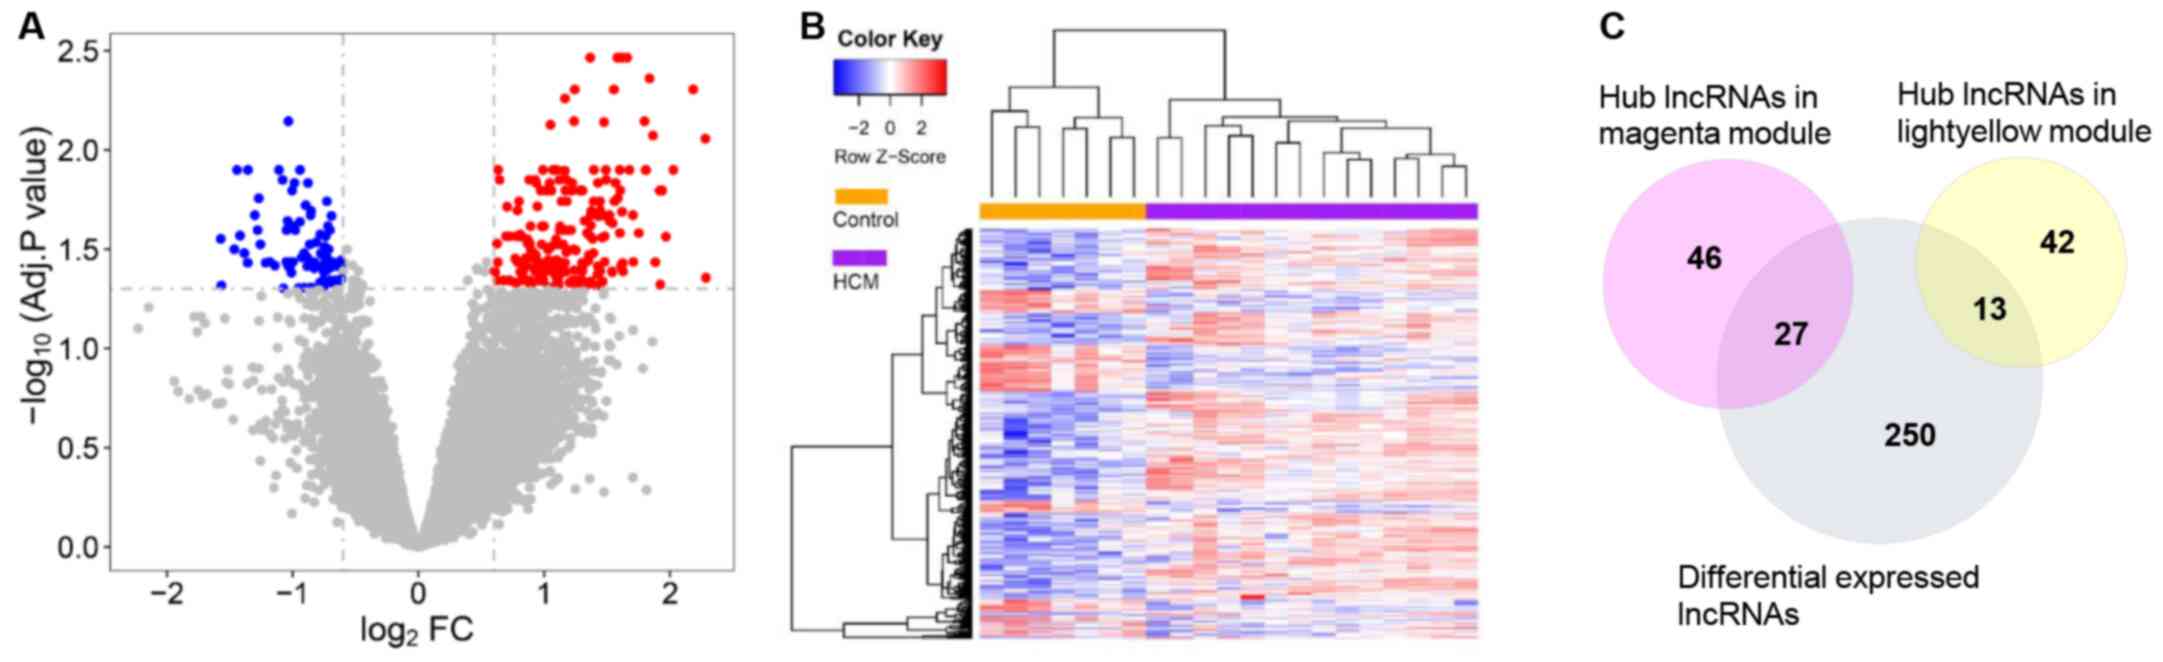
A total of 80 downregulated lncRNAs and 210
upregulated lncRNAs were identified using Limma (Fig. 5A). The HCM and control groups were
distinguishable by hierarchical clustering of differentially
expressed lncRNAs (Fig. 5B). The
hub genes from each module were mapped with all differentially
expressed lncRNAs identified between the HCM and the control
groups. As a result, 27 hub lncRNAs in the magenta module and 13
hub lncRNAs in the light-yellow module were identified as
differentially expressed (adjusted P<0.05 by Limma; Table I).
 | Table I.Number of lncRNAs in the magenta and
light yellow module. |
Table I.
Number of lncRNAs in the magenta and
light yellow module.
| Number | Magenta module | Light yellow
module |
|---|
| lncRNAs | 446 | 65 |
| Hub lncRNAs | 73 | 42 |
| Differential
expressed hub lncRNAs | 27 | 13 |
| Validated in
GSE68316 | 3 | 1 |
The GSE68316 microarray dataset resulting from
cardiac tissue from patients with HCM (n=7) and controls (n=5) was
used for further validation. Among the 40 differentially expressed
hub lncRNAs identified in the magenta and the light-yellow modules,
four lncRNAs were also expressed in the cardiac tissue dataset in
the HCM and control groups. Of these, lnc-P2RY6-1:1 ENST00000488040
and ENST00000588047 were significantly upregulated in the HCM group
(log2 fold change, 0.67, 0.76 and 0.60, respectively;
adjusted P<0.05), compared with the control group (Table II).
| Table II.Four lncRNAs were validated in
GSE68316 dataset by using cardiac tissue. |
Table II.
Four lncRNAs were validated in
GSE68316 dataset by using cardiac tissue.
| lncRNAs | Module | Gene symbol | Log2
(FC) | Adjusted P-value | Log2 (FC)
in GSE68316 | Adjusted P-value in
GSE68316 |
|---|
| lnc-P2RY6-1:1 | Light yellow | lnc-P2RY6-1 | 0.80 |
1.81×10⁻² | 0.67 |
3.30×10⁻³ |
|
ENST00000488040 | Magenta | RP11-550I24.2 | 1.18 |
1.41×10⁻² | 0.76 |
1.75×10⁻⁴ |
|
ENST00000588047 | Magenta | CTD-2006C1.2 | 0.87 |
2.81×10⁻² | 0.60 |
9.59×10⁻⁴ |
|
ENST00000587071 | Magenta | TP73-AS1 | 0.95 |
3.67×10⁻² | −0.10 |
4.70×10⁻¹ |
Functional annotation of 3 hub
differentially expressed lncRNAs
To investigate the potential functions associated
with the differentially expressed hub lncRNAs, the functional
annotation was performed for P2RY6-1:1 ENST00000488040 and
ENST00000588047. ‘Cardiac ventricle morphogenesis’ was associated
with lnc-P2RY6-1:1. Moreover, ENST00000488040 was associated with
‘positive regulation of cardiac muscle hypertrophy’ and
‘physiological cardiac muscle hypertrophy’. In addition,
lnc-P2RY6-1:1 and ENST00000588047 were associated with immune
responses. For instance, lnc-P2RY6-1:1 was associated with ‘T cell
differentiation involved in immune response’, while ENST00000588047
was associated with ‘B cell apoptotic process’ and ‘positive
regulation of T cell migration’ (Table SIV).
Discussion
In the present study, a comprehensive analysis of
lncRNAs was carried out using plasma transcriptome profiles from
patients with HCM and healthy controls. By constructing a WGCNA
network and calculating the co-expression relationships between
lncRNAs, hub genes in key modules were identified, providing an
overview of the expression profiles and functional relationships of
these hub genes. To the best of our knowledge, the present study is
the first to use the WGCNA to screen key lncRNA modules in HCM
plasma. Two modules, the magenta and light-yellow modules, were
strongly associated with HCM. In addition, functional annotation of
the magenta module indicated an association with GO terms, such as
‘cardiac tissue growth’, suggesting a potentially important role in
HCM. Moreover, hub genes within each module were identified using
module membership, gene significance and weighted q thresholds.
Among these hub genes, several differentially expressed hub lncRNAs
in the trait-associated modules were identified, then validated in
an independent dataset from cardiac tissue (8). A total of three validated hub lncRNAs
(lnc-P2RY6-1:1, ENST00000488040, and ENST00000588047) from the two
key modules were significantly differentially upregulated. Thus,
the present study provided a comprehensive evaluation of lncRNA
regulation in HCM and identified lncRNAs that may serve as
biomarkers and therapeutic targets for HCM diagnosis and
treatment.
As a primary cardiovascular inherited disease, HCM
is the most common risk factor of sudden cardiac death among young
people (2). Several mutations in
gene-encoding regions are associated with HCM pathogenesis, with
MYBPC3 and MYH7 sarcomere mutations potentially
underlying approximately one-half of HCM cases (20). However, this observation also
implies that disease-causing sarcomere mutations are absent in ~
one-half of patients with established disease. Additionally,
sarcomere gene mutation carriers can live to advanced ages without
developing HCM, challenging the conventional single-gene hypothesis
for HCM (4). Therefore, expanding
the HCM research focus from causal DNA mutations towards additional
epigenetic determinants of the HCM phenotype may provide new
insight into the pathogenesis of this disease.
Several studies have demonstrated the important role
of lncRNA in the different pathophysiological changes observed in
HCM. For instance, the myosin heavy chain-associated RNA transcript
(Mhrt) lncRNA was found to be cardiac-specific and abundant in
adult hearts (21). Moreover,
lncRNA Mhrt served a protective role in the heart against
hypertrophy and cardiac failure by interacting with chromatin
(21). Genetic variation at the
lncRNA H19 gene is also associated with the predisposition
to HCM (22). A small-sample
lncRNA and mRNA microarray analysis of myocardial tissue from seven
patients with HCM and five controls and identified 965 upregulated
and 461 downregulated lncRNAs by comparative analysis (8). Functional enrichment analysis
indicated that these dysregulated lncRNAs were associated with
ribosome and oxidative phosphorylation (8).
Data mining can extract crucial biological molecule
information from large datasets and identify molecules that may be
used as potential biomarkers or targets to improve the diagnosis,
treatment and prevention of certain diseases. As the most
widespread method in gene expression analysis, traditional
comparative differential expression analysis has a number of
limitations. This method treats each gene separately and enrols
only the most significant dysregulated genes while ignoring others,
assuming that each gene is independent of all other genes (23). By contrast, network topology often
considers global genes and can reveal more gene interaction
information. Among network analysis methods, WGCNA is a systems
biology method for describing correlation patterns among genes
across microarray samples (10).
These methods have been widely applied in various biological
conditions, such as periodontitis (24), osteoarthritis (25) and liver regeneration (26). In the present study, WGCNA and the
Limma method were used together to identify differentially
expressed hub lncRNAs in HCM. Notably, previous studies enrolled
parts of microarray data into WGCNA (25); however, this study entered all
microarray data into the WGCNA rather than the differentially
expressed data in previous studies, which may result in a more
comprehensive correlation network according to the tutorial
(10).
The present study has several limitations. First,
the sample size was relatively small. Although a total of 14 HCM
patients and seven healthy control subjects were enrolled,
representing a larger sample size than that in a previous study
(8), a larger study cohort would
provide further validation of the present findings. Moreover,
type-I error resulting from a large number of analyses of the
microarray data may exist. However, Benjamini-Hochberg adjustment
for P-values in the Limma analysis was applied to reduced type-I
errors. Lastly, as this study evaluated lncRNA expression profiles
based solely on bioinformatics, functional experiments in cardiac
tissue or cells, such as quantitative real-time PCR or western
blotting, should be performed for further validation. Nevertheless,
under the hypothesis that key plasma lncRNAs may be distinctly
expressed in cardiac tissue from patients with HCM, cardiac tissue
microarray data were used for validation, which already partly
confirmed the present findings.
In conclusion, three differentially expressed hub
lncRNAs (lnc-P2RY6-1:1, ENST00000488040, and ENST00000588047) in
two key modules were identified in HCM that may serve as biomarkers
and therapeutic targets for the precise diagnosis and treatment of
HCM in the future.
Supplementary Material
Supporting Data
Acknowledgements
Not applicable.
Funding
The present study was supported by grants from the
National Natural Science Foundation for Young Scientists of China
(grant no. 81700397) and the Guangzhou Science and Technology Plan
Project (grant nos. 201704020044 and 201803040010).
Availability of data and materials
The datasets used and/or analysed during the current
study are available from the corresponding author upon reasonable
request, or in the Gene Expression Omnibus database under the
accession numbers GSE143786 (plasma, http://www.ncbi.nlm.nih.gov/geo/query/acc.cgi?acc=GSE143786)
and GSE68316 (cardiac tissue, http://www.ncbi.nlm.nih.gov/geo/query/acc.cgi?acc=GSE68316).
Authors' contributions
QG, JiW and YZ conceived the present study. JuW and
WG collected and analysed the data. QG, RS and YC performed the
experiments. ZH, WL and QC were responsible for analysis and
visualization of the data. QG and WL wrote the original draft of
the manuscript. YC, JiW and YZ reviewed and edited the manuscript.
All authors have read and approved the manuscript.
Ethics approval and consent to
participate
This study was carried out in accordance with the
recommendations of the ethics committee of Sun Yat-sen Memorial
Hospital (approval no 2018-KY-075). All subjects provided written
informed consent in accordance with the Declaration of
Helsinki.
Patient consent for publication
Not applicable.
Competing interests
The authors declare that they have no competing
interests.
References
|
1
|
Semsarian C, Ingles J, Maron MS and Maron
BJ: New perspectives on the prevalence of hypertrophic
cardiomyopathy. J Am Coll Cardiol. 65:1249–1254. 2015. View Article : Google Scholar : PubMed/NCBI
|
|
2
|
Marian AJ and Braunwald E: Hypertrophic
cardiomyopathy: Genetics, pathogenesis, clinical Manifestations,
diagnosis, and therapy. Circ Res. 121:749–770. 2017. View Article : Google Scholar : PubMed/NCBI
|
|
3
|
Geske JB, Ommen SR and Gersh BJ:
Hypertrophic cardiomyopathy: Clinical update. JACC Heart Fail.
6:364–375. 2018. View Article : Google Scholar : PubMed/NCBI
|
|
4
|
Maron BJ, Maron MS, Maron BA and Loscalzo
J: Moving beyond the sarcomere to explain heterogeneity in
hypertrophic cardiomyopathy: JACC review topic of the week. J Am
Coll Cardiol. 73:1978–1986. 2019. View Article : Google Scholar : PubMed/NCBI
|
|
5
|
Sallam T, Sandhu J and Tontonoz P: Long
noncoding RNA discovery in cardiovascular disease: Decoding form to
function. Circ Res. 122:155–166. 2018. View Article : Google Scholar : PubMed/NCBI
|
|
6
|
Lucas T, Bonauer A and Dimmeler S: RNA
therapeutics in cardiovascular disease. Circ Res. 123:205–220.
2018. View Article : Google Scholar : PubMed/NCBI
|
|
7
|
Sun J and Wang C: Long non-coding RNAs in
cardiac hypertrophy. Heart Fail Rev. Oct 29–2019.(Epub ahead of
print). PubMed/NCBI
|
|
8
|
Yang W, Li Y, He F and Wu H: Microarray
profiling of long Non-coding RNA (lncRNA) associated with
hypertrophic cardiomyopathy. BMC Cardiovasc Disord. 15:622015.
View Article : Google Scholar : PubMed/NCBI
|
|
9
|
Shah RV, Rong J, Larson MG, Yeri A,
Ziegler O, Tanriverdi K, Murthy V, Liu X, Xiao C, Pico AR, et al:
Associations of circulating extracellular RNAs with myocardial
remodeling and heart failure. JAMA Cardiol. 3:871–876. 2018.
View Article : Google Scholar : PubMed/NCBI
|
|
10
|
Langfelder P and Horvath S: WGCNA: An R
package for weighted correlation network analysis. BMC
Bioinformatics. 9:5592008. View Article : Google Scholar : PubMed/NCBI
|
|
11
|
Zhang J, Nie Q, Si C, Wang C, Chen Y, Sun
W, Pan L, Guo J, Kong J, Cui Y, et al: Weighted gene co-expression
network analysis for RNA-sequencing data of the varicose veins
transcriptome. Front Physiol. 10:2782019. View Article : Google Scholar : PubMed/NCBI
|
|
12
|
Elliott PM, Anastasakis A, Borger MA,
Borggrefe M, Cecchi F, Charron P, Hagege AA, Lafont A, Limongelli
G, Mahrholdt H, et al: 2014 ESC guidelines on diagnosis and
management of hypertrophic cardiomyopathy: The task force for the
diagnosis and management of hypertrophic cardiomyopathy of the
european society of cardiology (ESC). Eur Heart J. 35:2733–2779.
2014. View Article : Google Scholar : PubMed/NCBI
|
|
13
|
Ravasz E, Somera AL, Mongru DA, Oltvai ZN
and Barabási AL: Hierarchical organization of modularity in
metabolic networks. Science. 297:1551–1555. 2002. View Article : Google Scholar : PubMed/NCBI
|
|
14
|
Langfelder P, Zhang B and Horvath S:
Defining clusters from a hierarchical cluster tree: The dynamic
tree cut package for R. Bioinformatics. 24:719–720. 2008.
View Article : Google Scholar : PubMed/NCBI
|
|
15
|
Fuller TF, Ghazalpour A, Aten JE, Drake
TA, Lusis AJ and Horvath S: Weighted gene coexpression network
analysis strategies applied to mouse weight. Mamm Genome.
18:463–472. 2007. View Article : Google Scholar : PubMed/NCBI
|
|
16
|
Bindea G, Mlecnik B, Hackl H, Charoentong
P, Tosolini M, Kirilovsky A, Fridman WH, Pages F, Trajanoski Z and
Galon J: ClueGO: A Cytoscape plug-in to decipher functionally
grouped gene ontology and pathway annotation networks.
Bioinformatics. 25:1091–1093. 2009. View Article : Google Scholar : PubMed/NCBI
|
|
17
|
Shannon P, Markiel A, Ozier O, Baliga NS,
Wang JT, Ramage D, Amin N, Schwikowski B and Ideker T: Cytoscape: A
software environment for integrated models of biomolecular
interaction networks. Genome Res. 13:2498–2504. 2003. View Article : Google Scholar : PubMed/NCBI
|
|
18
|
Horvath S and Dong J: Geometric
interpretation of gene coexpression network analysis. PLoS Comput
Biol. 4:e10001172008. View Article : Google Scholar : PubMed/NCBI
|
|
19
|
Ritchie ME, Phipson B, Wu D, Hu YF, Law
CW, Shi W and Smyth GK: Limma powers differential expression
analyses for RNA-sequencing and microarray studies. Nucleic Acids
Res. 43:e472015. View Article : Google Scholar : PubMed/NCBI
|
|
20
|
Burns C, Bagnall RD, Lam L, Semsarian C
and Ingles J: Multiple gene variants in hypertrophic cardiomyopathy
in the era of Next-generation sequencing. Circ Cardiovasc Genet.
10:e0016662017. View Article : Google Scholar : PubMed/NCBI
|
|
21
|
Han P, Li W, Lin CH, Yang J, Shang C,
Nuernberg ST, Jin KK, Xu W, Lin CY, Lin CJ, et al: A long noncoding
RNA protects the heart from pathological hypertrophy. Nature.
514:102–106. 2014. View Article : Google Scholar : PubMed/NCBI
|
|
22
|
Gomez J, Lorca R, Reguero JR, Martin M,
Moris C, Alonso B, Iglesias S, Diaz-Molina B, Avanzas P and Coto E:
Genetic variation at the long noncoding RNA H19 gene is associated
with the risk of hypertrophic cardiomyopathy. Epigenomics.
10:865–873. 2018. View Article : Google Scholar : PubMed/NCBI
|
|
23
|
Khatri P, Sirota M and Butte AJ: Ten years
of pathway analysis: current approaches and outstanding challenges.
PLoS Comput Biol. 8:e10023752012. View Article : Google Scholar : PubMed/NCBI
|
|
24
|
Jin SH, Zhou RH, Guan XY, Zhou JG and Liu
JG: Identification of novel key lncRNAs involved in periodontitis
by weighted gene co-expression network analysis. J Periodontal Res.
55:96–106. 2020. View Article : Google Scholar : PubMed/NCBI
|
|
25
|
Gu HY, Yang M, Guo J, Zhang C, Lin LL, Liu
Y and Wei RX: Identification of the biomarkers and pathological
process of osteoarthritis: Weighted gene co-expression network
analysis. Front Physiol. 10:2752019. View Article : Google Scholar : PubMed/NCBI
|
|
26
|
Yin L, Wang Y, Lin Y, Yu G and Xia Q:
Explorative analysis of the gene expression profile during liver
regeneration of mouse: A microarray-based study. Artif Cells
Nanomed Biotechnol. 47:1113–1121. 2019. View Article : Google Scholar : PubMed/NCBI
|