Introduction
Constipation commonly affects ~27% of the population
in industrialized nations (1). It
results in high frequencies of hospitalization, long-term
overexposure to laxative prescriptions and a general healthcare
burden worldwide (2,3). Although constipation is not strictly
gender-specific, a severe type is exclusively found in women
(4). Slow-transit constipation
(STC), affecting 13–37% of patients with chronic constipation in
both Western nations and Asia, commonly occurs in young women with
a comparably long history of abnormal bowel movements since
adolescence (2). For a number of
patients with mild STC, a high-fibre diet alone can relieve the
symptoms of constipation. Patients with severe STC, however, fail
to respond to both dietary fibre and laxatives (2,5). In
China, the significance of STC has not been fully recognized.
Limited therapeutic interventions result in increased excess
laxative treatment, long-term discomfort and difficulty in
obtaining samples (6,7). In fact, the genomic investigation of
STC remains sparse.
Notably, although multiple therapeutic management
strategies, including fibre supplements, prokinetic drugs and
biofeedback therapy, have been instituted, total colectomy and
ileorectostomy remain the final and most effective management for
patients with STC (2). In
addition, there is an overlap between STC and other subtypes of
constipation, including irritable bowel syndrome and pelvic floor
dyssynergia, highlighting the sophisticated mechanisms involved in
STC (8–10).
Previous histopathological investigations have
revealed that a reduced number of interstitial cells of Cajal (ICC)
and abnormalities in the myenteric plexus neurons, neurotransmitter
P substance, intestinal peptide and nitric oxide are associated
with STC (11–13). Interestingly, the loss of ICC is
also found in gastroparesis with increased CD45 and CD68
immunoreactivity (14), indicating
potential similarities between STC and gastroparesis. The
diagnostic and prognostic roles of miRNAs in various types of
malignancies and disorders have been explored over the last decade
(15,16). Previously, a negative correlation
between miRNA-128 and macrophages in STC was reported by Liu et
al (17). However, the exact
mechanism underlying STC remains largely unknown.
Thus, the present study was conducted to
characterize miRNA expression and identify key miRNAs associated
with STC using weighted gene correlation network analysis (WGCNA).
WGCNA was established to identify and delineate significant modules
comprising highly clustered genes and to further correlate those
genes modules with certain clinical traits (18,19).
Distinct from the differential gene expression analysis strategy,
WGCNA upgrades and facilitates gene screening and biological
applications/processes. This bioinformatics analysis was performed
using the publicly available miRNA expression profile GSE57969.
Materials and methods
Gene expression profile in Gene
Expression Omnibus (GEO)
The non-coding RNA expression profile, GSE57969, was
downloaded from the GEO database (http://www.ncbi.nlm.nih.gov/geo/) (20) with annotated clinical information.
The GSE57969 dataset consisted of six colon tissues from six
patients (five females and one male) with STC who underwent
colectomy (total colectomy and ileorectal anastomosis or subtotal
colectomy with antiperistaltic cecoproctostomy) and six normal
colon tissues as controls from six patients (five females and one
male) with colon cancer in a tumor-free area at least 5 cm away
from the primary lesions. Notably, patients in the control group
were free from constipation. The microarrays of all samples were
scanned. The data were processed by Agilent Feature Extraction
software version 9.5.3 and Gene Spring software version 11.0
(Agilent Technologies, Inc.) with normalization. The normalized
data were annotated by the platform GPL11487 (Agilent-021827 Human
miRNA Microarray) (17).
Identification of differentially
expressed miRNAs
The differentially expressed miRNAs were determined
by GEO2R (https://www.ncbi.nlm.nih.gov/geo/geo2r), a web-based
analysis tool for in silico bioinformatics analysis
(21). The cut-off value for the
differentially expressed miRNAs was defined as an adjusted P-value
of <0.05. The heatmap and volcano was generated by R software
(3.6.0, http://www.r-project.org) (22).
WGCNA
WGCNA was performed in an R environment (18,19).
The entire standardized miRNA expression profile, GSE57696, was
measured by Pearson's correlation coefficients. The generated
similarity matrix was used to describe the concordance between
miRNA expression. Afterwards, an adjacency matrix was generated by
the similarity matrix according to the selected power adjacency
function, predefined as the connection strengths on each node
(18,19). In the present study, a power β=9
was selected as the most qualified value based on the criterion of
the scale-free topology (19).
Next, the topological overlap measurement (TOM; a
dissimilarity measure of average linkage hierarchical clustering)
was performed. Topological overlap can be measured to the
interconnectedness of networks in terms of overlap (23). Within the dendrogram, modules are
represented as tree branches with a dynamic tree-cut algorithm
using hybrid branch cutting method (23,24).
To further quantify the associations between modules and clinical
traits (gender and disease status, STC or control), the module
eigengenes were calculated and correlated with the clinical traits
(Module-Trait Relationships) (19,24).
The association between individual genes and STC was
defined by the gene significance (GS) (19). Module membership (also known as
eigengene-based connectivity) was defined as the correlation
between the module eigengene and the gene expression profile, with
the aim to quantify the similarity of every module to the matrix
(18,19). The module with the most significant
P-value and correlation was chosen for further processing. The
miRNAs with a correlation value >0.6 or <-0.6 for STC were
identified as the key miRNAs.
Functional enrichment of the key miRNA
target genes
The miRNA target genes were predicted by three
independent web-based databases for miRNA target prediction,
TargetScanHuman (http://targetscan.org/vert_72/) (25), miRDB (http://mirdb.org/) (26) and microT-CDS (http://diana.imis.athena-innovation.gr/DianaTools/index.php?r=MicroT_CDS/index)
(27). All the predicted miRNA
targets were subsequently annotated by Kyoto Encyclopedia of Genes
and Genomes (KEGG) and Gene Ontology (GO), which breaks processes
down into Biological Process (BP), Cellular Components (CC) and
Molecular Functions (MF) with the Database for Annotation,
Visualization and Integrated Discovery (https://david.ncifcrf.gov/) (28–30).
Additional pathway enrichment was performed using the BioCarta
database, a newly established dataset collection for mining genes
(31).
Protein-Protein Interaction (PPI)
networks of key miRNA target genes
The PPI networks of the miRNA target genes were
constructed by the Search Tool for the Retrieval of Interacting
Genes database and further visualized by the Cytoscape program
(version 3.6.0) (32,33). The cut-off values were: Degree ≥1,
node score=0.2 and k-score=2 with the max depth=100. The
top-scoring modules were identified by the Molecular Complex
Detection (MCODE) algorithm (34).
The MCODE was embedded in Cytoscape software. Each top-scoring
module was separately displayed in PPI as well. Moreover, the top
10 genes with the highest degrees were identified as the hub
genes.
Statistical analysis
R software (3.6.0, http://www.r-project.org) (22) and GraphPad Prism 5.0 software
(GraphPad Software, Inc.) were selected for illustration and
statistical analysis. For correlation analysis, a Pearson test was
used for measurement. Adjusted P-values were generated by the GEO2R
web tool and used for statistical comparison in terms of the
initial identification of differentially expressed genes. P<0.05
was considered to indicate a statistically significant difference
in terms of rest condition.
Results
WGCNA
The information of the included normalized samples
for GSE57969 is displayed in Table
SI and Fig. S1. The workflow
of the bioinformatics analysis is displayed (Fig. S2). The differentially expressed
miRNAs between the normal and STC groups were analyzed based on the
GEO2R web tool. Interestingly, none of the miRNAs displayed
remarkable differential expression between the normal and STC
groups given all the adjusted P-values were >0.05 (Table SII). However, the heatmap and
volcano plot of miRNAs with P<0.05 were also exhibited (Figs. S3 and S4).
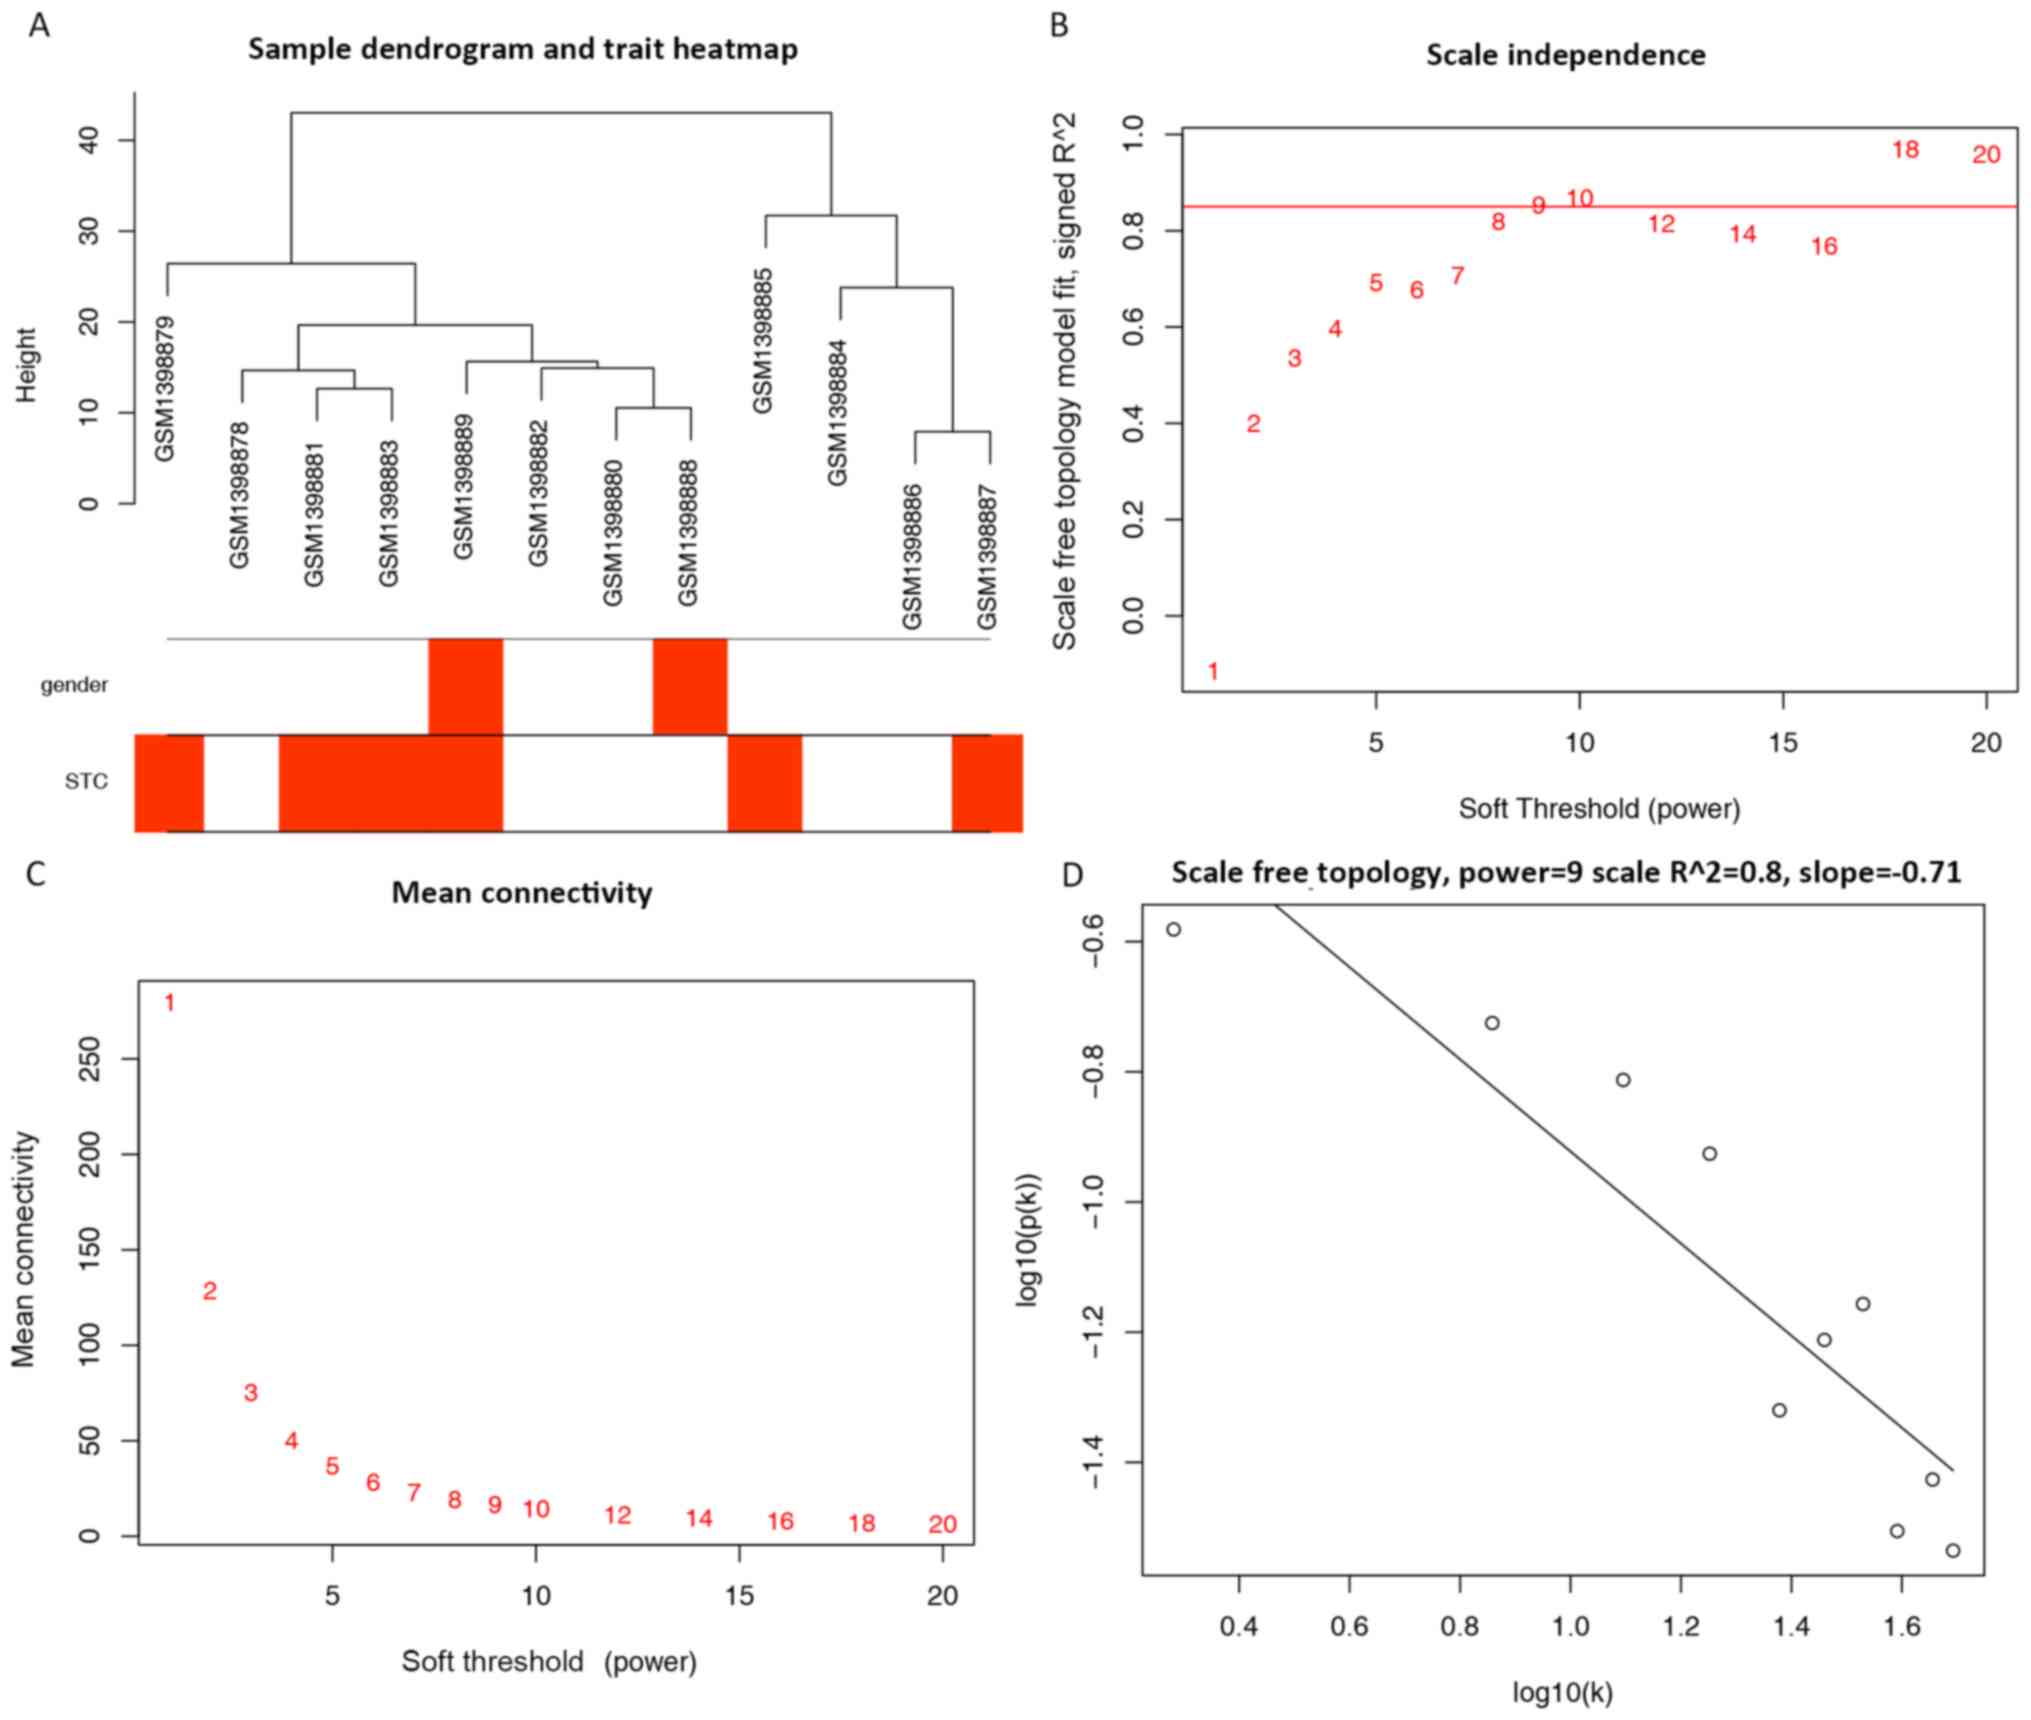
A total of 961 miRNAs and 12 samples retrieved from
the original expression profiles were used for the co-expression
network (Fig. 1A). A power of β=9
was selected as the optimal soft-threshold value for the subsequent
construction of networks (Fig.
1B-D). The network was selected as unsigned with a minimal
module size of 30 and a merge cut height of 0.25; however, a total
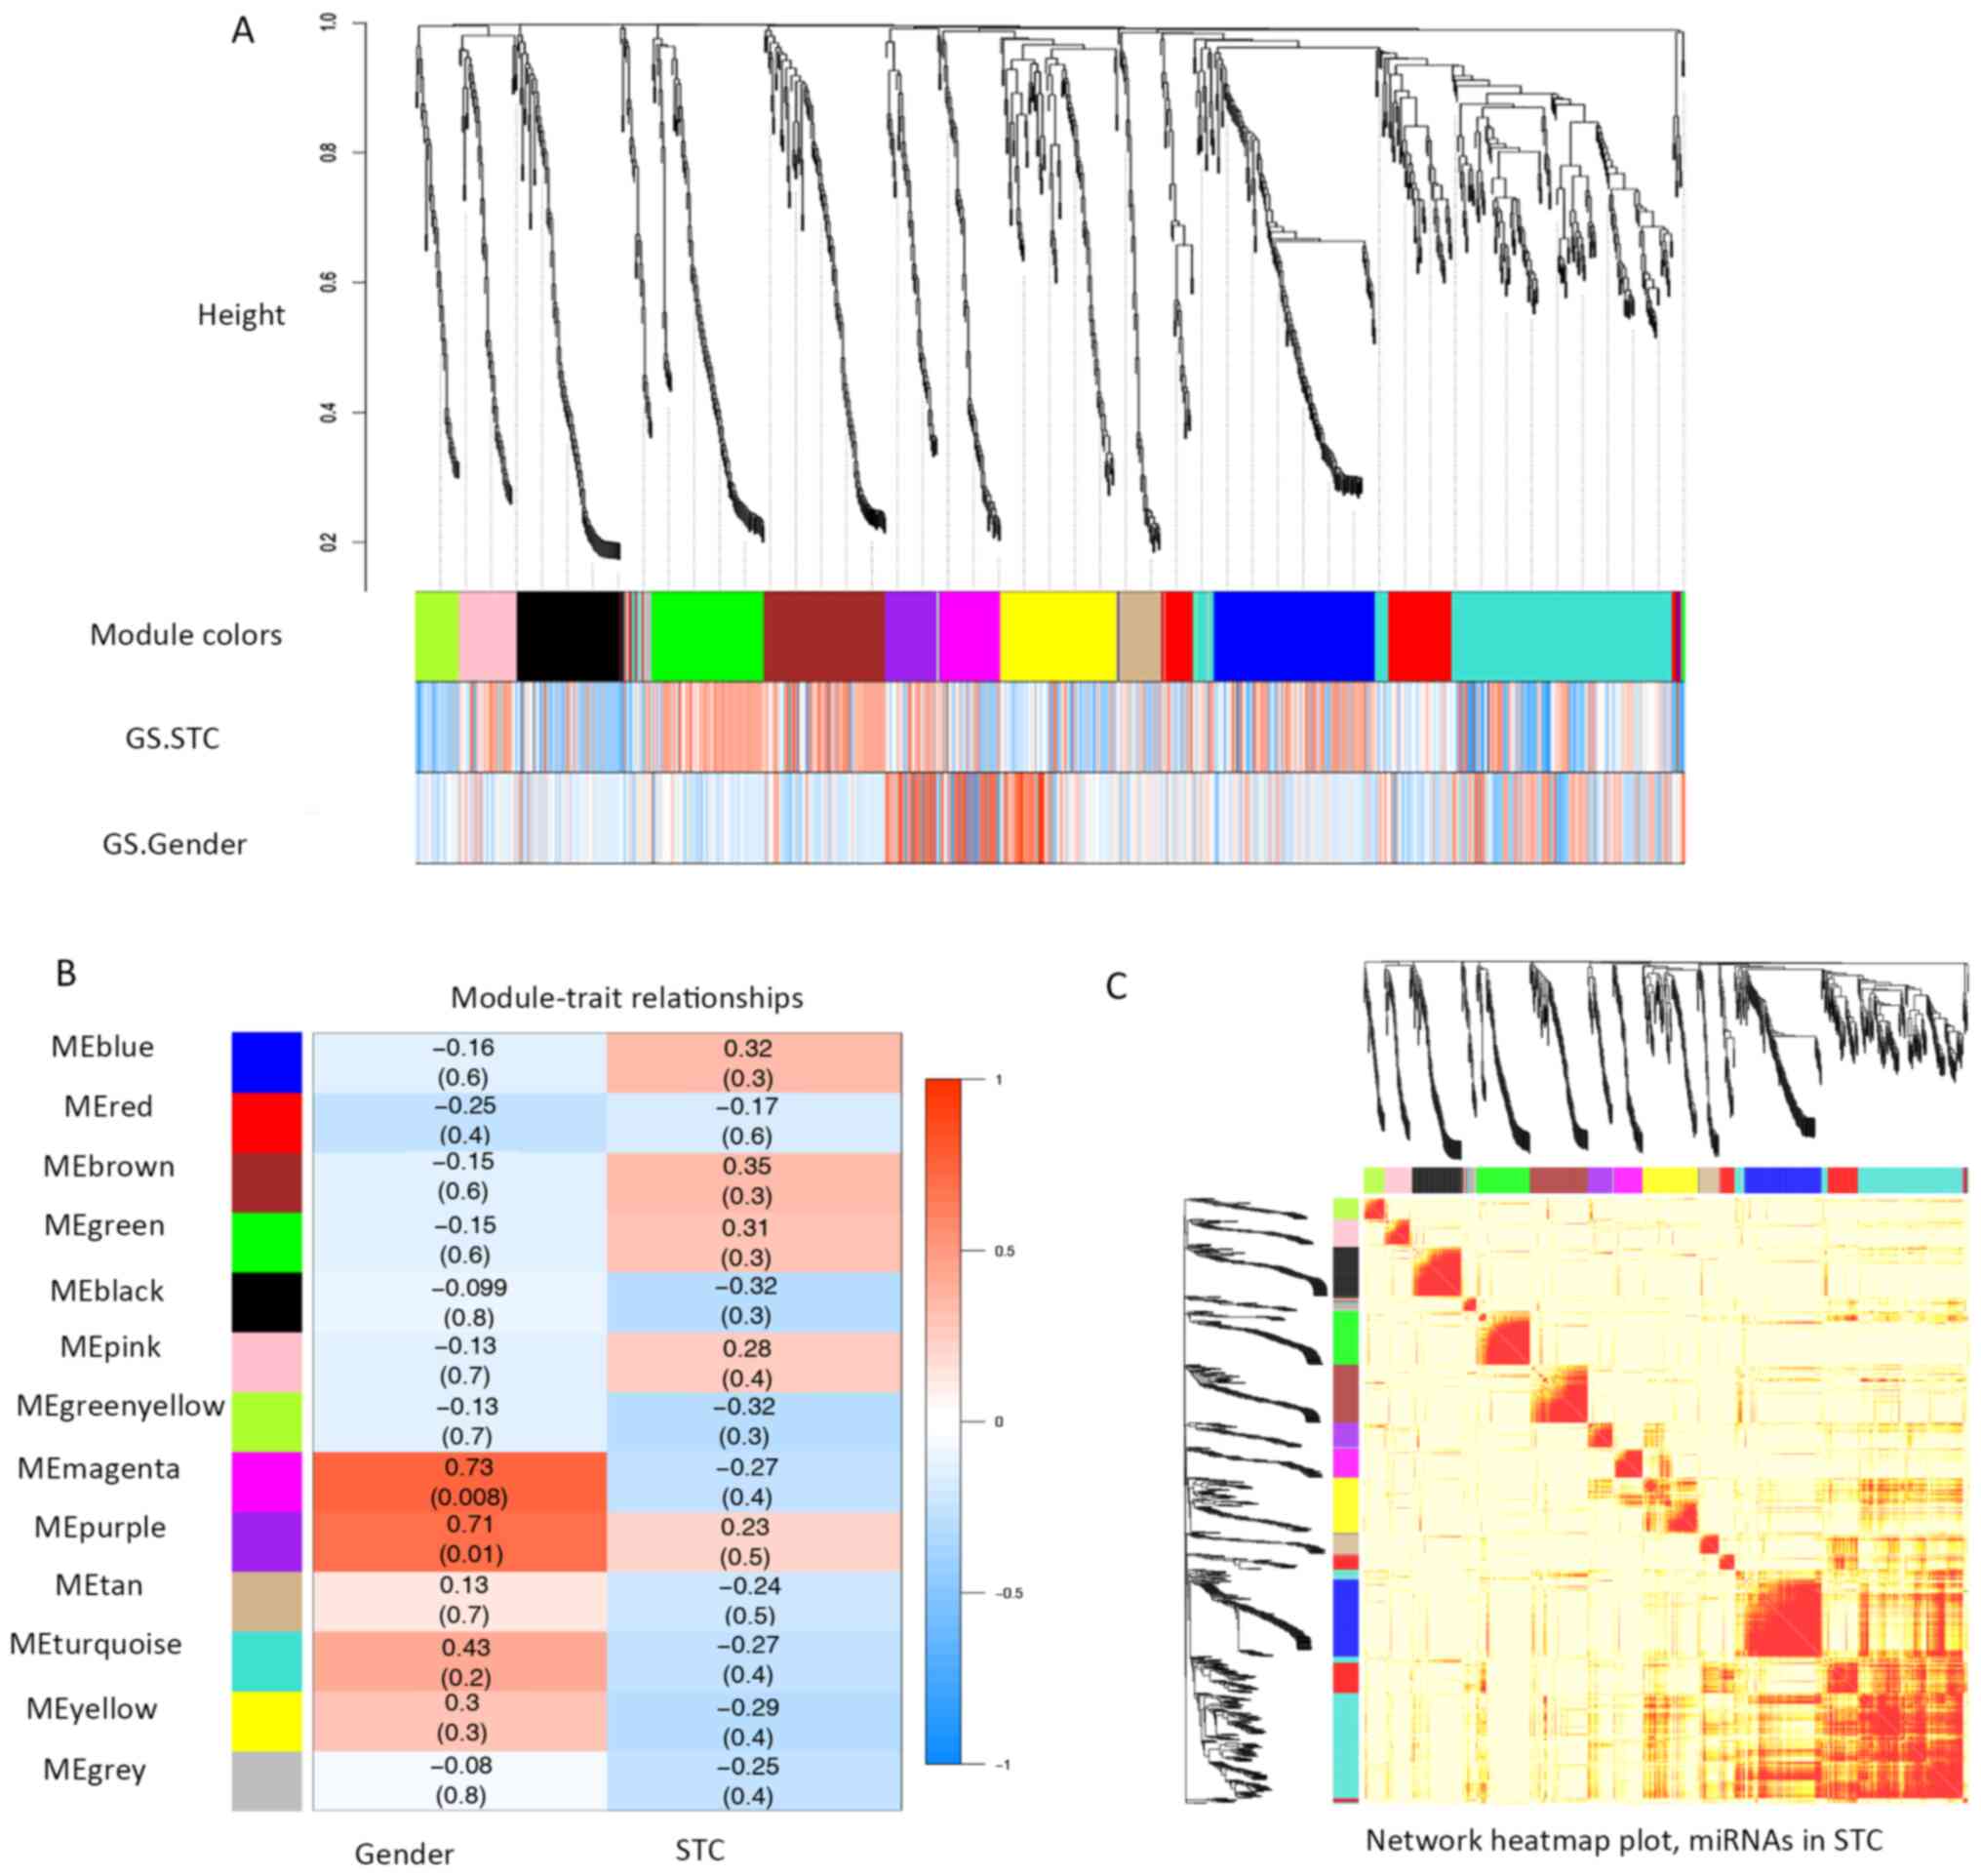
of 12 clustered miRNAs, represented by colored modules were
determined. The correlations between each module and clinical
traits (gender and STC status) were calculated (Fig. 2A and B). Within the 12 modules, a
TOM plot visualized the connectivity of the modules with
color-coded depiction (all the colors were randomly assigned to
each determined module; Fig. 2C).
Although no module showed significant correlations with STC in
clinical traits (Fig. 2B), the
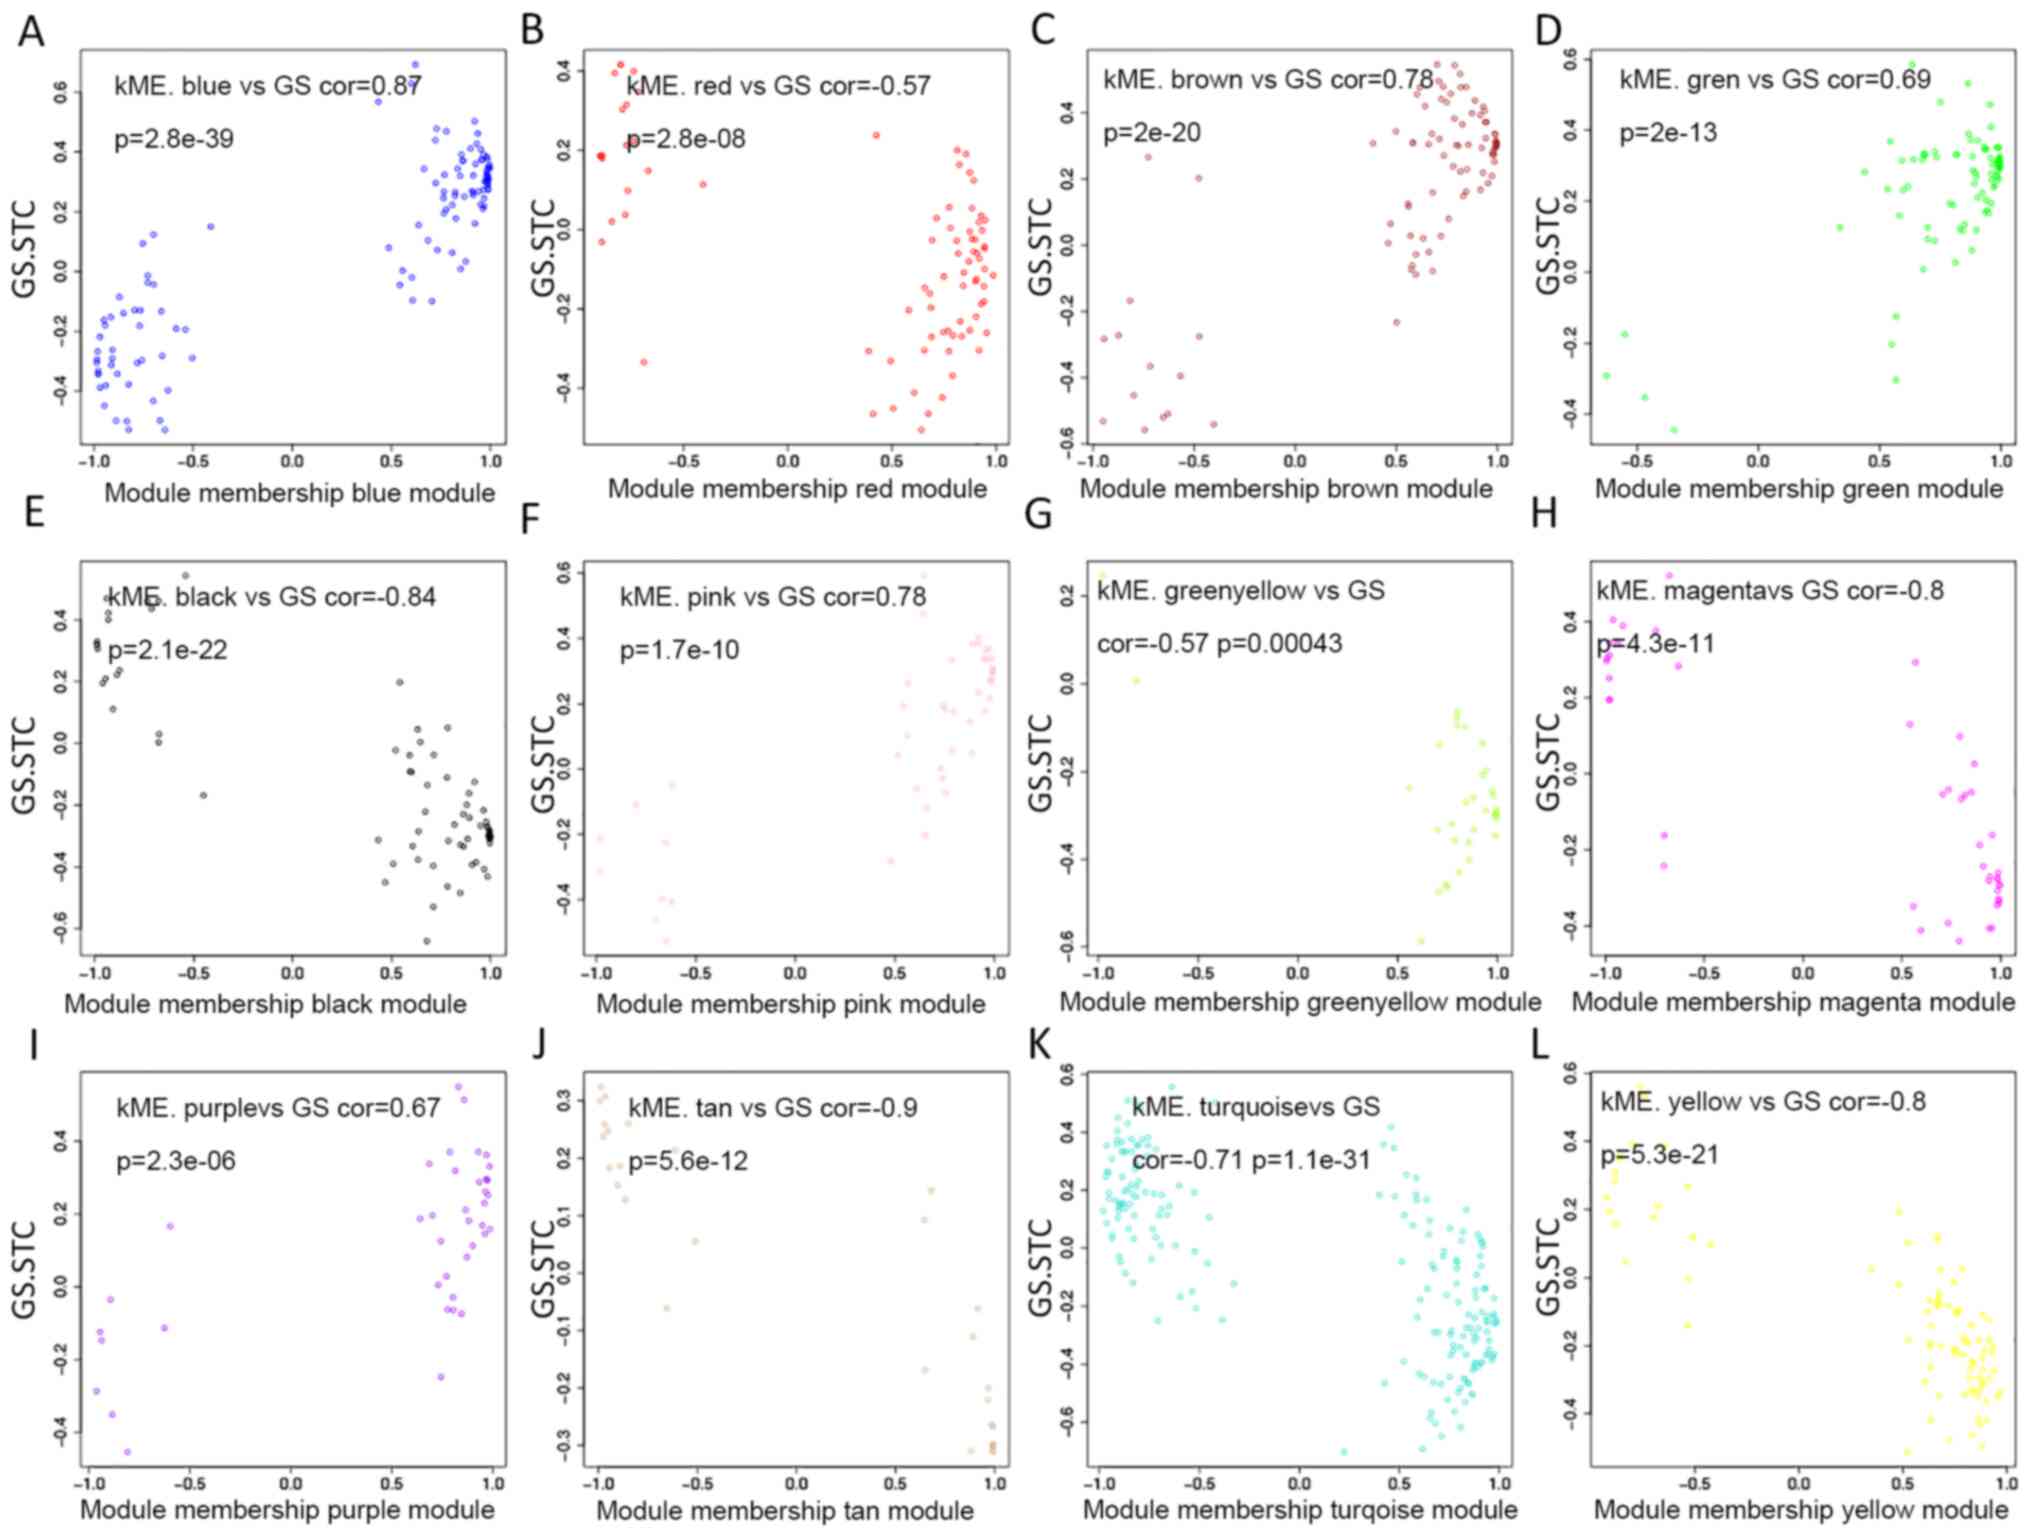
present study individually explored the GS and the module
membership in each module (Fig.
3A-L). In fact, the module membership of the blue module showed
the most significant correlation with GS (cor=0.87, p=2.8e-39),
whereas the turquoise module was the second most significant
(cor=−0.71, p=1.1e-31). Moreover, seven key miRNAs were determined
with five miRNAs from the turquoise module (hsa-miR-20b,
hsa-miR-128, hsa-miR-129-3p, hsa-miR-30b and hsa-miR-340), one
miRNA from the blue module (hsa-miR-619) and one from the black
module (hsa-miR-486-3p) (Tables I
and SIII).
 | Table I.Key miRNAs identified in association
with STC based on the GS and MM. |
Table I.
Key miRNAs identified in association
with STC based on the GS and MM.
| ID | Module | Cor.STC | By GEO2R
(P-value) | By Liu et al
(17) (P-value) |
|---|
| hsa-miR-619 | Blue | 0.691847 | – | – |
| hsa-miR-20b | Turquoise | −0.60402 | 0.041 | 0.041 |
| hsa-miR-128 | Turquoise | −0.61819 | 0.0479 | 0.035 |
| hsa-miR-486-3p | Black | −0.64059 | – | – |
| hsa-miR-129-3p | Turquoise | −0.64954 | 0.0186 | 0.023 |
| hsa-miR-30b | Tturquoise | −0.69318 | 0.0103 | 0.015 |
| hsa-miR-340 | Turquoise | −0.70344 | 0.0107 | – |
Functional enrichment of miRNA target
genes
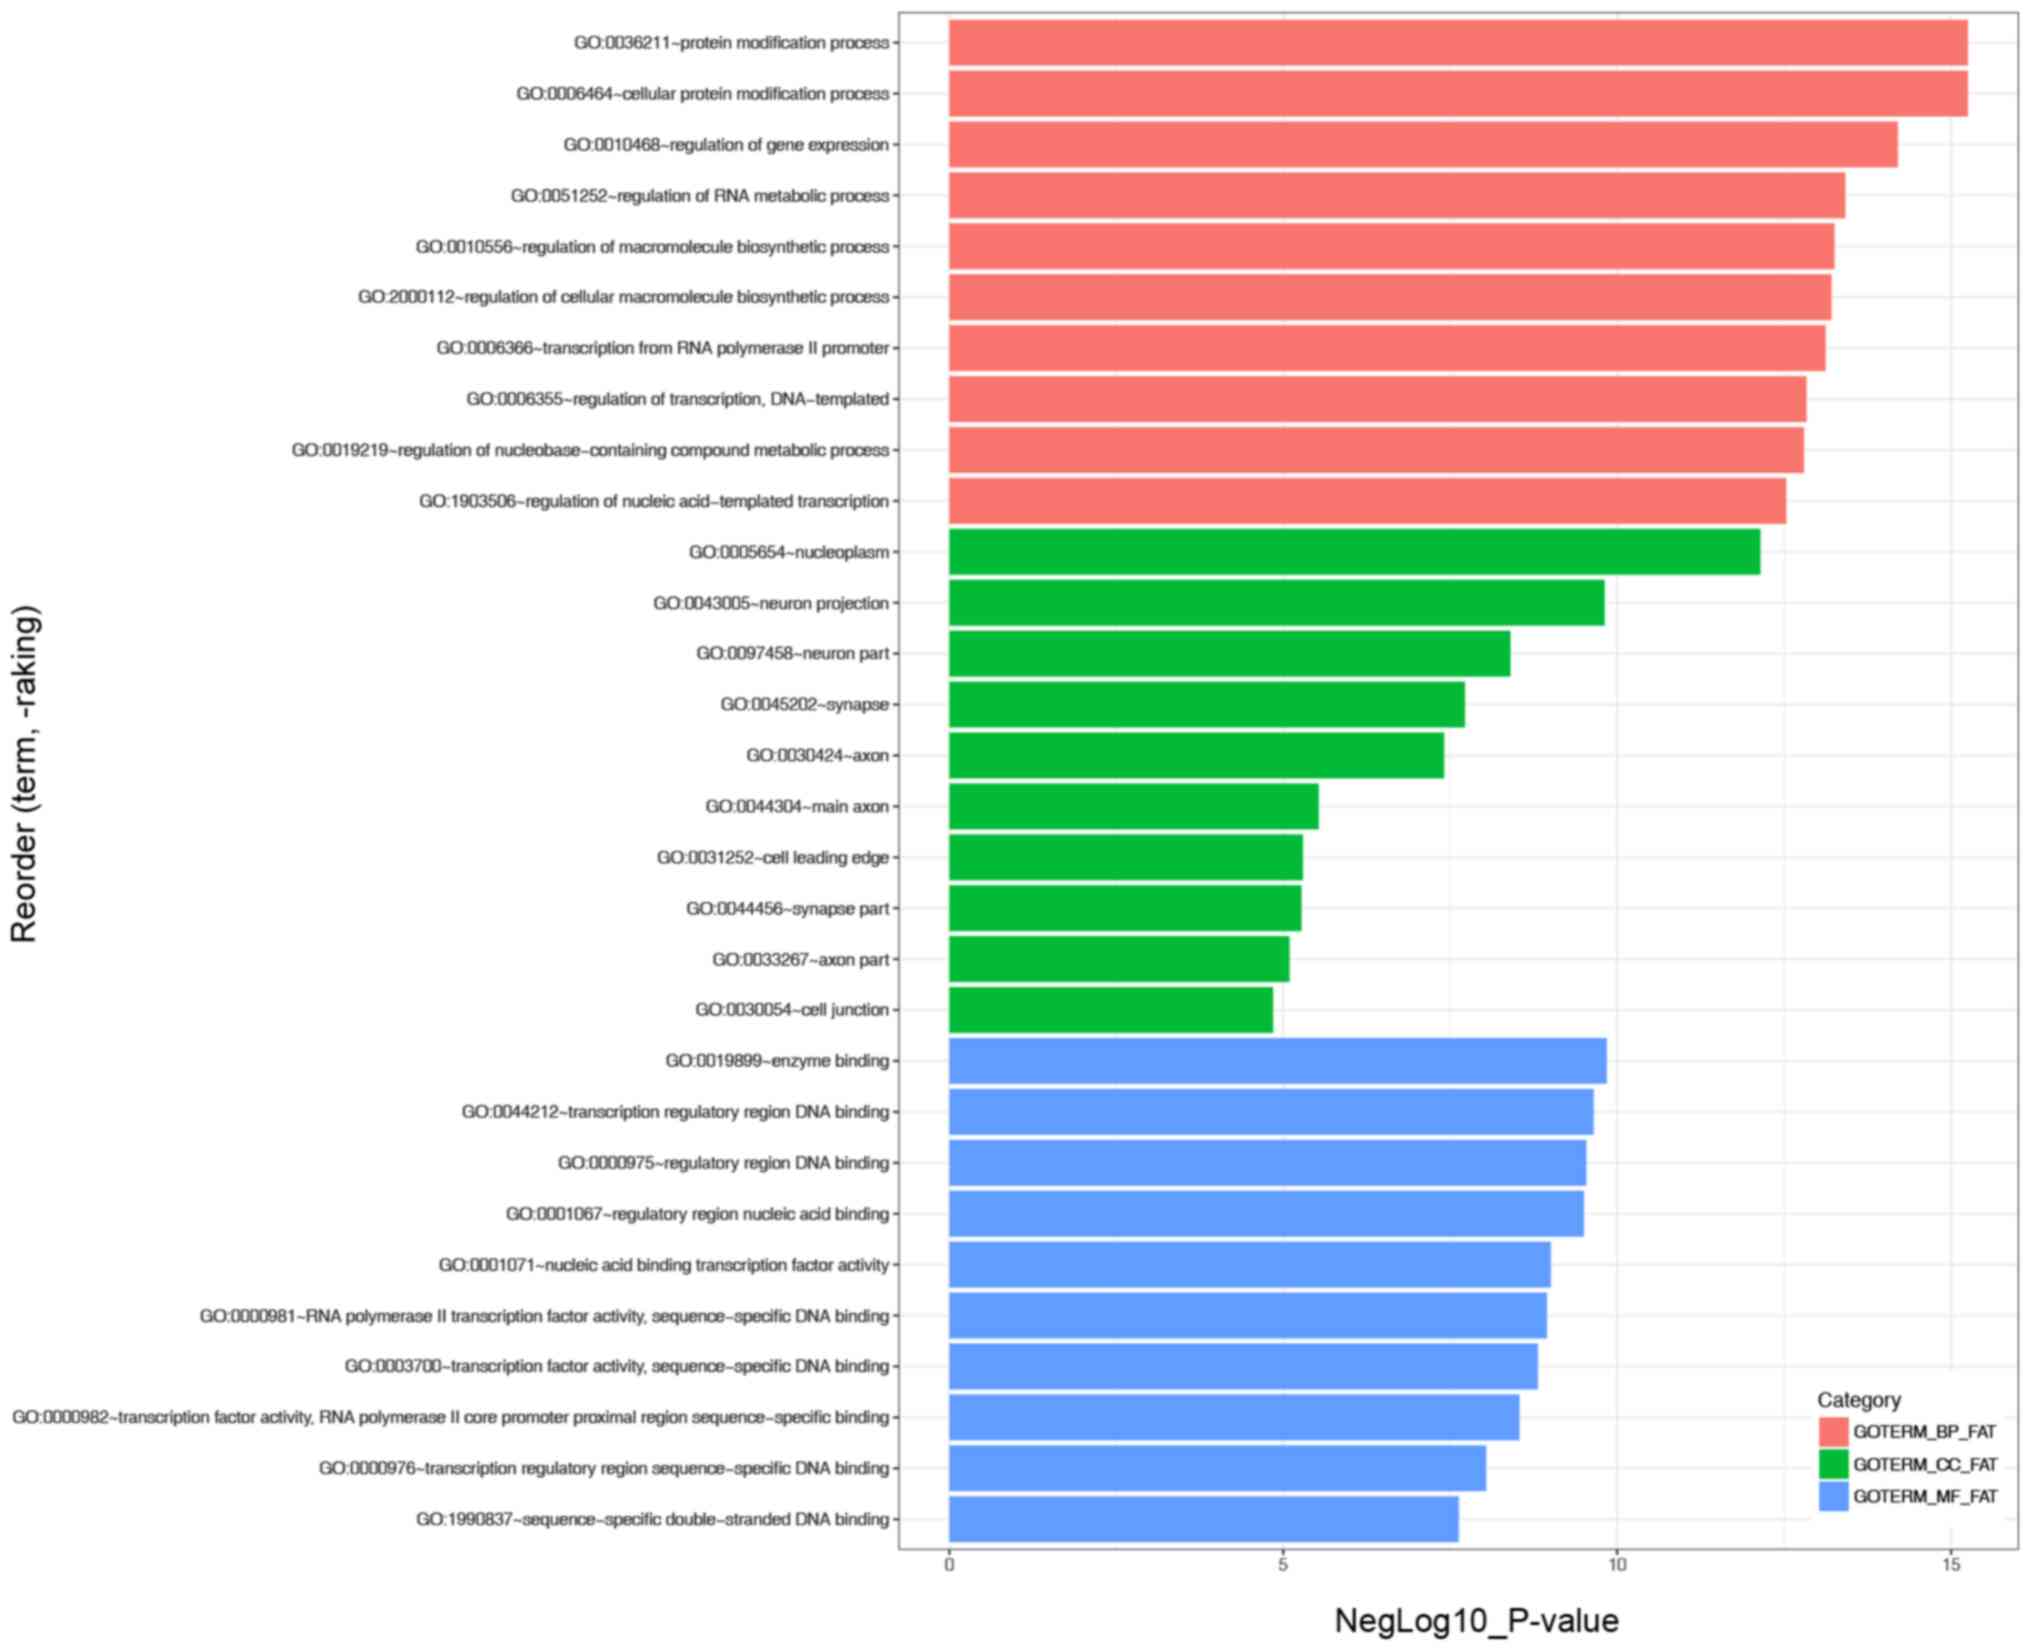
A total of 2,077 genes were predicted as targets of
the key miRNAs. GO enrichment analysis indicated that the ‘protein
modification process’ and ‘cellular protein modification process’
were the most significantly enriched BP, ‘nucleoplasm’ was the most
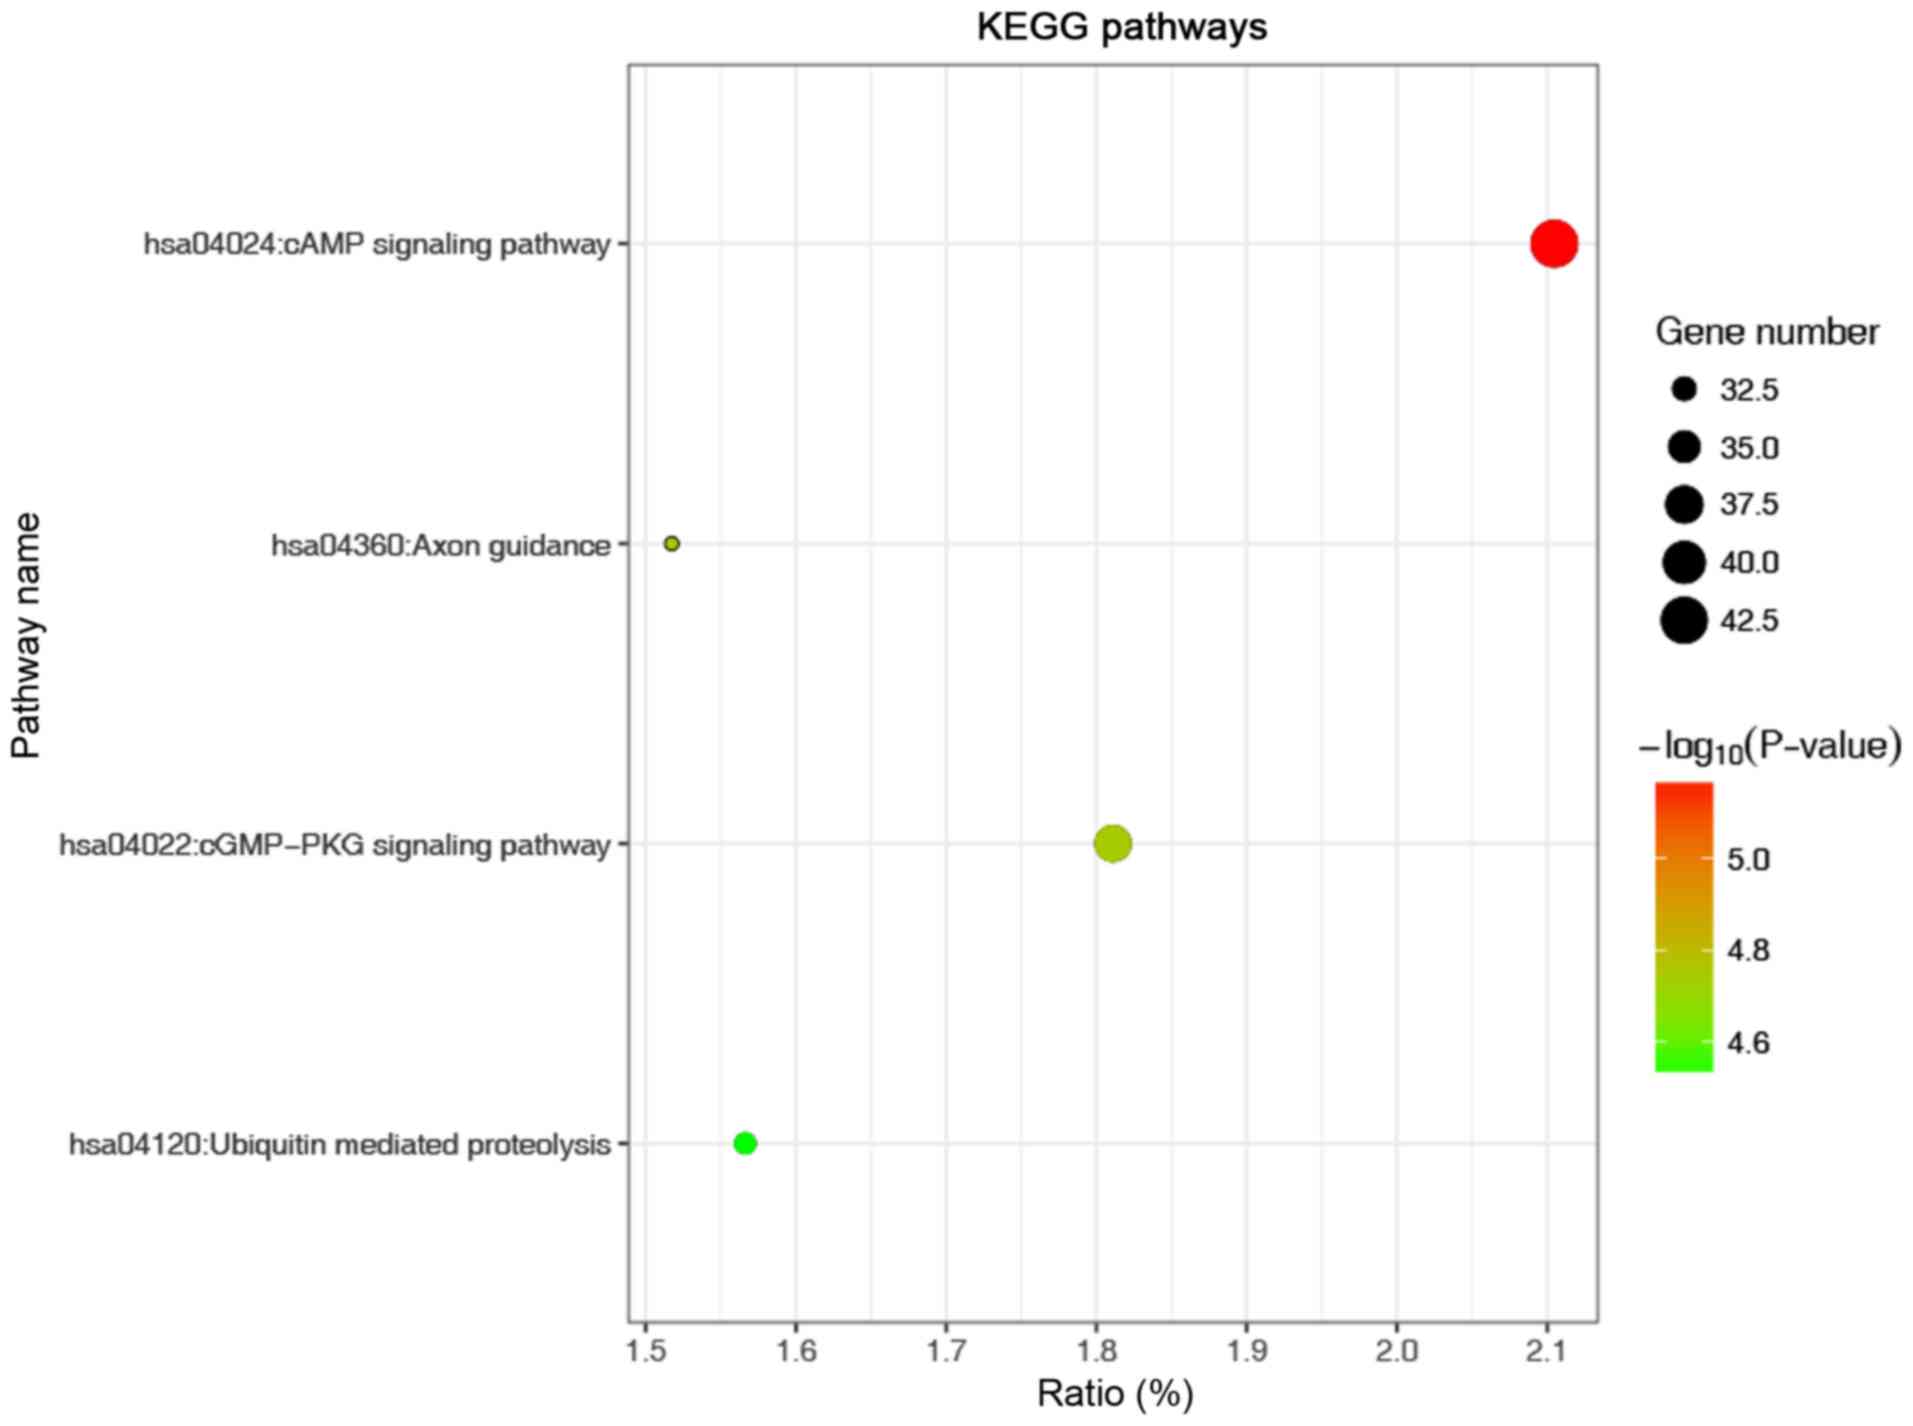
enriched CC and ‘enzyme binding’ was the most enriched MF (Fig. 4). KEGG analysis revealed that the
most significantly enriched term was the ‘cAMP signalling pathway’
(Fig. 5). In addition, pathway
enrichment analysis from the BioCarta database was performed with
no significantly enriched pathways (FDR>0.05) identified
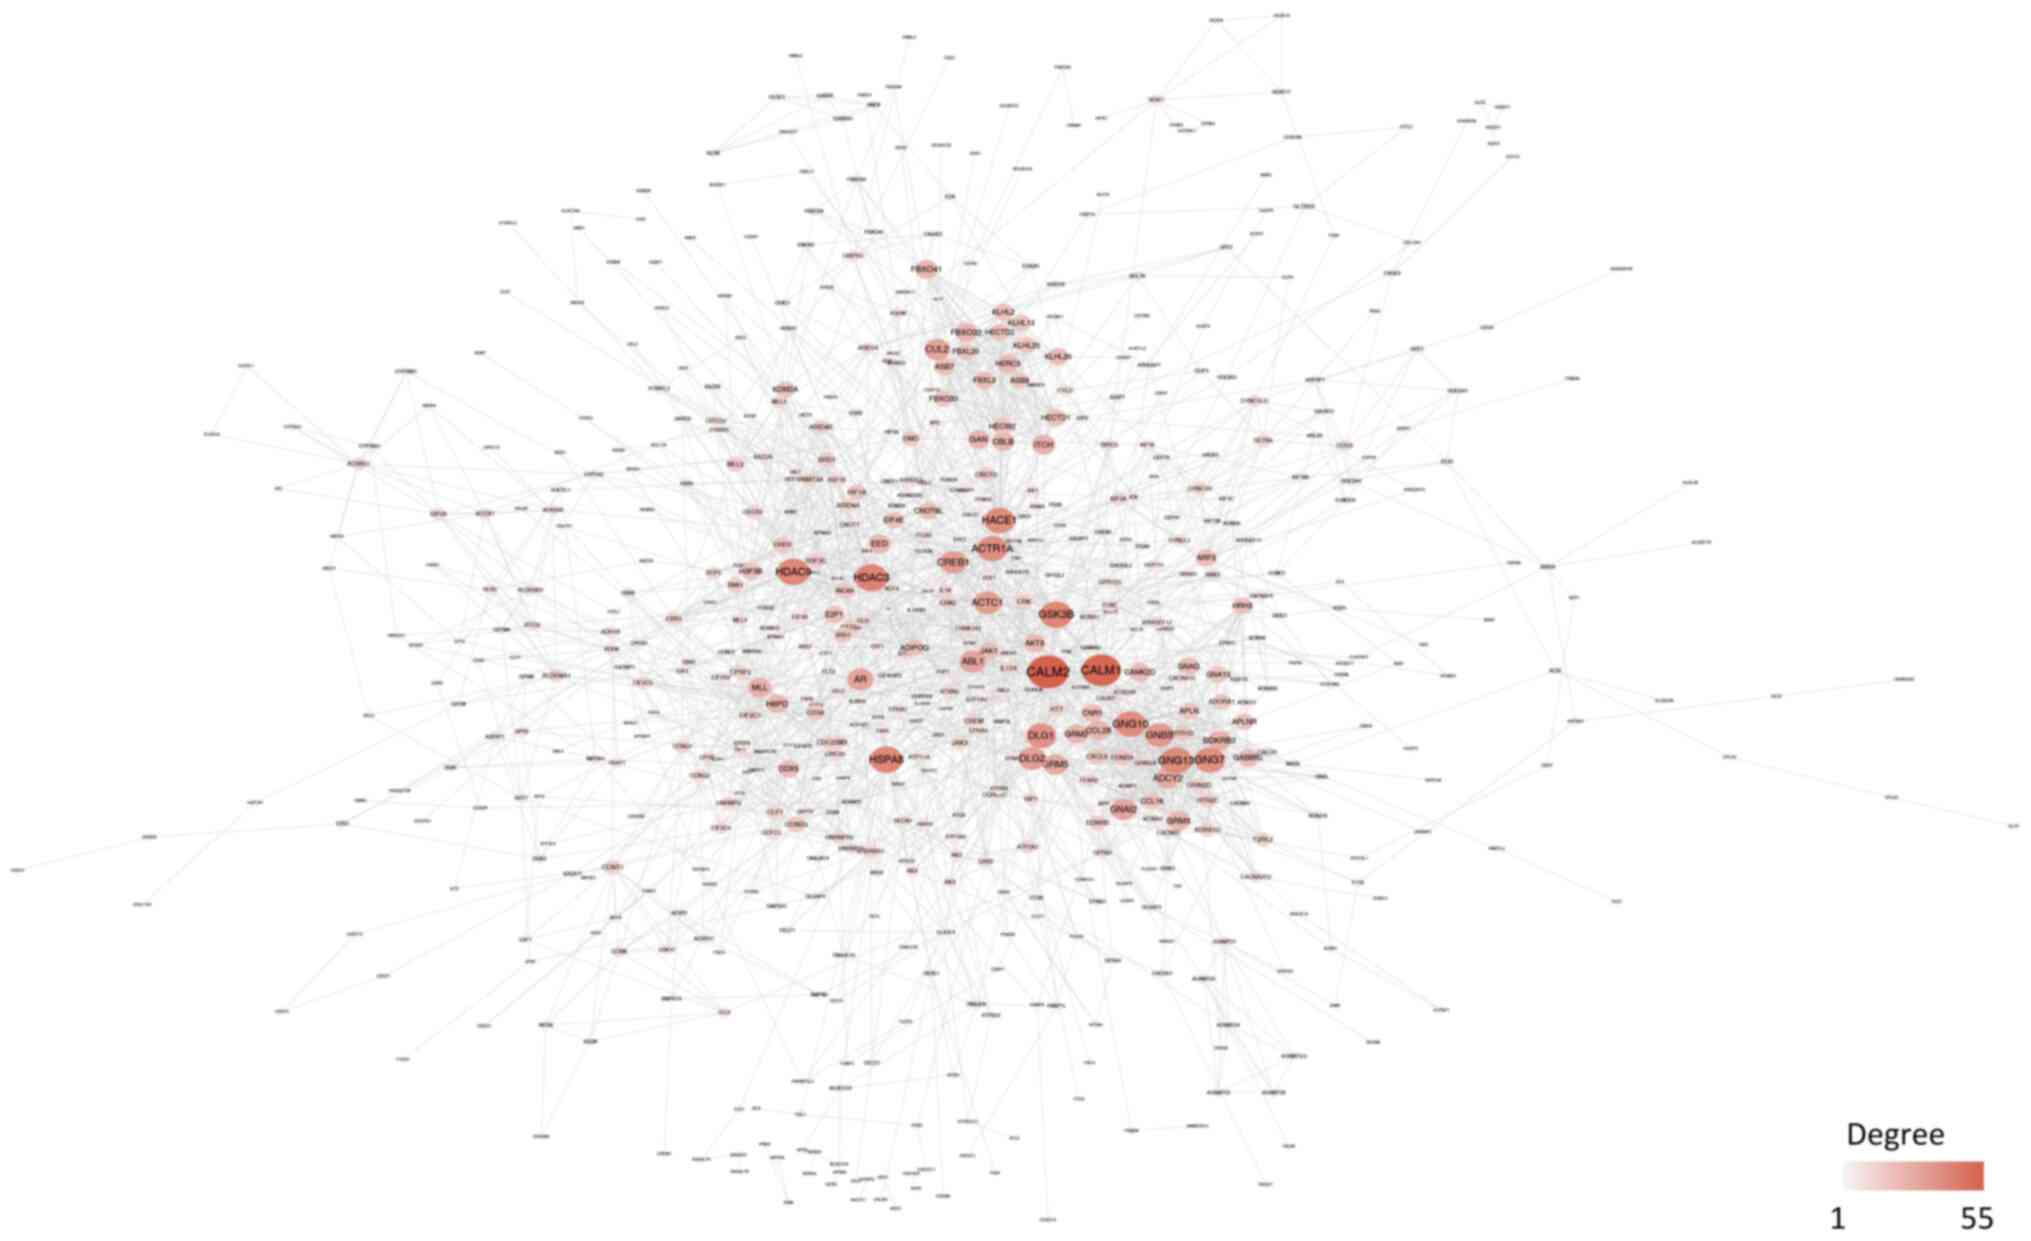
(Table SIV). The PPI networks
were constructed with 641 nodes and 2,414 edges (Fig. 6). The hub genes included calmodulin
(CALM)2, CALM1, histone deacetylase (HDAC)3, glycogen synthase
kinase 3 β, HDAC9, heat-shock protein family A member 8, G-protein
subunit γ (GNG)13, HECT domain and ankyrin repeat containing E3
ubiquitin protein ligase 1, GNG10 and GNG7 (Tables II and SV). The top-scoring modules identified
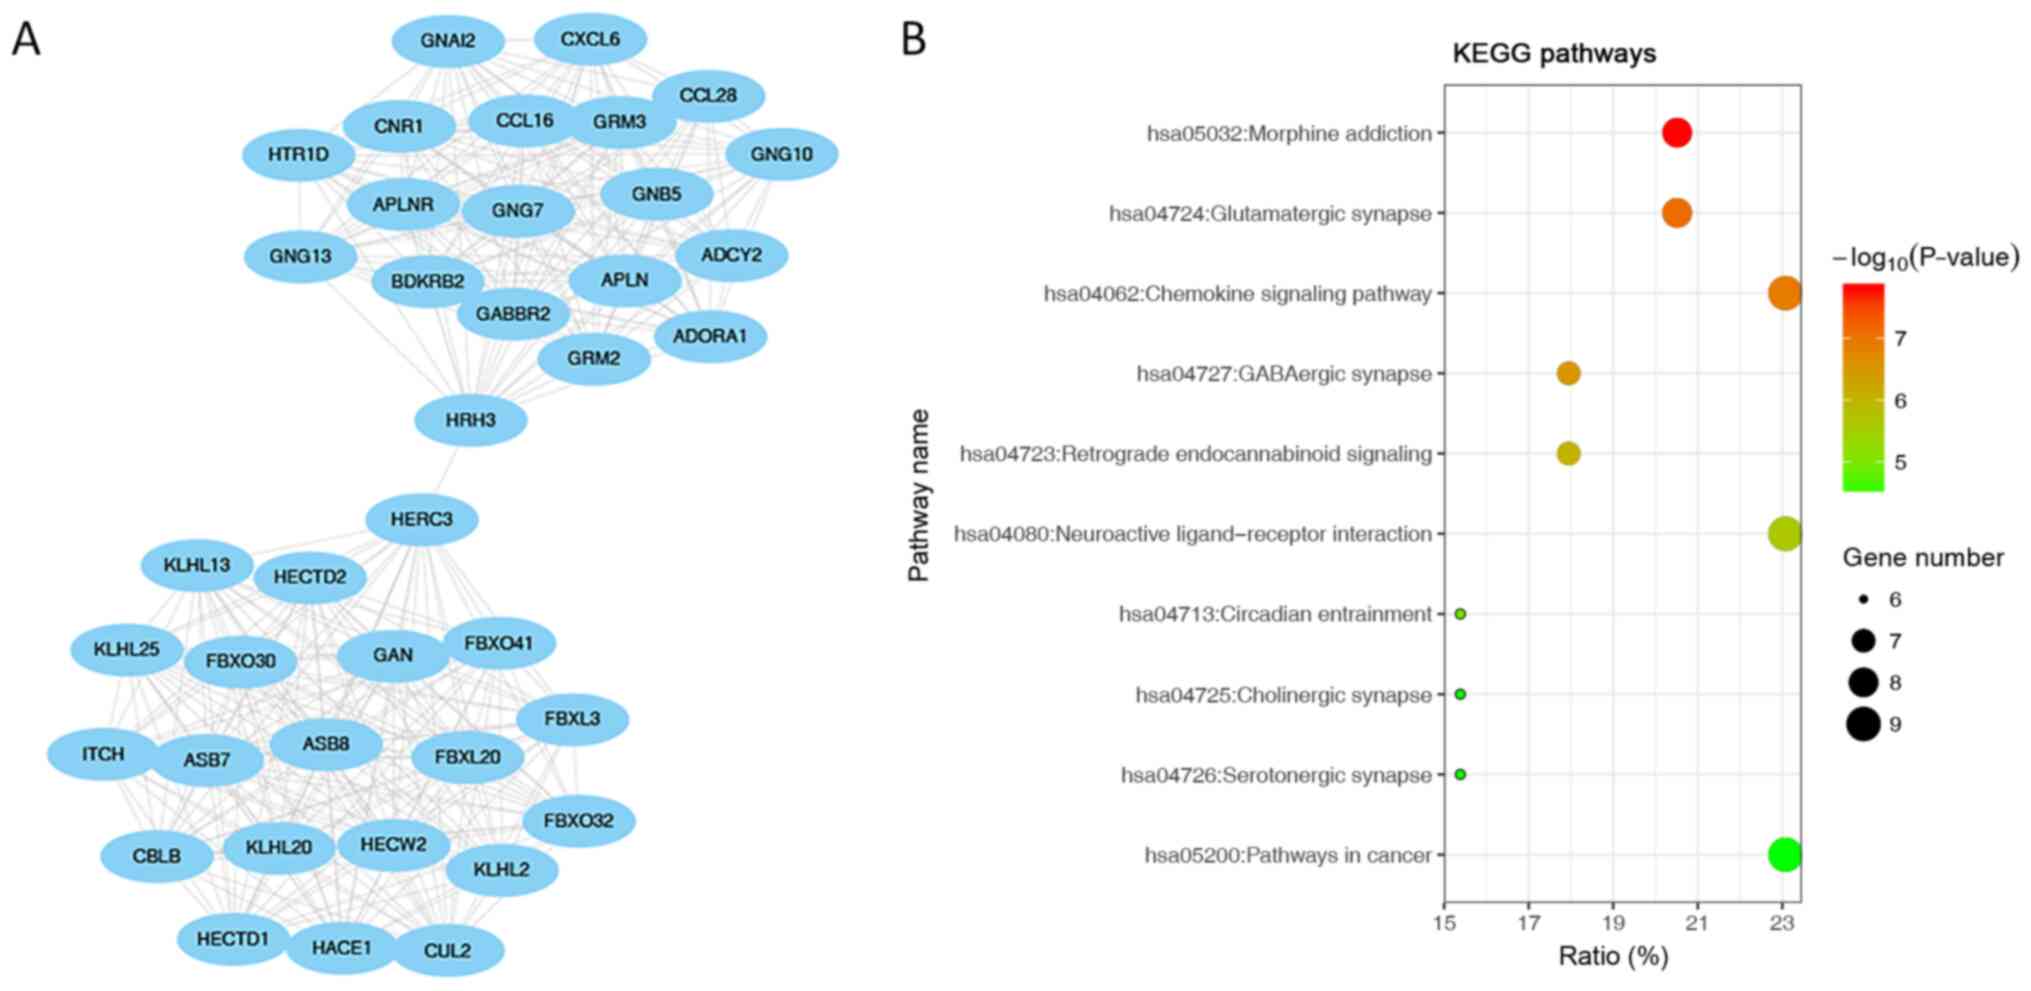
in the PPI are displayed with the most significantly enriched KEGG
pathways. Top-scoring modules identified in the Protein-Protein
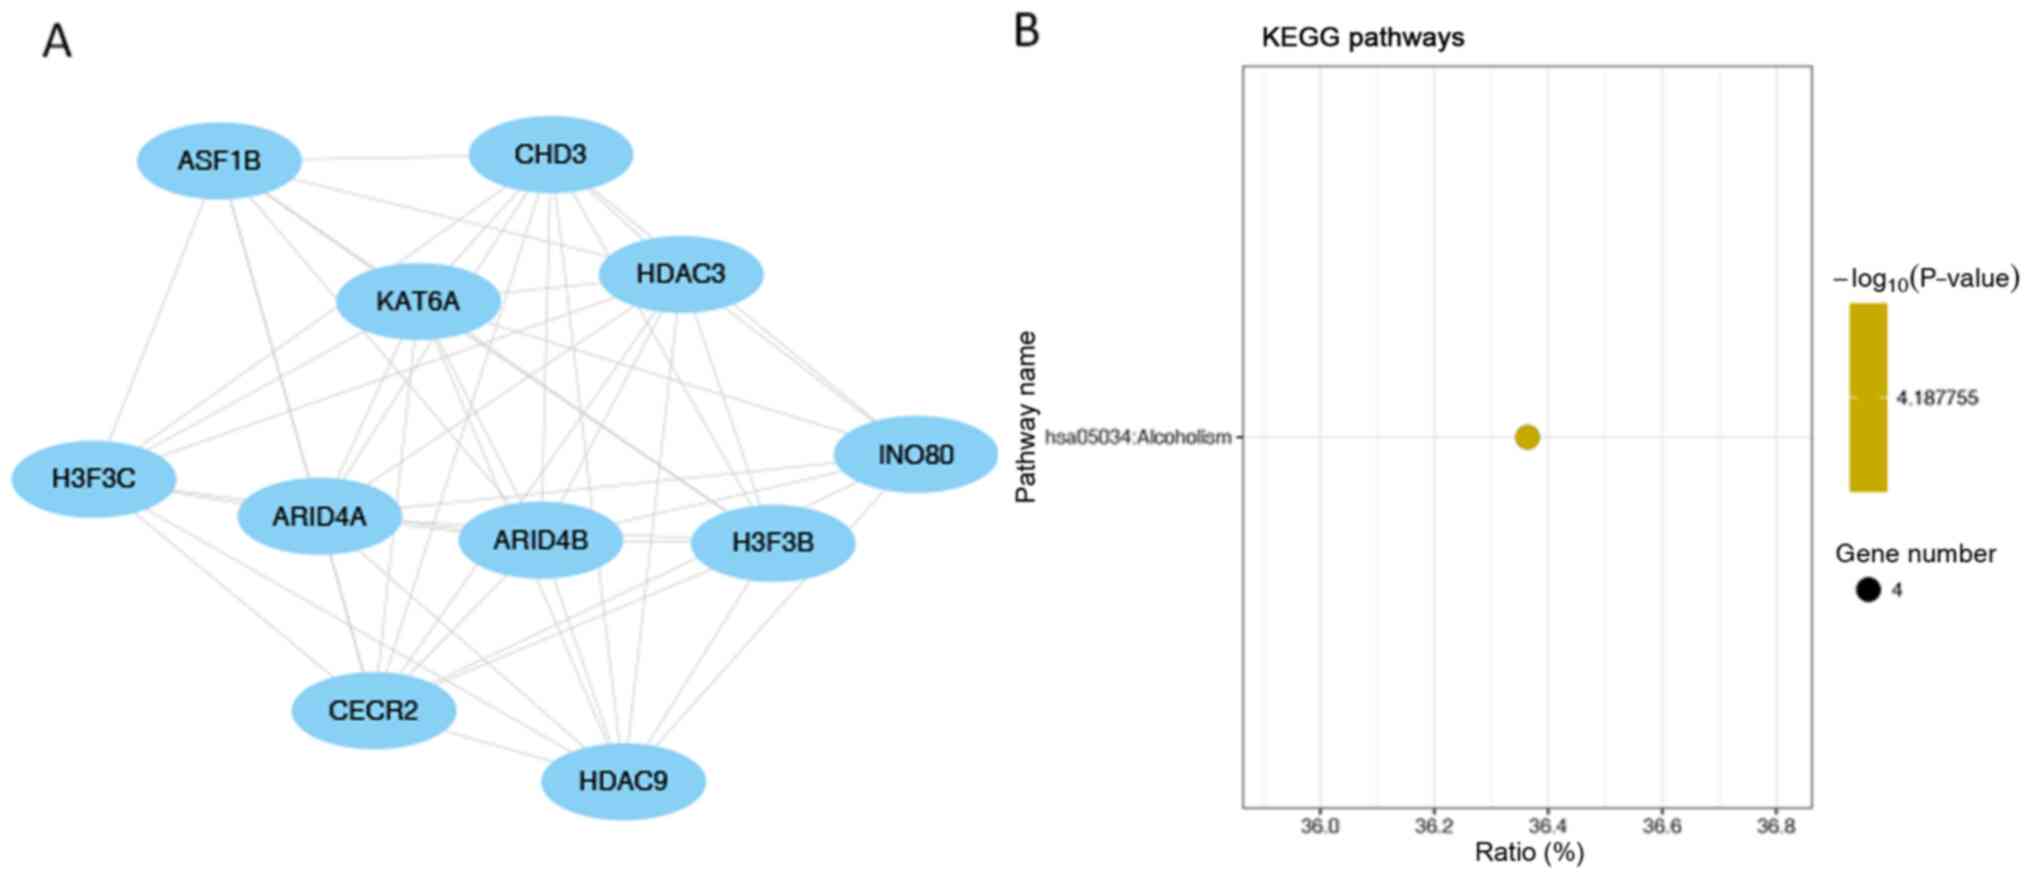
Interaction network using the MCODE algorithm (Figs. 7A, 8A and 9A). The first module was showed in PPI
network (Fig. 7A). ‘Morphine
addiction’, ‘glutamatergic synapse’ and the ‘chemokine signalling
pathway’ were the most significantly enriched pathways in module 1
(the module with highest score; Fig.
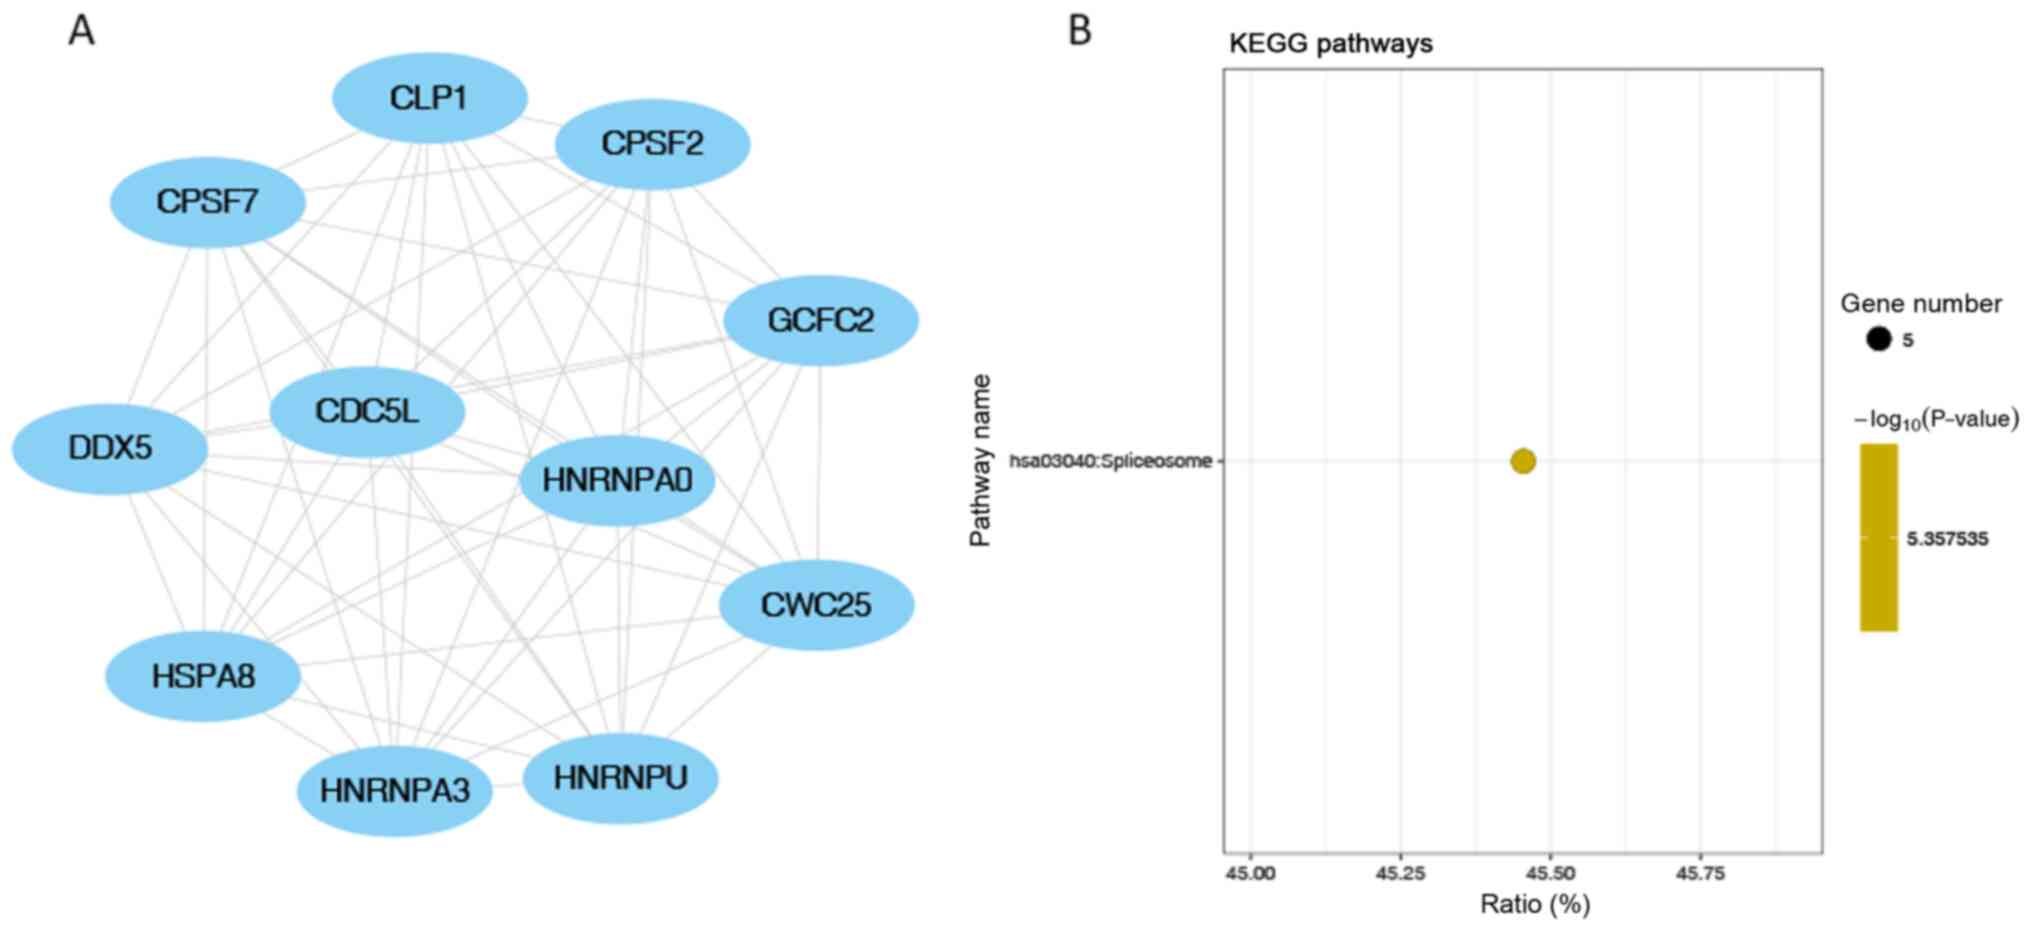
7B). ‘Spliceosome’ was the only significantly enriched KEGG
pathway in module 2 (the module with the second highest score;
Fig. 8B). ‘Alcoholism’ was the
only significantly enriched pathway in module 3 (the module with
the third highest score; Fig. 9B).
In addition, topological features were also characterized (Tables SVI and SVII). Specifically, the top 20 genes
with highest degree were listed, along with average shortest path
length, betweenness centrality, closeness centrality, clustering
coefficient, neighborhood connectivity, radiality and topological
coefficient parameters. The networks identified by MCODE were also
characterized with simpler parameters, including MCODE scores,
nodes, edges and genes IDs.
| Table II.Hub genes identified in the
Protein-Protein Interaction networks. |
Table II.
Hub genes identified in the
Protein-Protein Interaction networks.
| Gene symbol | Degree | Gene name |
|---|
| CALM2 | 55 | calmodulin 2 |
| CALM1 | 52 | calmodulin 1 |
| HDAC3 | 42 | histone deacetylase
3 |
| GSK3B | 41 | glycogen synthase
kinase 3 β |
| HDAC9 | 41 | histone deacetylase
9 |
| HSPA8 | 41 | heat shock protein
family A member 8 |
| GNG13 | 40 | G-protein subunit γ
13 |
| HACE1 | 39 | HECT domain and
ankyrin repeat containing E3 ubiquitin protein ligase 1 |
| GNG10 | 39 | G-protein subunit γ
10 |
| GNG7 | 38 | G-protein subunit γ
7 |
Discussion
To the best of the authors knowledge, this is the
first WGCNA-based bioinformatics study for an STC-associated miRNA
expression profile (GSE57969) in the GEO platform. This study
provided unique insights and meaningful evidence of potential
miRNAs, genes and pathways involved in the pathogenesis of STC. The
GEO platform was utilized for these studies, which has the only
gene expression profile and miRNA expression profile on STC.
Previous bioinformatics studies related to STC currently remain
limited. Specifically, Liu et al (17) discovered a significant negative
correlation between miRNA-128, and colonic macrophage numbers
during the pathogenesis of STC. Other studies that have focused on
STC were primarily associated with clinical practice, with sparse
investigation into genomic expression profiles (2–5). In
summary, this is the first study on the bioinformatic analysis of
miRNA expression profile in STC. Of note, the original article on
GSE57969 showed that miR-128 is significantly decreased in STC
samples compared with the control samples in GSE57969.
The present study reanalyzed the expression profile
with WGCNA and other bioinformatics strategies, and rediscovered
additional key miRNAs and pathways underlying the pathogenesis of
STC. Consistently, miR-128 was found to be a key miRNA in the
present results, corroborating what was found by Liu et al
(17). Furthermore, the present
study identified a correlation between hsa-miR-619 (positive
correlation), 20b (negative correlation), 486-3p (negative
correlation), 129-3p (negative correlation), 30b (negative
correlation), 340 (negative correlation) and STC by WGCNA (Table I). Interestingly, only hsa-miR-619
featured a positive correlation with the presence of STC
(cor=0.692), whereas the remaining six key miRNAs showed a negative
correlation with the presence of STC.
Previous studies have demonstrated that both the
ganglionic density and size, and the number of ICCs were reduced in
patients with STC and megacolon (11–13,35).
More molecular biomarkers, instead of mere histopathological
features, were suggested to identify STC. Currently, surgical
interventions for STC remain largely debatable. A previous study
has reported that diverse postoperative complications and
functional anomalies may limit postoperative satisfaction in
patients with STC (36).
Nonetheless, biofeedback, a recommended clinical management for
chronic constipation, is less effective in patients with STC than
in patients with pelvic floor dyssynergia (37). These findings reflect the clinical
complexity and heterogeneity of STC. Notably, the involvement of
miRNAs could provide insight into the pathogenesis and therapeutic
options for STC.
Generally, in WGCNA, correlated gene expression
profiles indicate a potential collaboration or pathway
co-involvement, which contributes to the correlation of certain
clinical phenotypes. All genes were weighted with the connection
strengths and marked by a power function (18,19).
All the miRNAs were clustered into 12 subsets, represented by
colored modules. Next, each module was linked to clinical
information for further target gene annotations.
CALM1 and CALM2 were identified as the hub genes in
the present study. The CALM family is a commonly studied group of
Ca2+-sensing proteins, particularly in relation to
secretory diarrhoea (38–40). CALM proteins display numerous
Ca2+-dependent biological functions by directing a
variety of target-specific activations (38). It is of note that the cAMP
signalling identified in the KEGG pathway is also closely
associated with the CALM family in terms of pro-arrhythmic
Ca2+ waves (41).
Notably, one of the central factors in intestinal motility, ICC,
has been found to be highly correlated with Ca2+ in
terms of the initiation of pacemaker activity (13,42,43).
In fact, ICC exhibits a specialized, secondary voltage-independent
slow wave current yet to be elucidated. Some studies have reported
that this current is activated by a Cl−selective
conductance (44). The
redistribution of extracellular Ca2+ or replacement of
Ca2+ could influence the rhythmic waves (44). In fact, the present results
indicated the possible roles of the CALM family and the involvement
of the cAMP signalling pathway in the potential underlying
mechanism of STC.
In addition, different results between KEGG
annotation and BioCarta were possibly due to the different
referential background and embedded algorithm. However, as this is
based on in silico analysis, further experimental validation
is needed to confirm these conclusions. Another limitation of the
present study is the relatively small sample size, which may be
confounded by heterogeneous factors. Given the limited gene
expression resources of the miRNAs of STC in GEO, a global picture
of the miRNA regulatory mechanisms awaits further consolidation.
Undeniably, the minimal recommended sample size of WGCNA is 15
(19), whereas only 12 samples
were analyzed in this study. However, this unique miRNA microarray
enabled the first WGCNA-based bioinformatics analysis of STC.
Moreover, clinically resected sample sizes of STC are generally
limited in China, partially because STC has not been fully
recognized by patients who prefer treatment without surgery. Thus,
STC resected specimens are relatively hard to get and the
underlying pathogenesis remains largely unclear. In the present
study, no reverse transcription-quantitative PCR was performed to
validate the results. It may take at least 3–5 years for a
comparable STC sample size to be attained.
Supplementary Material
Supporting Data
Acknowledgements
The authors would like to thank Dr Ernest Johann
Helwig (Tongji Medical College of Huazhong University of Science
and Technology) for his insightful discussions and revision of the
manuscript.
Funding
This study was supported by the National Natural
Science Foundation of China (grant nos. 81402423, 81572818 and
81871984), and the Shanghai Municipal Commission of Health and
Family Planning (grant no. 2017YQ062).
Availability of data and materials
All data generated or analyzed during this study are
included in this published article.
Authors' contributions
CY, LuZ, BF, LuyangZ and PX carried out data
analysis. CY, LuZ, JM, MZ, FD and JS drafted the manuscript. CY,
JS, JM and MZ participated in study design and data collection. CY,
BF and FD contributed substantially to the refinement of the
conception and design of this study and were major contributor to
the revision of the manuscript. All authors read and approved the
final manuscript.
Ethics approval and consent to
participate
Not applicable.
Patient consent for publication
Not applicable.
Competing interests
The authors declare that they have no competing
interests.
Glossary
Abbreviations
Abbreviations:
|
STC
|
slow-transit constipation
|
|
WGCNA
|
weighted gene correlation network
analysis
|
|
GO
|
Gene Ontology
|
|
KEGG
|
Kyoto Encyclopedia of Genes and
Genomes
|
|
PPI
|
Protein-Protein Interaction
|
|
ICC
|
interstitial cells of Cajal
|
|
GEO
|
Gene Expression Omnibus
|
|
TOM
|
Topological overlap measure
|
|
GS
|
gene significance
|
|
BP
|
Biological Process
|
|
CC
|
Cellular Components
|
|
MF
|
Molecular Function
|
|
CALM2
|
calmodulin 2
|
|
CALM1
|
calmodulin 1
|
References
|
1
|
Pare P, Ferrazzi S, Thompson WG, Irvine EJ
and Rance L: An epidemiological survey of constipation in Canada:
Definitions, rates, demographics, and predictors of health care
seeking. Am J Gastroenterol. 96:3130–3137. 2001. View Article : Google Scholar : PubMed/NCBI
|
|
2
|
Lembo A and Camilleri M: Chronic
constipation. N Engl J Med. 349:1360–1368. 2003. View Article : Google Scholar : PubMed/NCBI
|
|
3
|
Sonnenberg A and Koch TR: Physician visits
in the United States for constipation: 1958 to 1986. Dig Dis Sci.
34:606–611. 1989. View Article : Google Scholar : PubMed/NCBI
|
|
4
|
Heaton KW, Radvan J, Cripps H, Mountford
RA, Braddon FE and Hughes AO: Defecation frequency and timing, and
stool form in the general population: A prospective study. Gut.
33:818–824. 1992. View Article : Google Scholar : PubMed/NCBI
|
|
5
|
Preston DM and Lennard-Jones JE: Severe
chronic constipation of young women: ‘Idiopathic slow transit
constipation’. Gut. 27:41–48. 1986. View Article : Google Scholar : PubMed/NCBI
|
|
6
|
Rao SS and Go JT: Update on the management
of constipation in the elderly: New treatment options. Clin Interv
Aging. 5:163–171. 2010. View Article : Google Scholar : PubMed/NCBI
|
|
7
|
Portalatin M and Winstead N: Medical
management of constipation. Clin Colon Rectal Surg. 25:12–19. 2012.
View Article : Google Scholar : PubMed/NCBI
|
|
8
|
Karlbom U, Påhlman L, Nilsson S and Graf
W: Relationships between defecographic findings, rectal emptying,
and colonic transit time in constipated patients. Gut. 36:907–912.
1995. View Article : Google Scholar : PubMed/NCBI
|
|
9
|
Prather CM: Subtypes of constipation:
Sorting out the confusion. Rev Gastroenterol Disord. 4 (Suppl
2):S11–S16. 2004.PubMed/NCBI
|
|
10
|
Mertz H, Naliboff B and Mayer E:
Physiology of refractory chronic constipation. Am J Gastroenterol.
94:609–615. 1999. View Article : Google Scholar : PubMed/NCBI
|
|
11
|
Tzavella K, Riepl RL, Klauser AG,
Voderholzer WA, Schindlbeck NE and Müller-Lissner SA: Decreased
substance P levels in rectal biopsies from patients with slow
transit constipation. Eur J Gastroenterol Hepatol. 8:1207–1211.
1996. View Article : Google Scholar : PubMed/NCBI
|
|
12
|
Cortesini C, Cianchi F, Infantino A and
Lise M: Nitric oxide synthase and VIP distribution in enteric
nervous system in idiopathic chronic constipation. Dig Dis Sci.
40:2450–2455. 1995. View Article : Google Scholar : PubMed/NCBI
|
|
13
|
He CL, Burgart L, Wang L, Pemberton J,
Young-Fadok T, Szurszewski J and Farrugia G: Decreased interstitial
cell of Cajal volume in patients with slow-transit constipation.
Gastroenterology. 118:14–21. 2000. View Article : Google Scholar : PubMed/NCBI
|
|
14
|
Grover M, Farrugia G, Lurken MS, Bernard
CE, Faussone-Pellegrini MS, Smyrk TC, Parkman HP, Abell TL, Snape
WJ, Hasler WL, et al: Cellular changes in diabetic and idiopathic
gastroparesis. Gastroenterology. 140:1575–1585.e8. 2011. View Article : Google Scholar : PubMed/NCBI
|
|
15
|
Yanaihara N, Caplen N, Bowman E, Seike M,
Kumamoto K, Yi M, Stephens RM, Okamoto A, Yokota J, Tanaka T, et
al: Unique microRNA molecular profiles in lung cancer diagnosis and
prognosis. Cancer Cell. 9:189–198. 2006. View Article : Google Scholar : PubMed/NCBI
|
|
16
|
Ferracin M, Veronese A and Negrini M:
Micromarkers: miRNAs in cancer diagnosis and prognosis. Expert Rev
Mol Diagn. 10:297–308. 2010. View Article : Google Scholar : PubMed/NCBI
|
|
17
|
Liu W, Zhang Q, Li S, Li L, Ding Z, Qian
Q, Fan L and Jiang C: The relationship between colonic macrophages
and microRNA-128 in the pathogenesis of slow transit constipation.
Dig Dis Sci. 60:2304–2315. 2015. View Article : Google Scholar : PubMed/NCBI
|
|
18
|
Zhang B and Horvath S: A general framework
for weighted gene co-expression network analysis. Stat Appl Genet
Mol Biol. 4:Article172005. View Article : Google Scholar : PubMed/NCBI
|
|
19
|
Langfelder P and Horvath S: WGCNA: An R
package for weighted correlation network analysis. BMC
Bioinformatics. 9:5592008. View Article : Google Scholar : PubMed/NCBI
|
|
20
|
Edgar R, Domrachev M and Lash AE: Gene
expression omnibus: NCBI gene expression and hybridization array
data repository. Nucleic Acids Res. 30:207–210. 2002. View Article : Google Scholar : PubMed/NCBI
|
|
21
|
Davis S and Meltzer PS: GEOquery: A bridge
between the Gene Expression Omnibus (GEO) and BioConductor.
Bioinformatics. 23:1846–1847. 2007. View Article : Google Scholar : PubMed/NCBI
|
|
22
|
R Core Team. R: A language and environment
for statistical computing. R Foundation for Statistical Computing;
Vienna, Austria: 2017, simplewww.r-project.orgJune 24–2019
|
|
23
|
Ravasz E, Somera AL, Mongru DA, Oltvai ZN
and Barabási AL: Hierarchical organization of modularity in
metabolic networks. Science. 297:1551–1555. 2002. View Article : Google Scholar : PubMed/NCBI
|
|
24
|
Langfelder P, Zhang B and Horvath S:
Defining clusters from a hierarchical cluster tree: The dynamic
tree cut package for R. Bioinformatics. 24:719–720. 2007.
View Article : Google Scholar : PubMed/NCBI
|
|
25
|
Agarwal V, Bell GW, Nam JW and Bartel DP:
Predicting effective microRNA target sites in mammalian mRNAs.
Elife. 4:e050052015. View Article : Google Scholar
|
|
26
|
Wang X: Improving microRNA target
prediction by modeling with unambiguously identified
microRNA-target pairs from CLIP-Ligation studies. Bioinformatics.
32:1316–1322. 2016. View Article : Google Scholar : PubMed/NCBI
|
|
27
|
Paraskevopoulou MD, Georgakilas G,
Kostoulas N, Vlachos IS, Vergoulis T, Reczko M, Filippidis C,
Dalamagas T and Hatzigeorgiou AG: DIANA-microT web server v5.0:
Service integration into miRNA functional analysis workflows.
Nucleic Acids Res. 41:W169–W173. 2013. View Article : Google Scholar : PubMed/NCBI
|
|
28
|
Ashburner M, Ball CA, Blake JA, Botstein
D, Butler H, Cherry JM, Davis AP, Dolinski K, Dwight SS, Eppig JT,
et al: Gene Ontology: Tool for the unification of biology. Nat
Genet. 25:25–29. 2000. View
Article : Google Scholar : PubMed/NCBI
|
|
29
|
Kanehisa M and Goto S: KEGG: Kyoto
encyclopedia of genes and genomes. Nucleic Acids Res. 28:27–30.
2000. View Article : Google Scholar : PubMed/NCBI
|
|
30
|
Huang DW, Sherman BT and Lempicki RA:
Systematic and integrative analysis of large gene lists using DAVID
bioinformatics resources. Nature Protoc. 4:44–57. 2009. View Article : Google Scholar
|
|
31
|
Rouillard AD, Gundersen GW, Fernandez NF,
Wang Z, Monteiro CD, McDermott MG and Ma'ayan A: The harmonizome: A
collection of processed datasets gathered to serve and mine
knowledge about genes and proteins. Database (Oxford).
2016:baw1002016. View Article : Google Scholar : PubMed/NCBI
|
|
32
|
Szklarczyk D, Franceschini A, Wyder S,
Forslund K, Heller D, Huerta-Cepas J, Simonovic M, Roth A, Santos
A, Tsafou KP and Kuhn M: STRING v10: Protein-protein interaction
networks, integrated over the tree of life. Nucleic Acids Res.
43:D447–D452. 2014. View Article : Google Scholar : PubMed/NCBI
|
|
33
|
Shannon P, Markiel A, Ozier O, Baliga NS,
Wang JT, Ramage D, Amin N, Schwikowski B and Ideker T: Cytoscape: A
software environment for integrated models of biomolecular
interaction networks. Genome Res. 13:2498–2504. 2003. View Article : Google Scholar : PubMed/NCBI
|
|
34
|
Bader GD and Hogue CW: An automated method
for finding molecular complexes in large protein interaction
networks. BMC Bioinformatics. 4:22003. View Article : Google Scholar : PubMed/NCBI
|
|
35
|
Wedel T, Spiegler J, Soellner S, Roblick
UJ, Schiedeck TH, Bruch HP and Krammer HJ: Enteric nerves and
interstitial cells of Cajal are altered in patients with
slow-transit constipation and megacolon. Gastroenterology.
123:1459–1467. 2002. View Article : Google Scholar : PubMed/NCBI
|
|
36
|
Knowles CH, Scott M and Lunniss PJ:
Outcome of colectomy for slow transit constipation. Ann Surg.
230:6271999. View Article : Google Scholar : PubMed/NCBI
|
|
37
|
Chiarioni G, Salandini L and Whitehead WE:
Biofeedback benefits only patients with outlet dysfunction, not
patients with isolated slow transit constipation. Gastroenterology.
129:86–97. 2005. View Article : Google Scholar : PubMed/NCBI
|
|
38
|
Chin D and Means AR: Calmodulin: A
prototypical calcium sensor. Trends Cell Biol. 10:322–328. 2000.
View Article : Google Scholar : PubMed/NCBI
|
|
39
|
Zavecz JH, Jackson TE, Limp GL and Yellin
TO: Relationship between anti-diarrheal activity and binding to
calmodulin. Eur J Pharmacol. 78:375–377. 1982. View Article : Google Scholar : PubMed/NCBI
|
|
40
|
Deng Y, Han X, Tang S, Xiao W, Tan Z, Zhou
C, Wang M and Kang J: Magnolol and honokiol regulate the
calcium-activated potassium channels signaling pathway in
Enterotoxigenic Escherichia coli-induced diarrhea mice. Eur
J Pharmacol. 755:66–73. 2015. View Article : Google Scholar : PubMed/NCBI
|
|
41
|
Bobin P, Varin A, Lefebvre F, Fischmeister
R, Vandecasteele G and Leroy J: Calmodulin kinase II inhibition
limits the pro-arrhythmic Ca2+ waves induced by
cAMP-phosphodiesterase inhibitors. Cardiovascular Res. 110:151–161.
2016. View Article : Google Scholar
|
|
42
|
Ward SM, Ördög T, Koh SD, Baker SA, Jun
JY, Amberg G, Monaghan K and Sanders KM: Pacemaking in interstitial
cells of Cajal depends upon calcium handling by endoplasmic
reticulum and mitochondria. J Physiol. 525:355–361. 2000.
View Article : Google Scholar : PubMed/NCBI
|
|
43
|
Sanders KM, Koh SD and Ward SM:
Interstitial cells of Cajal as pacemakers in the gastrointestinal
tract. Annu Rev Physiol. 68:307–343. 2006. View Article : Google Scholar : PubMed/NCBI
|
|
44
|
Zhu MH, Kim TW, Ro S, Yan W, Ward SM, Koh
SD and Sanders KM: A Ca2+-activated Cl−
conductance in interstitial cells of Cajal linked to slow wave
currents and pacemaker activity. J Physiol. 587:4905–4918. 2009.
View Article : Google Scholar : PubMed/NCBI
|