Introduction
Nonalcoholic steatohepatitis (NASH) is a progressive
liver disease characterized by steatosis, inflammation, and
fibrosis leading to liver cirrhosis and cancer (1). NASH risk factors include obesity,
hypertension, and abnormal lipid metabolism (2). Hepatic steatosis results from the
accumulation of some lipids. Free fatty acid delivery to the liver
accounts for almost two-thirds of the lipid accumulation (3). The two-hit hypothesis, which states
that hepatitis is induced by inflammation and oxidative stress
after lipid accumulation in hepatocytes, has been considered the
main mechanism underlying NASH progression (4). Recently, the multiple parallel hit
hypothesis, which states that hepatitis progresses due to several
factors that lead to fat accumulation in the liver, adipose tissue,
and digestive tract, has gained support (3). The activation of hepatic stellate
cells by increased production of transforming growth factor beta
(TGF-β) by Kupffer cells and hepatocytes; activation of
inflammatory cytokines such as the tumor necrosis factor-α (TNF-α),
interleukin (IL)-6, and IL-1β due to oxidative stress; and
acceleration of hepatocyte apoptosis contribute to the progression
of NASH. In addition, these inflammatory cytokines are regulated by
nuclear factor-κB (NF-κB). Furthermore, the progression of liver
fibrosis in NASH is associated with alterations in the
extracellular matrix mainly by increased production of type I
collagen (5–9). NASH progresses with increasing degrees
of fibrosis, with the most common complication being cirrhosis
(2).
Renalase is a flavin adenine dinucleotide-dependent
amine oxidase that metabolizes catecholamines such as dopamine,
epinephrine, and norepinephrine (10). Renalase is secreted by the proximal
tubule in the kidney into the blood to degrade catecholamines and
regulate blood pressure (10,11).
One study has reported that patients with chronic kidney disease
and type II diabetes have high renalase levels in the blood
(12). Renalase activates the
PI3K/Akt and extracellular signal-regulated kinase signalling
pathways and exerts cell-protective effects via the renalase
receptor plasma membrane Ca2+ ATPase isoform 4 b
(PMCA4b) (13,14). Wu et al showed that TGF-β
increases the levels of fibrosis markers such as α-smooth muscle
actin (α-SMA), E-cadherin, and collagen type I α 1 (Col1a1) in
human kidney 2 cells (15). In
addition, hepatic renalase expression increases in response to
oxidative stress in the mouse liver with induced
ischemia-reperfusion (IR) injury, suggesting that renalase protects
tissues (16). Recently, the
downregulation of renalase in nonalcoholic fatty liver disease
(NAFLD) and its protective role against liver IR injury has been
reported, indicating that the downregulation of renalase may be
involved in the susceptibility of the fatty liver to IR injury
(17).
The progression of liver diseases such as NAFLD and
NASH is considered to be suppressed by the inhibitory effects of
renalase on inflammation, oxidative stress, and apoptosis.
Therefore, we hypothesized that if NASH is induced in the absence
of renalase, we should be able to observe increased liver
inflammation and fibrosis and a significant decline in the liver
function. In order to clarify this, we fed renalase knockout (KO)
mice with a choline-deficient high-fat diet (CDAHFD) supplemented
with 0.1% methionine to induce NASH. We then characterized the
effects of the renalase KO on the mouse liver using several markers
of liver health and activity.
Materials and methods
Animals and experimental design
B6;129S1-Rnlstm1Gvd/J mice were purchased from the
Jackson Laboratory. Renalase KO and wild type (WT) mice were
produced by mating heterozygous mice and identified by polymerase
chain reaction (PCR) amplification of mouse genomic DNA, as
previous described (7). A total of
24 male mice (KO, n=12; WT, n=12) were fed standard chow and water
ad libitum and housed under standard laboratory conditions
(23.5±2.5°C, 52.5±12.5%, 14:10-h light-dark cycle). At 6 weeks of
age, these mice were divided into four groups; WT-normal diet (ND;
MF 12 mm φ pellet; Oriental Yeast Co.), WT-choline-deficient,
L-amino acid-defined, high-fat diet (CDAHFD; A06071302, Research
Diets), KO-ND, and KO-CDAHFD. The diet was replenished every 3–4
days. After 6 weeks under each condition, the mice were killed by
cervical dislocation after anesthesia with 5 ml of the mix solution
(isoflurane:propylene glycol=3:7) added to the container of
approximately 3L. The current study followed the ethical guidelines
from western institutions to justify the method of euthanasia used
in the study. In addition, the volume of propylene glycol used in
the current study exhibited no toxicity (18). Liver samples and blood from the
inferior vena cava were collected. The sera were collected by
centrifugation (4°C, 3,000 × g, 30 min) after settling for 16 h at
4°C. Samples were stored at −80°C for subsequent analyses.
Assay for liver cholesterol and
triglyceride and serum hepatic markers in the blood
Total cholesterol (T-CHO) and triglyceride (TG) in
the liver were analysed by Cosmo Bio Co., Ltd. Serum aspartate
aminotransferase (AST), alanine aminotransferase (ALT), alkaline
phosphatase (ALP), and lactate dehydrogenase (LDH) were analysed by
Fujifilm Bio Inc., Ltd.
Immunostaining
Liver samples were replaced with 70% EtOH overnight
after fixation in 10% paraformaldehyde in PBS for 72 h. The liver
tissue was cut into 3-µm thick sections. Hematoxylin and eosin
(H&E) and Masson's trichrome (MT) staining were performed and
analysed using a BZ-X710 all-in-one fluorescence microscope
(Keyence).
Western blot analysis
Radioimmunoprecipitation assay (RIPA) buffer (50 mM
Tris-HCl, 150 mM NaCl, 1 mM EDTA, 0.1% (w/v) sodium dodecyl sulfate
(SDS), 0.5% (w/v) sodium deoxycholate, 1% (v/v) Nonidet P-40, and
distilled water) with phosphatase and protease inhibitors (Roche
Ltd., Basel, Switzerland) was added to the liver samples, and the
mixture was homogenized using the TissueLyser LT (Qiagen, Hilden,
Germany). After homogenization, the samples were centrifuged (4°C,
12,000 × g, 15 min), and the supernatant was collected. We used
western blotting to separate and quantify the proteins in
homogenates of liver samples. First, protein content of the
homogenates was measured using the bicinchoninic acid (BCA) method
as per the manufacturer's instructions (Nacalai Tesque Inc.).
Absorbance of the samples was measured at 562 nm using a microplate
reader (Varioskan LUX; Thermo Fisher Scientific, Inc.). A
calibration curve was prepared using bovine serum albumin (BSA) as
standard (2 mg/ml); sample concentrations were determined by
comparison to the standard.
Next, to separate proteins, SDS polyacrylamide gel
electrophoresis (SDS-PAGE) was conducted. Each sample was diluted
with sample buffer (2X Laemmli sample buffer and 10%
2-mercaptoethanol) to a concentration of 2 mg/ml. Five microliters
of each sample were loaded onto the gel. After electrophoresis,
isolated proteins were transferred to a polyvinylidene fluoride
membrane (PVDF) using Turbo blot (Bio-Rad Laboratories, Inc.).
Blocking buffer containing 5% (w/v) skim milk and 5% (v/v) Blocking
One (Nacalai Tesque Inc.) in Tris-buffered saline containing 0.1%
Tween-20 (TBST) was used to block the PVDF membrane for 30 min at
room temperature (20–25°C).
Membranes were washed three times (5 min per wash)
with TBST and allowed to incubate with the primary antibody
overnight at 4°C. Thereafter, we washed the membranes three times
(5 min per wash) with TBST and incubated them with the secondary
antibody (1:5,000 in TBST; Cell Signaling Technology, Inc.) for 1
h. The PVDF membrane was washed three times and luminescence was
detected using a chemiluminescent reagent (ECL Select Western
Blotting Detection Reagent; GE Healthcare) and imaged using
ImageQuant LAS-4000 (GE Healthcare Life Science). The signal
densities were analysed using ImageJ. Table SI shows the primary and secondary
antibodies used in this study.
Reverse transcription-quantitative
polymerase chain reaction (RT-qPCR)
The mRNA levels were measured using RT-qPCR. To
extract total RNA, the liver was homogenized on ice in Sepasol-RNA
I Super G (Nacalai Tesque Inc.), followed by separation into
organic and aqueous phases with chloroform. Samples were allowed to
sit at room temperature (20–25°C) for 3 min and centrifuged (4°C,
12,000 × g, 15 min). The separated aqueous phase was removed, and
isopropanol was added. The mixture was mixed by inversion,
incubated for 10 min, and centrifuged (4°C, 12,000 × g, 10 min).
The supernatant was removed, and 70% ethanol was added to the
pellet; the pellet was resuspended using a vortex mixer.
Centrifugation (4°C, 12,000 × g, 5 min) was performed to remove the
supernatant. Finally, UltraPure DNase/RNase-Free Distilled Water
(Invitrogen; Thermo Fisher Scientific, Inc.) was added, and the
sample was incubated at 65°C for 5 min. The extracted RNA was
quantified using spectrophotometry (Nanodrop ND2000, Thermo Fisher
Scientific, Inc.). The extracted RNA was used for cDNA synthesis
using PrimeScript RT reagent kit (Takara Bio) was performed as per
the manufacturer's instructions. Reverse transcription was carried
out in a thermal cycler (TP 350; Takara Bio) (37°C, 15 min; 85°C, 5
sec; 4°C, ∞). After reverse transcription, the cDNA was diluted
10-fold using UltraPure DNase/RNase-Free Distilled Water. KAPA SYBR
FAST qPCR Master Mix (KK 4602; Kapa Biosystems), upstream and
downstream primers, ROX Low Reference Dye (KD 4601; Kapa
Biosystems), and UltraPure Distilled Water were added, and PCR
amplification was conducted using a QuantStudio 5 Real-Time PCR
System (Thermo Fisher Scientific). RT-qPCR amplification was set up
as follows: initial denaturation at 95°C for 20 sec, followed by 35
cycles of denaturation at 95°C for 30 sec and annealing and
extension at 60 °C for 30 sec. The mRNA level of the TATA-binding
protein (encoded by the mouse Tbp gene) was used as the
housekeeping gene. The cycle threshold (Ct) value of the target
gene was standardized to that of the housekeeping gene (ΔΔCt
method) (19). The relative
expression level of the target gene was calculated as the relative
value compared with that of the WT-ND group. The primer sequences
used in this experiment are shown in Table SII.
Thiobarbituric acid reactive
substances (TBARS)
TBARS measurement in the liver was performed as
previously described (20).
Briefly, PBS with a protease inhibitor (Roche Ltd.) was added to
the tissue. The tissue was crushed with a bead crusher and
centrifuged, and the supernatant was used as the sample. SDS
(5.2%), thiobarbituric acid solution (0.8%), ultrapure water,
butylhydroxyltriene glacial acetic acid solution (0.8%) were mixed
in a ratio of 4:30:34:1 to prepare the reaction solution. Ethanol
(10%, 997.8 µl) was added to 2.2 µl of 1,1,3,3-tetraethoxypropane
(TEP), and this solution was diluted 100 times with ultrapure water
to prepare a 100 nmol/ml TEP solution (standard solution).
Furthermore, this solution was diluted with ultrapure water to
prepare standard solutions for a calibration curve ranging from 0
to 50 nmol/ml.
The reaction solution and 0.1 M acetate buffer were
poured into a 1.5-ml tube, and the sample or standard solution was
added. After allowing to sit still at 4°C for 30 min, the solution
was subjected to heat shock at 100°C for 60 min. Butanol:pyridine
(15:1, v/v) was added to the solutions on ice. The mixture was
vigorously stirred and centrifuged (300 × g, 10 min, 4°C). The
supernatant was transferred into a 96-well microplate, and the
absorbance at 532 nm was measured using a microplate reader
(Varioskan LUX; Thermo Fisher Scientific, Inc.).
A calibration curve was created based on the
absorbance of the standard solutions, and the TBARS concentration
in the sample was determined. The TBARS concentration was expressed
per mg of protein.
Statistical analysis
Data are presented as mean ± SD. For almost
measurements, a two-way analysis of variance was conducted. For
body weight data, a three-way ANOVA was conducted. In the case of
significant interaction between the genotype and diet (and time),
comparisons were made using Bonferroni's post hoc test. GraphPad
Prism 8 software (GraphPad Software, Inc.) was used for all
statistical calculations, and the significance level was set to
P<0.05 or P<0.01 for all cases.
Results
Effects of the renalase KO and CDAHFD
on overall mouse health and the liver status
After feeding ND or CDAHFD for 6 weeks starting from
5 weeks of age, WT and KO mice given ND exhibited significant
increase in body weight from 6 or 7 weeks of age. However, the
CDAHFD group did not show any significant change in body weight.
Nonetheless, there was a significant difference between the final
body weights of mice in the ND and CDAHFD groups (Table I). We also show the trend in body
weight change throughout the study (Fig. S1A). In addition, renalase mRNA
levels in the liver were measured in all mice (Fig. S1B).
 | Table I.Phenotype, blood markers, and hepatic
lipid and TBARS. |
Table I.
Phenotype, blood markers, and hepatic
lipid and TBARS.
| Measurements | WT-ND | WT-CDAHFD | KO-ND | KO-CDAHFD | Interaction | Main effect
(genotype) | Main effect
(diet) |
|---|
| Final body weight
(g) | 29.5±2.6 |
23.1±1.3 | 29.9±1.7 |
24.0±0.9 | n.s. | n.s. | P<0.01 |
| Liver weight/BW
(mg) | 35.2±3.7 |
61.9±10.3 | 39.8±2.8 |
57.2±14.6 | n.s. | n.s. | P<0.01 |
| Serum AST activity
(IU/l) | 50.3±9.6 |
483.2±206.0 | 54.0±7.4 |
593.7±282.5 | n.s. | n.s. | P<0.01 |
| Serum ALT activity
(IU/l) | 33.0±7.4 |
497.2±96.3 | 26.8±6.8 |
563.7±201.7 | n.s. | n.s. | P<0.01 |
| Serum ALP activity
(IU/l) | 286.8±17.5 |
505.6±98.6 | 237.5±23.2 |
606.2±209.2 | n.s. | n.s. | P<0.01 |
| Serum LDH activity
(IU/l) | 300.8±54.5 | 1,542.0±196.7 | 535.4±59.2 | 1,906.5±717.6 | n.s. | n.s. | P<0.01 |
| Hepatic TCHO
(mg/g) |
2.9±0.2 |
5.4±0.5 |
2.5±0.4 |
5.2±0.6 | n.s. | n.s. | P<0.01 |
| Hepatic TG
(mg/g) | 18.5±3.9 |
300.9±27.8 | 13.9±4.6 |
304.2±33.6 | n.s. | n.s. | P<0.01 |
| Hepatic TBARS
(nmol/mg) |
1.4±0.5 |
7.3±3.3 |
1.8±0.2 |
7.9±2.2 | n.s. | P=0.06 | P<0.01 |
Furthermore, CDAHFD significantly increased liver
weight compared with ND (Table I).
Activities of serum AST, ALT, and ALP, which are liver function
markers in the blood, also increased following CDAHFD. CDAHFD
resulted in a significantly higher serum LDH than that by ND in
both WT and KO mice. Significant elevations in T-CHO and TG in the
liver were observed in mice under CDAHFD. Similarly, concentration
of TBARS and lipid peroxide increased as an effect of CDAHFD.
Hepatic lipid accumulation and
fibrosis
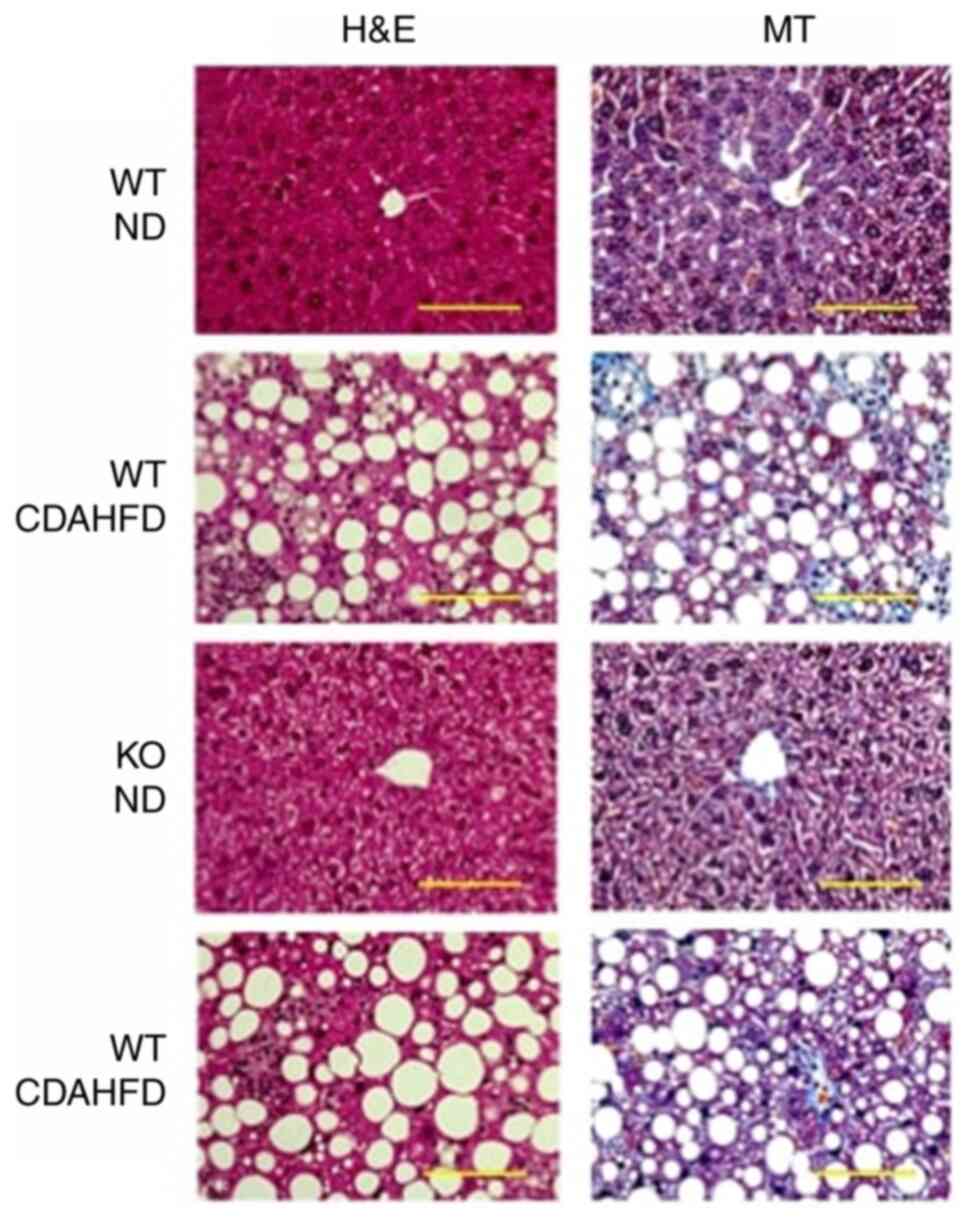
Based on H&E staining, significant accumulation
of lipid droplets was observed in mice under CDAHFD, but no
significant difference was observed between the histology of mice
in the WT-CDAHFD and KO-CDAHFD groups (Fig. 1).
MT staining showed collagen fibres stained in blue
in the liver of mice under CDAHFD, but no significant difference
was observed between the histology of mice in the WT-CDAHFD and
KO-CDAHFD groups (Fig. 1).
mRNA levels of inflammatory and
oxidative stress markers in the liver
Increased transcript levels of inflammatory
cytokines Tnfα and IL-1β were observed under CDAHFD (Fig. 2). Furthermore, the mRNA level of the
adhesion G protein-coupled receptor E1 (Adgre1), a macrophage
marker, was found to be significantly higher in the KO-CDAHFD group
than in the WT-CDAHFD group.
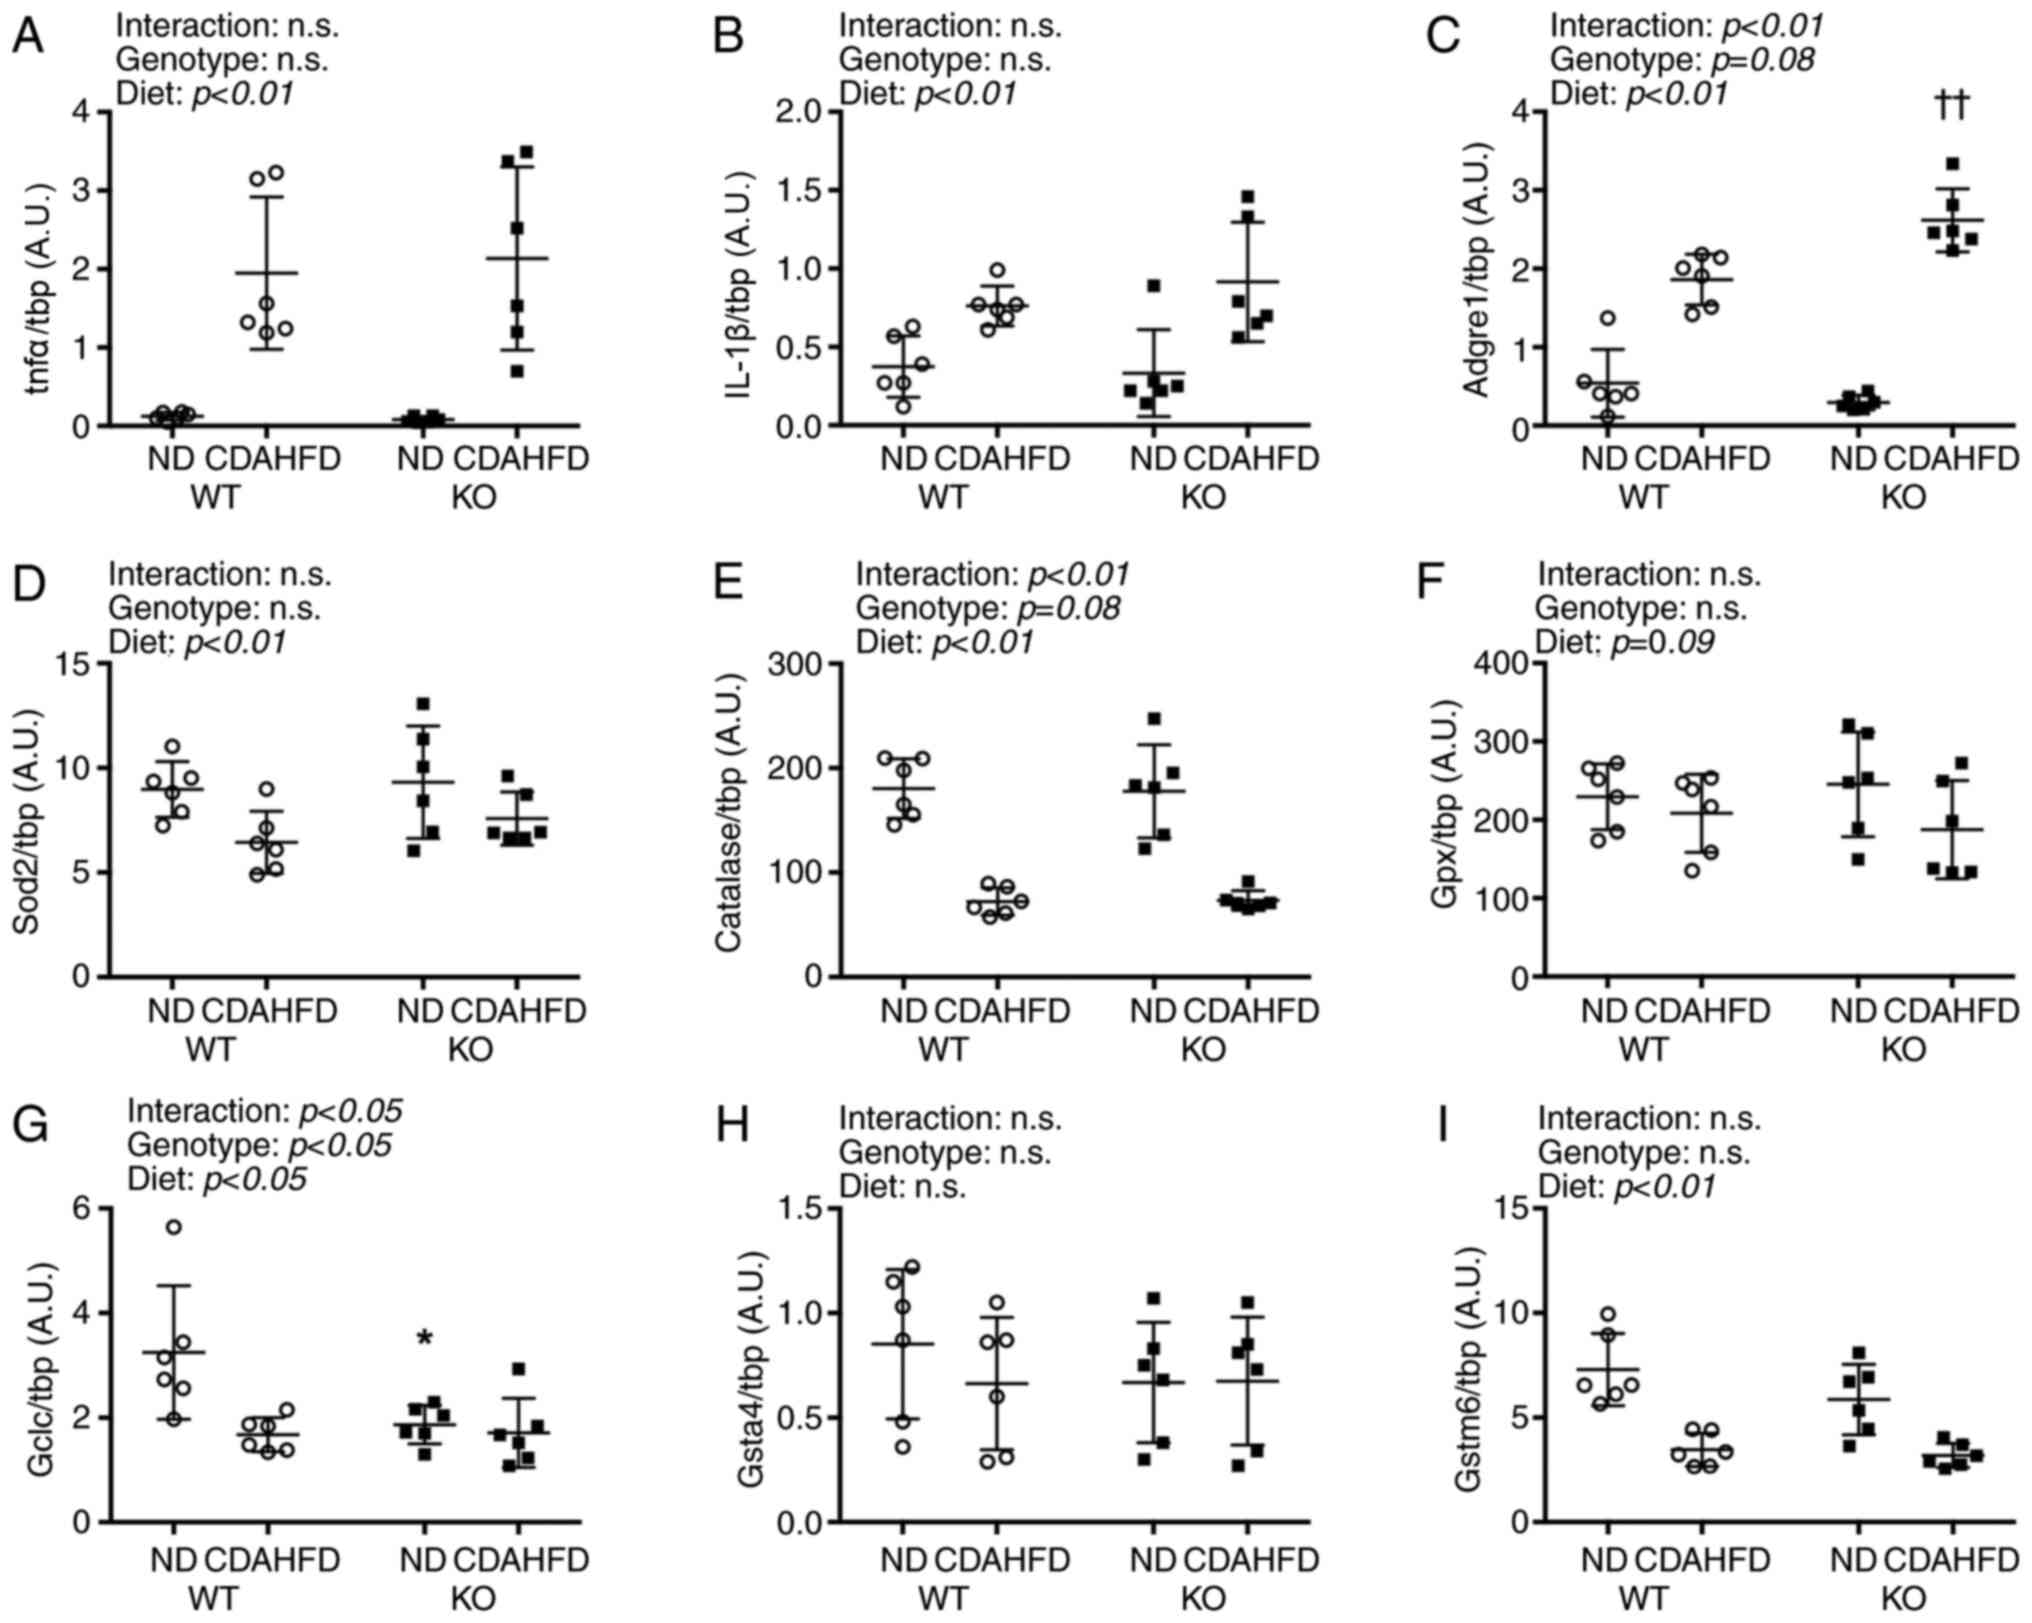 | Figure 2.Inflammation and antioxidant mRNA
expressions in liver on NASH model mice. (A-I) All mRNA expressions
were compared between WT and KO fed ND or CDAHFD groups using the
ΔΔCq method. Data are shown as mean ± SD. n=6 in each group. Data
were analyzed using two way ANOVA. *P<0.05 vs. WT-ND.
††P<0.01 vs. WT-CDAHFD. WT, wild type; KO, renalase
knock out; tnfα, tumor necrosis factor-α; IL-1β, interleukin-1β;
Adgre1, adhesion G protein-coupled receptor E1; Sod, superoxide
disumtase; Gpx, gluthatione peroxidase; Gclc, γ-glutamylcysteine
synthetase; Gsta4, gluthatione S-transferase α4; Gstm6, gluthatione
S-transferase mu 6; CDAHFD, choline-deficient high-fat diet; NASH,
nonalcoholic steatohepatitis; ND, normal diet. |
The mRNA levels of antioxidative enzymes superoxide
dismutase 2 (Sod2), which is found in the mitochondria, and
catalase decreased following CDAHFD. Moreover, glutathione
peroxidase (Gpx) mRNA levels were not affected by the type of diet.
The mRNA level of the γ-glutamylcysteine synthetase catalytic unit
(Gclc), which is involved in the synthesis of glutathione, an
antioxidant, was affected by the genotype and diet and was
significantly lower in the KO-ND group than in the WT-ND group.
Furthermore, CDAHFD significantly reduced the transcript levels of
glutathione S-transferase mu 6 (Gstm6) but did not exert
significant effects on that of glutathione S-transferase α 4
(Gsta4).
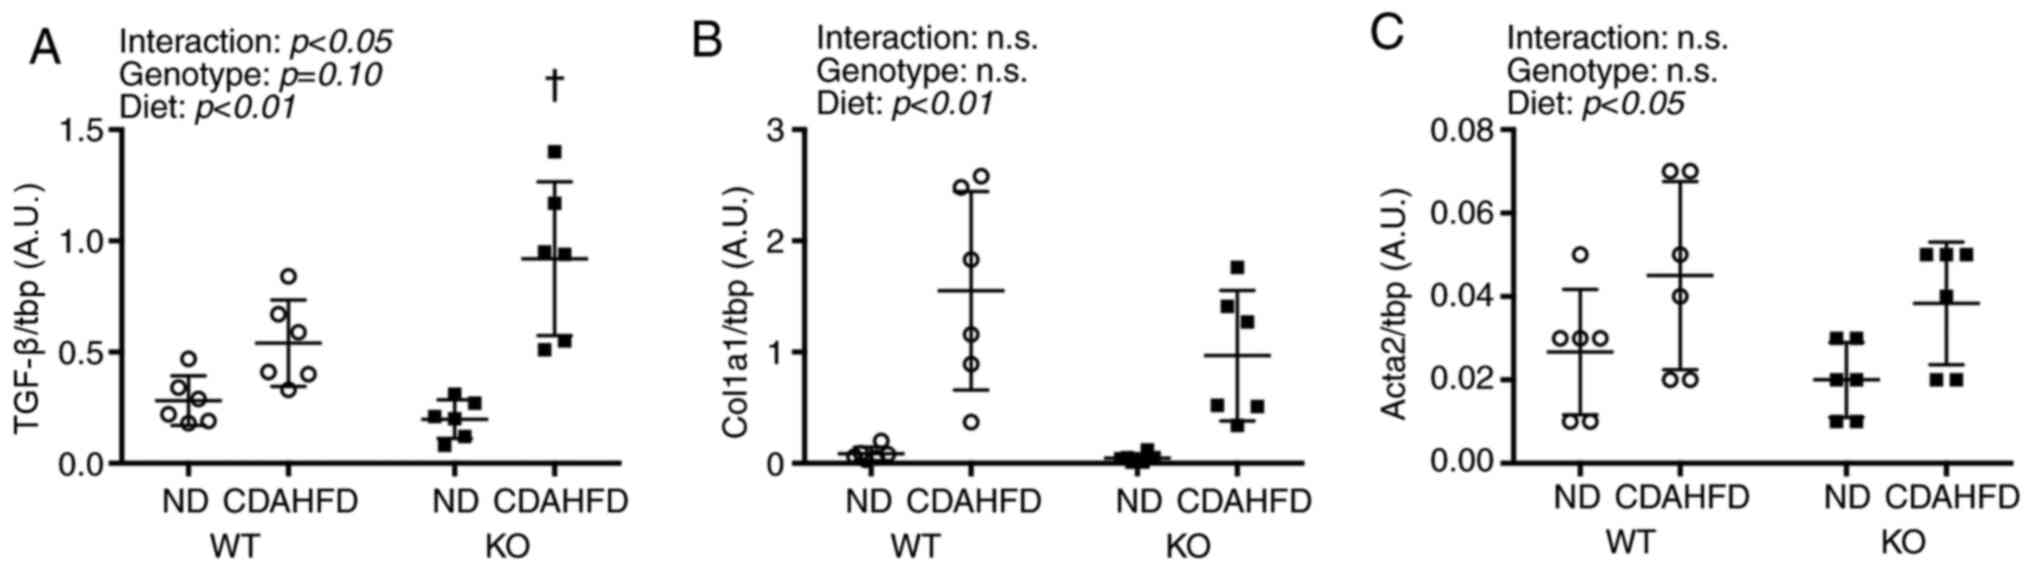
mRNA levels of liver fibrosis
markers
An interaction was observed between Tgfb1 and
diet, and the KO-CDAHFD group had significantly higher Tgfb1
mRNA levels than the WT-CDAHFD group (Fig. 3). Furthermore, CDAHFD increased the
levels of Col1a1 and Acta2 mRNA.
Protein expression of AMPK, Akt, and
p70S6K
There was a significant interaction between the diet
and genotype for the levels of phosphorylated Akt (p-Akt) (Fig. 4). The p-Akt/Akt levels in the WT-ND
group were significantly higher than that in the KO-ND group. In
addition, CDAHFD led to a significant increase in the
phosphorylation of p70S6K (p-p70S6K). Phosphorylation of AMPK also
increased with CDAHFD.
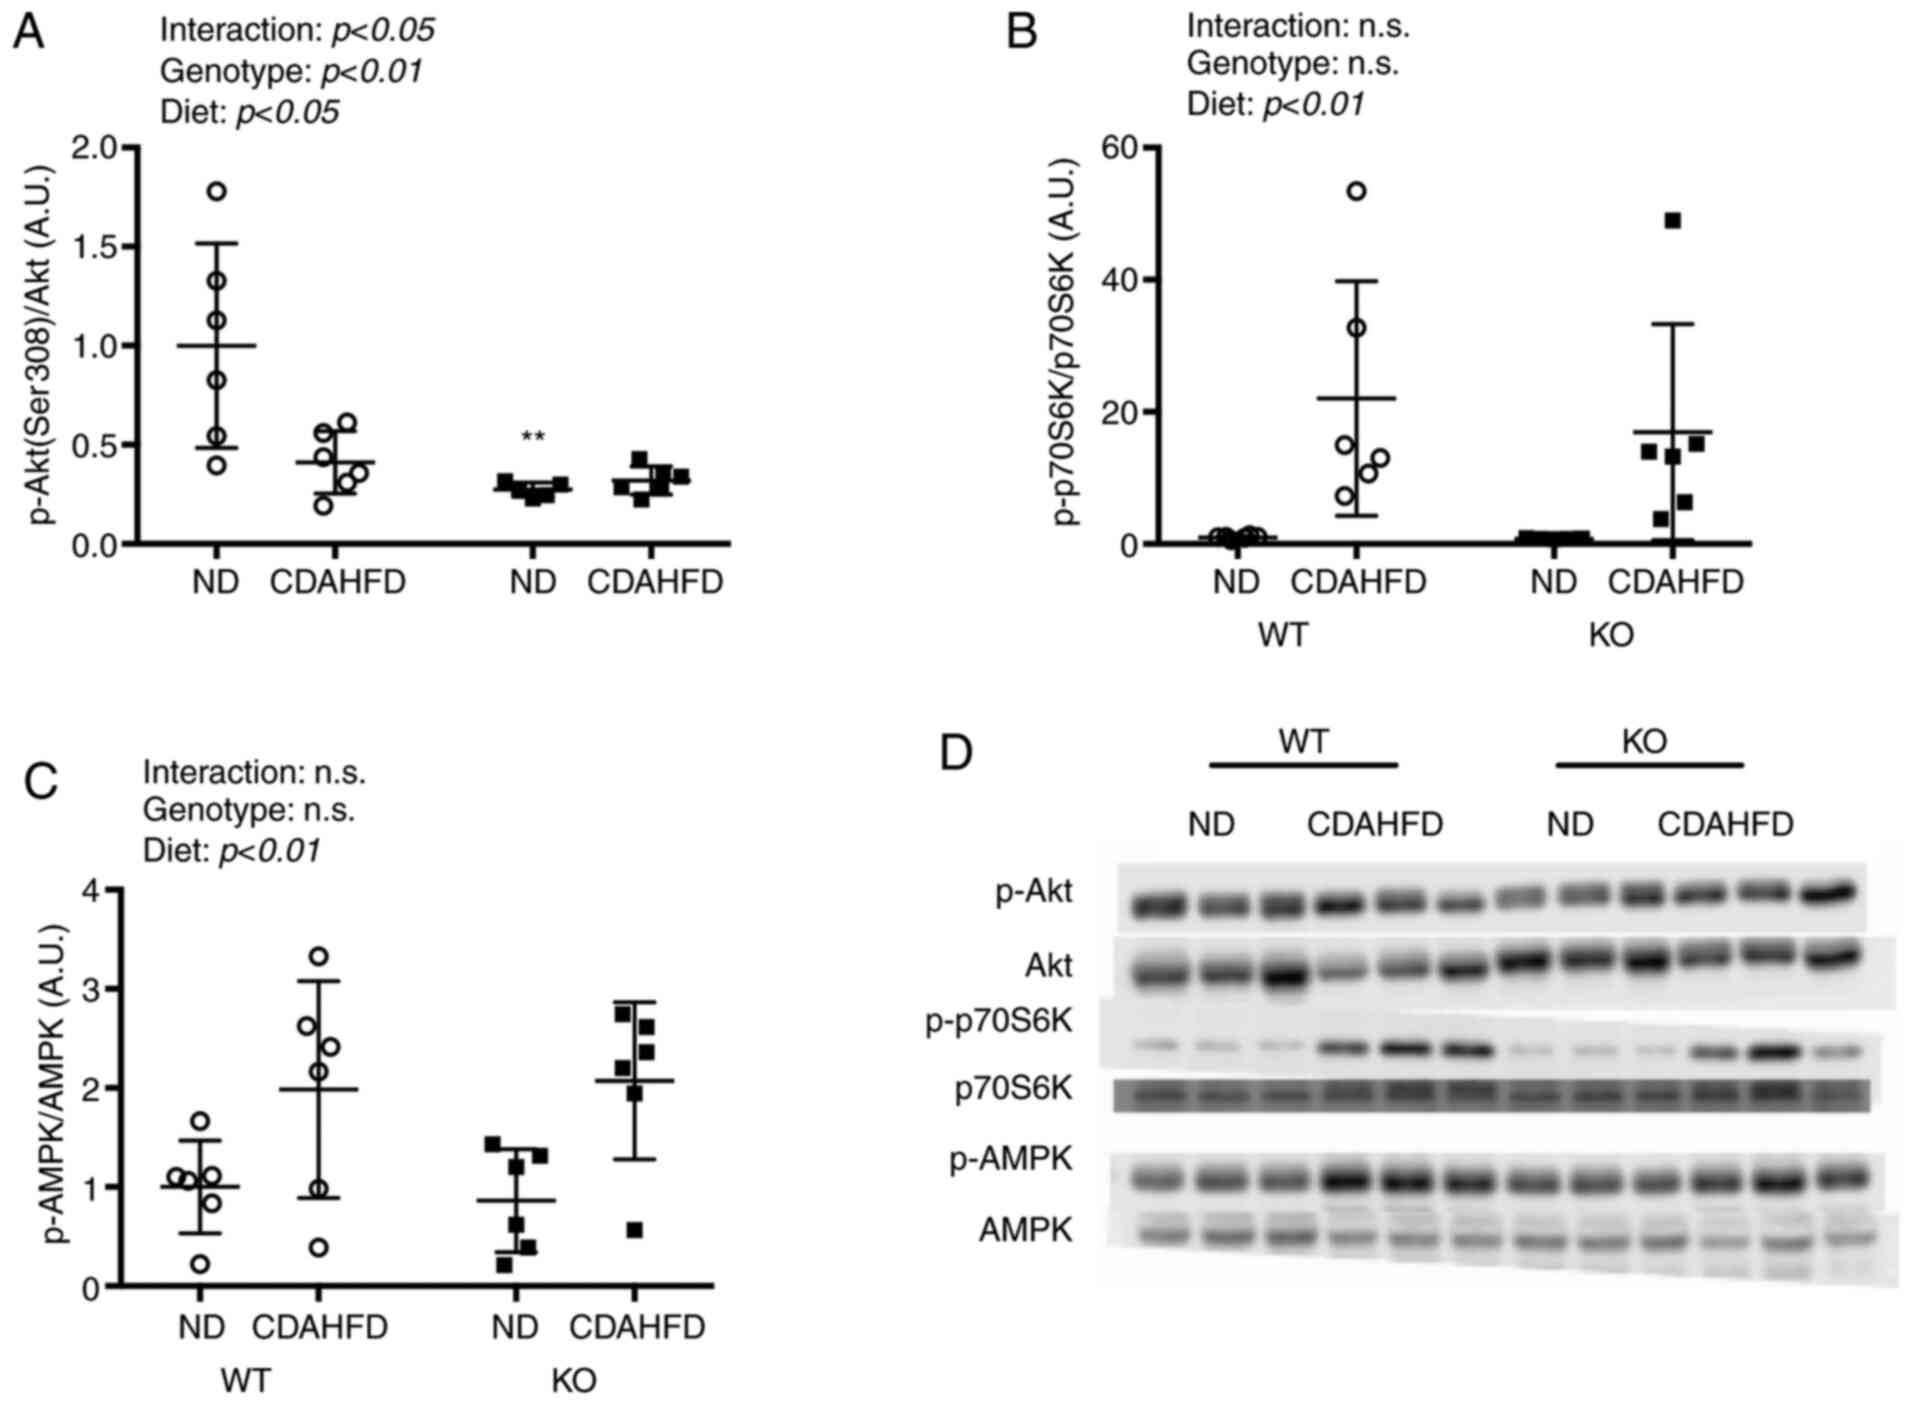 | Figure 4.Akt, p70S6K, AMPK expressions in
liver on NASH model mice. Protein expressions of (A) Ser308, (B)
p70S6K and (C) AMPK were compared between WT and KO fed ND or
CDAHFD groups using the western blotting method. (D) Western blot
analysis. Data are shown as mean ± SD. Data were analyzed using two
way ANOVA. **P<0.01 vs. WT-ND. WT, wild type; KO, renalase knock
out; p, phosphorylated; CDAHFD, choline-deficient high-fat diet;
NASH, nonalcoholic steatohepatitis; ND, normal diet; p70S6K, p70S6
kinase. |
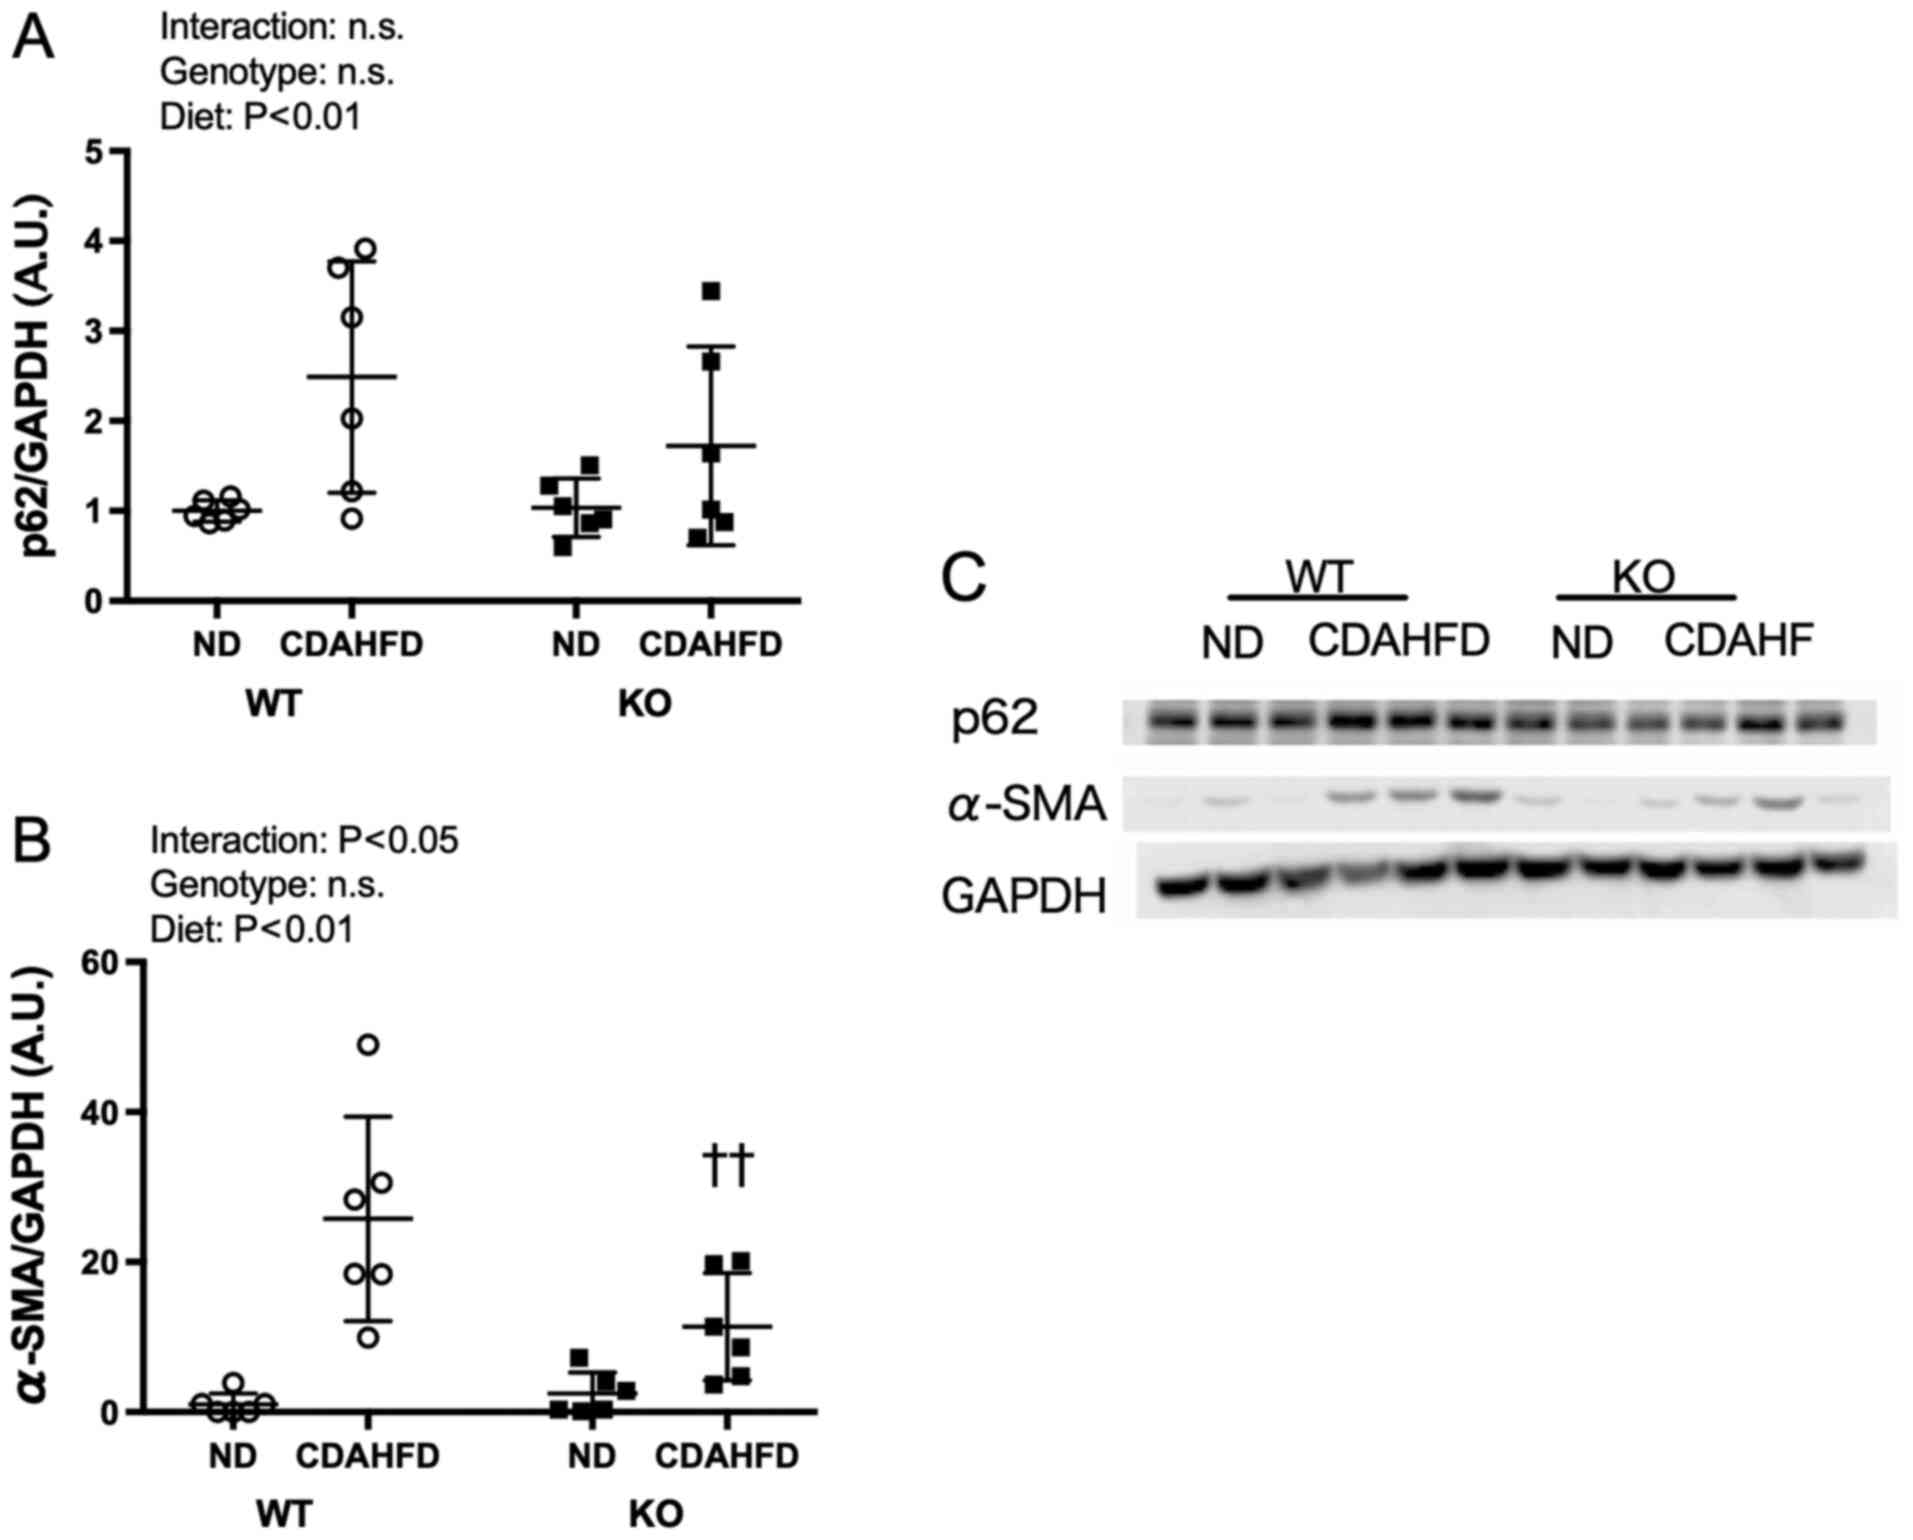
Expression levels of p62 and
α-SMA
For the expression level of α-SMA, an interaction
between the diet and genotype was observed; α-SMA expression in the
KO-CDAHFD group was significantly lower than that in the WT-CDAHFD
group (Fig. 5).
Discussion
A methionine/choline deficient diet (MCD) is one of
the ways to induce NASH in rodents (7,9).
However, the MCD mouse model experiences body weight loss
accompanied by weight loss of white adipose tissue, which increases
the risk of mortality (9).
Therefore, a novel diet-induced NASH model using CDAHFD has been
established as it exhibits fat accumulation and fibrosis in the
liver and suppresses the weight loss observed in the MCD model
(9). In the present study, the
CDAHFD model was selected as the NASH model. Our findings showed
that there was no difference in the body weight between WT and KO
mice, although the body weight of the mice in the CDAHFD groups was
significantly lower than that of the mice in the ND groups.
Furthermore, the levels of liver function markers in the blood
(serum AST, ALT, ALP, and LDH activities), as well as T-CHO and TG
levels significantly increased as an effect of the CDAHFD.
Moreover, accumulation of lipid droplets and collagen fibres were
confirmed by H&E and MT staining, respectively, in the
WT-CDAHFD and KO-CDAHFD groups. These observations are consistent
with those in previous studies (6,8). Suga
et al observed that mice fed with CDAHFD for 6 weeks show
hepatic steatosis and fibrosis (8).
However, in the present study, significant effects of the renalase
KO were not observed on the body weight, liver weight, blood liver
function markers, and liver lipid levels. Furthermore, there was no
difference between the H&E and MT staining for the WT-CDAHFD
and KO-CDAHFD groups. Therefore, renalase deficiency did not have
dramatic effects on the NASH pathology in this study.
In NAFLD and NASH, oxidative stress is enhanced by
mitochondrial abnormalities, endoplasmic reticulum stress, and
endotoxin action; liver fibrosis progresses through the activation
of hepatic stellate cells (5–9).
Renalase has been reported to inhibit oxidative stress (21). Therefore, in order to evaluate the
effect of renalase deficiency on oxidative stress in the NASH
model, the levels of TBARS and mRNA levels of genes involved in
glutathione metabolism and regulation of oxidative stress were
measured. Moreover, hepatic TBARS concentration is used for
evaluating the amount of lipid peroxides and as an index of
oxidative stress (20,22). We found hepatic TBARS concentration
to be significantly higher in the CDAHFD groups than in the ND
groups. This is consistent with an increase in the liver reactive
oxygen species and TBARS concentrations in other studies on NASH
models (6,7,23,24).
In contrast, we could partly observe the expected increase the
levels of TBARS in the mice with renalase KO. The hepatic TBARS in
KO mice might be higher than that in WT mice because of the mouse
genotypes considered in this study. Additionally, the Gclc mRNA
level was significantly lower in the KO-ND group than in the WT-ND
group. γ-glutamylcysteine ligase, the rate-limiting enzyme for
glutathione synthesis, contributes to the maintenance of the
intracellular redox balance by glutathione synthesis (25). Therefore, based on the low levels of
Gclc transcripts in the KO mice, we infer that the KO mice had low
intracellular GSH levels due to the inhibition of glutathione
synthesis. Moreover, when CDAHFD is ingested for a period longer
than 6 weeks as in this experiment, the renalase KO may increase
oxidative stress and affect NASH pathology.
Macrophages present in the liver are divided into
Kupffer cells and monocyte-derived macrophages, and
monocyte-derived macrophages infiltrate the liver tissues in
response to chemokines secreted from hepatocytes and Kupffer cells
(26). In our study, transcription
of the Adgre1 gene, which encodes F4/80, a marker of mature
macrophages, was significantly higher in the KO-CDAHFD group than
in the WT-CDAHFD group. In other words, hepatocyte dysfunction
might have occurred in the absence of renalase. The secretion of
inflammatory cytokines and chemokines in tissues may have been
promoted through the activation of the NF-κB pathway, and the
migration of macrophages into the liver may be due to oxidative
stress suppression and mitochondrial mitotic inhibitory effect
caused by the renalase deficiency (22,27,28).
Alternatively, it is possible that the expression of Kupffer cells
will have increased in the renalase KO mice; however, this needs
further investigation. Moreover, NF-κB-regulated renalase
expression led to phosphorylation of Akt via PMCA 4b receptor,
although no effect of hepatic fibrosis induced by oxidative stress
on inflammation via NF-κB was observed in the MT staining of WT and
KO mice. Furthermore, it has been reported that phosphorylation of
Akt is caused by hepatic stellate cell (29). We observed that phosphorylation of
Akt in WT mice decreased significantly compared with that in KO
mice. Therefore, the decreased expression of fibrosis marker α-SMA
in KO mice might result from the decreased p-Akt in this study.
The expression level of the Tgfb1 gene was
significantly higher in the KO-CDAHFD group than in the WT-CDAHFD
group. Furthermore, the expression levels of type I collagen fibres
and α-SMA are expected to increase through the TGF-β/Smad pathway
mediated by the TGF-β receptor (30). However, the expression levels of
α-SMA were lower in the KO-CDAHFD group than in the WT-CDAHFD
group, while the Acta2 mRNA levels were not significantly different
between the WT-CDAHFD and the KO-CDAHFD groups. This may be because
of the suppression of the signal downstream of the TGF-β receptor.
Therefore, further investigation is needed to evaluate the effects
of it on the activation of SMAD2/3, which regulates the production
of extracellular matrix proteins through the TGF-β signalling
pathway and SMURF2 (31), which is
known to suppress the SMAD2/3 signalling pathway.
In conclusion, renalase deficiency had no
significant effects on NASH pathology in the CDAHFD-administered
NASH mouse model. However, our findings suggest that hepatic
fibrosis progression may be partly suppressed, while oxidative
stress increases and macrophage infiltration occurs in the absence
of renalase. Therefore, our study suggests renalase in the liver,
as a potential therapeutic target for fibrosis in NASH (Fig. 6). In
the future study, it will be also needed to measure fibronectin 1
and col1a1 protein expression because these proteins are fibrosis
markers (32).
Supplementary Material
Supporting Data
Acknowledgements
Not applicable.
Funding
No funding was received.
Availability of data and materials
All data generated or analysed during this study are
included in this published article.
Authors' contributions
KTo, TK and KTa designed the concept of the current
study. KTo, NS, KA and SO performed the experiments. KTo drafted
the manuscript. KTo, NS, KA, TK, YY, TS and KTa analyzed the data.
All authors read and revised the manuscript. All authors read and
approved the final manuscript.
Ethics approval and consent to
participate
All experiments in the present study were approved
by the Animal Subjects Committee, University of Tsukuba, Japan
(approval no. 19-455).
Patient consent for publication
Not applicable.
Competing interests
The authors declare that they have no competing
interests.
Glossary
Abbreviations
Abbreviations:
|
KO
|
knockout
|
|
WT
|
wild type
|
|
NASH
|
nonalcoholic steatohepatitis
|
|
CDAHFD
|
choline-deficient high-fat diet
|
|
ND
|
normal diet
|
References
|
1
|
Bugianesi E, Leone N, Vanni E, Marchesini
G, Brunello F, Carucci P, Musso A, De Paolis P, Capussotti L,
Salizzoni M, et al: Expanding the natural history of nonalcoholic
steatohepatitis: From cryptogenic cirrhosis to hepatocellular
carcinoma. Gastroenterology. 123:134–140. 2002. View Article : Google Scholar : PubMed/NCBI
|
|
2
|
Esler WP and Bence KK: Metabolic Targets
in Nonalcoholic Fatty Liver Disease. Cell Mol Gastroenterol
Hepatol. 8:247–267. 2019. View Article : Google Scholar : PubMed/NCBI
|
|
3
|
Tilg H and Moschen AR: Evolution of
inflammation in nonalcoholic fatty liver disease: The multiple
parallel hits hypothesis. Hepatology. 52:1836–1846. 2010.
View Article : Google Scholar : PubMed/NCBI
|
|
4
|
Day CP and James OFW: Steatohepatitis: A
tale of two ‘hits’? Gastroenterology. 114:842–845. 1998. View Article : Google Scholar : PubMed/NCBI
|
|
5
|
Anty R and Gual P: Pathogenesis of
non-alcoholic fatty liver disease. Presse Med. 48:1468–1483.
2019.(In French). View Article : Google Scholar : PubMed/NCBI
|
|
6
|
Takatani N, Kono Y, Beppu F,
Okamatsu-Ogura Y, Yamano Y, Miyashita K and Hosokawa M: Fucoxanthin
inhibits hepatic oxidative stress, inflammation, and fibrosis in
diet-induced nonalcoholic steatohepatitis model mice. Biochem
Biophys Res Commun. 528:305–310. 2020. View Article : Google Scholar : PubMed/NCBI
|
|
7
|
Ke Z, Zhao Y, Tan S, Chen H, Li Y, Zhou Z
and Huang C: Citrus reticulata Blanco peel extract ameliorates
hepatic steatosis, oxidative stress and inflammation in HF and MCD
diet-induced NASH C57BL/6 J mice. J Nutr Biochem. 83:1084262020.
View Article : Google Scholar : PubMed/NCBI
|
|
8
|
Suga T, Yamaguchi H, Ogura J, Shoji S,
Maekawa M and Mano N: Altered bile acid composition and disposition
in a mouse model of non-alcoholic steatohepatitis. Toxicol Appl
Pharmacol. 379:1146642019. View Article : Google Scholar : PubMed/NCBI
|
|
9
|
Matsumoto M, Hada N, Sakamaki Y, Uno A,
Shiga T, Tanaka C, Ito T, Katsume A and Sudoh M: An improved mouse
model that rapidly develops fibrosis in non-alcoholic
steatohepatitis. Int J Exp Pathol. 94:93–103. 2013. View Article : Google Scholar : PubMed/NCBI
|
|
10
|
Xu J, Li G, Wang P, Velazquez H, Yao X, Li
Y, Wu Y, Peixoto A, Crowley S and Desir GV: Renalase is a novel,
soluble monoamine oxidase that regulates cardiac function and blood
pressure. J Clin Invest. 115:1275–1280. 2005. View Article : Google Scholar : PubMed/NCBI
|
|
11
|
Wu Y, Xu J, Velazquez H, Wang P, Li G, Liu
D, Sampaio-Maia B, Quelhas-Santos J, Russell K, Russell R, et al:
Renalase deficiency aggravates ischemic myocardial damage. Kidney
Int. 79:853–860. 2011. View Article : Google Scholar : PubMed/NCBI
|
|
12
|
Wang F, Huang B, Li J, Liu L and Wang N:
Renalase might be associated with hypertension and insulin
resistance in type 2 diabetes. Ren Fail. 36:552–556. 2014.
View Article : Google Scholar : PubMed/NCBI
|
|
13
|
Wang L, Velazquez H, Chang J, Safirstein R
and Desir GV: Identification of a receptor for extracellular
renalase. PLoS One. 10:e01229322015. View Article : Google Scholar : PubMed/NCBI
|
|
14
|
Wang Y, Safirstein R, Velazquez H, Guo XJ,
Hollander L, Chang J, Chen TM, Mu JJ and Desir GV: Extracellular
renalase protects cells and organs by outside-in signalling. J Cell
Mol Med. 21:1260–1265. 2017. View Article : Google Scholar : PubMed/NCBI
|
|
15
|
Wu Y, Wang L, Deng D, Zhang Q and Liu W:
Renalase protects against renal fibrosis by inhibiting the
activation of the ERK signaling pathways. Int J Mol Sci. 18:1–25.
2017.
|
|
16
|
Li H, Guo J, Liu H, Niu Y, Wang L, Huang K
and Wang J: Renalase as a novel biomarker for evaluating the
severity of hepatic ischemia-reperfusion injury. Oxid Med Cell
Longev. 2016:31785622016. View Article : Google Scholar : PubMed/NCBI
|
|
17
|
Zhang T, Gu J, Guo J, Chen K, Li H and
Wang J: Renalase attenuates mouse fatty liver ischemia/reperfusion
injury through mitigating oxidative stress and mitochondrial damage
via activating SIRT1. Oxid Med Cell Longev. 2019:75342852019.
View Article : Google Scholar : PubMed/NCBI
|
|
18
|
Nagate T, Chino T, Nishiyama C, Okuhara D,
Tahara T, Maruyama Y, Kasahara H, Takashima K, Kobayashi S,
Motokawa Y, et al: Diluted isoflurane as a suitable alternative for
diethyl ether for rat anaesthesia in regular toxicology studies. J
Vet Med Sci. 69:1137–1143. 2007. View Article : Google Scholar : PubMed/NCBI
|
|
19
|
Livak KJ and Schmittgen TD: Analysis of
relative gene expression data using real-time quantitative PCR and
the 2-ΔΔCT method. Methods. 2001.25((4)): 402–408,
doi:10.1006/meth.2001.1262. View Article : Google Scholar : PubMed/NCBI
|
|
20
|
Kikugawa K, Yasuhara Y, Ando K, Koyama K,
Hiramoto K and Suzuki M: Effect of supplementation of n-3
polyunsaturated fatty acids on oxidative stress-induced DNA damage
of rat hepatocytes. Biol Pharm Bull. 26:1239–1244. 2003. View Article : Google Scholar : PubMed/NCBI
|
|
21
|
Zhao B, Zhao Q, Li J, Xing T, Wang F and
Wang N: Renalase protects against contrast-induced nephropathy in
Sprague-Dawley rats. PLoS One. 10:e01165832015. View Article : Google Scholar : PubMed/NCBI
|
|
22
|
Ghani MA, Barril C, Bedgood DR Jr and
Prenzler PD: Measurement of antioxidant activity with the
thiobarbituric acid reactive substances assay. Food Chem.
230:195–207. 2017. View Article : Google Scholar : PubMed/NCBI
|
|
23
|
Palladini G, Di Pasqua LG, Berardo C,
Siciliano V, Richelmi P, Perlini S, Ferrigno A and Vairetti M:
Animal models of steatosis (NAFLD) and steatohepatitis (NASH)
exhibit hepatic lobe-specific gelatinases activity and oxidative
stress. Can J Gastroenterol Hepatol. 2019:54134612019. View Article : Google Scholar : PubMed/NCBI
|
|
24
|
Horas H, Nababan S, Nishiumi S, Kawano Y,
Kobayashi T, Yoshida M and Azuma T and Azuma T: Adrenic acid as an
inflammation enhancer in non-alcoholic fatty liver disease. Arch
Biochem Biophys. 623-624:64–75. 2017. View Article : Google Scholar : PubMed/NCBI
|
|
25
|
Chen Y, Dong H, Thompson DC, Shertzer HG,
Nebert DW and Vasiliou V: Glutathione defense mechanism in liver
injury: Insights from animal models. Food Chem Toxicol. 60:38–44.
2013. View Article : Google Scholar : PubMed/NCBI
|
|
26
|
Cha JY, Kim DH and Chun KH: The role of
hepatic macrophages in nonalcoholic fatty liver disease and
nonalcoholic steatohepatitis. Lab Anim Res. 34:133–139. 2018.
View Article : Google Scholar : PubMed/NCBI
|
|
27
|
Wu Y, Wang L, Wang X, Wang Y, Zhang Q and
Liu W: Renalase contributes to protection against renal fibrosis
via inhibiting oxidative stress in rats. Int Urol Nephrol.
50:1347–1354. 2018. View Article : Google Scholar : PubMed/NCBI
|
|
28
|
Huang Z, Li Q, Yuan Y, Zhang C, Wu L, Liu
X, Cao W, Guo H, Duan S, Xu X, et al: Renalase attenuates
mitochondrial fission in cisplatin-induced acute kidney injury via
modulating sirtuin-3. Life Sci. 222:78–87. 2019. View Article : Google Scholar : PubMed/NCBI
|
|
29
|
Cai CX, Buddha H, Castelino-Prabhu S,
Zhang Z, Britton RS, Bacon BR and Neuschwander-Tetri BA: Activation
of insulin-PI3K/Akt-p70S6K pathway in hepatic stellate cells
contributes to fibrosis in nonalcoholic steatohepatitis. Dig Dis
Sci. 62:968–978. 2017. View Article : Google Scholar : PubMed/NCBI
|
|
30
|
Xu F, Liu C, Zhou D and Zhang L:
TGF-β/SMAD Pathway and Its Regulation in Hepatic Fibrosis. J
Histochem Cytochem. 64:157–167. 2016. View Article : Google Scholar : PubMed/NCBI
|
|
31
|
Ma L, Li H, Zhang S, Xiong X, Chen K,
Jiang P, Jiang K and Deng G: Emodin ameliorates renal fibrosis in
rats via TGF-β1/Smad signaling pathway and function study of Smurf
2. Int Urol Nephrol. 50:373–382. 2018. View Article : Google Scholar : PubMed/NCBI
|
|
32
|
Lv Y, Bing Q, Lv Z, Xue J, Li S, Han B,
Yang Q, Wang X and Zhang Z: Imidacloprid-induced liver fibrosis in
quails via activation of the TGF-β1/Smad pathway. Sci Total
Environ. 705:1359152020. View Article : Google Scholar : PubMed/NCBI
|