Introduction
Thyroid carcinoma is the most prevalent type of neck
carcinoma in the world and the various forms of thyroid carcinoma
include papillary thyroid cancer (PTC), medullary thyroid cancer
and anaplastic thyroid cancer (1,2). Among
them, PTC is the commonest type of thyroid carcinoma and it
accounts for ~90% of thyroid carcinoma cases (3). According to the National Cancer
Institute, the most frequently used PTC treatments include surgery
(thyroidectomy or lobectomy), radioactive iodine therapy and
hormone therapy to prevent the body from making thyroid-stimulating
hormone (4). Although patients with
PTC have impressive survival outcomes, some patients with PTC
remain vulnerable to the risk of recurrence due to the aggressive
nature of PTC (5,6). Therefore, clinicians and researchers
still need to investigate the molecular mechanisms of this type of
cancer to improve the recurrence-free survival rate.
Endothelin (EDN) 3 is a protein that belongs to the
EDN family, which consists of vasoactive peptides (EDN1, EDN2 and
EDN3) that are widely expressed in the brain, pancreas, colon,
small intestine and skeletal muscle of humans (7,8). A
number of studies have demonstrated that this protein, found in
humans, participates in cell proliferation, migration and
differentiation by interacting with the cell surface receptors
[including EDN receptor A (EDNRA) and EDN receptor B (EDNRB)]
through an autocrine mechanism (9–13).
EDN1 can directly affect tumor cells by stimulating cell
proliferation, migration and invasion and inhibiting cell apoptosis
(14,15). The overexpression of EDN1 in PTC has
also been reported (16–18). Unlike EDN1, EDN3 has been only
recently been found to be frequently downregulated or silenced in
human tumors (19,20). Studies have documented the ability
of EDN3 to promote hypermethylation in breast cancer (21) and colon carcinoma (20). EDN3 knockdown has also been reported
to impair tumor-sphere formation, cell spreading and cell migration
of glioblastoma stem cells (22).
Although Qiu et al (23)
found in their bioinformatical analysis that the downregulation of
EDN3 was associated with the PTC stage, the exact role of EDN3 in
PTC cells remains to be elucidated. Using bioinformatics analysis,
the present study identified EDN3 as a potentially critical
participant in PTC in terms of regulating cell development,
migration and proliferation.
In recent years, miRs have been reported to be
critical to the development of human cancers (24–28).
By binding to the 3′ untranslated region (UTR) of the target mRNA,
these small non-coding RNA molecules can impede mRNA transcription
(29–31). Previous studies have documented that
miR-27a-3p, a member of the miR-27a family, can suppress or enhance
cancer development depending on the types of human cancers. While
miR-27a-3p acts as a tumor suppressor in non-small cell lung
carcinoma (32) and hepatocellular
carcinoma (33), it functions as a
tumor promoter in gastric cancer (34), colorectal cancer (35), ovarian carcinoma (36) and esophageal carcinoma (37). In addition, miR-27a is demonstrated
to upregulate and promote cell migration in thyroid cancer
(38).
The object of the present study was to identify the
key genes and miRs in PTC cells using bioinformatics methods and to
explore the influence of the key genes and miRs on PTC cells using
in vitro cytological techniques. It was hypothesized that
EDN3 and miR-27a-3p could be promising biomarkers for PTC
treatments.
Materials and methods
Microarray data analysis
For analysis, two mRNA expression profiles, GSE33630
and GSE3678, were downloaded from the NCBI GEO database (https://www.ncbi.nlm.nih.gov/geo/). GSE33630
consisted of 45 normal thyroid tissue samples and 49 PTC tissue
samples, while GSE3678 comprised 7 normal thyroid tissue samples
and 7 PTC tissue samples. The downregulated differentially
expressed genes (DEGs) were identified using the R software version
3.2.3 (https://www.r-project.org/) and limma R
package version 3.26.8 with adjusted P<0.05 and log fold change
(logFC) <-1. The downregulated DEGs were then uploaded to the
STRING database version 10.5 (https://string-db.org/) to perform Gene Ontology and
Kyoto Encyclopedia of Genes and Genomes enrichment analysis. To
confirm the key miRs, GSE113629 was downloaded from the NCBI GEO
database, including 5 normal thyroid tissue samples and 5 PTC
tissue samples. The significantly overexpressed miRs were
identified using the limma R package with adjusted P<0.05 and
logFC >1. TarBase version 7.0 (http://carolina.imis.athena-innovation.gr/diana_tools/web/index.php?r=tarbasev8/index)
and TargetScan version 7.1 (http://www.targetscan.org/vert_71/) were the online
tools used to predict the binding site between miR and mRNA
3′UTR.
The collection of clinical
specimens
A total of 30 PTC tumor tissues and 30 non-tumor
tissues were collected from Wuhan Puren Hospital (China). The
present study was approved by the Ethics Committee of Wuhan Puren
Hospital (approval no. A01401-LL201912-002). All clinical specimens
were stored in liquid nitrogen until experiments. The clinical
characteristics of patients with PTC are demonstrated in Table I.
 | Table I.Correlation of the expression of
miR-27a-3p and EDN3 with clinicopathologic features. |
Table I.
Correlation of the expression of
miR-27a-3p and EDN3 with clinicopathologic features.
|
| miR-27a-3p
expression |
| EDN3
expression |
|
|---|
|
|
|
|
|
|
|---|
|
| High | Low |
P-valuea | High | Low |
P-valuea |
|---|
| Age (years) |
|
| 0.264 |
|
| 0.710 |
|
>45 | 7 | 11 |
| 8 | 10 |
|
|
≤45 | 8 | 4 |
| 7 | 5 |
|
| Sex |
|
| 0.450 |
|
| 1 |
|
Male | 7 | 4 |
| 5 | 6 |
|
|
Female | 8 | 11 |
| 10 | 9 |
|
| Tumor diameter
(cm) |
|
| 0.107 |
|
| 0.014 |
|
>2 | 7 | 2 |
| 1 | 8 |
|
| ≤2 | 8 | 13 |
| 14 | 7 |
|
| TNM stage |
|
| 0.027 |
|
| 0.003 |
|
I+II | 4 | 11 |
| 12 | 3 |
|
|
II+IV | 11 | 4 |
| 3 | 12 |
|
Cell culture
TPC-1, GLAG-66 cell lines (human PTC cell lines) and
Nthy-ori 3-1 cell line (human thyroid cell line transformed by
simian virus 40) were provided by the Chinese Academic of Sciences
(China) and were cultured in DMEM media (HyClone; Cytiva). Another
human PTC cell line (CUTC5), obtained from the University of
Colorado Cancer Center Tissue Culture Shared Resource, was kept in
RPMI 1640 media (HyClone; Cytiva). The DMEM and RPMI 1640 media
were supplemented with 2 mM L-glutamine (Gibco; Thermo Fisher
Scientific, Inc.) and 10% fetal bovine serum (FBS, Gibco; Thermo
Fisher Scientific, Inc.). All the cells were cultured at 37°C in an
atmosphere containing 5% CO2. The fresh medium was
replaced every 24 h during the cell culture.
mRNA preparation and reverse
transcription-quantitative (RT-q) PCR
The total RNAs from PTC tissues, non-tumor tissues
and Nthy-ori 3-1, TPC-1, CUTC5 and GLAG-66 cells (1×10⁶
cells/ml) were extracted using TRIzol® (Thermo Fisher
Scientific, Inc.) according to the manufacturer's protocols.
Chloroform was then added to prepare the samples for centrifugation
at 1,2000 × g (15 min, 4°C). Subsequently, 500 µl 75% ethanol was
added to the supernatant to further purify all the RNAs. Following
purification, the RNA purity and concentration were assessed by
determining the spectrophotometric absorbance of the samples at
230, 260 and 280 nm as well as the ratios of A260:A280 and
A260:A230. The PrimeScript RT Reagent kit and SYBR Premix Ex Taq II
kit, obtained from Takara Bio, Inc., were used to synthesize cDNA
(20 µl reaction volume; thermocycling: 37°C for 15 min followed by
85°C for 5 sec) and perform fluorescence RT-qPCR, respectively,
according to the manufacturer's protocols. The Fluorescent
Quantitative PCR System (Applied Biosystems; Thermo Fisher
Scientific, Inc.) was employed to measure gene expression with the
following reaction conditions: 95°C for 30 sec, 40 cycles at 95°C
for 3 sec followed by 60°C for 30 sec. All the primers for RT-qPCR
were synthesized by and purchased from Takara Bio, Inc. The primer
sequences used in the present study are presented in Table II. The expression of mRNA was
normalized with β-actin miR expression and the expression of miR
was normalized with U6 expression. The experiments were repeated
three times. The 2−ΔΔCq method was used to calculate the
relative mRNA expression (39).
| Table II.The primer sequences for reverse
transcription-quantitative PCR. |
Table II.
The primer sequences for reverse
transcription-quantitative PCR.
| Gene | Primer sequences
(5′→3′) |
|---|
| miR-27a-3p | Forward:
CGCGTTCACAGTGGCTAAGT |
|
| Reverse:
GTGCAGGGTCCGAGGTATTC |
| U6 | Forward:
CTCGCTTCGGCAGCACA |
|
| Reverse:
AACGCTTCACGAATTTGCGT |
| EDN3 | Forward:
GCGCTCTGAAAGTTCGTGAC |
|
| Reverse:
ACAGCTTTCGAGTCCTGTCG |
| CXCL12 | Forward:
AGAGCCAACGTCAAGCATCT |
|
| Reverse:
TAATTTCGGGTCAATGCACA |
| β-actin | Forward:
GGAGATTACTGCCCTGGCTCCTAGC |
|
| Reverse:
GGCCGGACTCATCGTACTCCTGCTT |
Western blotting
The total protein from the pretreated cells was
lysed in RIPA reagent (Beyotime Institute of Biotechnology) with 10
mM Tris-HCl, 1% NP-40 and protease inhibitors. The supernatant
containing the proteins was centrifuged for 20 min at 12,000 × g at
4°C. The BCA Protein Assay kit (Beyotime Institute of
Biotechnology) was applied to detect the concentration of isolated
protein. All the proteins (20 µg) were isolated with 12% SDS-PAGE.
The solution was transferred onto PVDF membranes (Membrane
Solutions). Following blocking with 5% non-fat milk at 25°C for 2
h, the membranes were incubated with the primary antibodies against
EDN3 (1:1,000; cat. no. ab96709; Abcam) and β-actin (1:1,000; cat.
no. ab8224; Abcam) overnight at 4°C. The following day, the
membranes were incubated with corresponding secondary antibodies
(1:5,000; Rabbit antibody cat. no. ab6721; Mouse antibody cat. no.
ab6789; Abcam) for 3 h. The Enhanced Chemiluminescence Reagent
(Thermo Fisher Scientific, Inc.) was used to enhance the signals of
protein bands. The densitometry of bands was analyzed by ImageJ
version 1.8.0 (National Institutes of Health).
Plasmid construction and cell
transfection
The EDN3 overexpression (EDN3-OE) plasmid was
constructed by cloning the full-length of EDN3 into the pcDNA3.1
vector (Shanghai GeneChem Co., Ltd.). HinDI and BamHI
restriction sites were used. Briefly, the primers used to get the
cloned portion of EDN3 were forward (5′-TCTAGGTTCATGGAGCCGGG-3′)
and reverse (5′-CACCGTCTGTTCGGGAGT-3′). The product was subjected
to double digestion with HinDI and BamHI enzymes
(Takara Bio, Inc.). The digested DNA products were ligated into a
5.4-kb fragment of pcDNA3.1 (Shanghai GeneChem Co., Ltd.) that was
digested with the same enzymes. The miR-27a-3p mimic
(5′-UUCACAGUGGCUAAGUUCCGC-3′) and non-targeting sequence (negative
control, NC) plasmids were provided by Shanghai GenePharma Co.,
Ltd. 50 nM EDN3-overexpression (OE) and/or miR-27a-3p mimic was
transfected into the cells for 48 h using Lipofectamine®
3000 Transfection Reagent (cat. no. L3000015; Invitrogen; Thermo
Fisher Scientific, Inc.). The NC was transfected into the cells as
the NC group. The transfection efficiency of EDN3-OE and/or
miR-27a-3p mimic was evaluated using RT-qPCR. All subsequent
experimentation was performed following transfection for 48 h.
Cell viability assessment
The cell viability of transfected PTC cells was
detected using the Cell Counting Kit-8 (CCK-8) reagent (Dojindo
Molecular Technologies, Inc.). Then, 10,000 cells/well cells
undergoing transfection were seeded in the 96-well plate and
cultured for 0, 24, 48 and 72 h. For each period, 10 µl/well CCK-8
reagents were added before the cells were incubated for 2 h. The
optical density (OD) was detected at 450 nm wavelength using a
microplate reader (Dynex Technologies).
BrdU cell proliferation assay
The assay was performed with the BrdU Cell
Proliferation ELISA kit (cat. no. ab126556, Abcam). Briefly, the
TPC-1 and GLAG-66 cells were seeded in 96-well plates and
transfected with EDN3-OE, miR-27a-3p mimic or NC plasmids. After 72
h, the cells were treated with the BrdU Cell Proliferation ELISA
kit according to the manufacturer's protocol. Then the OD value was
detected at 450 nm using a microplate reader (Dynex
Technologies).
Caspase-3 activity assessment
Since caspase-3 activity is enhanced during cell
apoptosis, the cell apoptosis was determined using the caspase-3
Assay kit (cat. no. ab39401, Abcam). After transfecting the cells
for 48 h, 1.5×10⁶ cells were collected and re-suspended
in 50 µl chilled cell lysis buffer. The supernatant was then
collected. The protein concentration was measured and adjusted to
1–4 µg/µl. Next, the cell lysate was added to the 50 µl reaction
buffer mixed with 10 mM dithiothreitol and 50 µl DEVD-p-NA
substrate. The mixture was subsequently incubated for 2 h. After
the cell incubation process, the absorbance was measured at 405 nm
using a microplate reader (Dynex Technologies).
Apoptosis analysis
The transformed cells were re-suspended at a density
of 1×10⁶ cells/ml. The apoptosis was detected using the
Annexin V-APC Apoptosis Detection kit (eBioscience; Thermo Fisher
Scientific, Inc.) according to the manufacturer's protocol. The
detection and quantification of apoptotic cells were performed
using a BD FACSCalibur flow cytometer (Becton, Dickinson and
Company). The data were analyzed with FlowJo software version 7.6.1
(FlowJo LLC). The untreated and unstained cell lines served as the
basis for gating. Finally, the samples were stained with sodium
propionate iodide (50 µg⁄ml) solution in calcium buffer solution.
The apoptotic rate was determined as the percentage of early + late
apoptotic cells.
Cell migration detection
Wound healing assay was performed to evaluate cell
migration. Transfected PTC cells (1×10⁵) were cultured
in the six-well plate in serum-containing medium until the cell
density reached ~80% confluence. Next, the serum medium was
replaced with freshly new serum-free medium for 24 h. A 2 mm width
scratch was made with 200 µl sterile plastic pipette tips on every
cell monolayer. The cell debris was removed using PBS. The cell
monolayers, which showed cells migrating into the wounds from five
fields, were imaged using a light microscope (magnification, ×100)
at 0 and 24 h. The migration rate was calculated as follows:
migration rate=1-wound width at
indicating time pointwound width at 0 h
Transwell invasion assay
The invasiveness of TPC-1 and GLAG-66 cells was
tested with 24-well Transwell cell culture chambers (8.0 µm pore
size, polycarbonate membrane, Corning, Inc.). Subsequently,
1×10⁵ cells were added to the upper chamber in 100 µl
serum-free medium. The lower chamber was filled with 0.6 ml medium
containing 10% FBS. Following incubation at 37°C in an atmosphere
containing 5% CO2 for 20 h, the cells on the upper
surface of the filter were removed by swabbing. The filter was
fixed in 4% paraformaldehyde and stained with crystal violet at
room temperature for 5 min. Under the microscope (magnification,
×100), five visual fields were randomly selected to count the
stained cells using ImageJ version 1.8.0 (National Institutes of
Health).
Luciferase reporter assay
The pGL4 luciferase reporter vectors inserted by
wild-type EDN3 3′UTR (EDN3-WT) or mutated EDN3 3′UTR plasmids
(EDN3-MUT) were purchased from Shanghai GenePharma Co., Ltd. The
pGL4-EDN3-WT or pGL4-EDN3-MUT were co-transfected into TPC-1 and
GLAG-66 cells together with miR-27a-3p mimic or NC. After 48 h, the
luciferase activity was detected with the Pierce Renilla-Firefly
Luciferase Dual Assay kit (cat. no. 16185; Thermo Fisher
Scientific, Inc.). The relative luciferase activity was normalized
to Renilla luciferase activity.
Statistical analysis
All experimental data were presented in the form of
mean ± standard deviation from three independent experiments.
GraphPad Prism 6 (GraphPad Software, Inc.) was utilized for
statistical analysis. Student's t-test was used to compare the
statistical difference between two groups, while one-way ANOVA with
Dunnett's or Tukey's multiple comparisons test was employed to
compare the statistical differences among multiple groups. Paired
t-test was used to compare the gene expression in clinical tissues.
For the analysis of the association between clinical
characteristics and gene expression, Fisher's exact test was used.
For the analysis of the correlation between gene expression levels,
Spearman's analysis method was used. P<0.05 was considered to
indicate a statistically significant difference.
Results
EDN3 and miR-27a-3p, the potential key
regulators in PTC
A gene microarray analysis of GSE33630 was carried
out to identify 565 DEGs associated with PTC, with adjusted
P<0.05 and logFC <-1. To center on the more significant DEGs,
another gene microarray analysis (GSE3678) was conducted and 364
DEGs were identified. A total of 257 DEGs overlapped (Fig. 1A). The 257 genes could potentially
participate in PTC progression. After uploading the 257 DEGs to the
STRING database, C-X-C Motif Chemokine Ligand 12 (CXCL12) and EDN3
were discovered to be the interacting genes involved in cell
development, cell migration and cell proliferation. This suggested
that the CXCL12 and EDN3 might be the crucial regulators in PTC
(Fig. 1B). The expression of these
two genes in the collected tissue samples was detected using
RT-qPCR. It was found that, compared with the expression in the
normal tissue samples, the expression of EDN3 mRNA significantly
declined, while no significantly difference was observed in the
expression of CXCL12 mRNA (Fig.
1C). Based on this result, EDN3 was identified as the gene of
interest in PTC. Subsequently, to identify a regulator miRNA of
EDN3, TarBase and TargetScan databases were used to predict the
potential complementary miRs of EDN3. Respectively, 5 and 490 miRs
were predicted by the two algorithms. In addition, a total of 2,314
over-expressed miRs in PTC was identified using limma R package
analysis of a miR microarray (GSE113629). It was discovered that
three miRs (hsa-miR-579-3p, hsa-miR-769-3p and hsa-miR-27a-3p) were
the overlap of the three datasets. (Fig. 1D). A previous study reported that
miR-27a can upregulate and promote the cancer phenotypes of PTC
(37). Nonetheless, its experiments
were only conducted in the IHH4 cell line; to expand on the role of
miR-27a-3p, it was hypothesized that the relevance of the results
should be confirmed with another PTC cell line. Moreover, the
function of miR-27a-3p by regulating its downstream target in PTC
has never been reported before, to the best of the authors'
knowledge. Hence, EDN3 and miR-27a-3p were chosen as the key mRNA
and miRNA to be further investigated in PTC.
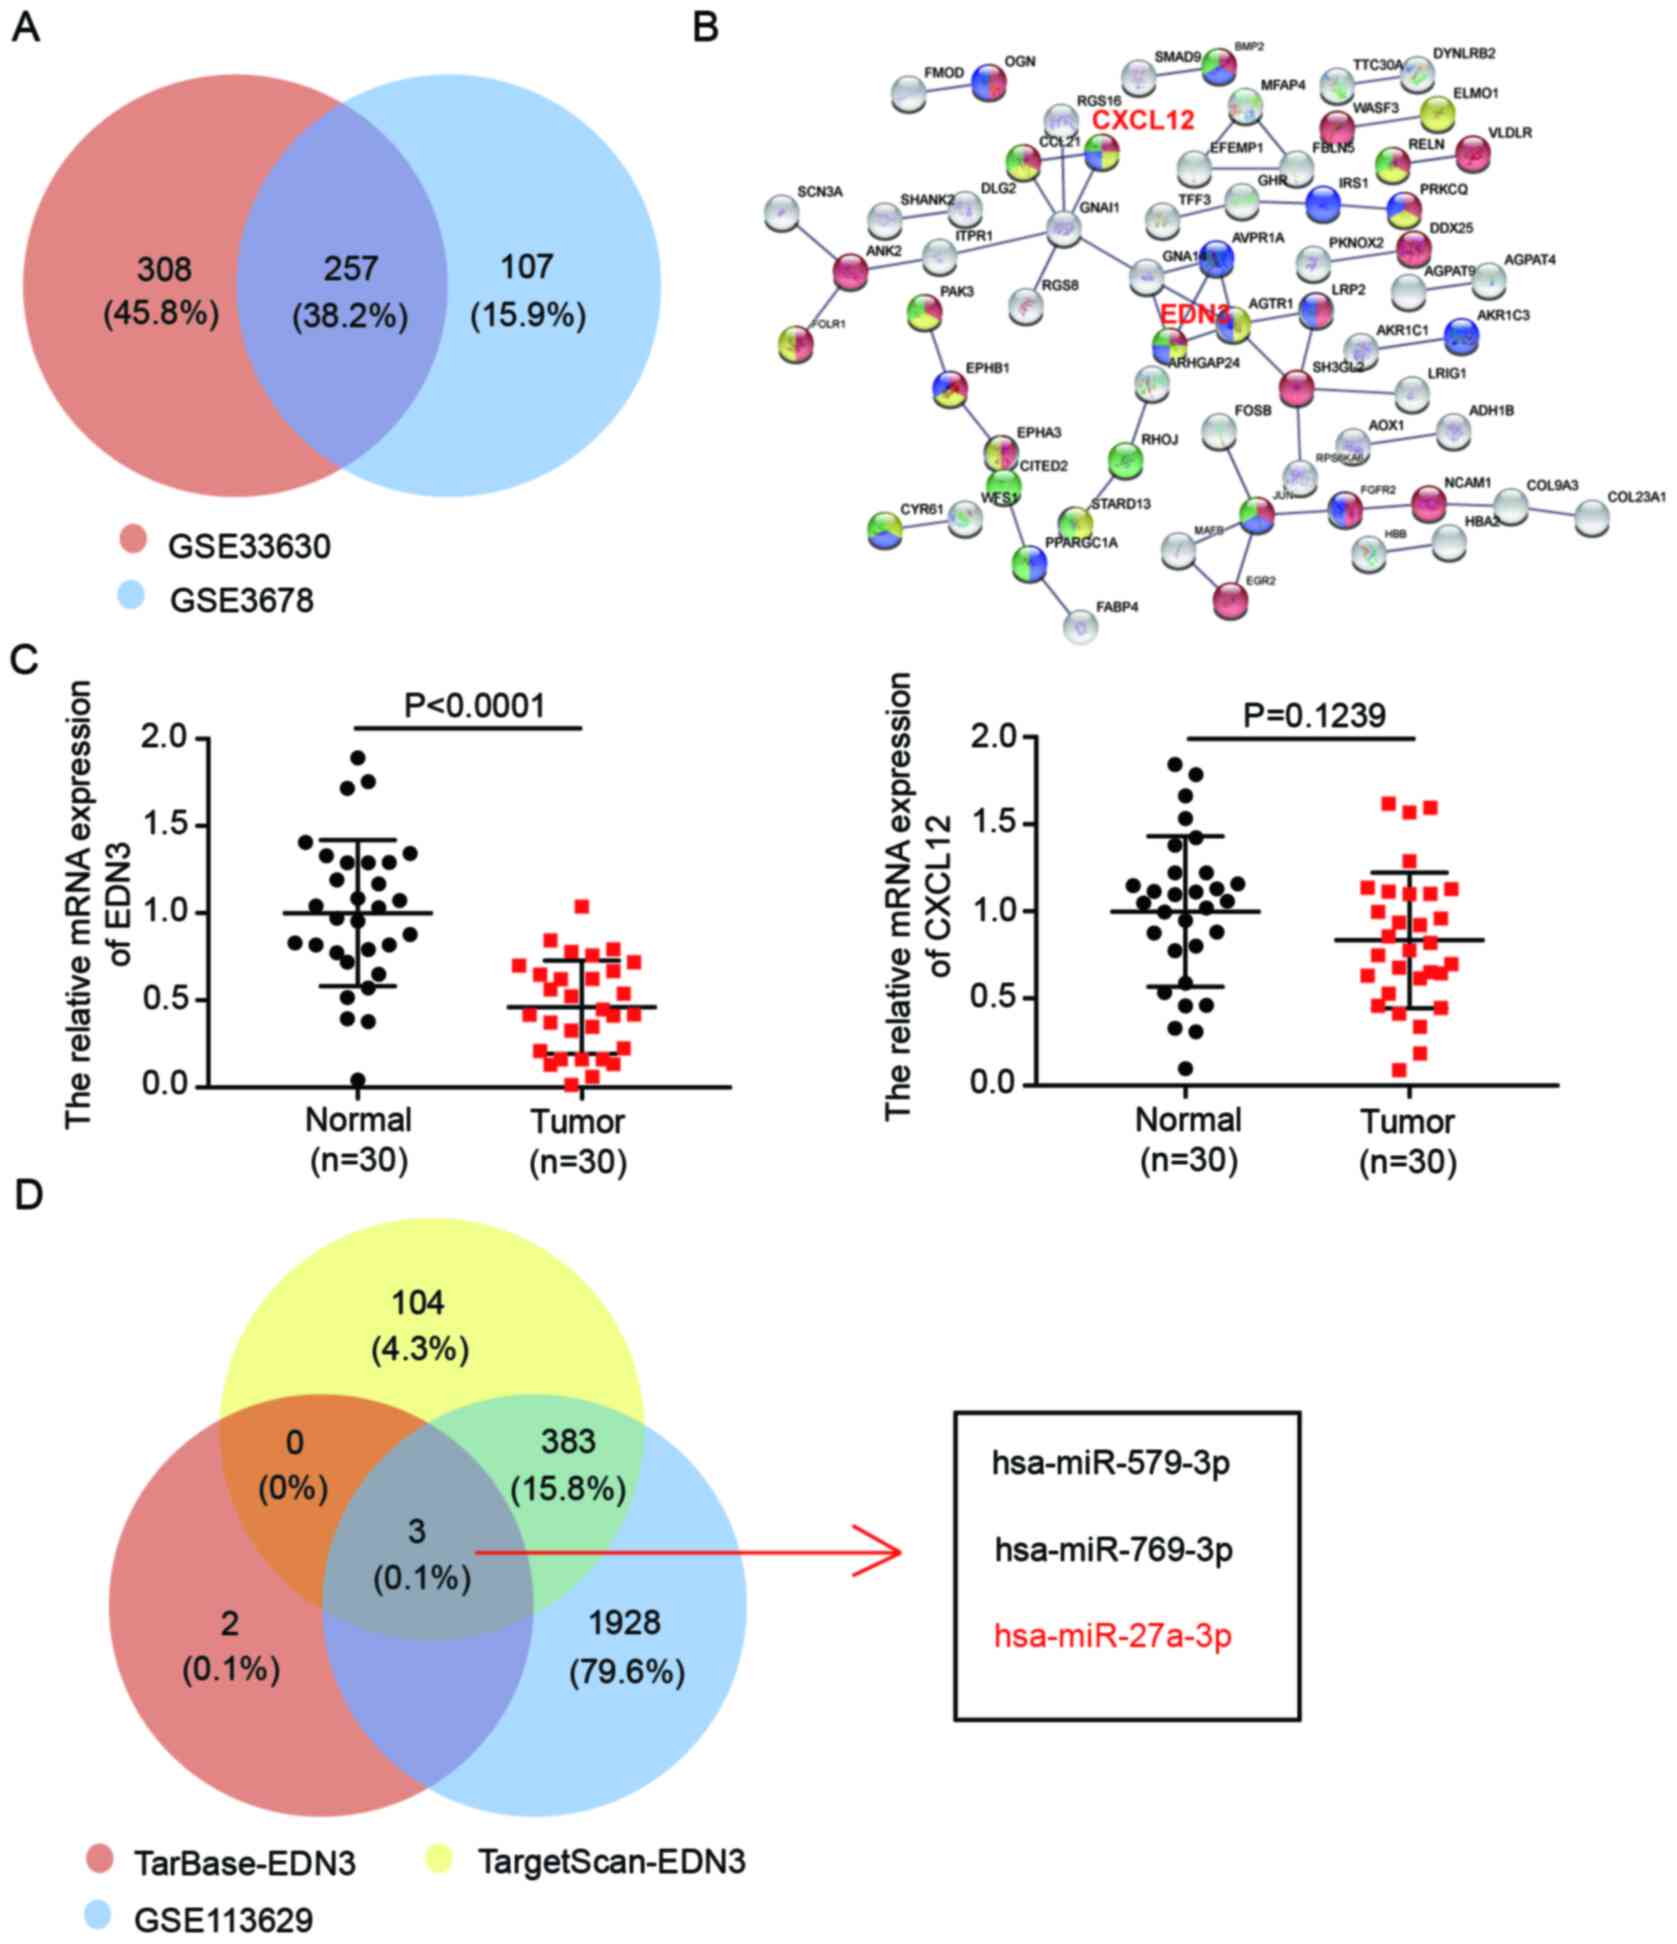 | Figure 1.The key mRNAs and miRs associated
with PTC. (A) The 257 DEGs were overlapped from two mRNA microarray
(GSE33630 and GSE3678) analysis results. The DEGs were screened out
using limma R package with adjusted P-value <0.05 and logFC
<-1. (B) CXCL12 and EDN3 were selected as participating in cell
development, cell migration and cell proliferation by STRING
database analysis of the 214 DEGs. The interaction score was set to
highest confidence 0.900. (C) The expression of EDN3 and CXCL12
mRNA was detected in tissues specimens by reverse
transcription-quantitative PCR. n=30, Student's t-test. (D)
Hsa-miR-579-3p, hsa-miR-769-3p and hsa-miR-27a-3p were overlapped
from TarBase predicted targets of EDN3, TargetScan predicted
targets of EDN3 and a miRNA microarray analysis result.
TarBase-EDN3, the miRs binding to the END3 3′UTR were predicted by
TarBase. TargetScan-EDN3, the miRs binding to the END3 3′UTR were
predicted by TargetScan. GSE113629 miR expression microarray. miR,
microRNA; PTC, papillary thyroid cancer; DEGs, differentially
expressed genes; CXCL12, Chemokine Ligand 12; EDN, endothelin; UTR,
untranslated region; has, human. |
The expression of EDN3 decreases in
PTC cells
After confirming the key gene in PTC cells, the
clinicopathologic association of miR-27a-3p and EDN3 in PTC cells
was analyzed. miR-27a-3p or EDN3 was divided into the miR-27a-3p
high-expression group (n=15) and the low-expression group (n=15) or
the EDN3 high-expression group (n=15) and the low-expression Group
(n=15). The expression level of miR-27a-3p or EDN3 was found to be
associated with TNM stage, while only EDN3 expression was found to
be correlated with the tumor diameter (Table I). Next, the expression of the key
gene (END3) was explored in PTC cell lines (CUTC5, TPC-1, GLAG-66)
and the non-tumor thyroid cell line Nthy-ori 3-1. A significantly
low level of EDN3 mRNA was observed in all the PTC cell lines using
RT-qPCR, particularly in TPC-1 and GLAG-66 cells which exhibited
~80% decrease in EDN3 expression (Fig.
2A). Similar to the results of RT-qPCR, the results of western
blot analysis indicated that the protein level of EDN3 decreased in
PTC cell lines, particularly in TPC-1 and GLAG-66 which exhibited
the lowest expression (Fig. 2B and
C). Due to the significant downregulation of EDN3 in GLAG-66
and TPC-1 cells, these two PTC cell lines were selected to perform
the subsequent experiments. Cell line models with forced
overexpression of EDN3 and the corresponding NC model were obtained
by respectively transfecting the EDN3-OE and NC plasmids into TPC-1
and GLAG-66 cells. The RT-qPCR results demonstrated that EDN3
expression increased by ~2-fold in the two PTC cell lines, an
expression caused by EDN3-OE plasmids (Fig. 2D). EDN3 protein expression showed a
similar result with the expression of EDN3 mRNA; EDN3-OE plasmids
led to a >2-fold increase in EDN3 protein expression in these
two PTC cell lines (Fig. 2E and F).
The data suggested that EDN3 expression was downregulated in PTC
cells and that EDN3-OE plasmids transfection successfully resulted
in the upregulation of EDN3 in TPC-1 and GLAG-66 cells.
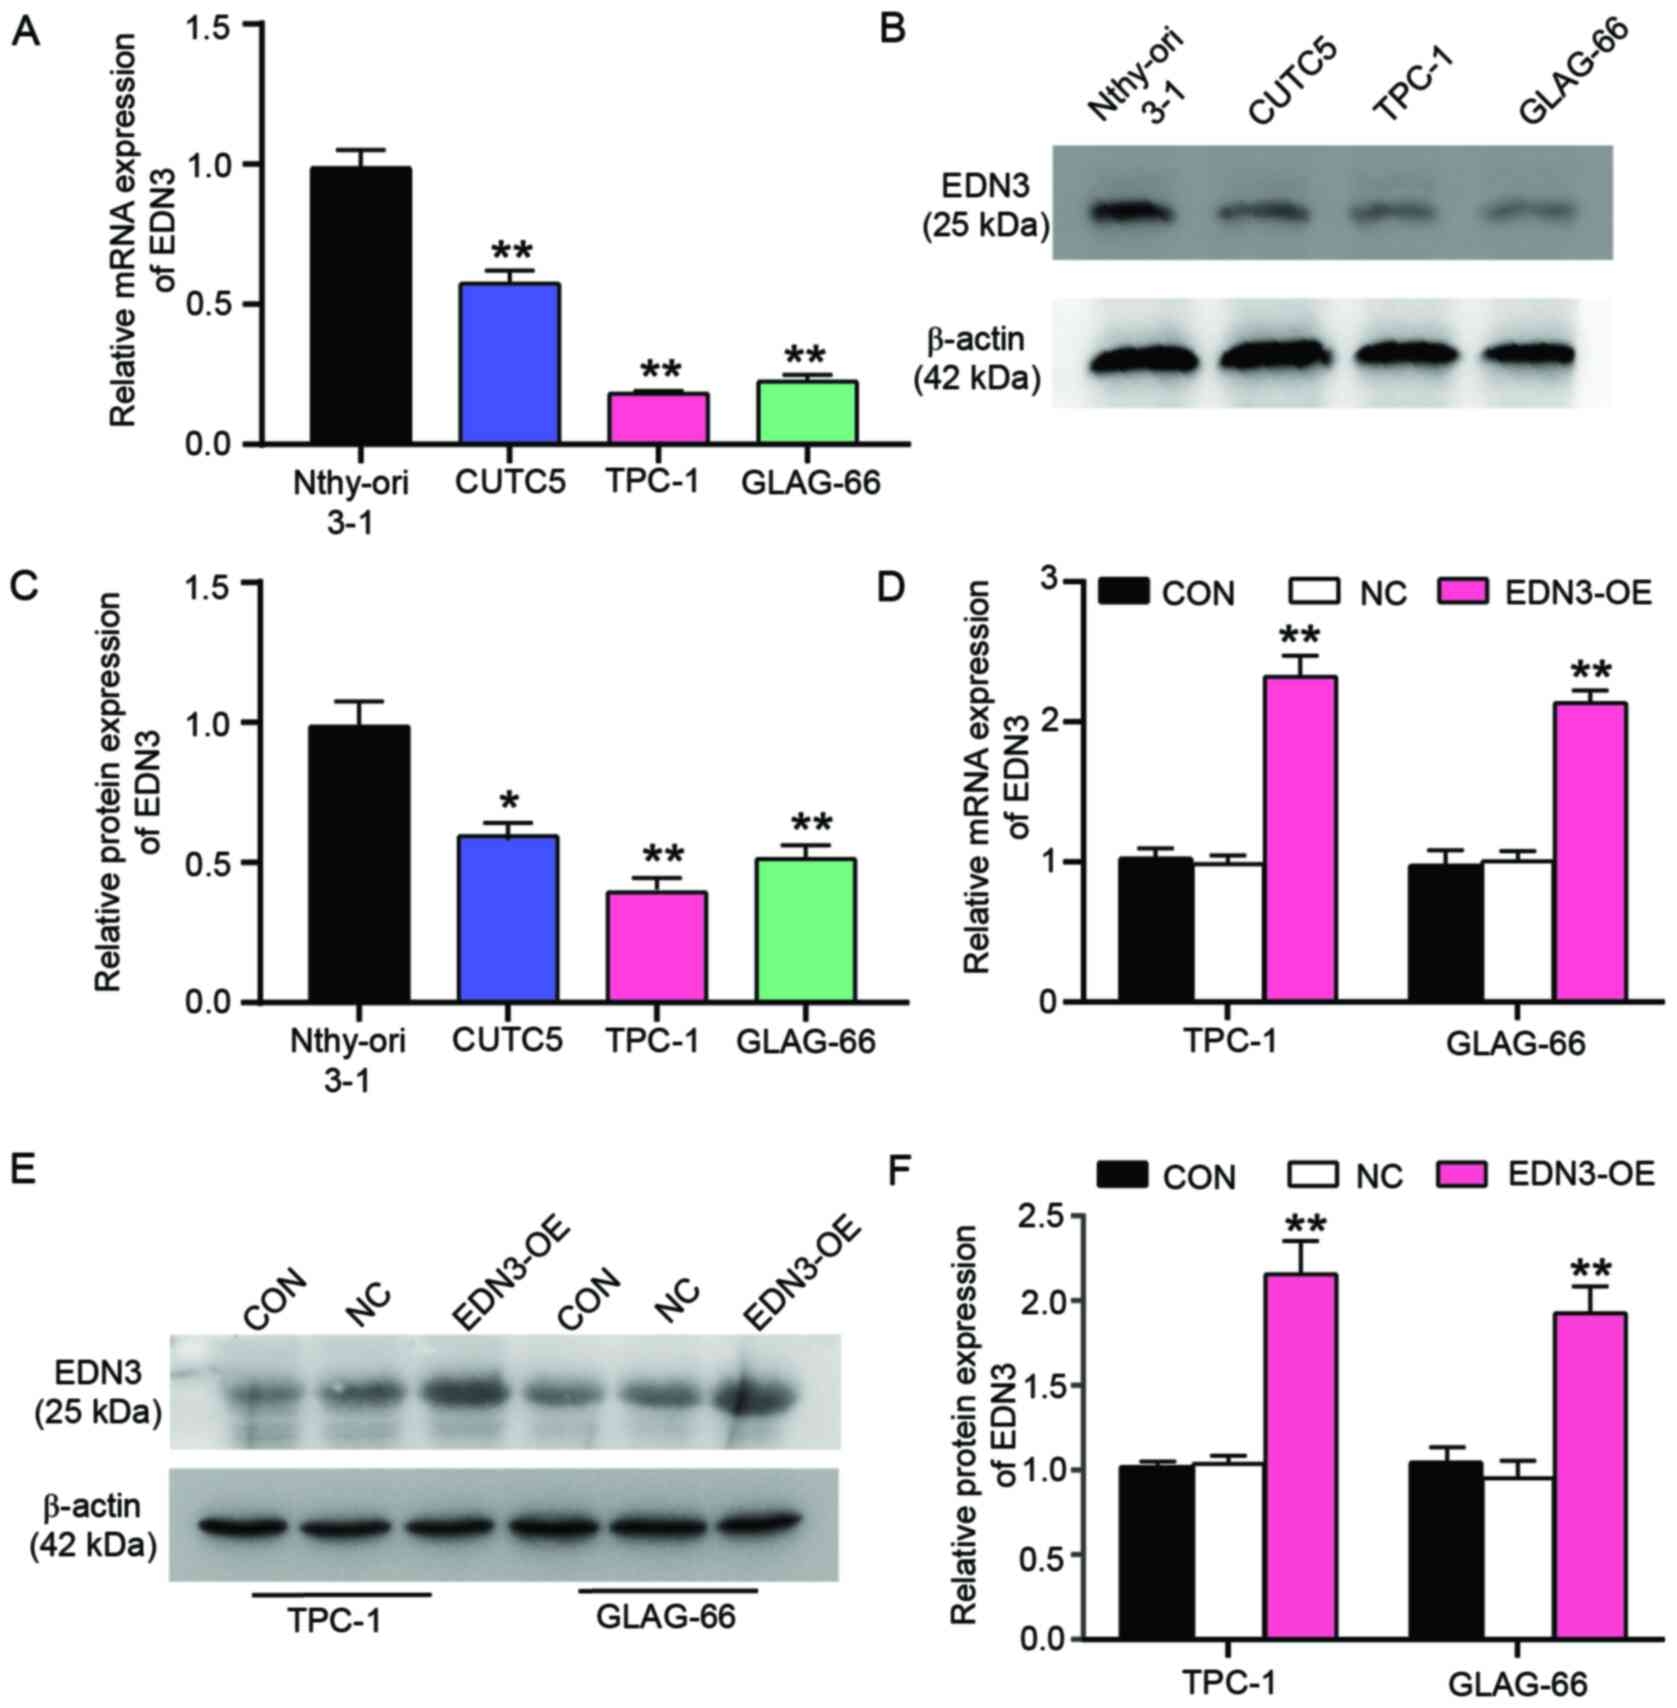 | Figure 2.The expression of EDN3 is
downregulated in the PTC cell lines. Nthy-ori 3-1 is a human
thyroid cell line transformed by simian virus 40. CUTC5, TPC-1 and
GLAG-66 cell lines were the PTC cell lines. (A) The relative
expression of EDN3 mRNA was detected in Nthy-ori 3-1, CUTC5, TPC-1
and GLAG-66 cell lines. **P<0.001 vs. Nthy-ori 3-1 cell line
using one-way ANOVA. (B and C) The protein level of EDN3 was
detected by western blotting in Nthy-ori 3-1, CUTC5, TPC-1 and
GLAG-66 cell lines. **P<0.001 vs. Nthy-ori 3-1 cell line using
one-way ANOVA. (D) The relative expression of EDN3 mRNA was
detected by reverse transcription-quantitative PCR in TPC-1 and
GLAG-66 cells following transfection. **P<0.001 vs. control
group. (E and F) The protein level of EDN3 was detected by western
blotting in TPC-1 and GLAG-66 cells following transfection.
**P<0.001 vs. control group. Each bar represented the standard
deviation of three independent experiments. EDN, endothelin; PTC,
papillary thyroid cancer; CON, TPC-1 and GLAG-66 cells cultured
without any transfection; NC, TPC-1 and GLAG-66 cells transfected
with negative control plasmids; EDN3-OE, TPC-1 and GLAG-66 cells
transfected with EDN3-OE plasmids. |
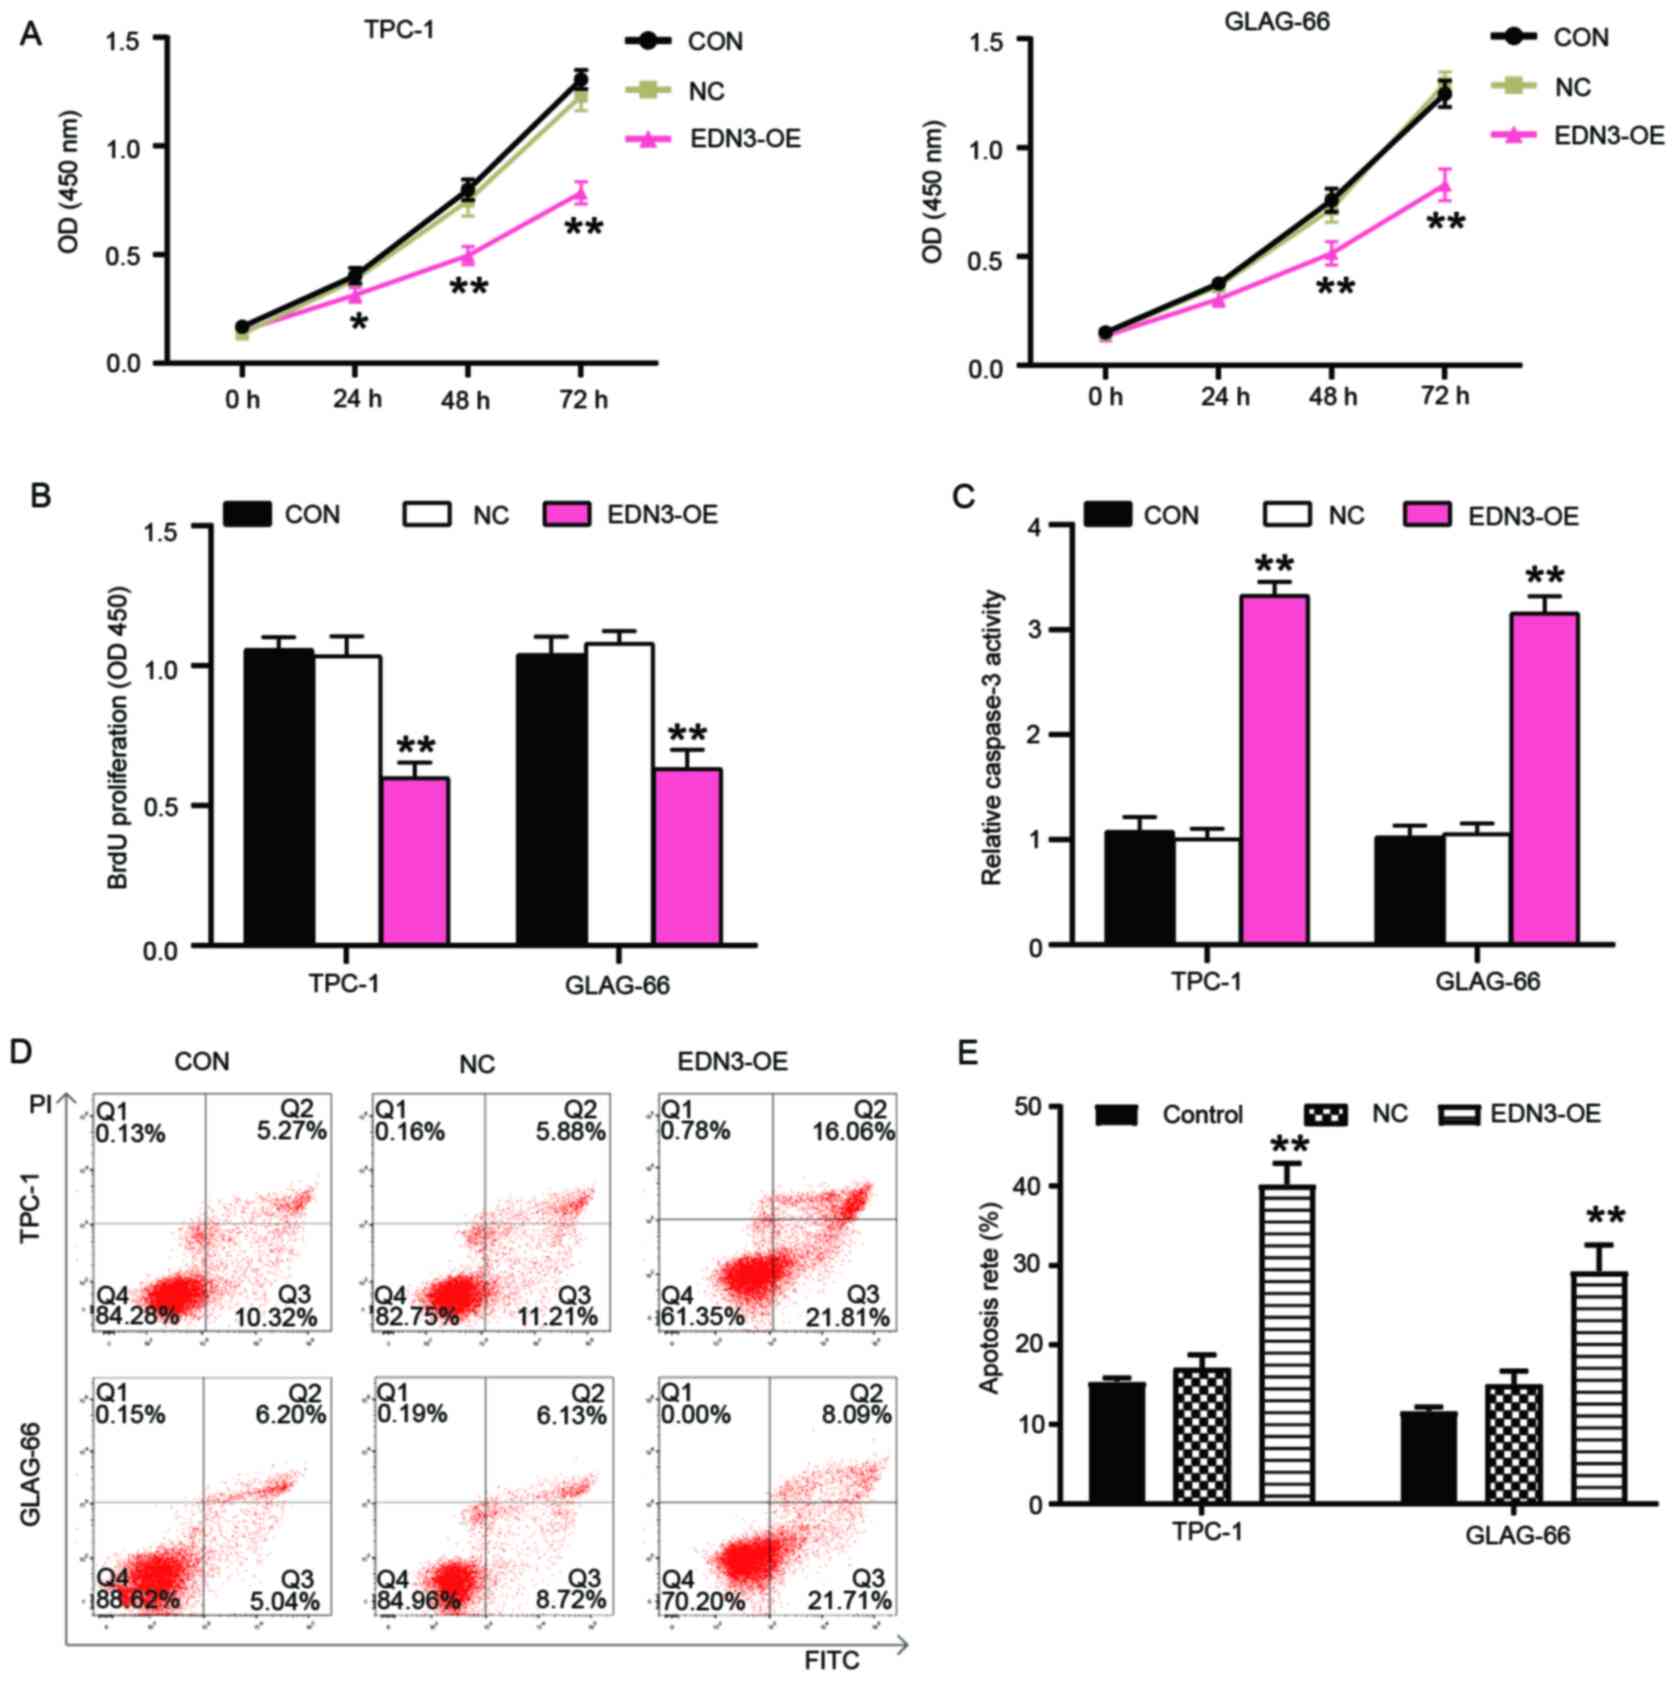
EDN3 overexpression in PTC cells
impairs cell viability and proliferation but promotes cell
apoptosis
Cytological experiments were performed to verify the
roles of EDN3 in PTC cells. Experimental results revealed that cell
viability was impaired after TPC-1 and GLAG-66 cells were
transfected with EDN3-OE plasmids for 48 and 72 h (Fig. 3A). The BrdU cell proliferation assay
outcome showed that EDN3-OE decreased OD value by 40% in both TPC-1
and GLAG-66 cell lines, thereby indicating that EDN3 overexpression
impaired the proliferation of these PTC cells (Fig. 3B). As demonstrated in Fig. 3C, the caspase-3 activity was
elevated by >3-fold in the PTC cells with the transfection of
EDN3-OE plasmids. The apoptosis rate of PTC cells was also detected
using flow cytometry and the results revealed that following
upregulation of EDN3, the apoptosis rate of TPC-1 and GLAG cells
increased by ~2.5 and 2 times, respectively (Fig. 3D and E).
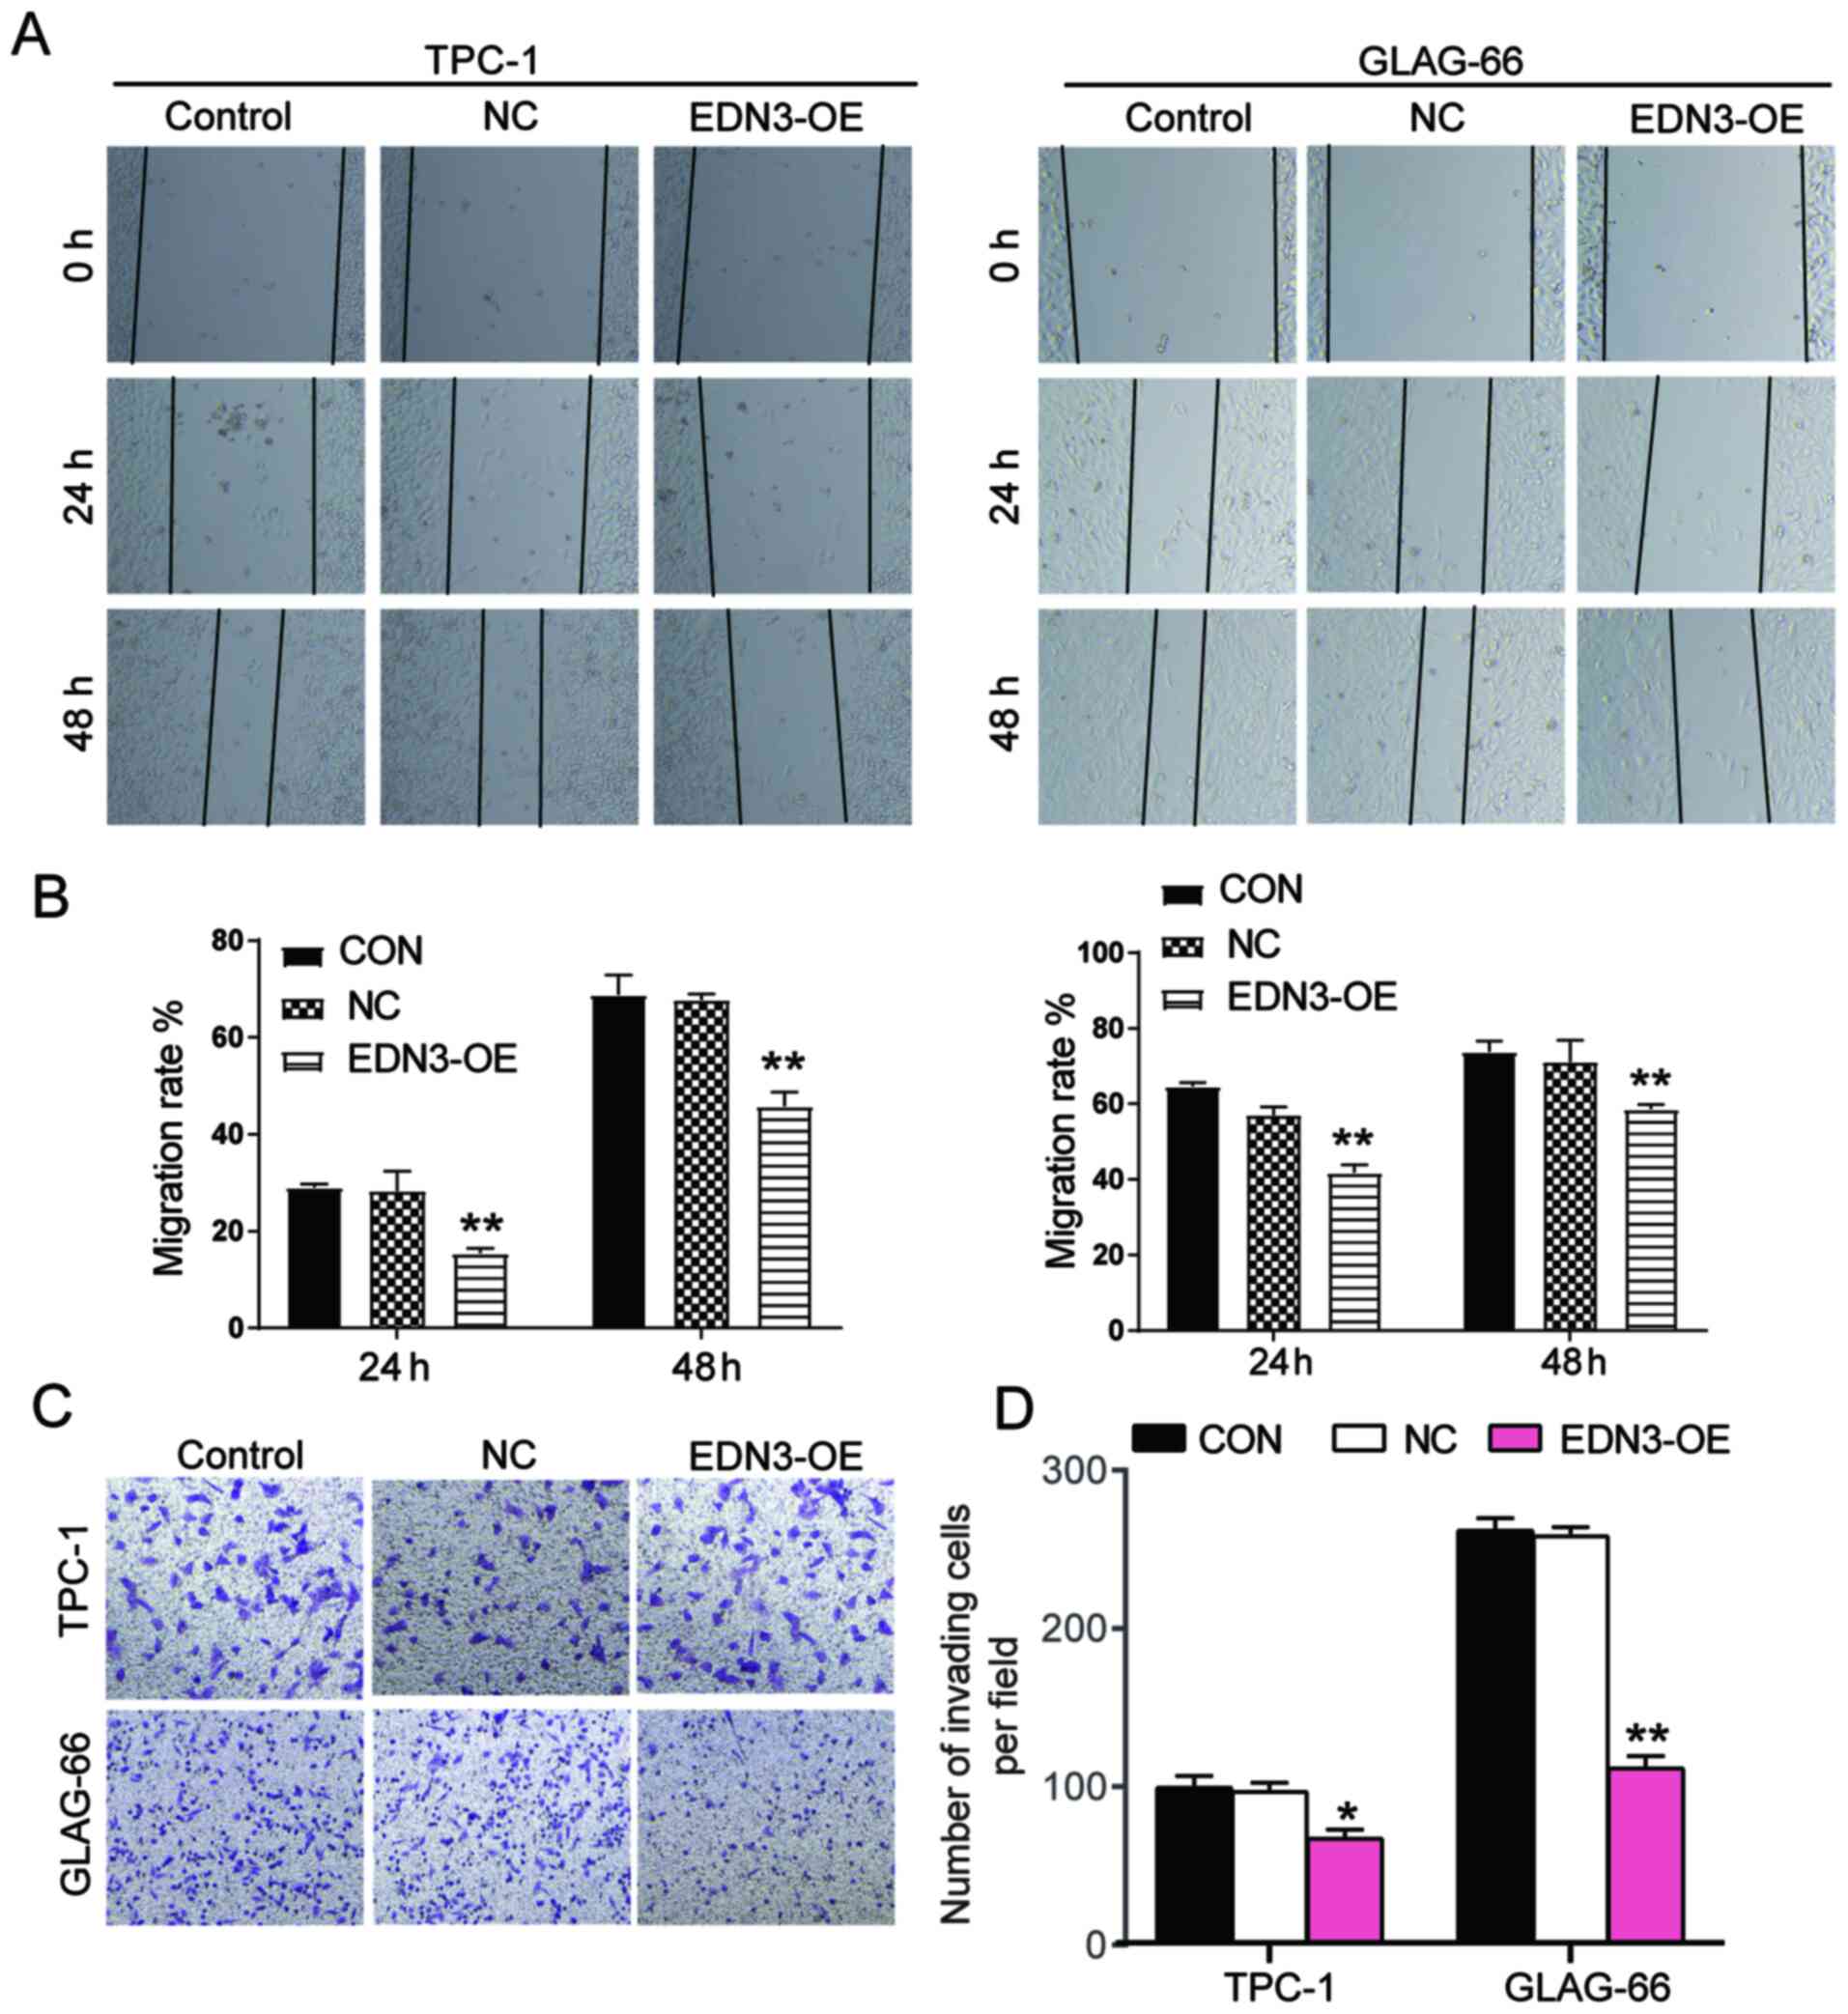
EDN3 overexpression in PTC cells
impairs cell migration and invasion
Wound healing assay was performed to explore the
effect of EDN3 on cell migration. The findings demonstrated that
EDN3-OE plasmids transfected into the two PTC cell lines decreased
the migration rate at 24 and 48 h (Fig.
4A and B). To detect the invasiveness of TPC-1 and GLAG-66
cells, Transwell assay was performed and the result indicated that
the number of cells invaded decreased by ~30 and 60% after
transfection with EDN3-OE (Fig. 4C and
D). Collectively, the results demonstrated that the EDN3 served
a positive role in inhibiting the mobility phenotypes of PTC
cells.
Negative regulation of EDN3 by
miR-27a-3p
TargetScan predicted that EDN3 3′UTR existed as the
binding site for miR-27a-3p (Fig.
5A). To further verify whether the binding site existed for
miR-27a-3p, a luciferase reporter assay was performed and it was
found that the luciferase activity of the co-transfection of EDN3
mRNA 3′UTR and miR-27a-3p mimic decreased by 36.6% in TPC-1 cells
and 41.5% in GLAG-66 cells compared with the co-transfection of
EDN3 3′UTR and NC (Fig. 5B). Then,
miR-27a-3p expression was detected in 30 PTC tissues and 30
non-tumor tissues. The result revealed that the expression of
miR-27a-3p in tumor tissues was 2.14-fold of that in non-tumor
tissues (Fig. 5C). After performing
a Pearson correlation analysis, a negative correlation between EDN3
mRNA expression and miR-27a-3p expression was observed in PTC
tissues (Fig. 5D). miR-27a-3p
expression in Nthy-ori 3-1, TPC-1 and GLAG-66 cell lines was
detected. It was observed that miR-27a-3p expression increased by
2.3-fold in TPC-1 cells and 1.6-fold in GLAG-66 cells (Fig. 5E). To explore the effect of
miR-27a-3p on EDN3 expression, miR-27a-3p mimic was used to
upregulate miR-27a-3p. After 48 h transfection, miR-27a-3p
expression was upregulated by >3-fold in PTC cells, while the
EDN3 expression was reduced by ~65% in PTC cells (Fig. 5F). The downregulation of EDN3 by
miR-27a-3p mimic transfection was also confirmed at protein level
by western blot analysis; the protein expression of EDN3 declined
by 40% in TPC-1 and GLAG-66 cells (Fig.
5G and H). These findings suggested that EDN3 mRNA 3′UTR exited
the binding site for miR-27a-3p and that the overexpressed
miR-27a-3p could suppress the EDN3 expression.
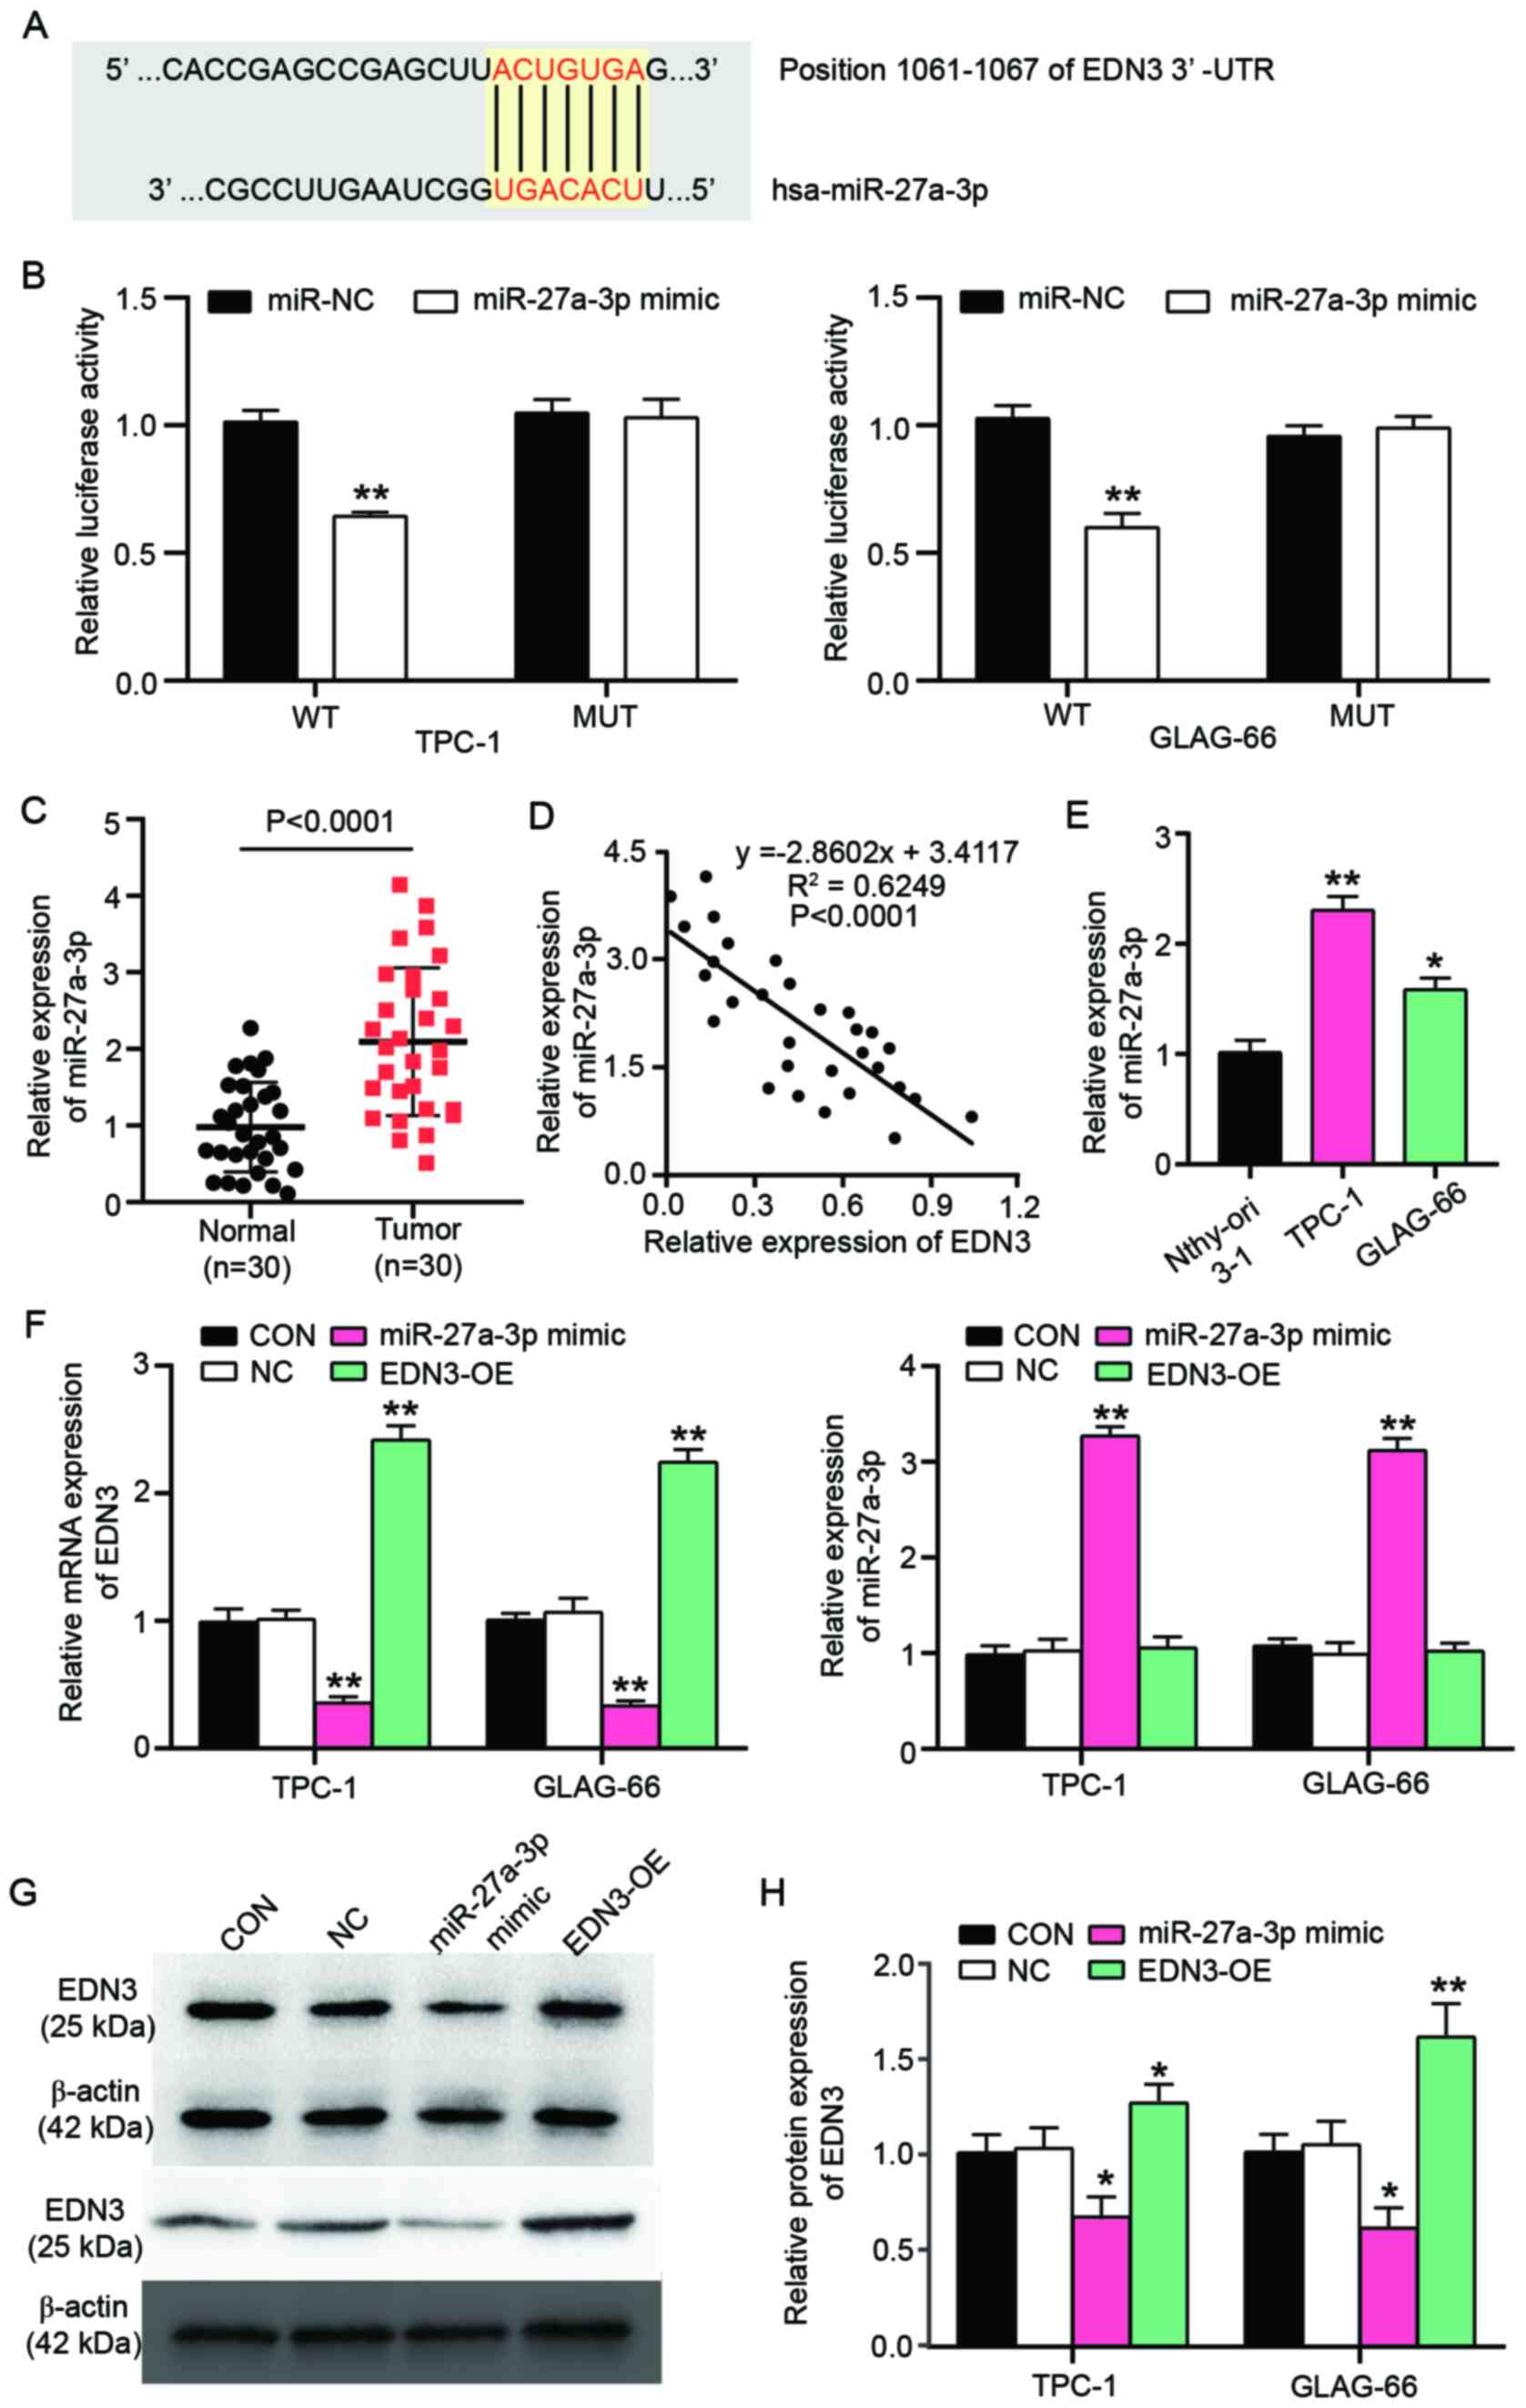 | Figure 5.EDN3 is the target gene of
miR-27a-3p. (A) The binding site between EDN3 mRNA 3′UTR and
miR-27a-3p as predicted by TargetScan. (B) The binding site between
EDN3 mRNA 3′UTR and miR-27a-3p was validated in TPC-1 and GLAG-66
cells by luciferase reporter assay. **P<0.001 vs. the
co-transfection of WT EDN3 3′UTR vectors and miR-27a-3p mimic using
one-way ANOVA. (C) The expression of miR-27a-3p in tissue specimens
was detected by RT-qPCR. n=30, Student's t-test. (D) The
correlation between EDN3 mRNA expression and miR-27a-3p expression
in 30 tissue specimens was analyzed by Pearson correlation
analysis. (E) The relative expressions of miR-27a-3p was detected
in Nthy-ori 3-1, TPC-1 and GLAG-66 cell lines by RT-qPCR. Nthy-ori
3-1 is a human thyroid cell line transformed by simian virus 40.
TPC-1 and GLAG-66 cell lines are PTC cell lines. *P<0.05,
**P<0.001 vs. Nthy-ori 3-1 cell line using one-way ANOVA. (F)
The relative expression of EDN3 mRNA and miR-27a-3p was detected in
TPC-1 and GLAG-66 cell lines by RT-qPCR. (G and H) The relative
protein expressions of EDN3 was detected in TPC-1 and GLAG-66 cell
lines by western blotting. *P<0.05, **P<0.001 vs. control
group using one-way ANOVA. The bar represented the standard
deviation of at least three independent experiments. EDN,
endothelin; miR, microRNA; UTR, untranslated region; WT, wild-type
EDN3 mRNA 3′UTR vectors. MUT, mutated EDN3 mRNA 3′UTR vectors;
RT-qPCR, reverse transcription-quantitative PCR; PTC, papillary
thyroid cancer; CON, TPC-1 and GLAG-66 cells were cultured without
any treatments; NC, TPC-1 and GLAG-66 cells were transfected with
negative control plasmids; EDN3-OE, TPC-1 and GLAG-66 cells were
transfected with EDN3-OE plasmids; miR-27a-3p, TPC-1 and GLAG-66
cells were transfected with miR-27a-3p mimic. |
miR-27a-3p promotes the viability and
proliferation of PTC cells and inhibits cell apoptosis by
attenuating the effect of EDN3 on PTC cells
To explore how miR-27a-3p affected the phenotypes of
PTC cells by regulating EDN3, a series of cytological experiments
were performed. The results of cell viability assay demonstrated
that miR-27a-3p mimic increased cell viability after the PTC cells
were transfected for 48 and 72 h. However, the cell viability of
the EDN3 and miR-27a-3p co-transfection group was similar to that
of the control group in the two PTC cell lines. Nevertheless,
compared with the co-transfection group, the cell viability in
miR-27a-3p mimic group was significantly higher whereas that in
EDN3-OE group was significantly lower (Fig. 6A). As with the cell viability, cell
proliferation (reflected by the OD value) was enhanced by ~1.7-fold
in PTC cells transfected with miR-27a-3p mimic compared with the
control group (*P<0.05, **P<0.01) or co-transfection group
(#P<0.05, ##P<0.01), while the cell
proliferation in EDN3-OE group showed significantly lower OD450
value than that in co-transfection group (Fig. 6B). The cell apoptosis (both
caspase-3 activation and flow cytometry assays) results revealed
that in the miR-27a-3p mimic group, the apoptosis decreased
significantly, whereas the apoptosis increase significantly in
EDN3-OE group compared with the control group and the
co-transfection group (Fig.
6C-E).
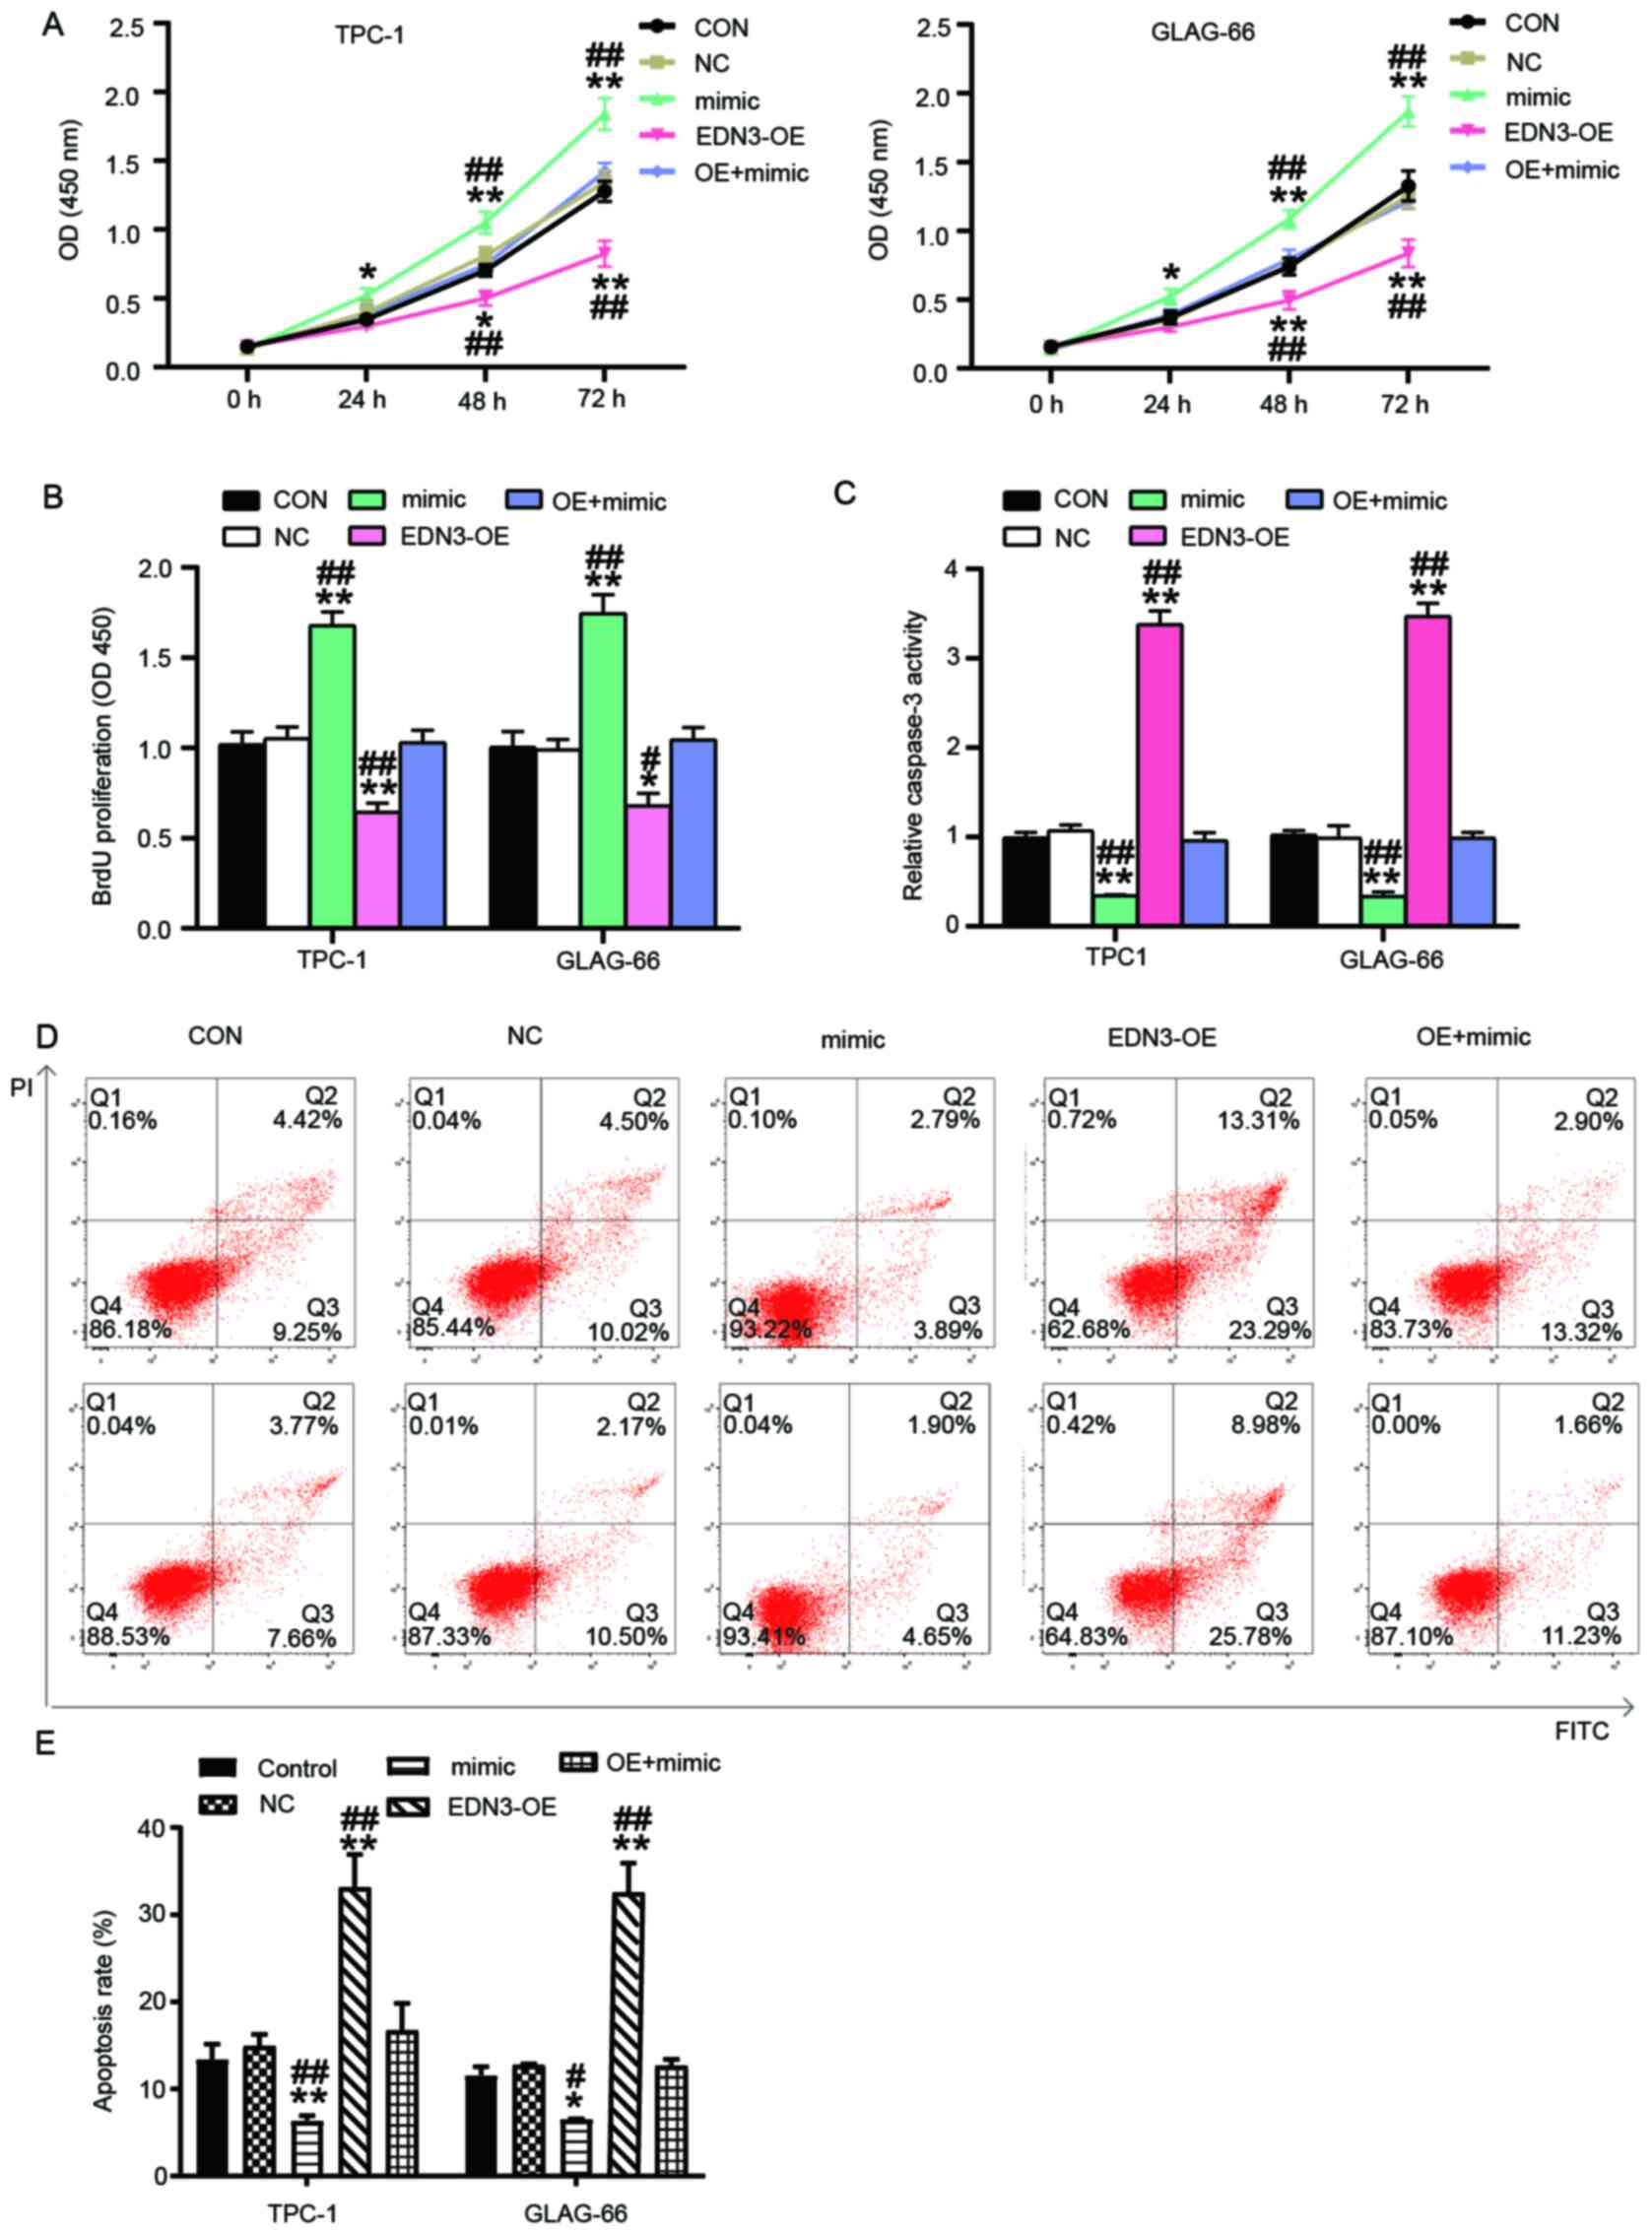 | Figure 6.miR-27a-3p enhanced the cancer
phenotypes of PTC cells and by inhibiting EDN3. (A) CCK8 assay was
performed to determine the viability of TPC-1 and GLAG-66 cells
after transfection for 0, 24, 48 and 72 h. (B) BrdU cell
proliferation assay was used to determine the cell proliferation 72
h following the transfection of TPC-1 and GLAG-66 cells. (C) The
caspase-3 activation was detected using caspase-3 assay kit to
reflect the apoptosis of TPC-1 and GLAG-66 cells in each group. (D
and E) The apoptosis rate of TPC-1 and GLAG-66 cells was measured
by flow cytometry. *P<0.05, **P<0.001 vs. control group using
one-way ANOVA. #P<0.05, ##P<0.001 vs.
OE + mimic group using one-way ANOVA. The bar represented the
standard deviation of at least three independent experiments. miR,
microRNA; EDN, endothelin; PTC, papillary thyroid cancer; CON,
TPC-1 and GLAG-66 cells were cultured without any treatments; NC,
TPC-1 and GLAG-66 cells were transfected with negative control
plasmids; EDN3-OE, TPC-1 and GLAG-66 cells were transfected with
EDN3-OE plasmids; OE + mimic, TPC-1 and GLAG-66 cells were
co-transfected with EDN3-OE plasmids and miR-27a-3p mimic. |
EDN3 overexpression partially reverses
the stimulating effects of miR-27a-3p on cell migration and
invasion
The cell migration rate (calculated as described in
the methods section) and invasion numbers were detected to reflect
the effects of miR-27a-3p on mobility phenotypes of PTC cells by
regulating EDN3. Wound-healing assay results demonstrated that,
compared with the control and co-transfection groups, the migration
rate of PTC cells increased after overexpressing miR-27a-3p but
decreased after upregulating EDN3 (Fig.
7A and B). The Transwell assay results revealed that the
invasion was enhanced (by 1.6-fold in GLAG-66 cell line and
1.3-fold in TPC-1 cell line) in the miR-27a-3p mimic group and the
invasion was suppressed in cells of the EDN3-OE group, compared
with the control and the co-transfection groups (Fig. 7C and D). Overall, these data
demonstrated that miR-27a-3p was a carcinogenic factor in PTC
progression and its upregulation could attenuate the inhibitory
effect of EDN3 on PTC cells.
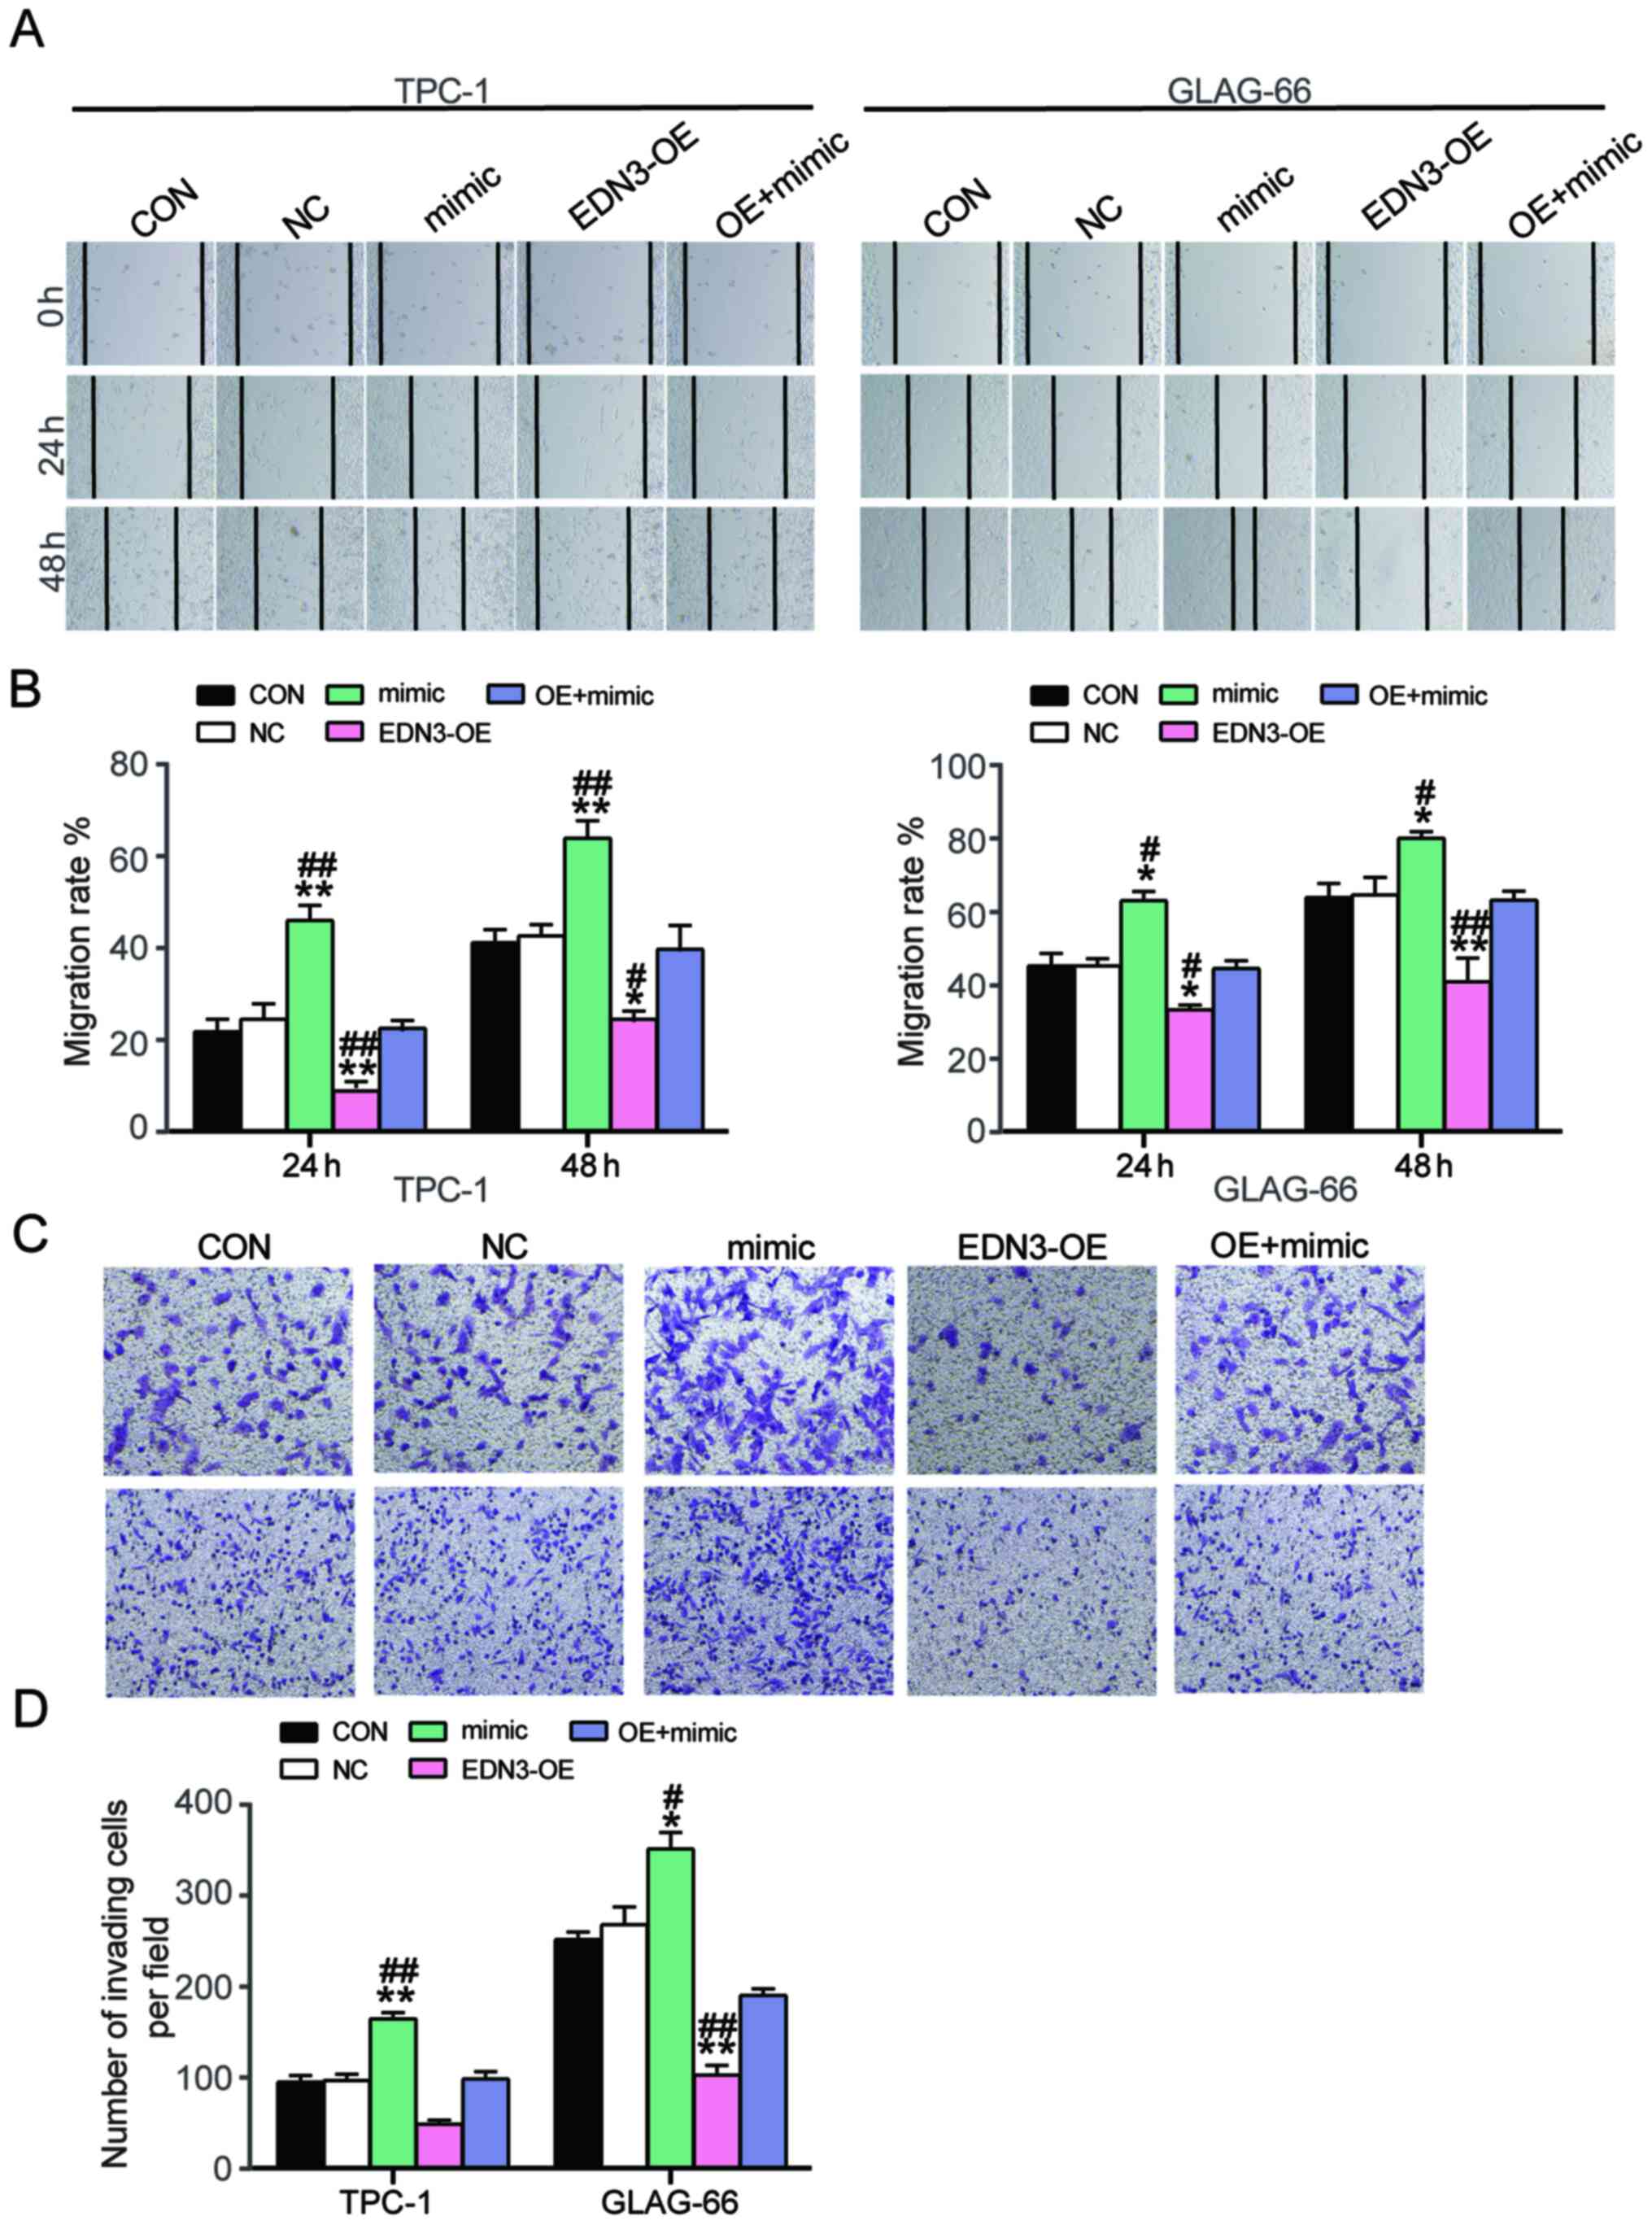 | Figure 7.Overexpression of EDN3 reversed the
promoting effects of miR-27a-3p on PTC cell migration and invasion.
(A and B) Wound healing assay was conducted to measure the cell
migration 24 and 48 h after the transfection. Magnification, ×100.
(C and D) The number of invading cells was detected using Transwell
assay to reflect the invasion ability of TPC-1 and GLAG-66 cells.
Magnification, ×100. *P<0.05, **P<0.001 vs. control group
using one-way method. #P<0.05,
##P<0.001 vs. OE + mimic group using one-way ANOVA.
The bar represented the standard deviation of at least three
independent experiments. EDN, endothelin; PTC, papillary thyroid
cancer; CON, TPC-1 and GLAG-66 cells were cultured without any
treatments; NC, TPC-1 and GLAG-66 cells were transfected with
negative control plasmids; EDN3-OE, TPC-1 and GLAG-66 cells were
transfected with EDN3-OE plasmids; mimic, TPC-1 and GLAG-66 cells
were transfected with miR-27a-3p mimic; OE + mimic, TPC-1 and
GLAG-66 cells were co-transfected with EDN3-OE plasmids and
miR-27a-3p mimic. |
Discussion
Using gene microarray analysis, the present study
identified that EDN3 and CXCL12 were associated with PTC. Following
the detection of the mRNA expression of EDN3 and CXCL12 in PTC
tissue samples, EDN3 was finally chosen as the gene of interest as
EDN3 expression was very low in PTC tissues. miRNA microarray
analysis was then performed and miR-27a-3p selected as the miR of
interest. The cell-function experiments indicated that EDN3
overexpression in PTC cells could decrease cell viability, inhibit
cell proliferation and migration and enhance cell apoptosis. It was
also found that miR-27a-3p could enhance the tumorigenic phenotypes
of PTC cells by binding to EDN3 mRNA 3′UTR to suppress the EDN3
expression.
Increasing evidence confirms that the miR-27a family
serve a key role in regulating cancer phenotypes including
invasion, migration, angiogenesis and apoptosis (40–44).
In thyroid cancer, Wang et al (38) established a thyroid cancer xenograft
model and demonstrated that miR-27a upregulation promoted the
expression of inducible nitric oxide synthase (an early marker of
angiogenesis) and angiogenesis. They also performed cell-function
experiments in vitro and proved that the upregulation of
miR-27a contributed to cell migration and invasion. Even so, the
effects of miR-27a-3p in PTC remains to be elucidated. Following
bioinformatics analysis, miR-27a-3p was selected as the key miRNA
that might be closely associated with PTC development. A series of
cytological experiments were later performed to explore the role of
miR-27a-3p and it was discovered that the biological function of
miR-27a-3p in PTC was to promote PTC cell viability and
proliferation while inhibiting apoptosis.
EDNs exert their functions by interacting with their
cognate receptors (ETAR and ETBR), thus mediating fundamental
processes in tissue differentiation, repair and growth (45). EDN1 and EDN3 primarily interact with
ETAR and ETBR, respectively (46).
EDN1 has been reported to be produced by endothelial cells,
vascular smooth muscle cells, epithelial cells, hepatocytes and
neurons (47). By binding with ETa,
this protein participates in vasoconstriction, bronchoconstriction,
mitogenesis, neuropathic pain, electrolyte balance, matrix
formation and synergism (48). In
addition, EDN1 has been found to participate in cancer pathways by
activating various kinases, inhibiting apoptosis, affecting
metastasis and contributing to angiogenesis (45). By contrast, EDN3 primarily
originates from epithelial cells, adrenal cells and neurons
(48). By interacting with ETb,
EDN3 frequently affects EDN1 autoinduction, angiogenesis,
inflammatory pain, endothelin clearance and vasodilation (45,46).
Notably, EDN1 can directly affect the phenotypes of
cancer cells by stimulating cell proliferation, migration, invasion
and inhibiting cell apoptosis (14,15).
Its overexpression is found in cells with thyroid cancer and its
overexpression can contribute to thyroid cancer progression
(17,18). As for PTC, a specific polymorphism
of EDN1 is reported to increase the risk of PTC development
(49). In addition, the
relationship between EDN1 and miR-27a has been reported in
pulmonary function studies. It was demonstrated that the more
miR-27a in a sickle cell mouse lung increased, the more EDN1
increased (50). It is also
documented that EDN1 induced the expression of miR-27a in the
proliferation of pulmonary artery smooth muscle cells (PASMC)
(51,52). Taken together, the evidence
indicates that EDNs may be related to miR-27a.
However, a recent study suggests that EDN3 is silent
in breast cancer (21), colon
cancer (20) and cervical cancer
(53) suggesting that EDN3 may be a
tumor suppressor gene in breast cancer and colon cancer. There is
evidence that the downregulation of EDN3 is associated with PTC
staging (23). The present study
validated the downregulation of EDN3 in PTC tissues and cell lines.
The overexpression of EDN3 impeded the viability, proliferation and
cell migration but induced cell apoptosis of both TPC-1 and GLAG66
cell lines. The findings of the present study may contribute to the
understanding of the role of EDN3 in PTC based on the experimental
results.
The present study is not without limitations. In
terms of prognosis analysis, the correlation between the expression
of miR-27a-3p and EDN3 and the prognosis of patients with PTC was
not statistically analyzed, given that recently diagnosed patients
with PTC were selected. In addition, the sample size of the
participants was small. The present study did not have sufficient
numbers of patients for the follow-up prognosis study. These
issues, however, will be addressed in future studies.
The present study identified the positive effects of
miR-27a-3p and the negative effects of EDN3 on PTC cell phenotypes
in vitro. However, their effects on PTC cells in vivo
were not been explored because of the limitations of the
experimental conditions. In addition, considering the significant
role of EDN3 in PTC cells, the mechanism of how EDN3 regulates PTC
progression needs to be further confirmed. Although the present
study found close associations between EDN3 expression and
miR-27a-3p expression with TNM stage as well as the association
between EDN3 expression and tumor diameter, the correlation between
the expression of miR-27a-3p and EDN3 and the prognosis of patients
with PTC was not been statistically analyzed as recently diagnosed
patients with PTC were selected and there were not enough patients
to follow up. These problems be addressed in future research.
The present study demonstrated that the upregulation
of EDN3 in PTC cells suppressed the cell viability of TPC-1 and
GLAG-66 and impaired cell proliferation and migration. It also
revealed that EDN3 overexpression promoted cell apoptosis. In
addition to the fact that miR-27a-3p was found to be a tumor
promoter in PTC cells, miR-27a-3p was discovered to attenuate the
negative effect of EDN3 on PTC cells by binding to EDN3 mRNA 3′UTR.
Overall, the present study demonstrated the significance of
miR-27a-3p and EDN3 in PTC cells.
Acknowledgements
Not applicable.
Funding
No funding was received.
Availability of data and materials
The datasets used and/or analyzed during the current
study are available from the corresponding author on reasonable
request.
Authors' contributions
HC, BC, KL and QH performed the experiments and data
analysis. HC conceived and designed the study. BC and KL are
responsible for confirming the authenticity of the data. All
authors read and approved the manuscript.
Ethics approval and consent to
participate
The present study was approved by the Ethics
Committee of Wuhan Puren Hospital (approval no.
A01401-LL201912-002). All patients signed written informed
consent.
Patient consent for publication
Not applicable.
Competing interests
The authors declare that they have no competing
interests.
References
|
1
|
Carneiro RM, Carneiro BA, Agulnik M, Kopp
PA and Giles FJ: Targeted therapies in advanced differentiated
thyroid cancer. Cancer Treat Rev. 41:690–698. 2015. View Article : Google Scholar : PubMed/NCBI
|
|
2
|
Siegel RL, Miller KD and Jemal A: Cancer
statistics, 2015. CA Cancer J Clin. 65:5–29. 2015. View Article : Google Scholar : PubMed/NCBI
|
|
3
|
Torre LA, Bray F, Siegel RL, Ferlay J,
Lortet-Tieulent J and Jemal A: Global cancer statistics, 2012. CA
Cancer J Clin. 65:87–108. 2015. View Article : Google Scholar : PubMed/NCBI
|
|
4
|
Tuttle RM: Controversial issues in thyroid
cancer management. J Nucl Med. 59:1187–1194. 2018. View Article : Google Scholar : PubMed/NCBI
|
|
5
|
Bates MF, Lamas MR, Randle RW, Long KL,
Pitt SC, Schneider DF and Sippel RS: Back so soon? Is early
recurrence of papillary thyroid cancer really just persistent
disease? Surgery. 163:118–123. 2018.PubMed/NCBI
|
|
6
|
Zhang H and Hu N: Telomerase reverse
transcriptase induced thyroid carcinoma cell proliferation through
PTEN/AKT signaling pathway. Mol Med Rep. 18:1345–1352. 2018.
View Article : Google Scholar : PubMed/NCBI
|
|
7
|
Grimshaw MJ: Endothelins and
hypoxia-inducible factor in cancer. Endocr Relat Cancer.
14:233–244. 2007. View Article : Google Scholar : PubMed/NCBI
|
|
8
|
Rubanyi GM and Polokoff MA: Endothelins:
Molecular biology, biochemistry, pharmacology, physiology, and
pathophysiology. Pharmacol Rev. 46:325–415. 1994.PubMed/NCBI
|
|
9
|
Grimshaw MJ, Hagemann T, Ayhan A, Gillett
CE, Binder C and Balkwill FR: A role for endothelin-2 and its
receptors in breast tumor cell invasion. Cancer Res. 64:2461–2468.
2004. View Article : Google Scholar : PubMed/NCBI
|
|
10
|
Smollich M and Wülfing P: The endothelin
axis: A novel target for pharmacotherapy of female malignancies.
Curr Vasc Pharmacol. 5:239–248. 2007. View Article : Google Scholar : PubMed/NCBI
|
|
11
|
Pollock DM, Keith TL and Highsmith RF:
Endothelin receptors and calcium signaling. FASEB J. 9:1196–1204.
1995. View Article : Google Scholar : PubMed/NCBI
|
|
12
|
Bagnato A and Catt KJ: Endothelins as
autocrine regulators of tumor cell growth. Trends Endocrinol Metab.
9:378–383. 1998. View Article : Google Scholar : PubMed/NCBI
|
|
13
|
Bagnato A, Spinella F and Rosanò L:
Emerging role of the endothelin axis in ovarian tumor progression.
Endocr Relat Cancer. 12:761–772. 2005. View Article : Google Scholar : PubMed/NCBI
|
|
14
|
Bagnato A and Rosanò L: The endothelin
axis in cancer. Int J Biochem Cell Biol. 40:1443–1451. 2008.
View Article : Google Scholar : PubMed/NCBI
|
|
15
|
Irani S, Salajegheh A, Smith RA and Lam
AK: A review of the profile of endothelin axis in cancer and its
management. Crit Rev Oncol Hematol. 89:314–321. 2014. View Article : Google Scholar : PubMed/NCBI
|
|
16
|
Tilly N, Schneider JG, Leidig-Bruckner G,
Sommer U and Kasperk C: Endothelin-1 levels in patients with
disorders of the thyroid gland. Exp Clin Endocrinol Diabetes.
111:80–84. 2003. View Article : Google Scholar : PubMed/NCBI
|
|
17
|
Donckier JE, Michel L, Delos M, Havaux X
and Van Beneden R: Interrelated overexpression of endothelial and
inducible nitric oxide synthases, endothelin-1 and angiogenic
factors in human papillary thyroid carcinoma. Clin Endocrinol
(Oxf). 64:703–710. 2006. View Article : Google Scholar : PubMed/NCBI
|
|
18
|
Irani S, Salajegheh A, Gopalan V, Smith RA
and Lam AK: Expression profile of endothelin 1 and its receptor
endothelin receptor A in papillary thyroid carcinoma and their
correlations with clinicopathologic characteristics. Ann Diagn
Pathol. 18:43–48. 2014. View Article : Google Scholar : PubMed/NCBI
|
|
19
|
Olender J, Nowakowska-Zajdel E,
Kruszniewska-Rajs C, Orchel J, Mazurek U, Wierzgoń A, Kokot T and
Muc-Wierzgoń M: Epigenetic silencing of endothelin-3 in colorectal
cancer. Int J Immunopathol Pharmacol. 29:333–340. 2016. View Article : Google Scholar : PubMed/NCBI
|
|
20
|
Wang R, Löhr CV, Fischer K, Dashwood WM,
Greenwood JA, Ho E, Williams DE, Ashktorab H, Dashwood MR and
Dashwood RH: Epigenetic inactivation of endothelin-2 and
endothelin-3 in colon cancer. Int J Cancer. 132:1004–1012. 2013.
View Article : Google Scholar : PubMed/NCBI
|
|
21
|
Wiesmann F, Veeck J, Galm O, Hartmann A,
Esteller M, Knüchel R and Dahl E: Frequent loss of endothelin-3
(EDN3) expression due to epigenetic inactivation in human breast
cancer. Breast Cancer Res. 11:R342009. View
Article : Google Scholar : PubMed/NCBI
|
|
22
|
Liu Y, Ye F, Yamada K, Tso JL, Zhang Y,
Nguyen DH, Dong Q, Soto H, Choe J, Dembo A, et al: Autocrine
endothelin-3/endothelin receptor B signaling maintains cellular and
molecular properties of glioblastoma stem cells. Mol Cancer Res.
9:1668–1685. 2011. View Article : Google Scholar : PubMed/NCBI
|
|
23
|
Qiu J, Zhang W, Zang C, Liu X, Liu F, Ge
R, Sun Y and Xia Q: Identification of key genes and miRNAs markers
of papillary thyroid cancer. Biol Res. 51:452018. View Article : Google Scholar : PubMed/NCBI
|
|
24
|
Wang Q, Wang S, Wang H, Li P and Ma Z:
MicroRNAs: Novel biomarkers for lung cancer diagnosis, prediction
and treatment. Exp Biol Med (Maywood). 237:227–235. 2012.
View Article : Google Scholar : PubMed/NCBI
|
|
25
|
Bertoli G, Cava C and Castiglioni I:
MicroRNAs: New biomarkers for diagnosis, prognosis, therapy
prediction and therapeutic tools for breast cancer. Theranostics.
5:1122–1143. 2015. View Article : Google Scholar : PubMed/NCBI
|
|
26
|
Wang Z, Sha HH and Li HJ: Functions and
mechanisms of miR-186 in human cancer. Biomed Pharmacother.
119:1094282019. View Article : Google Scholar : PubMed/NCBI
|
|
27
|
Zhu L, Deng H, Hu J, Huang S, Xiong J and
Deng J: The promising role of miR-296 in human cancer. Pathol Res
Pract. 214:1915–1922. 2018. View Article : Google Scholar : PubMed/NCBI
|
|
28
|
Iacona JR and Lutz CS: miR-146a-5p:
Expression, regulation, and functions in cancer. Wiley Interdiscip
Rev RNA. 10:e15332019. View Article : Google Scholar : PubMed/NCBI
|
|
29
|
Kanellopoulou C and Monticelli S: A role
for microRNAs in the development of the immune system and in the
pathogenesis of cancer. Semin Cancer Biol. 18:79–88. 2008.
View Article : Google Scholar : PubMed/NCBI
|
|
30
|
Irmak-Yazicioglu MB: Mechanisms of
MicroRNA deregulation and MicroRNA targets in gastric cancer. Oncol
Res Treat. 39:136–139. 2016. View Article : Google Scholar : PubMed/NCBI
|
|
31
|
Yu T, Ma P, Wu D, Shu Y and Gao W:
Functions and mechanisms of microRNA-31 in human cancers. Biomed
Pharmacother. 108:1162–1169. 2018. View Article : Google Scholar : PubMed/NCBI
|
|
32
|
Yan X, Yu H, Liu Y, Hou J, Yang Q and Zhao
Y: miR-27a-3p functions as a tumor suppressor and regulates
non-small cell lung cancer cell proliferation via targeting HOXB8.
Technol Cancer Res Treat. 18:15330338198619712019. View Article : Google Scholar : PubMed/NCBI
|
|
33
|
Li JM, Zhou J, Xu Z, Huang HJ, Chen MJ and
Ji JS: MicroRNA-27a-3p inhibits cell viability and migration
through down-regulating DUSP16 in hepatocellular carcinoma. J Cell
Biochem. 119:5143–5152. 2018. View Article : Google Scholar : PubMed/NCBI
|
|
34
|
Zhou L, Liang X, Zhang L, Yang L, Nagao N,
Wu H, Liu C, Lin S, Cai G and Liu J: MiR-27a-3p functions as an
oncogene in gastric cancer by targeting BTG2. Oncotarget.
7:51943–51954. 2016. View Article : Google Scholar : PubMed/NCBI
|
|
35
|
Liang J, Tang J, Shi H, Li H, Zhen T, Duan
J, Kang L, Zhang F, Dong Y and Han A: miR-27a-3p targeting RXRalpha
promotes colorectal cancer progression by activating
Wnt/beta-catenin pathway. Oncotarget. 8:82991–83008. 2017.
View Article : Google Scholar : PubMed/NCBI
|
|
36
|
Li E, Han K and Zhou X: microRNA-27a-3p
down-regulation inhibits malignant biological behaviors of ovarian
cancer by targeting BTG1. Open Med (Wars). 14:577–585. 2019.
View Article : Google Scholar : PubMed/NCBI
|
|
37
|
Wu XZ, Wang KP, Song HJ, Xia JH, Jiang Y
and Wang YL: MiR-27a-3p promotes esophageal cancer cell
proliferation via F-box and WD repeat domain-containing 7 (FBXW7)
suppression. Int J Clin Exp Med. 8:15556–15562. 2015.PubMed/NCBI
|
|
38
|
Wang YL, Gong WG and Yuan QL: Effects of
miR-27a upregulation on thyroid cancer cells migration, invasion,
and angiogenesis. Genet Mol Res. 15:2016. View Article : Google Scholar
|
|
39
|
Livak KJ and Schmittgen TD: Analysis of
relative gene expression data using real-time quantitative PCR and
the 2(-Delta Delta C(T)) method. Methods. 25:402–408. 2001.
View Article : Google Scholar : PubMed/NCBI
|
|
40
|
Maqbool R, Lone SN and Ul Hussain M:
Post-transcriptional regulation of the tumor suppressor p53 by a
novel miR-27a, with implications during hypoxia and tumorigenesis.
Biochem J. 473:3597–3610. 2016. View Article : Google Scholar : PubMed/NCBI
|
|
41
|
Li P, Zhang Q and Tang H: INPP1
up-regulation by miR-27a contributes to the growth, migration and
invasion of human cervical cancer. J Cell Mol Med. 23:7709–7716.
2019. View Article : Google Scholar : PubMed/NCBI
|
|
42
|
Li L and Luo Z: Dysregulated miR-27a-3p
promotes nasopharyngeal carcinoma cell proliferation and migration
by targeting Mapk10. Oncol Rep. 37:2679–2687. 2017. View Article : Google Scholar : PubMed/NCBI
|
|
43
|
Tang H, Xu X, Xiao W, Liao Y, Xiao X, Li
L, Li K, Jia X and Feng H: Silencing of microRNA-27a facilitates
autophagy and apoptosis of melanoma cells through the activation of
the SYK-dependent mTOR signaling pathway. J Cell Biochem.
120:13262–13274. 2019. View Article : Google Scholar : PubMed/NCBI
|
|
44
|
Shang D, Xie C, Hu J, Tan J, Yuan Y, Liu Z
and Yang Z: Pancreatic cancer cell-derived exosomal microRNA-27a
promotes angiogenesis of human microvascular endothelial cells in
pancreatic cancer via BTG2. J Cell Mol Med. 24:588–604. 2020.
View Article : Google Scholar : PubMed/NCBI
|
|
45
|
Nelson J, Bagnato A, Battistini B and
Nisen P: The endothelin axis: Emerging role in cancer. Nat Rev
Cancer. 3:110–116. 2003. View
Article : Google Scholar : PubMed/NCBI
|
|
46
|
Chen LL, Zhu J, Schumacher J, Wei C,
Ramdas L, Prieto VG, Jimenez A, Velasco MA, Tripp SR, Andtbacka
RHI, et al: SCF-KIT signaling induces endothelin-3 synthesis and
secretion: Thereby activates and regulates endothelin-B-receptor
for generating temporally- and spatially-precise nitric oxide to
modulate SCF- and or KIT-expressing cell functions. PLoS One.
12:e01841542017. View Article : Google Scholar : PubMed/NCBI
|
|
47
|
Alcendor DJ: Dysregulation of
endothelin-1: Implications for health disparities in Alzheimer's
disease. J Pers Med. 10:1992020. View Article : Google Scholar
|
|
48
|
Davenport AP, Hyndman KA, Dhaun N, Southan
C, Kohan DE, Pollock JS, Pollock DM, Webb DJ and Maguire JJ:
Endothelin. Pharmacol Rev. 68:357–418. 2016. View Article : Google Scholar : PubMed/NCBI
|
|
49
|
Aydin AF, Vural P, Doğru-Abbasoğlu S and
Çil E: The endothelin 1 and endothelin receptor A gene
polymorphisms increase the risk of developing papillary thyroid
cancer. Mol Biol Rep. 46:199–205. 2019. View Article : Google Scholar : PubMed/NCBI
|
|
50
|
Kang BY, Park K, Kleinhenz JM, Murphy TC,
Sutliff RL, Archer D and Hart CM: Peroxisome proliferator-activated
receptor γ regulates the V-Ets avian erythroblastosis virus E26
oncogene homolog 1/microRNA-27a axis to reduce endothelin-1 and
endothelial dysfunction in the sickle cell mouse lung. Am J Respir
Cell Mol Biol. 56:131–144. 2017. View Article : Google Scholar : PubMed/NCBI
|
|
51
|
Xie X, Li S, Zhu Y, Liu L, Pan Y, Wang J,
Shi W, Song Y, Yang L, Gao L, et al: MicroRNA-27a/b mediates
endothelin-1-induced PPARγ reduction and proliferation of pulmonary
artery smooth muscle cells. Cell Tissue Res. 369:527–539. 2017.
View Article : Google Scholar : PubMed/NCBI
|
|
52
|
Kang BY, Park KK, Green DE, Bijli KM,
Searles CD, Sutliff RL and Hart CM: Hypoxia mediates mutual
repression between microRNA-27a and PPARγ in the pulmonary
vasculature. PLoS One. 8:e795032013. View Article : Google Scholar : PubMed/NCBI
|
|
53
|
Lin H, Ma Y, Wei Y and Shang H:
Genome-wide analysis of aberrant gene expression and methylation
profiles reveals susceptibility genes and underlying mechanism of
cervical cancer. Eur J Obstet Gynecol Reprod Biol. 207:147–152.
2016. View Article : Google Scholar : PubMed/NCBI
|