Introduction
MicroRNA (miRNA) are a class of short, non-coding
RNAs involved in post-transcriptional downregulation of protein
expression in eukaryotic organisms, through silencing of target
messenger RNAs (1–3). They are implicated in regulating
approximately one third of the genome; controlling multiple
cellular processes, including apoptosis (2–4),
proliferation (2), differentiation
(2–5) and development (3–6).
An expanding body of pre-clinical evidence has
implicated altered miRNA expression profiles in several disease
processes (2,5–10),
with the potential to facilitate earlier diagnosis, disease
monitoring and predict prognosis (3,8–10).
Increasing literature is emerging concerning the role of
placental-derived miRNAs in pregnancy, originating from three main
clusters on chromosome 19 (C19MC, miR-371-3) and chromosome 14
(C14MC) (11,12). Altered miRNA profiles have been
detected in both healthy pregnancy (changing across trimesters and
compared to the non-pregnant state) (13–16)
and pregnancies complicated by gestational hypertension (17,18),
pre-eclampsia (19), diabetes
(20,21) or congenital anomalies (22).
Given the potential clinical utility of miRNAs,
accurate and efficient quantification is essential. The relative
ease and safety of obtaining blood samples over tissue biopsies
(23–25), as well as the stability of
circulating miRNAs has focused much of the current research towards
blood testing (3,26). However, due to the low concentration
of free miRNAs in biofluids, variable findings between different
starting media (serum vs. plasma) and the alteration of the miRNA
profile by haemolysis, signalling or environmental exposures,
robust results have proven difficult to obtain (26–30).
Additionally, variability in the collection, storage and processing
of samples can affect outcomes (27). Standardised procedures for all
stages of miRNA quantification would minimise variability but are
yet to be developed. Techniques that increase efficiency are
favoured, as higher miRNA concentrations in the eluate facilitate
quantification (27,31). miRNA extraction from biofluids is
the prime source of intra-assay variation in miRNA quantification,
highlighting the need for a robust, reproducible protocol (32–34).
To assist in miRNA extraction, there are several
commercially available kits, yet many pre-clinical biomarker
studies fail to acknowledge the variability introduced by these
different methodologies, potentially contributing to poor
replicability between studies and delaying progression into
clinical practice. There is a paucity of literature concerning the
optimal kit to answer the clinical question at hand, as media and
kit performance may vary between the patient population (males,
females, pregnant or non-pregnant) and the disease state under
investigation (25,35). Compounded by inter-patient
variability within study samples, identifying the optimal
methodology is extremely difficult (27,32,36,37).
Factors including the starting volume of biofluid, use of glycogen,
yeast or bacteriophage RNA carriers (e.g. MS2) and the addition of
a serine protease (e.g. Proteinase K) to digest native proteins can
all be modified to improve the yield and reproducibility of miRNA
extraction (24); the effect of
each being dependent on the extraction technique (24,31,38–42).
Carriers are particularly useful when handling biofluids with low
starting miRNA concentrations (e.g. human serum and plasma), as
counterproductively, the extraction process itself loses a sizeable
proportion of the sample miRNA content (39). Downstream analysis techniques may
restrict the choice of carrier, as degraded RNA bacteriophages
cannot be distinguished from sample RNA content using Next
Generation Sequencing platforms (43), hence miRNA-free glycogen carriers
are instead recommended for this application (43).
This study aimed to compare the relative efficiency
of two commercially available miRNA extraction kits to determine
the most suitable approach using human plasma derived from women
with an uncomplicated, healthy pregnancy. Qiagen miRNeasy
Serum/Plasma kit uses a well-known chloroform/phenol and
column-based miRNA extraction system, whilst the Promega
Maxwell® RSC miRNA from Tissue or Plasma or Serum kit
employs a novel technique involving an automated paramagnetic
particle mover to drive the RNA through binding, washing and
elution steps. To our knowledge, in the published literature, a
methodological investigation involving this patient group has never
been performed, neither has a comparison of these two particular
extraction kits. We additionally sought to optimise the performance
of each kit through four methodological modifications varying the:
(i) starting volume of plasma; the addition of (ii) Proteinase K;
(iii) a RNA bacteriophage carrier (MS2); and (iv) a glycogen
carrier.
Materials and methods
Sample collection
Blood was obtained from a healthy pregnant woman
with an uncomplicated, low-risk pregnancy at 9 weeks' gestation
using 4.5 ml Sodium citrate vacutainer tubes (NHS Supply Chain).
Standard venepuncture procedures were followed, according to the
National Cancer Institute Early Detection Research Network,
involving a 21-gauge needle to minimise haemolysis. Following
collection, samples were kept upright and stored on ice
(maintaining a temperature of ~4°C) to inhibit miRNA degradation by
circulating RNases within whole blood and processed within 2 h.
Samples were centrifuged at 1,900 × g for 10 min at 4°C with the
recovered plasma supernatant aliquoted and immediately stored at
−80°C. Following gentle thawing at room temperature, aliquots
underwent a second centrifugation step (16,000 × g for 10 min at
4°C) to generate platelet poor plasma.
Ethical approval
Written patient consent was taken from participants,
within the ethical approval obtained from the United Kingdom North
East Newcastle and North Tyneside 1 NHS Research Ethics Committee
(Reference 16/NE/0292) on 30/08/2016 and The Health Research
Authority on 27/09/2016, with approved non-substantial (18/10/2018
and 01/05/2019) and substantial (12/12/2019) amendments (Table II).
 | Table II.Description of the 14 miRNA primers
used for reverse transcription-quantitative PCR. |
Table II.
Description of the 14 miRNA primers
used for reverse transcription-quantitative PCR.
| miRNA primer | Function | Sequence (5–3) |
|---|
| UniSp2 | RNA extraction
efficiency | Unavailable |
| UniSp4 | RNA extraction
efficiency | Unavailable |
| UniSp5 | RNA extraction
efficiency | Unavailable |
| UniSp6 | cDNA synthesis
efficiency | Unavailable |
| cel-miR-39-3p | cDNA synthesis
efficiency |
UCACCGGGUGUAAAUCAGCUUG |
| hsa-miR-451a | Stably expressed
miRNA used for normalisation and detection of haemolysis |
AAACCGUUACCAUUACUGAGUU |
| hsa-miR-23a | Stably expressed
miRNA used for normalisation and detection of haemolysis |
AUCACAUUGCCAGGGAUUUCC |
| hsa-miR-423-3p | Stably expressed
miRNA used for normalisation |
AGCUCGGUCUGAGGCCCCUCAGU |
|
hsa-miR-103a-3p | Stably expressed
miRNA used for normalisation |
AGCAGCAUUGUACAGGGCUAUGA |
| hsa-miR-191-5p | Stably expressed
miRNA used for normalisation |
CAACGGAAUCCCAAAAGCAGCUG |
| hsa-miR-222-3p | Stably expressed
miRNA of interest |
AGCUACAUCUGGCUACUGGGU |
| hsa-let-7i-3p | Stably expressed
miRNA of interest |
CUGCGCAAGCUACUGCCUUGCU |
| hsa-miR-148-3p | Stably expressed
miRNA of interest |
UCAGUGCAUCACAGAACUUUGU |
| hsa-miR-30e-5p | Stably expressed
miRNA of interest |
UGUAAACAUCCUUGACUGGAAG |
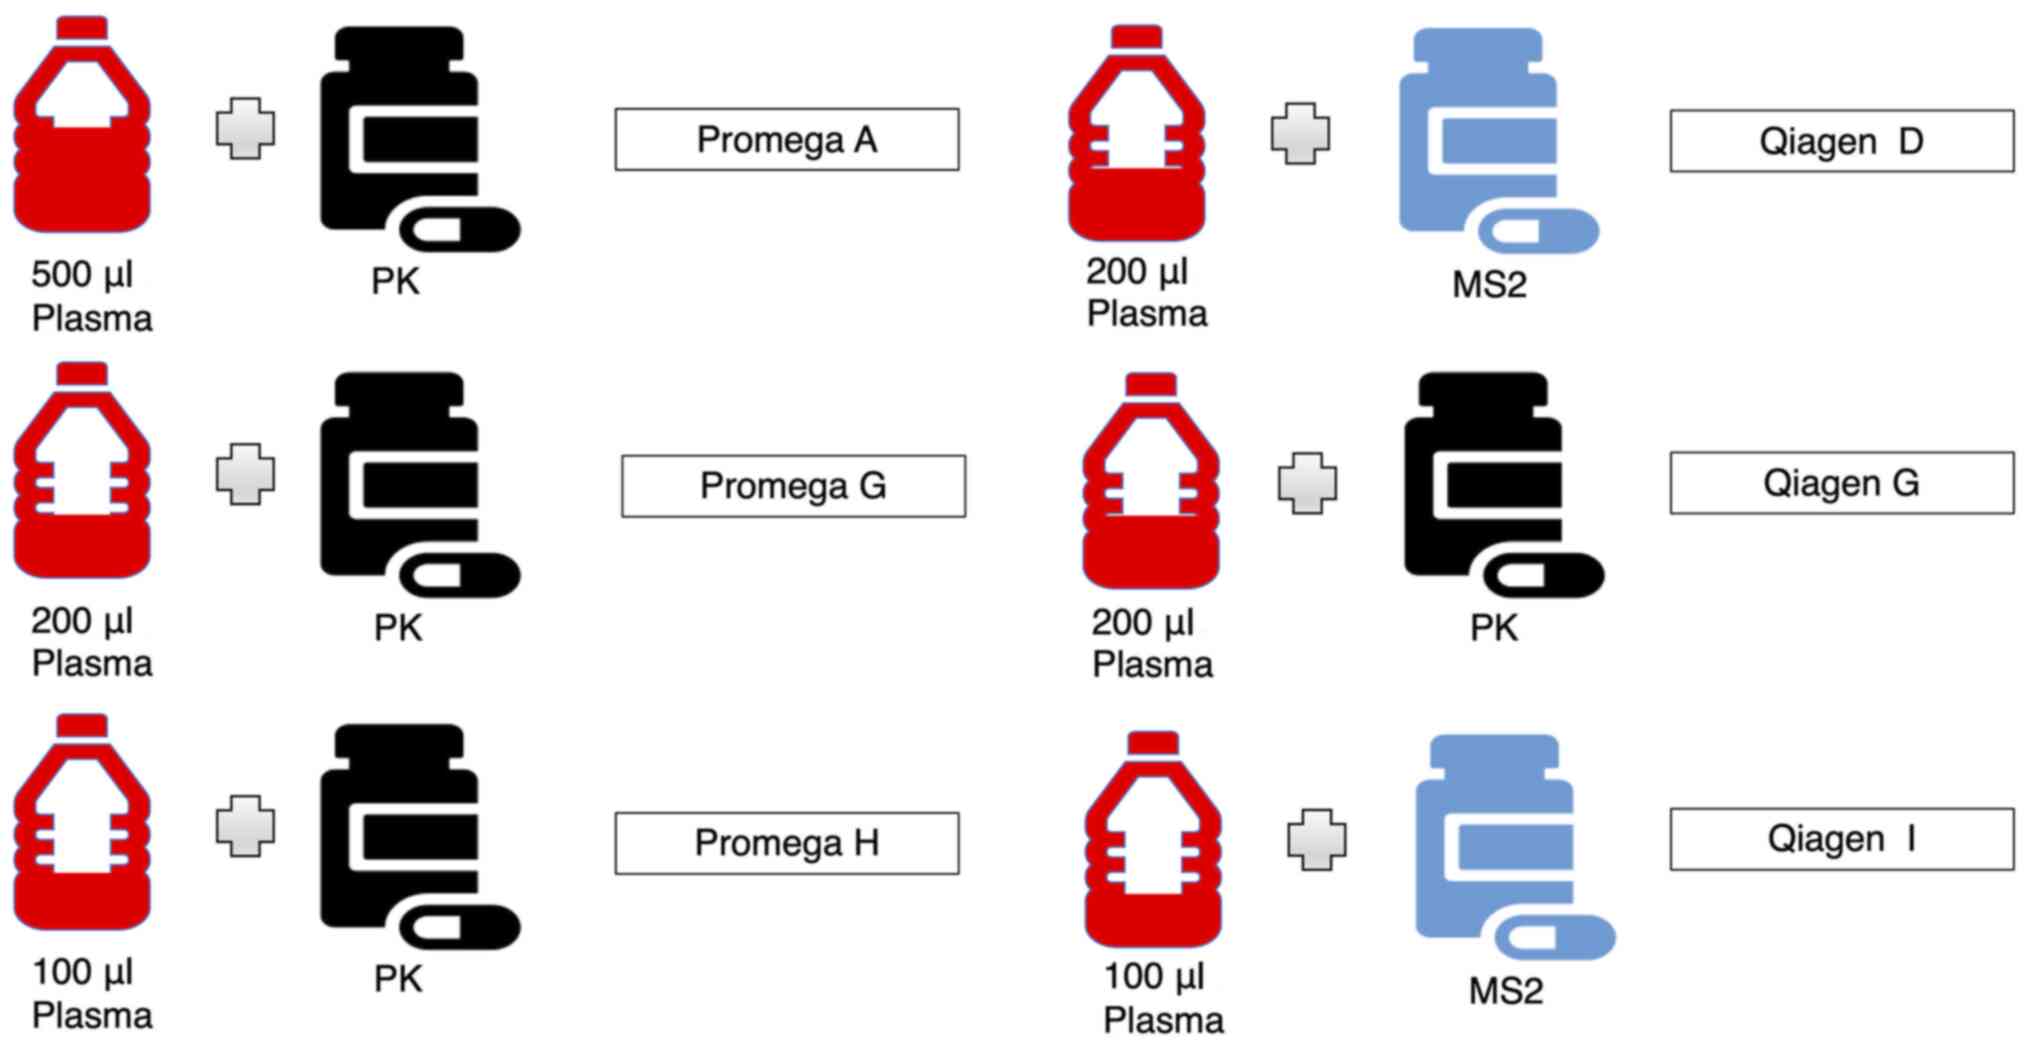
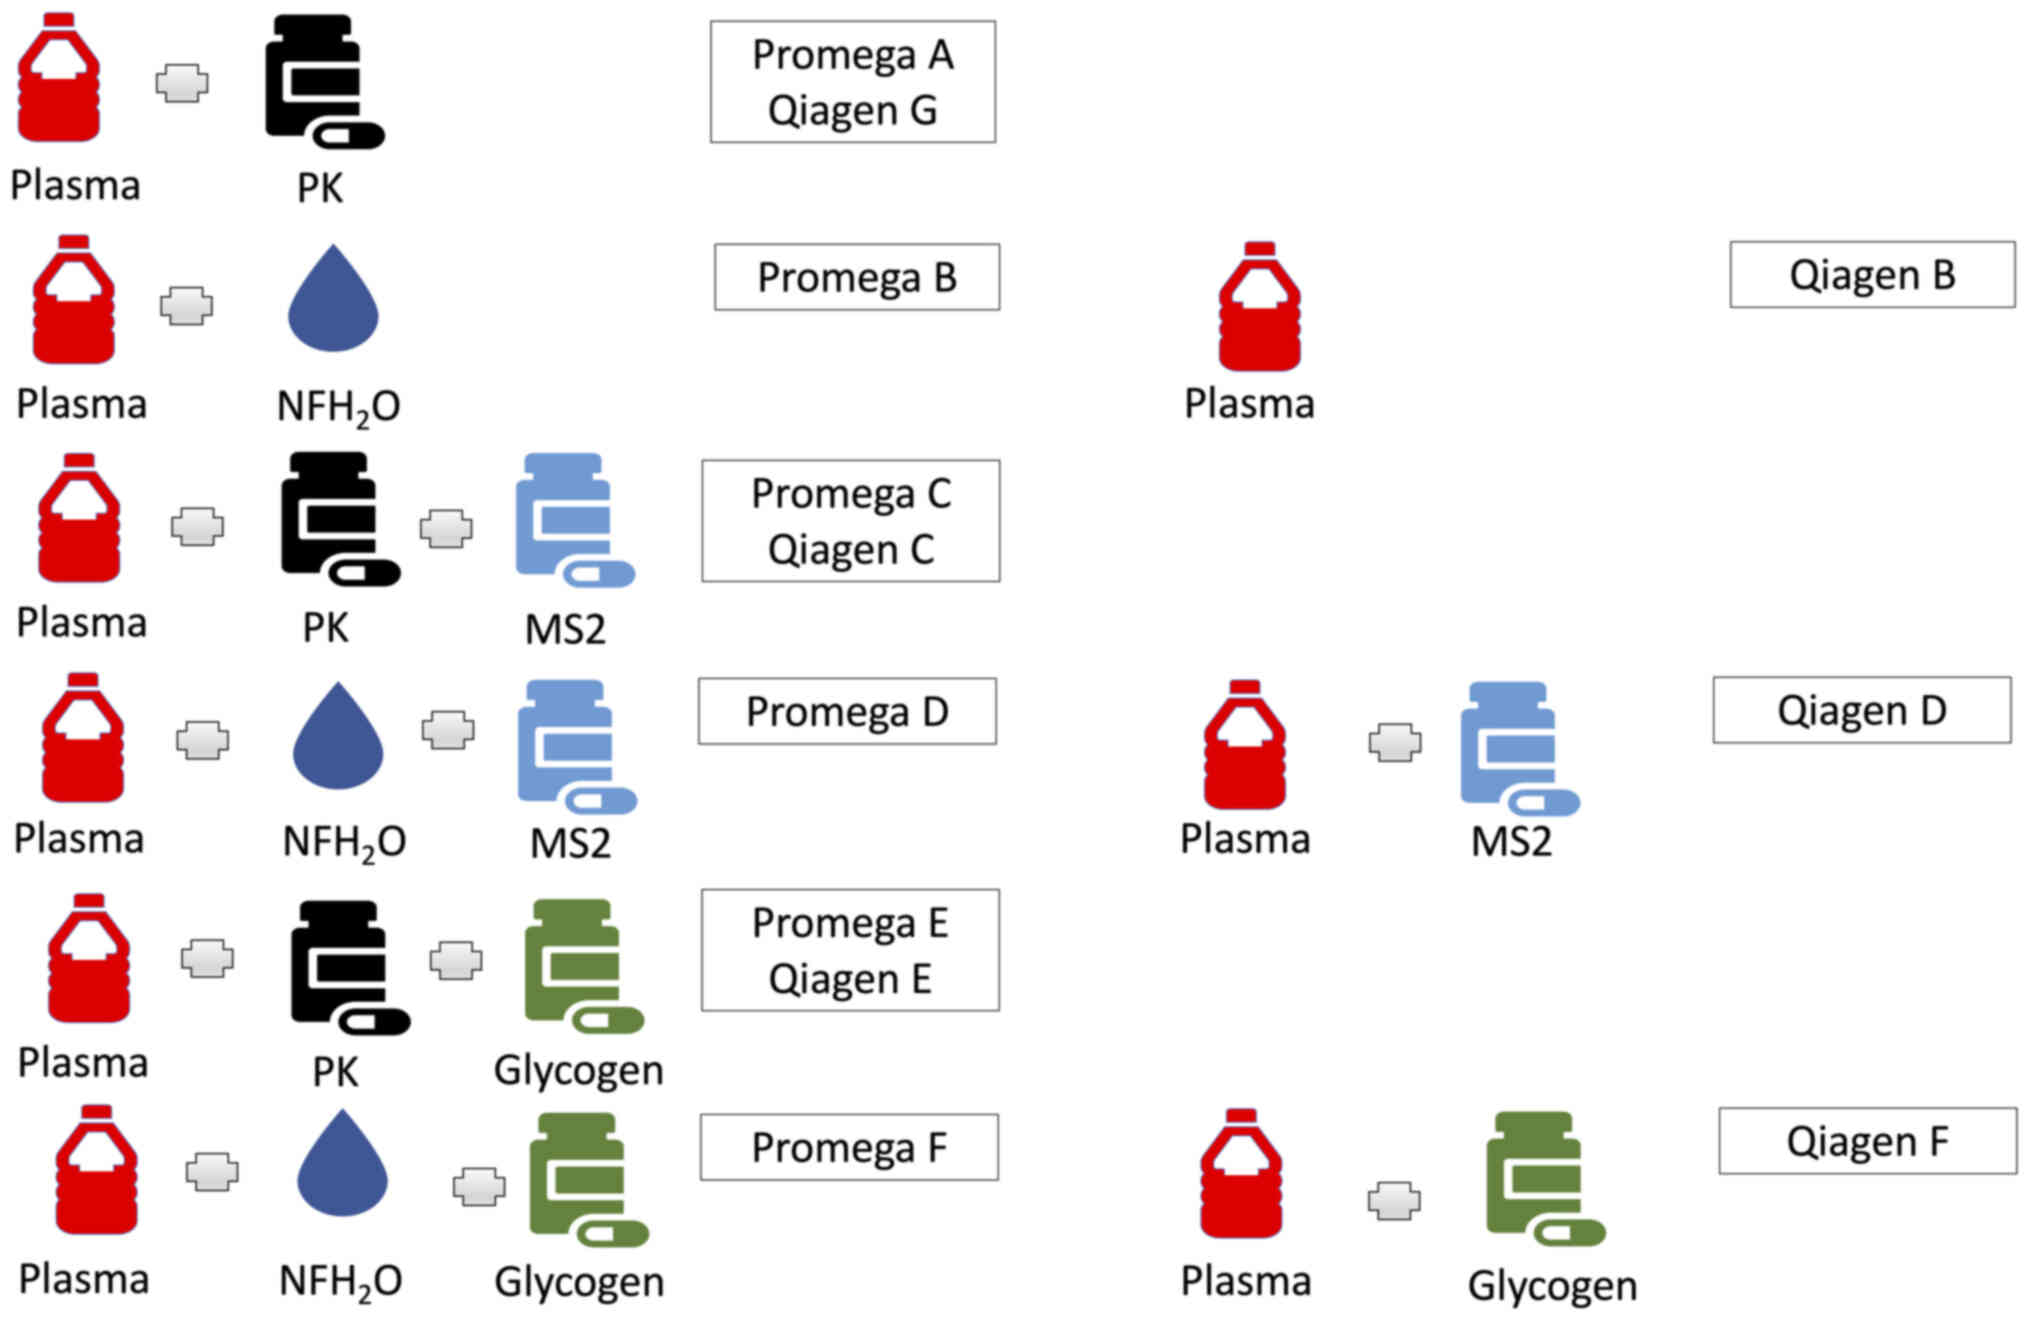
miRNA extraction
miRNA was extracted from plasma samples using the:
i) miRNeasy Serum/Plasma kit (217184; Qiagen) and ii) a prototype
of the Maxwell® RSC miRNA from Tissue or Plasma or Serum
kit (AS1680; Promega) (44) both
with minor modifications. Standard manufacturer and optimised
approaches were performed, modifying: i) starting volume of plasma;
the addition of ii) Proteinase K; iii) a RNA bacteriophage carrier
(MS2); and iv) a glycogen carrier (Figs. 1 and 2; Table
I). In short, step (2) of the
miRNeasy protocol was modified; UniSp2, UniSp4 and UniSp5 spike-in
mix (reconstituted according to manufacturers' instructions)
(339390, RNA spike-in kit; Qiagen) (Table II) was diluted 1:11 into QIAzol
lysis buffer, mixing thoroughly. 0.5 µl of spike-in mix was added
per 100 µl of plasma in accordance with the manufacturer's
protocol. When required (Fig. 2;
Table I), 1 µg per 200 µl of RNA
bacteriophage MS2 (0.8 µg/µl) (10165948001; Roche Diagnostics GmbH)
or 2 µg per 200 µl of RNA grade Glycogen (20 mg/ml) (R0551; Thermo
Fisher Scientific, Inc.) was added to the dilute RNA spike-in and
QIAzol lysis reagent mix, combining thoroughly. This mix was
combined with the remaining volume of lysis buffer and step
(4) of the protocol omitted.
| Table I.Standard and optimised microRNA
extraction approaches. |
Table I.
Standard and optimised microRNA
extraction approaches.
| Kit | Approach | Code | Plasma volume,
µl | Proteinase K,
µl | MS2, µg | Glycogen, µg |
|---|
| Promega | S | A | 500 | 60 | None | None |
|
| O | B | 500 | Replaced with
NFH2O | None | None |
|
| O | C | 500 | 60 | 2.5 | None |
|
| O | D | 500 | Replaced with
NFH2O | 2.5 | None |
|
| O | E | 500 | 60 | None | 5 |
|
| O | F | 500 | Replaced with
NFH2O | None | 5 |
|
| O | G | 200 | 60 | None | None |
|
| O | H | 100 | 60 | None | None |
| Qiagen | O | B | 200 | None | None | None |
|
| O | C | 200 | 24 | 1 | None |
|
| S | D | 200 | None | 1 | None |
|
| O | E | 200 | 24 | None | 2 |
|
| O | F | 200 | None | None | 2 |
|
| O | G | 200 | 24 | None | None |
|
| O | I | 100 | None | 0.5 | None |
The prototype Promega protocol with minor
modifications was conducted as follows: Lyophilised DNase I was
resuspended with 275 µl of nuclease free water, adding 5 µl of Blue
Dye as a visual indicator, inverting or swirling to mix. Aliquots
were produced, storing at 4°C (few weeks) or −20°C (longer
storage). UniSp2, UniSp4 and UniSp5 spike-in mix (reconstituted
according to manufacturers' instructions) (339390, RNA spike-in
kit, Qiagen) was diluted 1:11 into binding buffer. 0.5 µl of
spike-in mix was added per 100 µl of plasma in accordance with the
manufacturer's protocol. When required (Fig. 2; Table
I), 1 µg per 200 µl of RNA bacteriophage MS2 (0.8 µg/µl)
(10165948001; Roche Diagnostics GmbH) or 2 µg per 200 µl of RNA
grade Glycogen (20 mg/ml) (R0551; Thermo Fisher Scientific, Inc.)
was added to the diluted spike-in mix, combining thoroughly. The
spike-in +/− carrier molecule mix was then added to the remaining
volume of binding buffer, mixing thoroughly. 100, 200 or 500 µl
(Fig. 1; Table I) of pre-processed plasma (see
Sample collection in Materials and methods section) was transferred
to a 1.5 ml Eppendorf and 60 µl Proteinase K added, replacing
Proteinase K with nuclease-free water when required (Fig. 2; Table
I). This was then added to the binding buffer, spike-in +/−
carrier molecules mix, vortexing for 10 sec. This sample lysate was
then incubated at 37°C for 15 min. During this time, the
Maxwell® Rapid Sample Concentrator (RSC) cartridges were
loaded into the RSC deck tray, their seals removed, and the RSC
plungers inserted into well 8 of the cartridges. 500 µl elution
tubes were loaded into the deck and 60 µl nuclease-free water added
to each. Ten microliters of reconstituted DNAse I was added to well
4 (yellow) of the cartridges and following incubation, all of the
sample lysate was transferred into well 1 of the cartridges. The
Maxwell® RSC Instrument (AS4500; Promega) (45) instrument and the ‘RSC miRNA Tissue’
method was used to begin the automated purification run. Following
processing, the eluate was stored at −80°C.
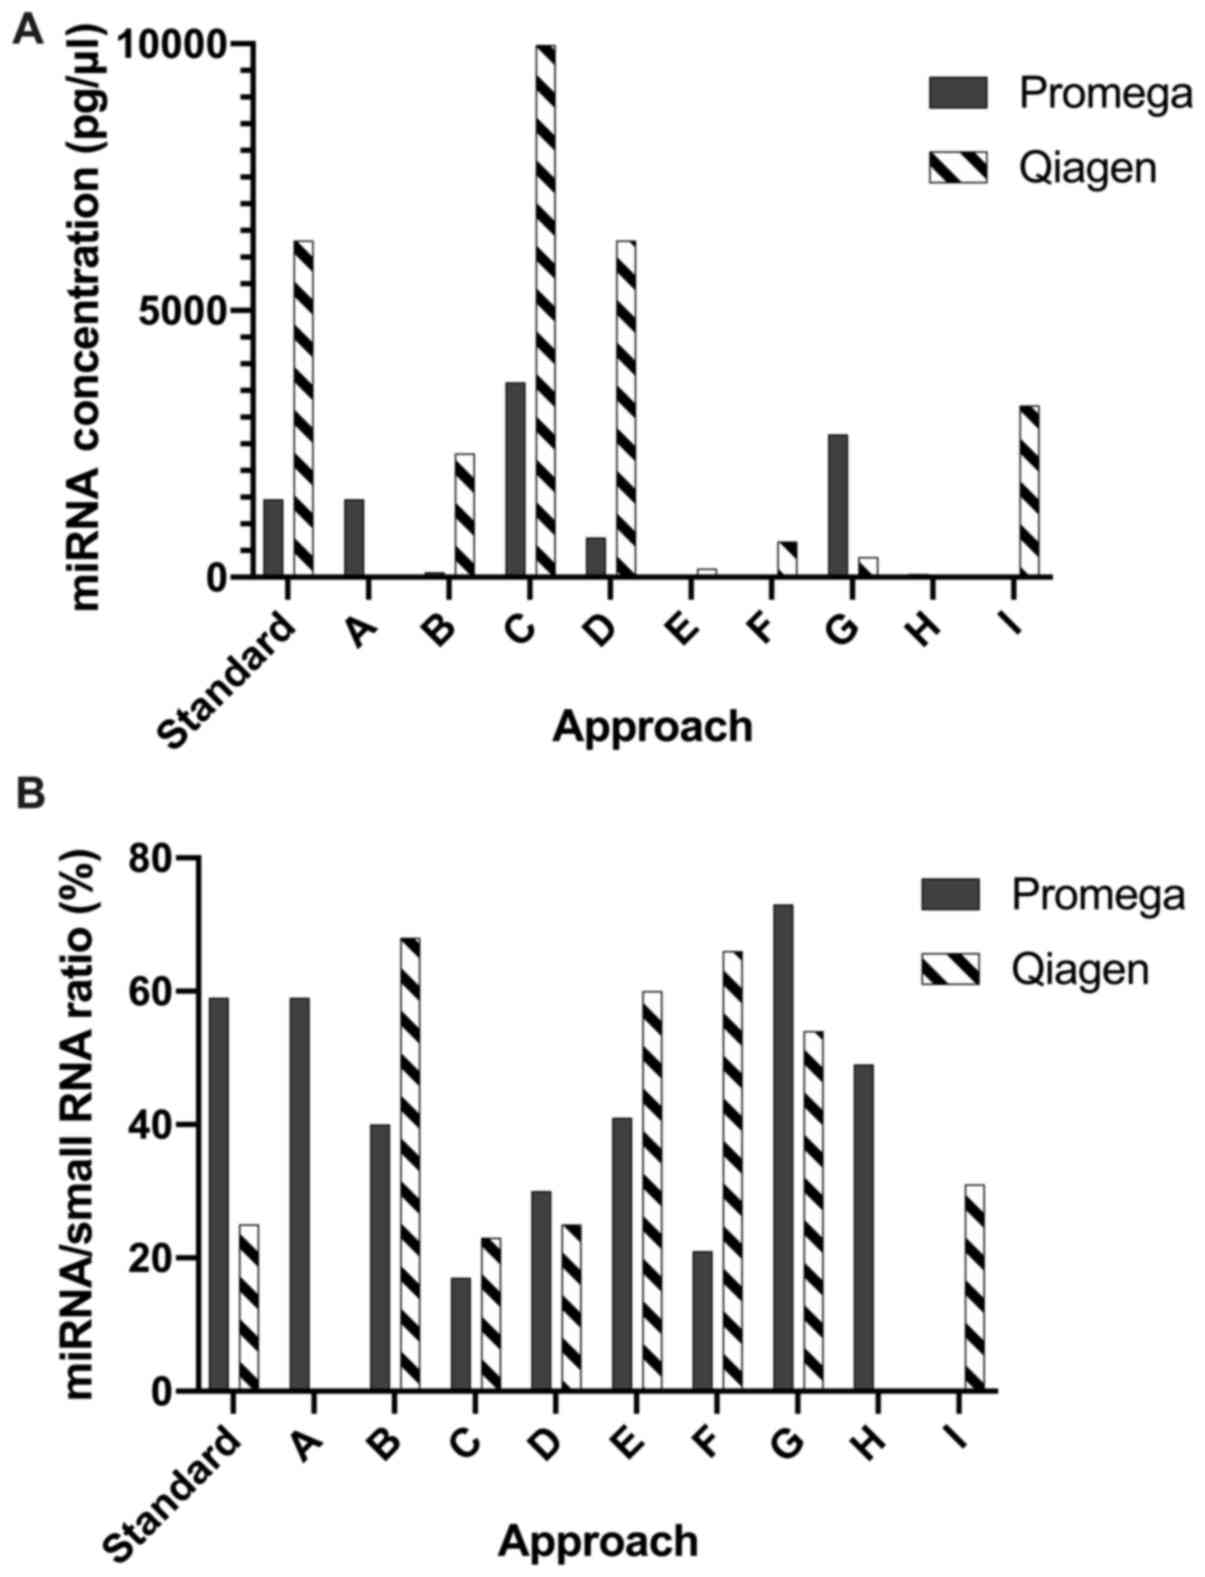
Five replicates were performed for each approach
investigated. Extracted RNA was assessed for quality and quantity
[miRNA/small RNA ratio (%) and miRNA concentration (pg/µl)] using
an Agilent Small RNA Chip (5067–1548; Agilent Technologies) and
2100 Bioanalyzer (G2939BA; Agilent Technologies) according to
manufacturers' instructions.
miRNA quantification
cDNA was synthesised using the miRCURY LNA RT kit
(339340; Qiagen) with a total reaction volume of 10 µl and a minor
modification. Specifically, during step (2), 0.5 µl of UniSp6 and cel-miR-39-3p
spike-in mix, (339390, RNA spike-in kit; Qiagen) (Table II) was diluted 1:5 in nuclease free
water and added to the RT reaction mix. Reverse
transcription-quantitative PCR (RT-qPCR) was performed using the
miRCURY LNA® SYBR® Green PCR kit (339346;
Qiagen) and 14 miRNA primers (Table
II). To minimise run-to-run variation, one replicate for each
extraction approach (Table I) was
combined with every primer in duplicate upon each 384-well plate. A
2-step cycling qPCR protocol (95°C for 2 min followed by 40 cycles
at 95°C for 10 sec and 56°C for 60 sec) was conducted using a
Bio-Rad CFX96, Real-time C1000 Touch Thermal Cycler (Bio-Rad
Laboratories, Ltd.). RT-qPCR involved no-template controls (no RNA
template nor UniSp6/cel-miR-39-3p spike-ins) (NTC) run with all 14
primers and no-Reverse Transcriptase controls (NRTC) run with the
hsa-miR-222-3p miRNA primer. Inhibition controls (no RNA template
but UniSp2, 4 and 5 or UniSp6/cel-miR-39-3p spike-ins added) were
also prepared to exclude spike-in contamination and run with miRNA
primer hsa-miR-222-3p. Replicates QG1 and QB1 run with miRNA primer
hsa-miR-451 were selected as inter-plate calibrators (IPC), and
performed in duplicate upon each 384-well plate.
Data analysis
Outliers
Cq values were calibrated between plates using IPC
as described by TATAA (46). Mean
Cq values and variance of duplicates performed for each extraction
approach were calculated for the 14 miRNA primers. Outliers were
identified and excluded (n=25) based upon a PCR efficiency of 1.9
for the miRCURY LNA® SYBR® Green PCR kit and
the anticipation of increasing Cq variance with decreasing miRNA
concentration (47) (Table III).
| Table III.RT-qPCR data outlier identification
method. |
Table III.
RT-qPCR data outlier identification
method.
| Mean Cq of
replicates | Maximal acceptable
range in Cq replicates |
|---|
| 25 | 0.5 |
| 26 | 0.5 |
| 27 | 0.5 |
| 28 | 0.5 |
| 29 | 0.5 |
| 30 | 0.5 |
| 31 | 0.5 |
| 32 | 0.8 |
| 33 | 1.1 |
| 34 | 1.5 |
| 35 | 2.1 |
Quality control
RNA extraction efficiency was measured using a
UniSp2, 4 and 5 spike-in mix, whereby the concentration of
UniSp2>UniSp4>UniSp5 with a 100-fold magnitude change each
time. Variance <2–3 Cqs within each dataset and ΔCq of 5–7
between spike-ins was desired. cDNA synthesis efficiency markers
(UniSp6 and cel-miR-39-3p) were expected to have a target variance
<2 Cqs. Haemolysis levels were measured by ΔCq = mean Cq
hsa-miR-23a-mean Cq hsa-miR-451, whereby ΔCq >5 or >7
indicated possible vs. high-risk of haemolysis, respectively, as
guided by the manufacturer (23).
Relative expression
For each approach under investigation, normalisation
was performed by calculating the geometric mean of three
stably-expressed miRNAs in plasma, (hsa-miR-423-3p, hsa-miR-103a-3p
and hsa-miR-191-5p). Relative quantification was based upon the
ΔΔCq method (48), whereby the
standard manufacturer's approach (A and D; Table I) was used as the control comparator
for Promega and Qiagen samples respectively. Fold change was
calculated by 2(−ΔΔCq) and confidence intervals of ΔΔCq
log transformed by 2−(ΔΔCq+/−confidence interval)
(48).
Statistical analysis
Data were first checked for normality (Shapiro-Wilk
test). For two-way comparisons (e.g. Bioanalyzer data), if the
Gaussian distribution was satisfied, unpaired t-tests with Welch's
correction (due to unequal standard deviations in the populations
being compared) were performed, else the Mann-Whitney U test was
used. For ≥3-way comparisons (e.g. comparing multiple approaches),
Welch's ANOVA and post hoc Dunnett's T3 multiple comparisons test
were used. Statistics were performed in GraphPad Prism version 8,
with P<0.05 deemed statistically significant.
Results
Bioanalyzer data
miRNA concentration and percentage did not
significantly differ between the standardised or optimised Promega
and Qiagen extraction approaches [A-I (Table I)] (P=0.09 and P=0.94, respectively,
unpaired t-test with Welch's correction) (Fig. 3).
qPCR data
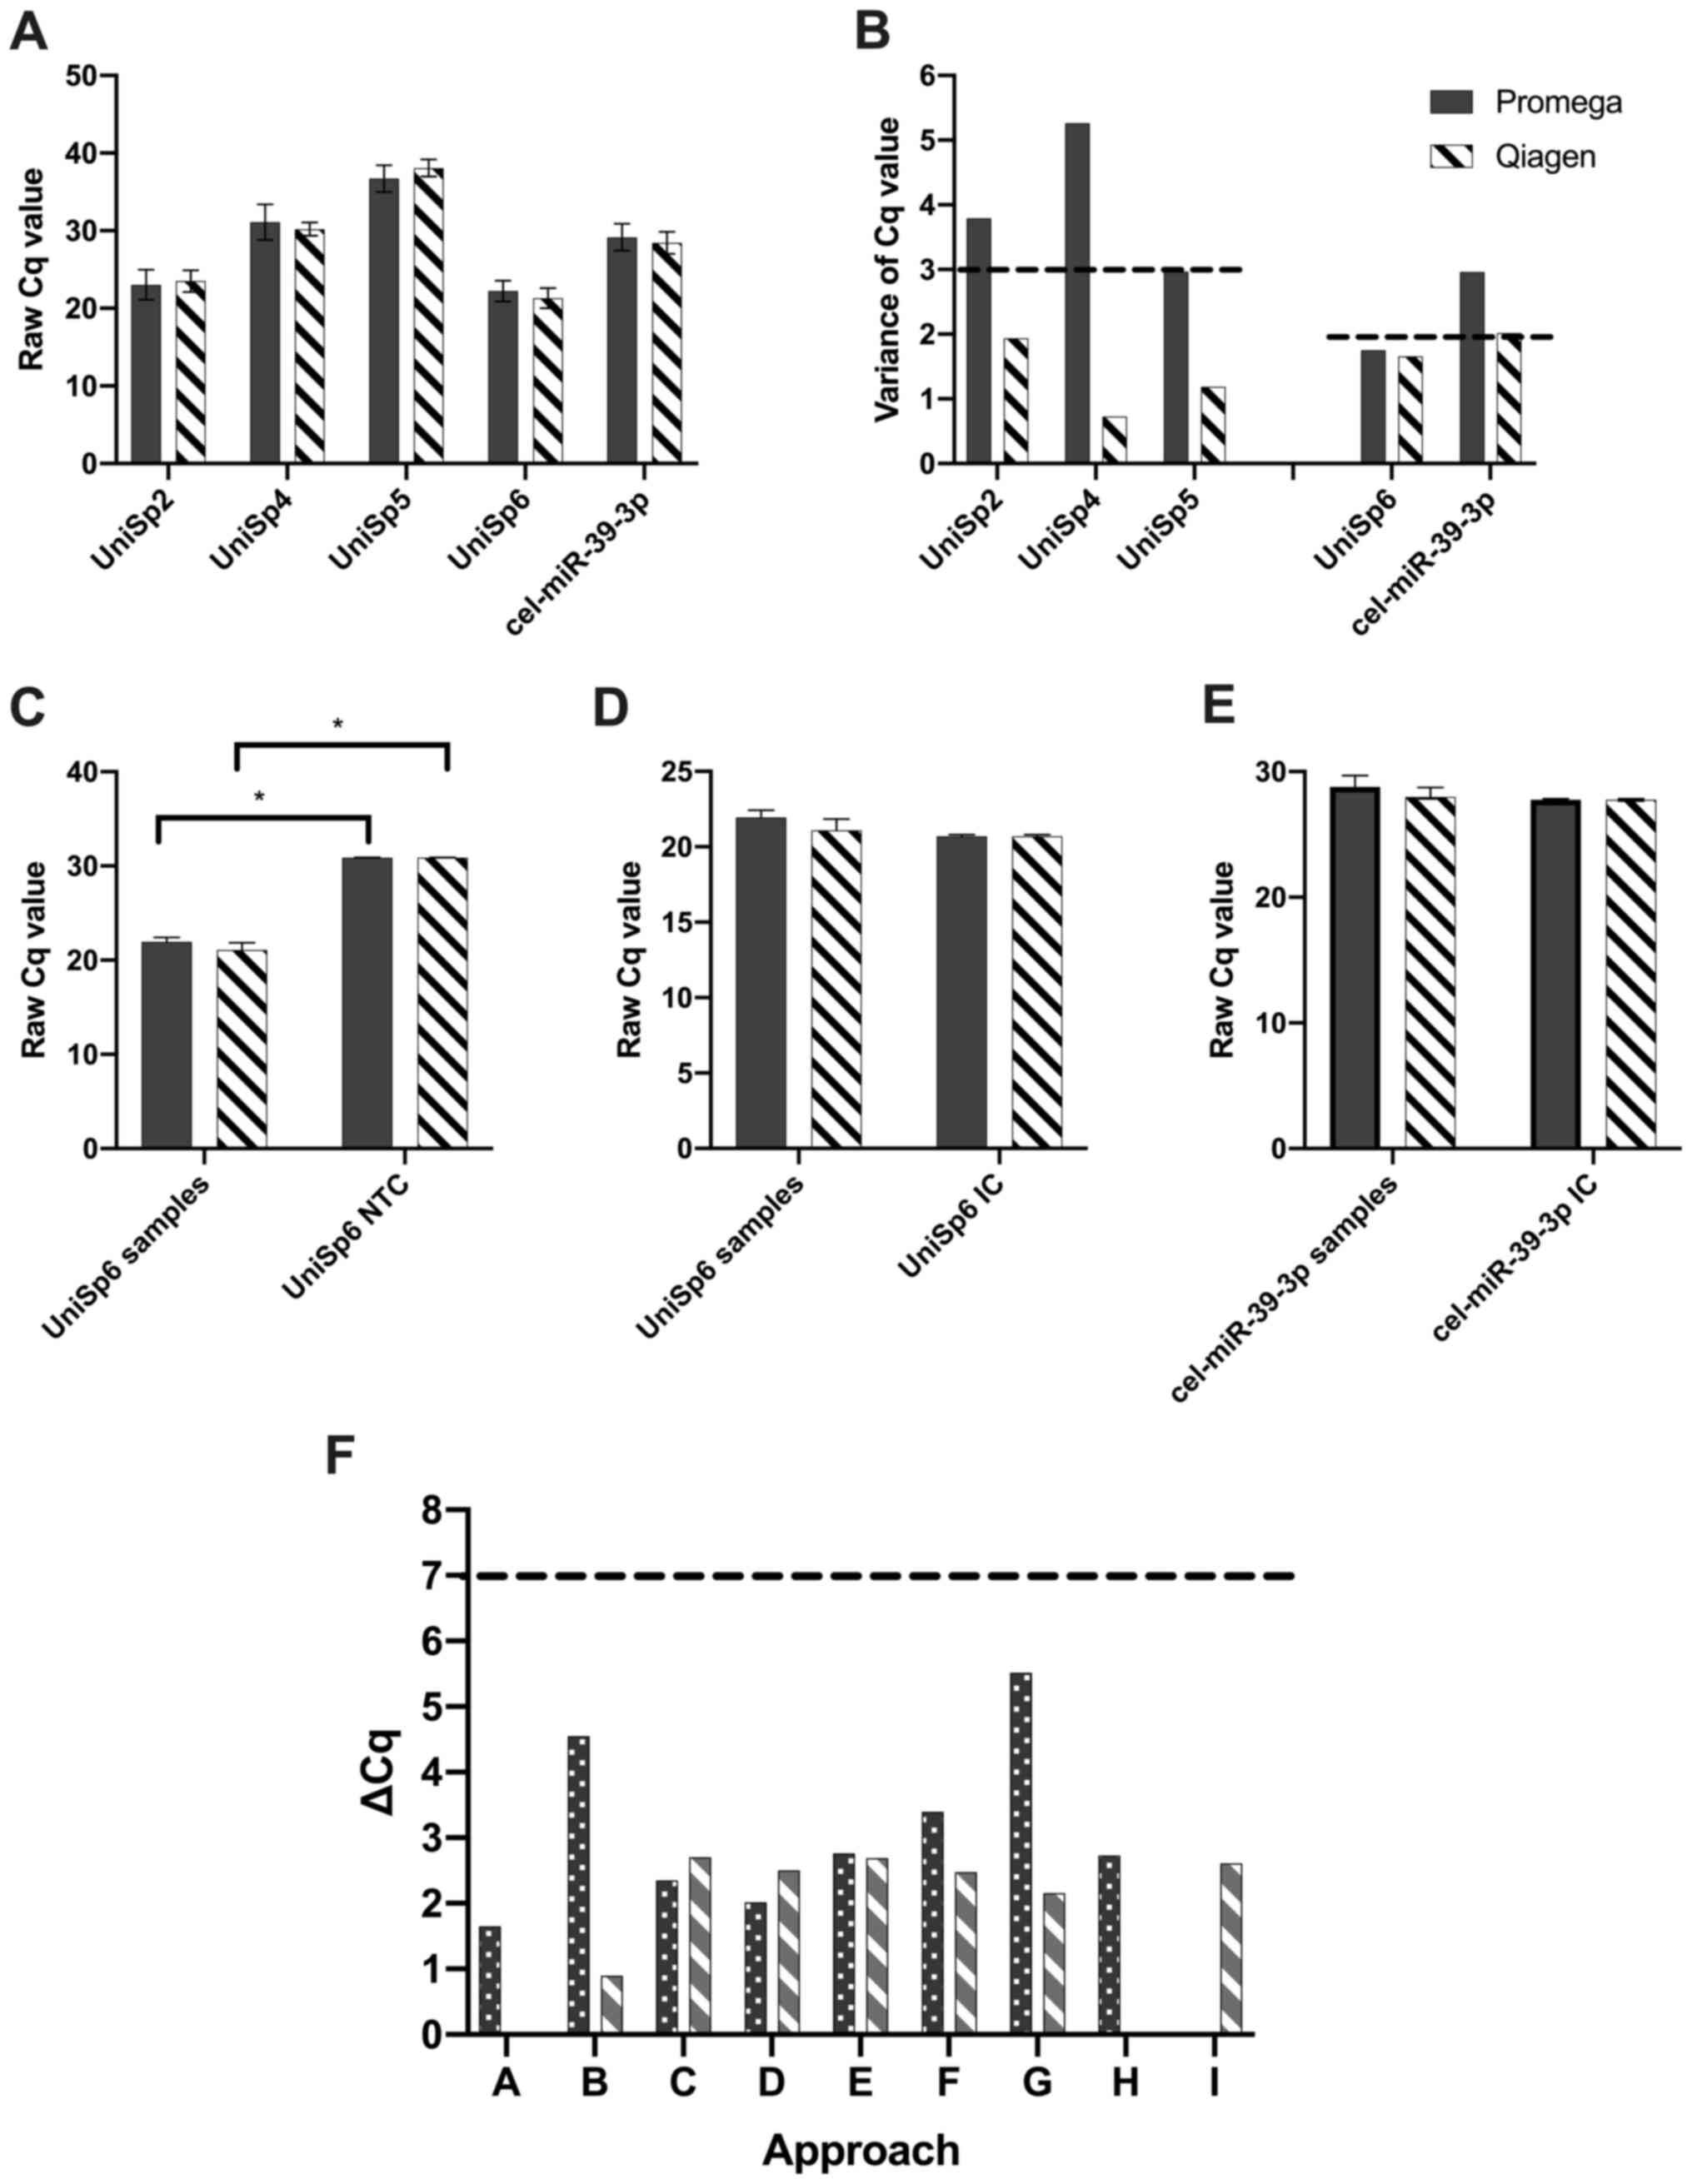
Quality control
Studying the Promega approaches, fold changes
between the RNA extraction efficiency spike-ins were higher than
desired, with UniSp4-UniSp2 of 8.05, UniSp5-UniSp4 of 5.63 (target
5–7) (Fig. 4A) and variance within
the spike-ins ranging between 2.96 and 5.26 Cqs (target <3 Cq)
(Fig. 4B). The Qiagen approaches
were generally more in range, with UniSp4-UniSp2 of 6.69,
UniSp5-UniSp4 of 7.88 (target 5–7) (Fig. 4A) and variance within the spike-ins
ranging between 0.72 and 1.90 Cqs (target <3 Cq) (Fig. 4B). In both kits, UniSp6 Cq values
were higher in the NTCs compared to samples (Promega P=0.0006;
Qiagen P=0.0008; Mann-Whitney U test) (Fig. 4C). Despite this, a comparison of the
global mean UniSp6 values across all samples vs. the inhibition
controls suggested that RNA inhibitors did not significantly affect
the PCR reaction (Promega P=0.07; Qiagen P=0.58; Mann-Whitney U
test) (Fig. 4D). This was confirmed
by comparing the global mean cel-miR-39-3p values across all
samples vs. cel-miR-39-3p Cq values in the inhibition controls
(Promega P=0.13; Qiagen P=0.52; Mann-Whitney U test) (Fig. 4E). Samples were not haemolysed in
any approach analysed, with all values <7 (Fig. 4F) (23).
Comparison of standard vs. optimised
approaches
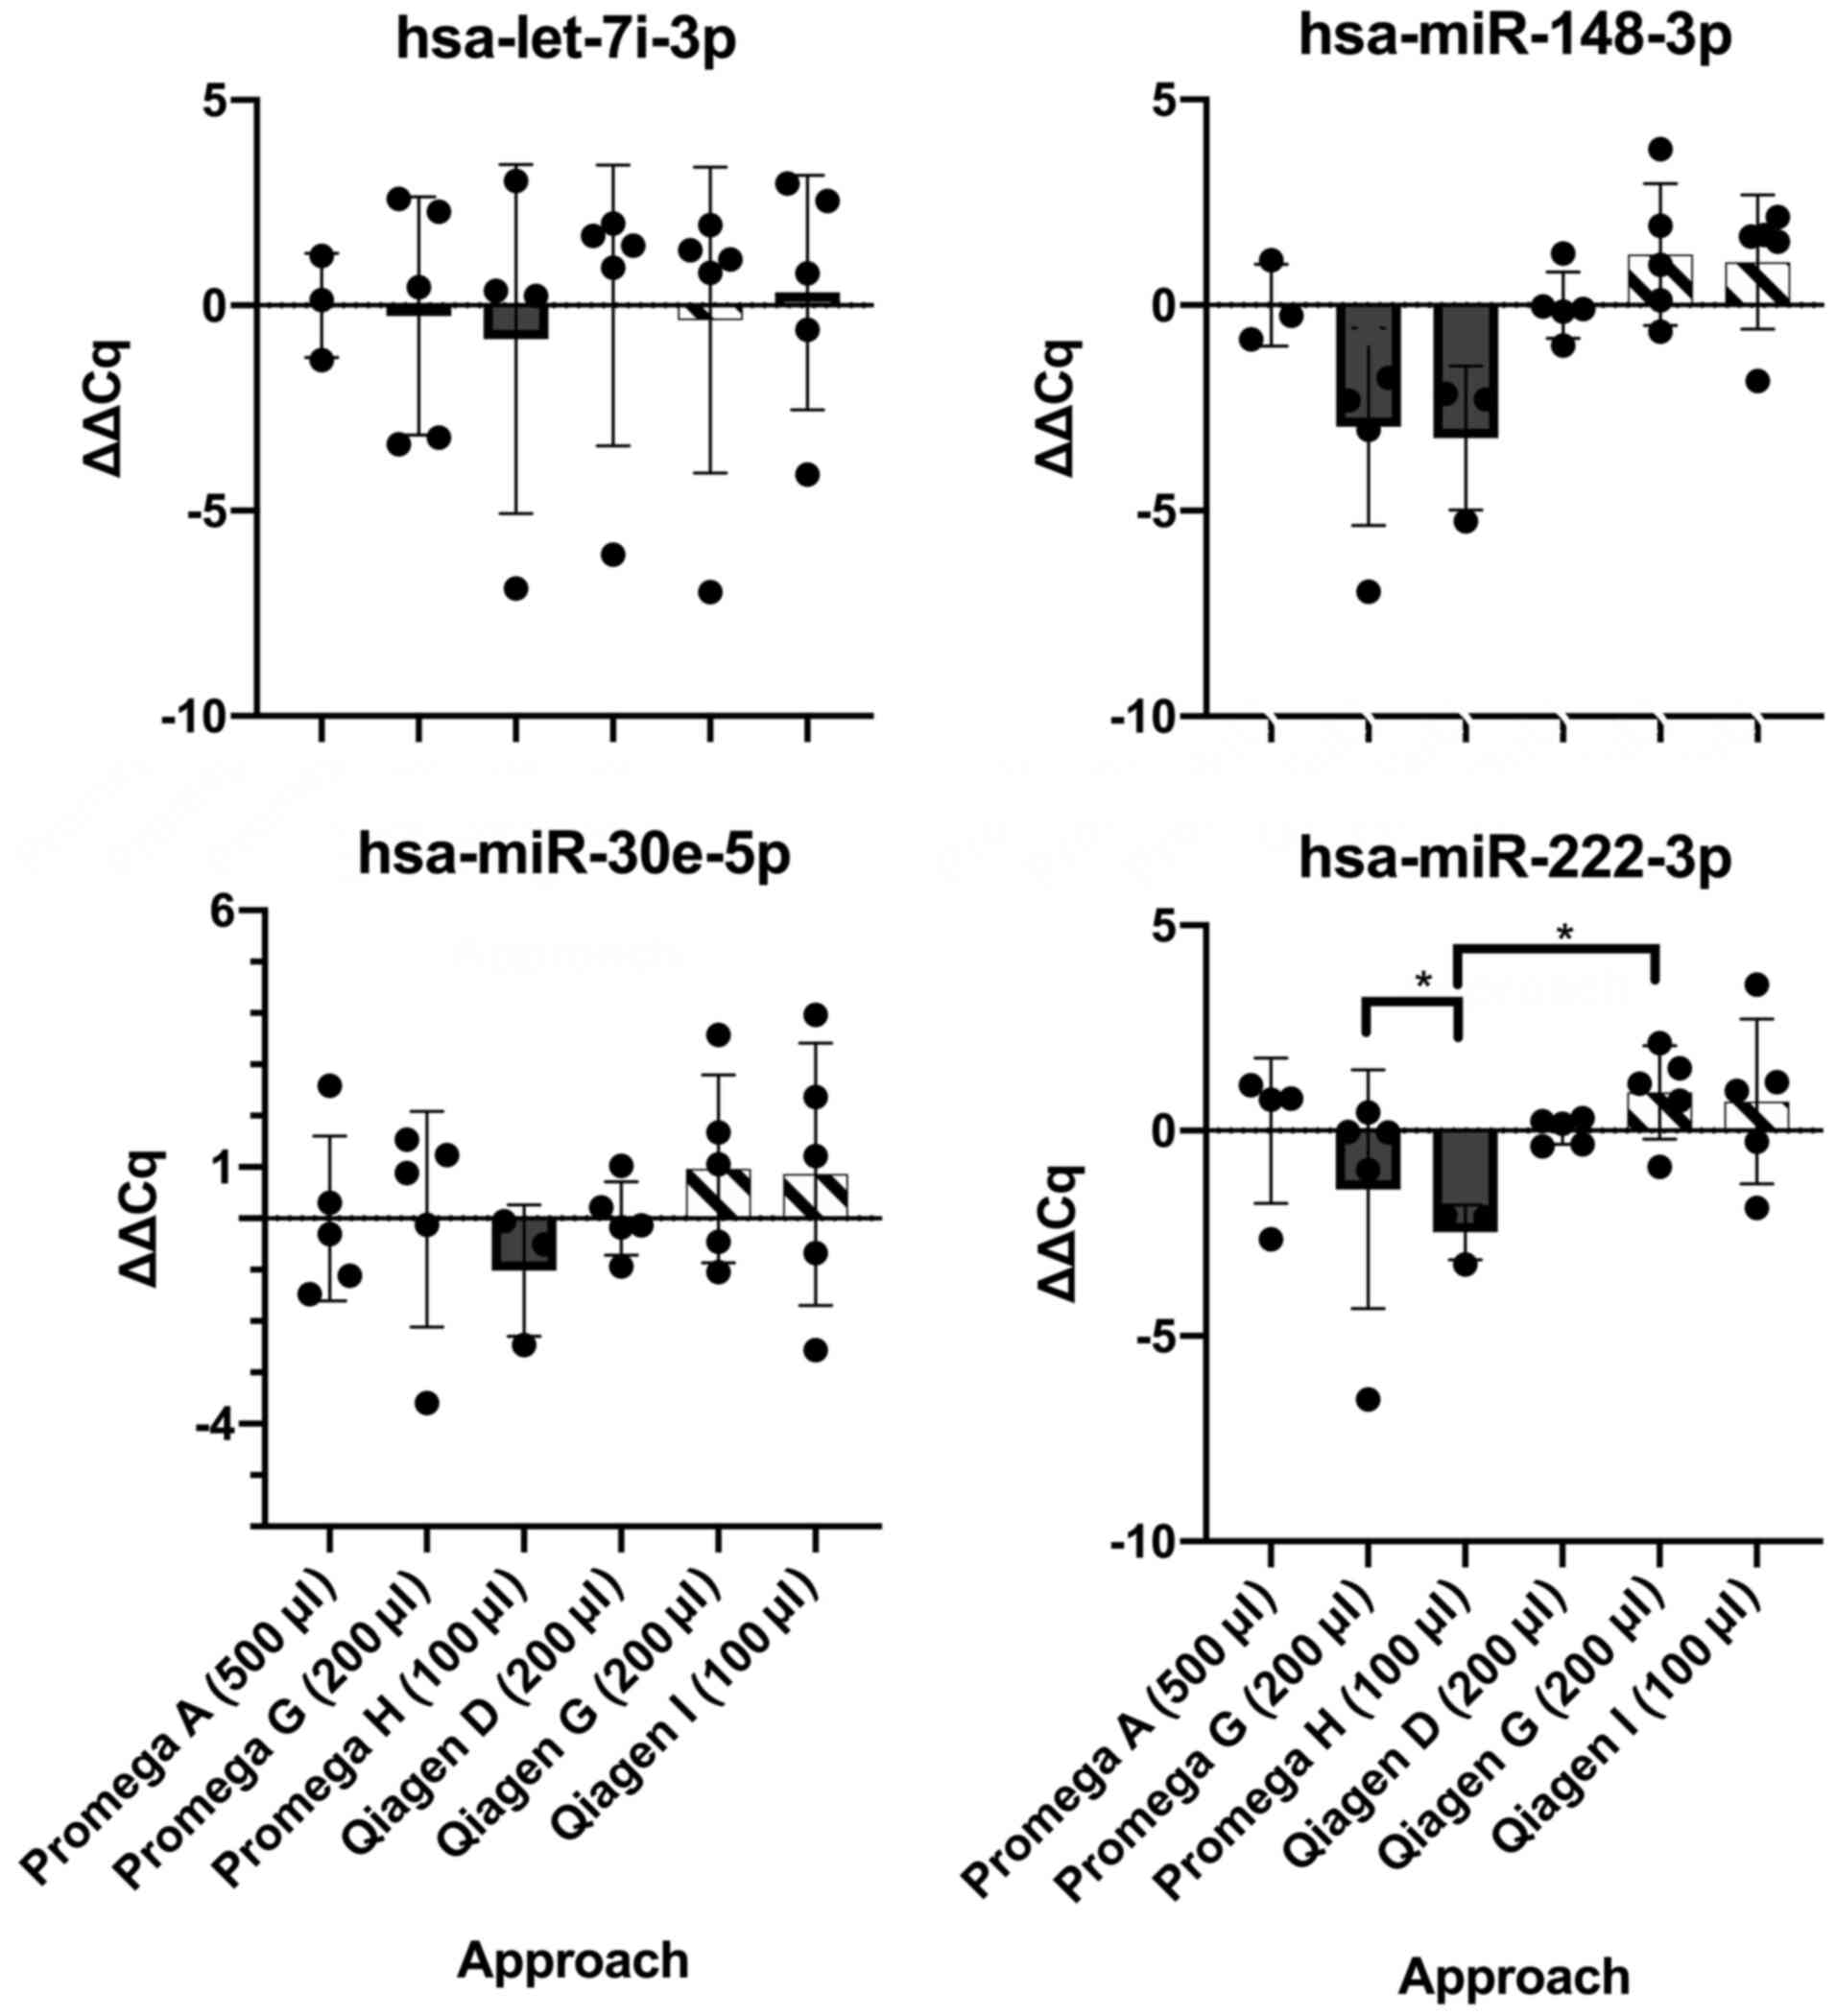
i) Optimisation of plasma input volume. Analysing
ΔΔCq values across all four miRNA of interest (Table II), only one miRNA (hsa-miR-222-3p)
revealed a significant difference between plasma input volumes
using the Promega extraction kit (Welch's ANOVA test W=10.58,
P=0.02). Upon post-hoc analysis, a significant difference existed
between the two optimisation approaches: 200 µl input + proteinase
K, no carriers (approach G; Table
I) vs. 100 µl (+ proteinase K, no carriers, approach H), P=0.02
(Dunnett's T3 multiple comparisons test). No significant difference
was found between the standard Qiagen miRNA extraction approach
using 200 µl plasma [no proteinase K + MS2, (approach D)] vs. an
optimised approach using 100 µl plasma [no proteinase K + MS2,
(approach I)], with P>0.05 in all comparisons (Fig. 5).
Comparing Promega and Qiagen kits using all input
volumes revealed a significant difference in only one miRNA
(hsa-miR-222-3p) (Welch's ANOVA test W=6.47, P=0.01), with a
significant post-hoc analysis for the comparison between Promega
100 µl [+ proteinase K, no carriers, (approach H)] and Qiagen 200
µl [+ proteinase K, no carriers, (approach G)] (P=0.02, Dunnett's
T3 multiple comparisons test) (Fig.
5).
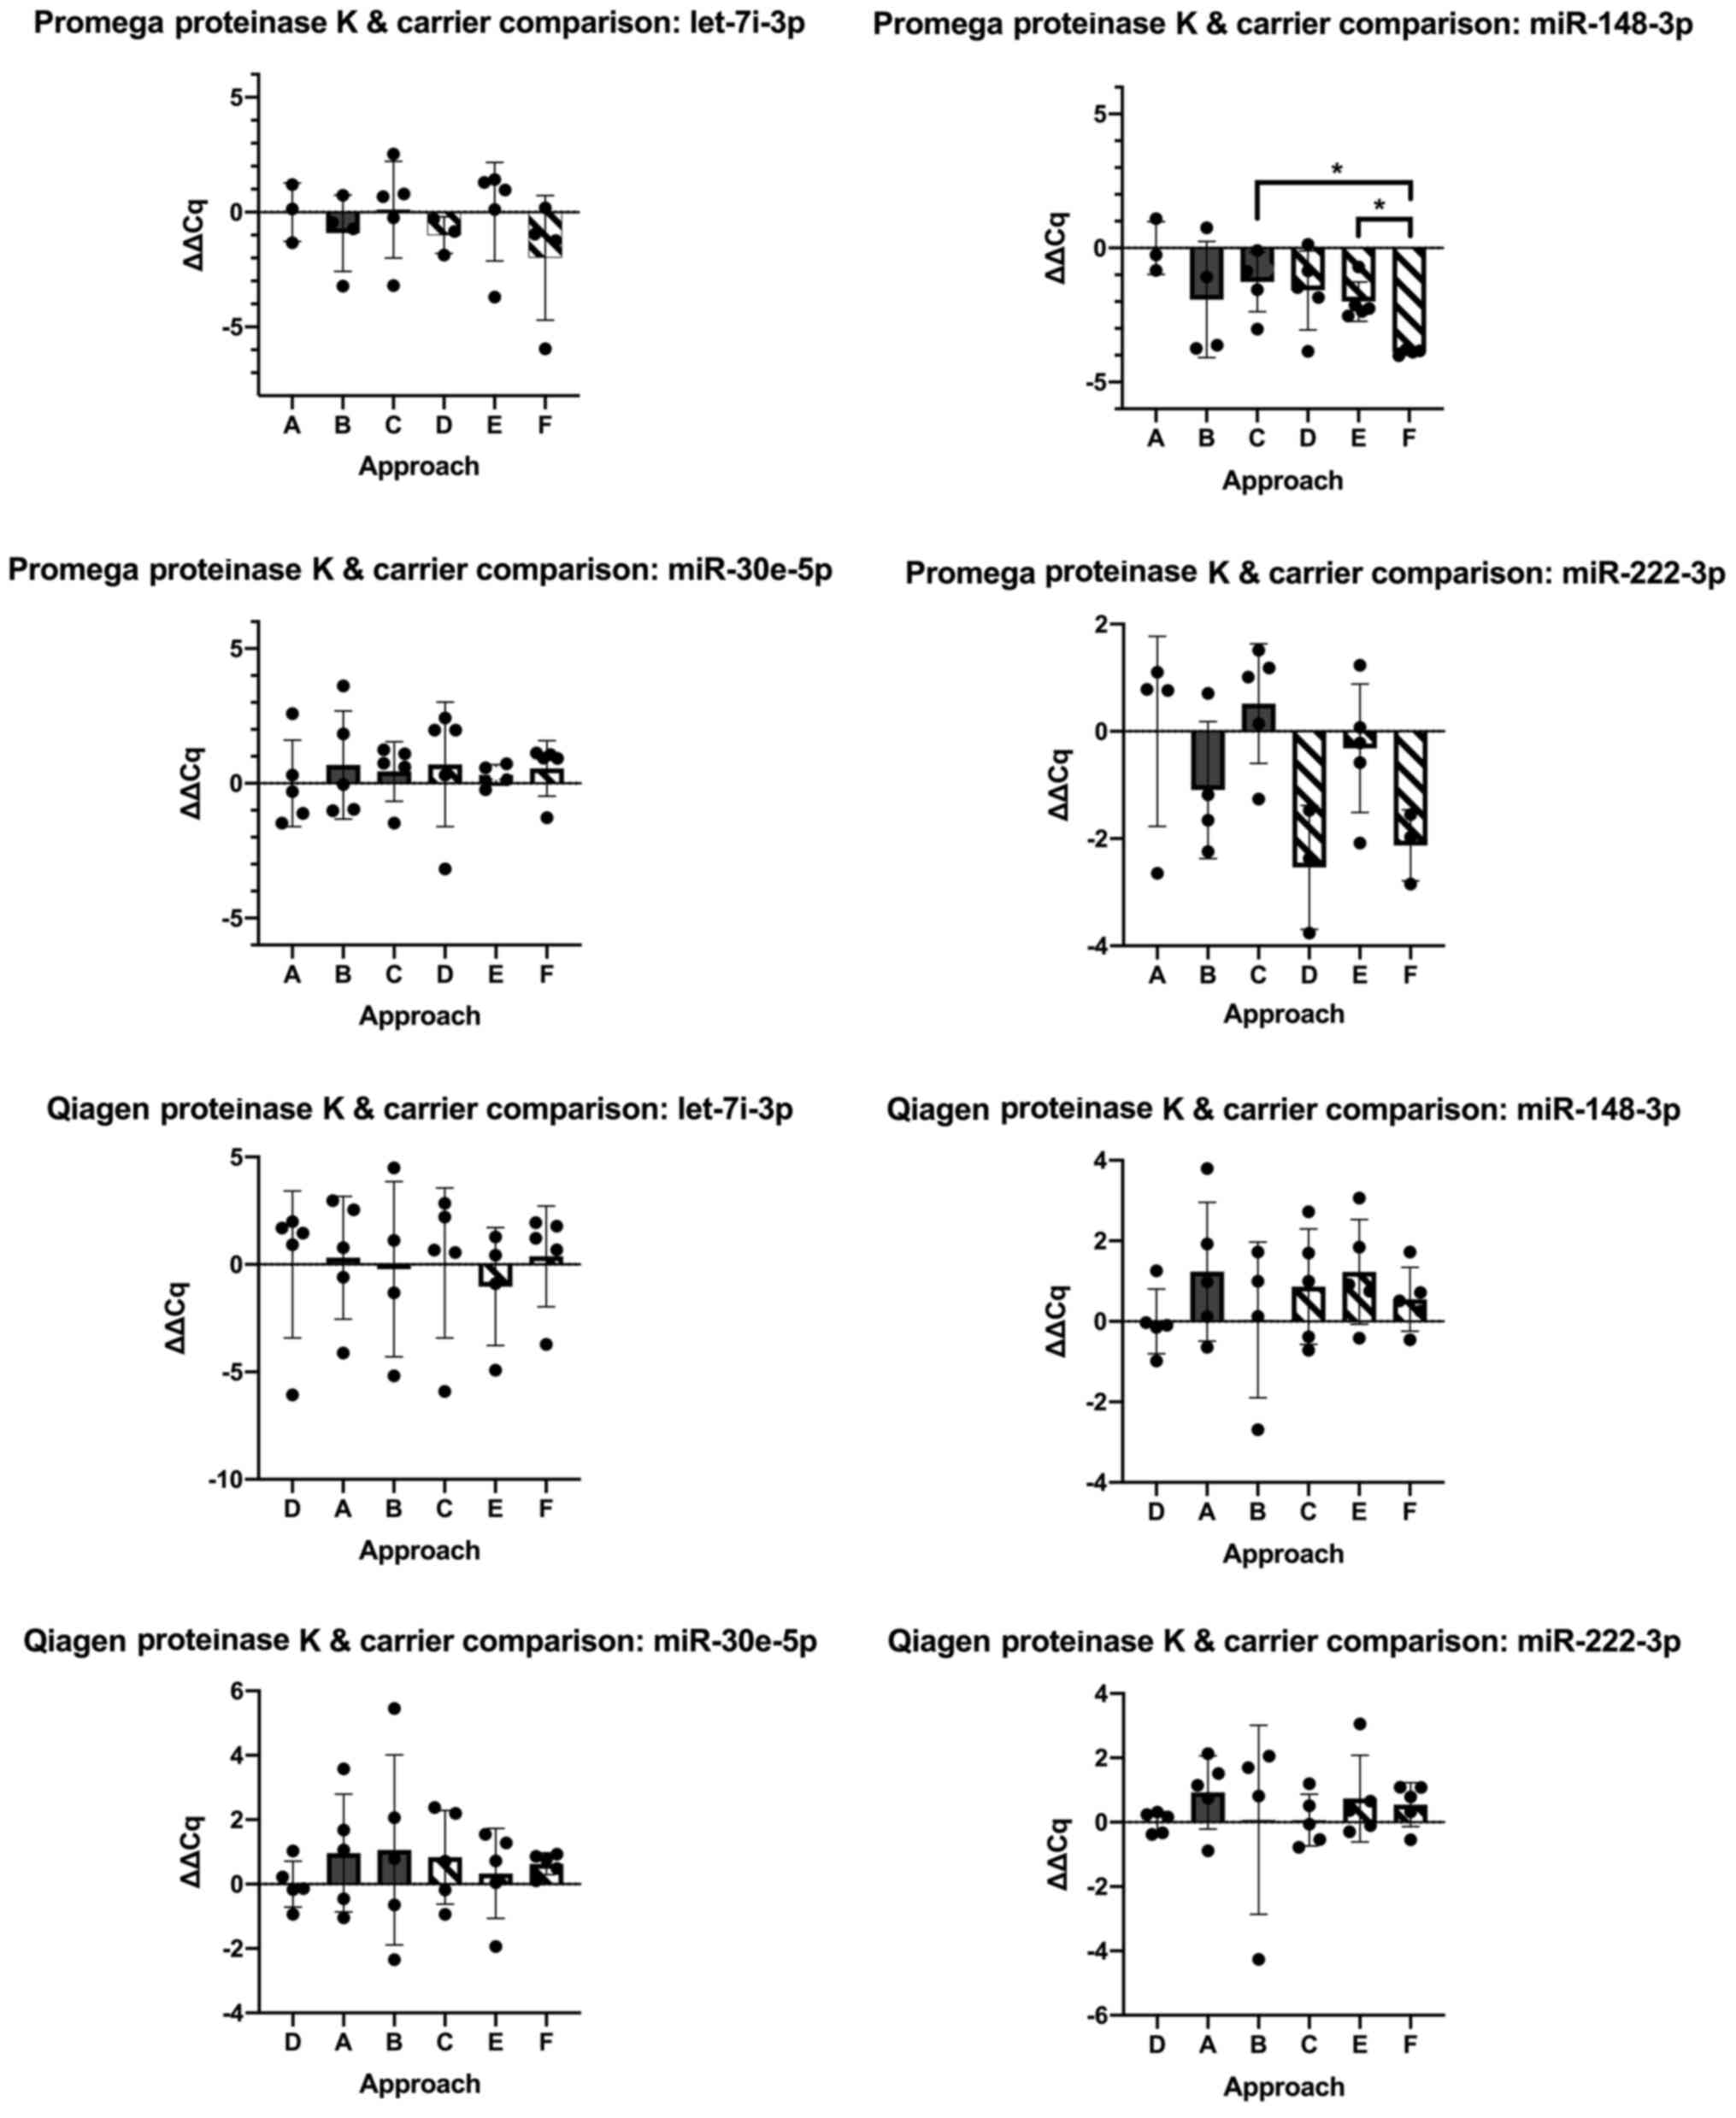
ii) Optimisation using Proteinase K, carriers MS2
and Glycogen. Comparing ΔΔCq from the standard [500 µl input +
proteinase K, no carriers, (approach A)] vs. optimised approaches
for the Promega kit, two miRNAs of interest showed significant
changes (hsa-miR-148-3p, Welch's ANOVA test W=17.29, P=0.0006 and
hsa-miR-222-3p, W=3.87, P=0.046). Using hsa-miR-148-3p, post-hoc
analysis revealed a significant difference comparing approach E
(500 µl input + proteinase K + Glycogen) vs. approach F (500 µl
input, no proteinase K + Glycogen) (P=0.04, Dunnett's T3 multiple
comparisons test); and approach C (500 µl input + proteinase K +
MS2) vs. approach F (P=0.048, Dunnett's T3 multiple comparisons
test). For hsa-miR-222-3p, all post-hoc comparisons were not
significant (P>0.05). Optimisation approaches using the Qiagen
kit were not significant (P>0.05 in all comparisons) (Fig. 6). As none of the optimisation
approaches performed upon either Promega or Qiagen kits improved
upon the performance of standard approaches, further comparisons
between kits were not performed.
Comparison of standard approaches
Promega vs. Qiagen
A comparison between ΔΔCq values for the Promega
standard approach [500 µl input + proteinase K, no carriers,
(approach A)] vs. that of the Qiagen kit [200 µl input, no
proteinase K + MS2, (approach D)] revealed no difference in
performance across the four miRNA of interest (P>0.05).
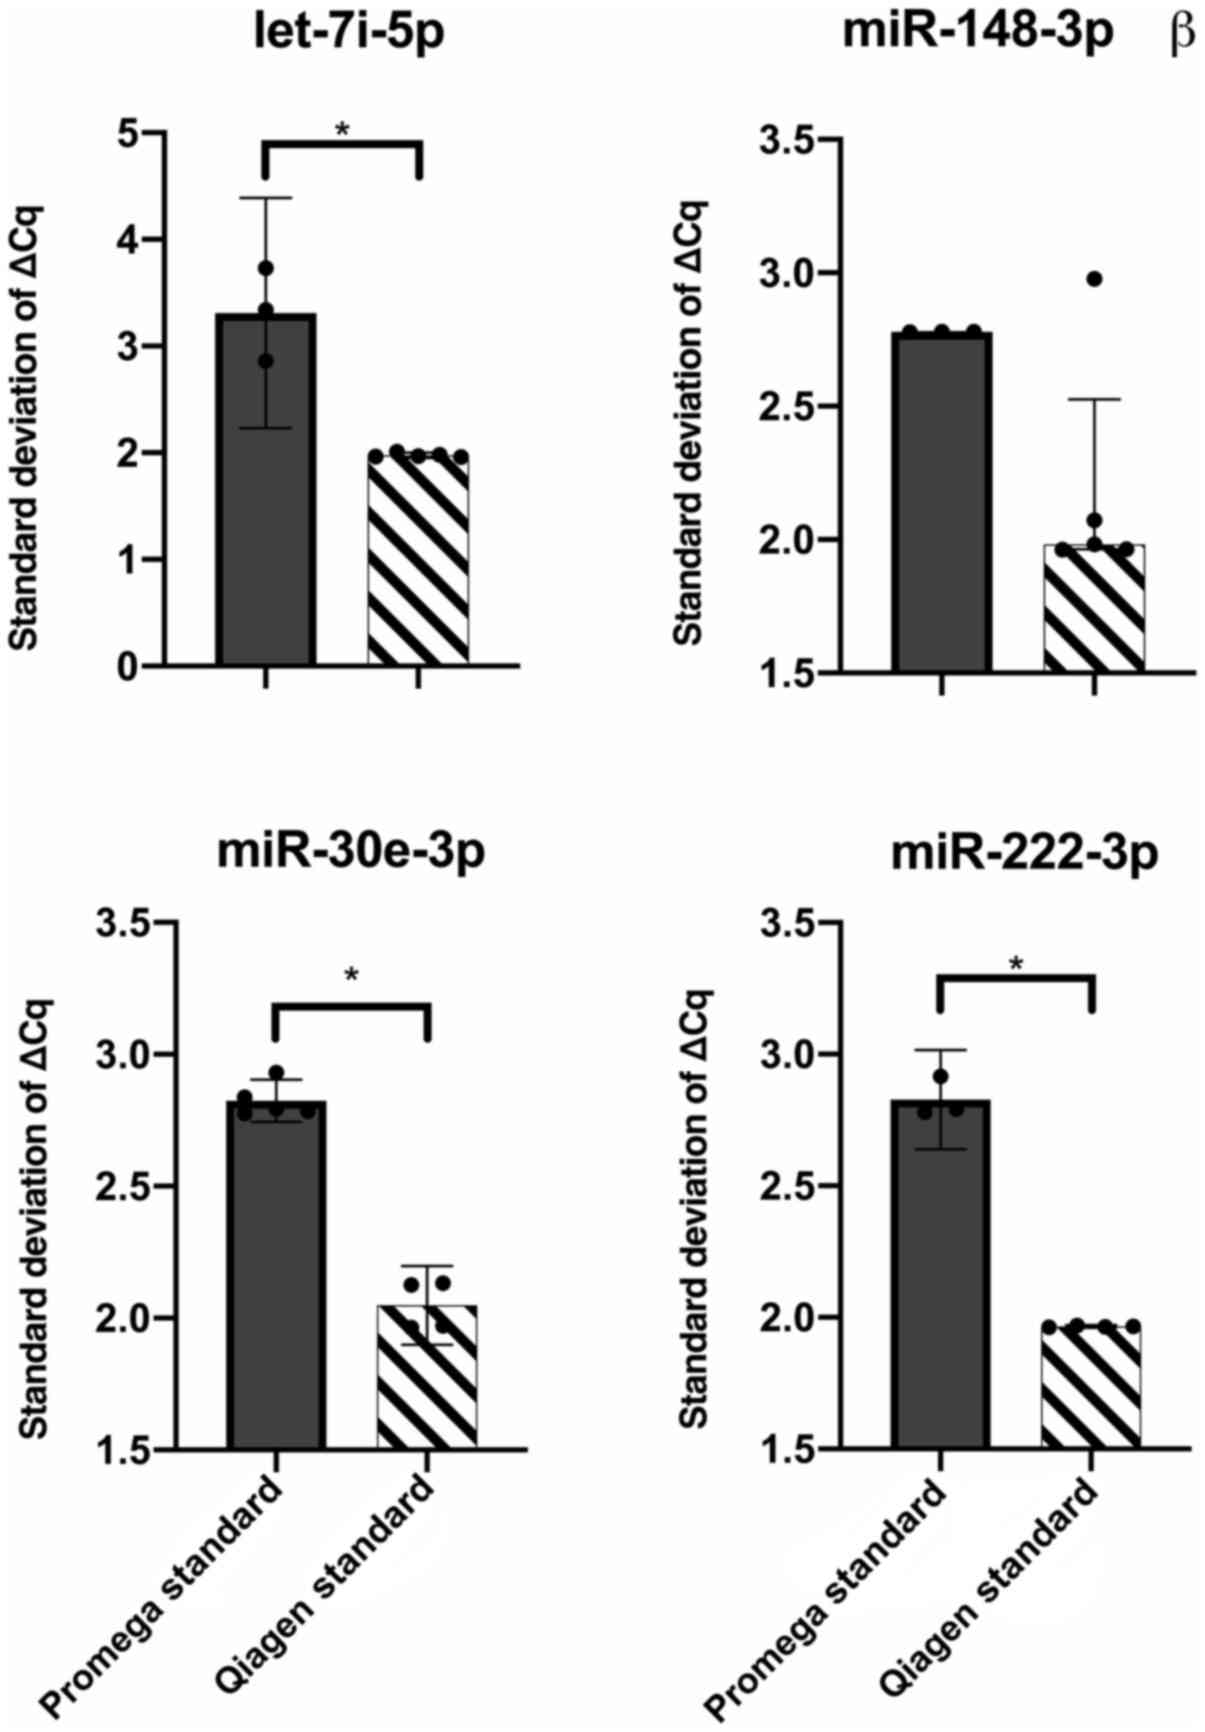
To determine which kit yielded more consistent
RT-qPCR results, the standard deviations of the ΔCq values for each
miRNA were compared, using the standard approaches for each kit.
Three out of four miRNAs were significantly different (let-7i-3p,
P=0.03, hsa-miR-30e-5p, P<0.0001, miR-222-3p, P=0.003, unpaired
t-test with Welch's correction), with higher variances observed
with the Promega kit (Fig. 7).
Discussion
The literature surrounding the optimal plasma miRNA
extraction kit for use in a healthy, low-risk pregnant population
is extremely limited, yet pre-clinical biomarker studies continue
to be published, seemingly precluding adequate investigation of
this crucial preliminary step. This study, comparing standard
manufacturer's methodology with attempts to optimise the efficiency
of the Qiagen miRNeasy Serum/Plasma kit and the Promega
Maxwell® RSC miRNA from Tissue or Plasma or Serum kit,
has revealed equivalent performance across the majority of
parameters investigated, including Bioanalyzer and RT-qPCR
comparisons. Specifically, miRNA percentage, concentration and the
ΔΔCq values of four stably expressed miRNAs of interest using
RTqPCR were not significantly different when comparing the kits in
terms of their standardised vs. optimised methodologies. However, a
difference did emerge concerning the consistency of the two kits,
with the standard Qiagen miRNeasy method producing lower ΔCq
standard deviation values for three out of four miRNAs under
study.
Attempts to optimise the individual performance of
the Qiagen kit were conclusively unsuccessful (no miRNAs differed),
whilst at first glance, this may appear less definitive for the
Promega kit, with 1–2 miRNAs differing between approaches.
Crucially, however, none of the optimisation approaches approved
upon standard manufacturer's protocol, with differences only
existing between the optimisation approaches themselves (200 vs.
100 µl input volume; Proteinase K use in the presence of a glycogen
carrier; or, the use of MS2 vs. glycogen). Proteinase K is a serine
protease; functioning to digest native proteins within the sample,
including nucleases, whilst lacking harmful DNase or RNase
activity. Interestingly, subtracting this enzyme (approach B) from
the standard manufacturer's approach (A), did not affect ΔΔCq
values across the four miRNA of interest, potentially suggesting
that it could be removed without adverse effect. However, given the
known differences in nuclease content and sample quality,
particularly when using different human samples, it would be wise
to retain this step to maximize miRNA recovery. Regarding input
volume for the Promega kit, lower ΔΔCq values were obtained using a
plasma volume of 100 vs. 200 µl for hsa-miR-222-3p, potentially
suggesting that the kit performed more efficiently using lower
starting volumes. However, this finding was not replicated amongst
the remaining three miRNAs of interest. Previous studies using the
miRNeasy biofluids kit found that doubling the input plasma volume
(from 100 to 200 µl) does not equate to a proportional increase in
miRNA recovery (24), due to
protein clogging or saturation of the elution column, although
others have failed to replicate this finding (49). It is possible that these inter-study
disparities reflect the use of differing miRNA of interest and the
varying ability of the kit to recover these molecules. The only way
to subvert this and conclude definitively would be to use a miRNA
panel, analysing many more different miRNAs simultaneously.
The unsuccessful optimisation of the standard Qiagen
mIRNeasy protocol is in contrast with previously published
literature using human plasma samples, suggesting that miRNA
recovery was improved by carriers such as glycogen (50) or yeast (42,51).
However, one of these studies used pig instead of human plasma for
the kit optimisation experiments, failing to re-test the findings
upon human samples; a precarious assumption given the known
variability in media and kit performance between different species
and disease states (25,35). Meanwhile, others have employed the
miRNeasy kit with the addition of glycogen (24) or low-dose yeast carriers (52) without first establishing whether
this modification outperforms standard methodology. Furthermore, a
different patient population was used within each of these studies,
(patients with inflammatory bowel disease, colorectal adenomas, or
healthy controls), rendering comparisons impossible.
To our knowledge this is the first published
comparison of the Qiagen miRNeasy serum/plasma and Promega
Maxwell® RSC miRNA from Tissue or Plasma or Serum kit.
Previous literature has compared the performance of the miRNeasy
serum/plasma kit to other commercially available products, finding
variable results; miRNeasy yielded one of highest miRNA yields and
purity (42,53,54)
being highly reproducible with minimal inter-operator variability
(51) vs. miRNeasy outperformed
(24,52,55) or
comparable performance (56).
Again, this is likely due to differences in the patient population
under study (healthy vs. diseased, males vs. females of different
ages), RNA input volume and the number of technical replicates
performed (49), with lower number
of replicates and high technical variance being associated with
false significant levels (24).
The Promega extraction kit uses a new, automated
paramagnetic miRNA extraction technique which confers many
advantages over traditional methods, not least minimizing the risks
of sample cross-contamination; safety concerns associated with the
handling of chemicals such as chloroform and phenol; issues
surrounding column saturation or protein clogging; and technical
variability between runs. Furthermore, the approach is highly
efficient and enables 16 samples to be processed simultaneously
within 70 min, which cannot be achieved using other commercially
available kits (e.g. miRNeasy), largely due to protocol time
limits, particularly within the column-based RNA binding, washing
and elution steps. During this study, the authors could
simultaneously process only 8–10 samples using the miRNeasy kit,
with a processing time of ~120 min. Higher simultaneous sample
processing is particularly advantageous for studies involving large
sample numbers, where rapid throughput on this preliminary step is
essential. Additionally, the increased elution volume using the
Promega kit (60 vs. 14 µl) is certainly advantageous to downstream
applications, enabling more experimental investigations and
replicates to be conducted with each individual sample, while
facilitating standardisation between experiments and batch
calibration. Lower elution volumes have been suggested to generate
more concentrated samples (42),
however this study and others have not found this (24). A final consideration is the
financial cost, with the per sample cost being slightly lower with
the Promega kit (£6.88 vs. £7.80 as of June 2020). Given the
automated Promega protocol and reduced user-input, the increased
variance of the standard methodology compared to the Qiagen kit was
surprising and could represent a batch extraction issue, as these
samples were extracted separately to the other optimisation
approaches.
The RNA extraction efficiency spike-ins within the
Promega approaches generated higher than expected Cq values, which
could be explained by the high degree of variance introduced by the
different optimisation techniques, rather than the presence of
RNAse contamination. This is supported by the high variance
observed within the individual spike-in data for UniSp2, 4 and 5.
However, further repeat experiments, potentially involving
additional purification steps would be needed to confirm or refute
this. We concur that the validity of this study was not diminished
by the suggestion of cDNA synthesis inhibitors within the quality
control analysis. Firstly, these inhibitors did not significantly
impair the RT-qPCR upon statistical analysis and secondly, such
quality control indicators are designed for samples extracted using
the same standardised methodology, which was not the case in this
study. It is clear that some optimisation approaches (e.g. H in
Promega), were detrimental to miRNA extraction, generating Cq
values >40 and hence the return of ‘no data’ for several
replicates, which would have raised the variance of the quality
control markers. The same applies for the RNA extraction quality
control spike-ins. A limitation of this study is that a
like-for-like comparison could not be made using the automated
miRNA extraction system manufactured by Qiagen; (QIAcube, 9001793),
and further studies should address this. Given the inter-individual
variation within human samples (57), further work should include repeating
these experiments using samples taken from several individuals to
validate the findings. The equivalent performance of the two
extraction kits sampled within this study, suggests that either
would be suitable when evaluating or setting up studies concerning
the miRNA profile of healthy pregnant women.
Acknowledgements
Not applicable.
Funding
VLP's salary as a Clinical Research Fellow and the
laboratory consumables within the present study were funded by two
large grants (grant nos. CA154 and CA184) from Weston Park Cancer
Charity, Sheffield, UK.
Availability of data and materials
The datasets used and/or analysed during the current
study are available from the corresponding author on reasonable
request.
Authors' contributions
VLP was involved in study conceptualization, data
curation, methodology, project administration, formal analysis,
funding acquisition, visualization and original draft preparation,
and provided resources. BFC was involved in acquisition of data,
methodology and original draft preparation. VLP and BFC confirmed
the authenticity of the raw data. EG and BM were involved in
acquisition of data, methodology and formal analysis. SW was
involved in acquisition of data, methodology, resources, and
supervision of the laboratory and writing. AP and PRH developed the
methodology, provided resources, supervised the study, and reviewed
and edited the manuscript. All authors read and approved the final
manuscript.
Ethics approval and consent to
participate
Ethics approval was obtained from the North East
Newcastle and North Tyneside 1 NHS Research Ethics Committee, UK,
reference 16/NE/0292. Written consent was taken from all
participants.
Patient consent for publication
Covered within the ethics application 16/N3/0292. No
patient identifiable information is presented within the
manuscript.
Competing interests
The authors declare that they have no competing
interests.
References
|
1
|
Hobert O: Gene regulation by transcription
factors and microRNAs. Science. 319:1785–1786. 2008. View Article : Google Scholar : PubMed/NCBI
|
|
2
|
Croce CM and Calin GA: miRNAs, cancer, and
stem cell division. Cell. 122:6–7. 2005. View Article : Google Scholar : PubMed/NCBI
|
|
3
|
Hammond SM: An overview of microRNAs. Adv
Drug Deliv Rev. 87:3–14. 2015. View Article : Google Scholar : PubMed/NCBI
|
|
4
|
He L, Thomson JM, Hemann MT,
Hernando-Monge E, Mu D, Goodson S, Powers S, Cordon-Cardo C, Lowe
SW, Hannon GJ, et al: A microRNA polycistron as a potential human
oncogene. Nature. 435:828–833. 2005. View Article : Google Scholar : PubMed/NCBI
|
|
5
|
Alrob OA, Khatib S and Naser SA: MicroRNAs
33, 122, and 208: A potential novel targets in the treatment of
obesity, diabetes, and heart-related diseases. J Physiol Biochem.
73:307–314. 2017. View Article : Google Scholar : PubMed/NCBI
|
|
6
|
Creemers EE, Tijsen AJ and Pinto YM:
Circulating microRNAs: Novel biomarkers and extracellular
communicators in cardiovascular disease? Circ Res. 110:483–495.
2012. View Article : Google Scholar : PubMed/NCBI
|
|
7
|
Chen X, Ba Y, Ma L, Cai X, Yin Y, Wang K,
Guo J, Zhang Y, Chen J, Guo X, et al: Characterization of microRNAs
in serum: A novel class of biomarkers for diagnosis of cancer and
other diseases. Cell Res. 18:997–1006. 2008. View Article : Google Scholar : PubMed/NCBI
|
|
8
|
Fayyad-Kazan H, Bitar N, Najar M, Lewalle
P, Fayyad-Kazan M, Badran R, Hamade E, Daher A, Hussein N, ElDirani
R, et al: Circulating miR-150 and miR-342 in plasma are novel
potential biomarkers for acute myeloid leukemia. J Transl Med.
11:312013. View Article : Google Scholar : PubMed/NCBI
|
|
9
|
Rossbach M: Therapeutic implications of
microRNAs in human cancer. J Nucleic Acids Investig. Feb
2–2011.(Epub ahead of print). doi: 10.4081/jnai.2011.2200.
View Article : Google Scholar
|
|
10
|
Mishra PJ: MicroRNAs as promising
biomarkers in cancer diagnostics. Biomark Res. 2:192014. View Article : Google Scholar : PubMed/NCBI
|
|
11
|
Cai M, Kolluru GK and Ahmed A: Small
molecule, big prospects: MicroRNA in pregnancy and its
complications. J Pregnancy. 2017:69727322017. View Article : Google Scholar : PubMed/NCBI
|
|
12
|
Morales-Prieto DM, Ospina-Prieto S,
Chaiwangyen W, Schoenleben M and Markert UR: Pregnancy-associated
miRNA-clusters. J Reprod Immunol. 97:51–61. 2013. View Article : Google Scholar : PubMed/NCBI
|
|
13
|
Morales Prieto DM and Markert UR:
MicroRNAs in pregnancy. J Reprod Immunol. 88:106–111. 2011.
View Article : Google Scholar : PubMed/NCBI
|
|
14
|
Gilad S, Meiri E, Yogev Y, Benjamin S,
Lebanony D, Yerushalmi N, Benjamin H, Kushnir M, Cholakh H, Melamed
N, et al: Serum microRNAs are promising novel biomarkers. PLoS One.
3:e31482008. View Article : Google Scholar : PubMed/NCBI
|
|
15
|
Kotlabova K, Doucha J and Hromadnikova I:
Placental-specific microRNA in maternal circulation -
identification of appropriate pregnancy-associated microRNAs with
diagnostic potential. J Reprod Immunol. 89:185–191. 2011.
View Article : Google Scholar : PubMed/NCBI
|
|
16
|
Chim SS, Shing TK, Hung EC, Leung TY, Lau
TK, Chiu RW and Lo YM: Detection and characterization of placental
microRNAs in maternal plasma. Clin Chem. 54:482–490. 2008.
View Article : Google Scholar : PubMed/NCBI
|
|
17
|
Hromadnikova I, Kotlabova K, Ivankova K,
Vedmetskaya Y and Krofta L: Profiling of cardiovascular and
cerebrovascular disease associated microRNA expression in umbilical
cord blood in gestational hypertension, preeclampsia and fetal
growth restriction. Int J Cardiol. 249:402–409. 2017. View Article : Google Scholar : PubMed/NCBI
|
|
18
|
Hromadnikova I, Dvorakova L, Kotlabova K
and Krofta L: The Prediction of gestational hypertension,
preeclampsia and fetal growth restriction via the first trimester
screening of plasma exosomal C19MC microRNAs. Int J Mol Sci.
20:29722019. View Article : Google Scholar
|
|
19
|
Sheikh AM, Small HY, Currie G and Delles
C: Systematic review of micro-RNA expression in pre-eclampsia
identifies a number of common pathways associated with the disease.
PLoS One. 11:e01608082016. View Article : Google Scholar : PubMed/NCBI
|
|
20
|
Zhu Y, Tian F, Li H, Zhou Y, Lu J and Ge
Q: Profiling maternal plasma microRNA expression in early pregnancy
to predict gestational diabetes mellitus. Int J Gynaecol Obstet.
130:49–53. 2015. View Article : Google Scholar : PubMed/NCBI
|
|
21
|
Zhao C, Dong J, Jiang T, Shi Z, Yu B, Zhu
Y, Chen D, Xu J, Huo R, Dai J, et al: Early second-trimester serum
miRNA profiling predicts gestational diabetes mellitus. PLoS One.
6:e239252011. View Article : Google Scholar : PubMed/NCBI
|
|
22
|
Yu Z, Han S, Hu P, Zhu C, Wang X, Qian L
and Guo X: Potential role of maternal serum microRNAs as a
biomarker for fetal congenital heart defects. Med Hypotheses.
76:424–426. 2011. View Article : Google Scholar : PubMed/NCBI
|
|
23
|
Blondal T, Jensby Nielsen S, Baker A,
Andreasen D, Mouritzen P, Wrang Teilum M and Dahlsveen IK:
Assessing sample and miRNA profile quality in serum and plasma or
other biofluids. Methods. 59:S1–S6. 2013. View Article : Google Scholar : PubMed/NCBI
|
|
24
|
McAlexander MA, Phillips MJ and Witwer KW:
Comparison of methods for miRNA extraction from plasma and
quantitative recovery of RNA from cerebrospinal fluid. Front Genet.
4:832013. View Article : Google Scholar : PubMed/NCBI
|
|
25
|
Ge Q, Shen Y, Tian F, Lu J, Bai Y and Lu
Z: Profiling circulating microRNAs in maternal serum and plasma.
Mol Med Rep. 12:3323–3330. 2015. View Article : Google Scholar : PubMed/NCBI
|
|
26
|
Glinge C, Clauss S, Boddum K, Jabbari R,
Jabbari J, Risgaard B, Tomsits P, Hildebrand B, Kääb S, Wakili R,
et al: Stability of circulating blood-based MicroRNAs -
pre-analytic methodological considerations. PLoS One.
12:e01679692017. View Article : Google Scholar : PubMed/NCBI
|
|
27
|
Brunet-Vega A, Pericay C, Quílez ME,
Ramírez-Lázaro MJ, Calvet X and Lario S: Variability in microRNA
recovery from plasma: Comparison of five commercial kits. Anal
Biochem. 488:28–35. 2015. View Article : Google Scholar : PubMed/NCBI
|
|
28
|
Avissar-Whiting M, Veiga KR, Uhl KM,
Maccani MA, Gagne LA, Moen EL and Marsit CJ: Bisphenol A exposure
leads to specific microRNA alterations in placental cells. Reprod
Toxicol. 29:401–406. 2010. View Article : Google Scholar : PubMed/NCBI
|
|
29
|
Maccani MA, Avissar-Whiting M, Banister
CE, McGonnigal B, Padbury JF and Marsit CJ: Maternal cigarette
smoking during pregnancy is associated with downregulation of
miR-16, miR-21, and miR-146a in the placenta. Epigenetics.
5:583–589. 2010. View Article : Google Scholar : PubMed/NCBI
|
|
30
|
Wang K, Yuan Y, Cho JH, McClarty S, Baxter
D and Galas DJ: Comparing the MicroRNA spectrum between serum and
plasma. PLoS One. 7:e415612012. View Article : Google Scholar : PubMed/NCBI
|
|
31
|
Ban E, Chae DK, Yoo YS and Song EJ: An
improvement of miRNA extraction efficiency in human plasma. Anal
Bioanal Chem. 409:6397–6404. 2017. View Article : Google Scholar : PubMed/NCBI
|
|
32
|
Tiberio P, Callari M, Angeloni V, Daidone
MG and Appierto V: Challenges in using circulating miRNAs as cancer
biomarkers. BioMed Res Int. 2015:7314792015. View Article : Google Scholar : PubMed/NCBI
|
|
33
|
McDonald JS, Milosevic D, Reddi HV, Grebe
SK and Algeciras-Schimnich A: Analysis of circulating microRNA:
Preanalytical and analytical challenges. Clin Chem. 57:833–840.
2011. View Article : Google Scholar : PubMed/NCBI
|
|
34
|
Feng X, Liu Y and Wan N: Plasma microRNA
detection standardization test. J Clin Lab Anal. 34:e230582020.
View Article : Google Scholar : PubMed/NCBI
|
|
35
|
Foye C, Yan IK, David W, Shukla N,
Habboush Y, Chase L, Ryland K, Kesari V and Patel T: Comparison of
miRNA quantitation by Nanostring in serum and plasma samples. PLoS
One. 12:e01891652017. View Article : Google Scholar : PubMed/NCBI
|
|
36
|
Moldovan L, Batte KE, Trgovcich J, Wisler
J, Marsh CB and Piper M: Methodological challenges in utilizing
miRNAs as circulating biomarkers. J Cell Mol Med. 18:371–390. 2014.
View Article : Google Scholar : PubMed/NCBI
|
|
37
|
Kloten V, Neumann MHD, Di Pasquale F,
Sprenger-Haussels M, Shaffer JM, Schlumpberger M, Herdean A, Betsou
F, Ammerlaan W, Af Hällström T, et al CANCER-ID consortium, :
Multicenter evaluation of circulating plasma MicroRNA extraction
technologies for the development of clinically feasible reverse
transcription quantitative PCR and next-generation sequencing
analytical work Flows. Clin Chem. 65:1132–1140. 2019. View Article : Google Scholar : PubMed/NCBI
|
|
38
|
Qiagen: miRCURY LNA miRNA PCR - Exosomes,
serum/plasma and other biofluid samples handbook. 2017, https://www.qiagen.com/fi/resources/resourcedetail?id=7ab5f614-f5d6-4bdc-b22b-246ec3601588&lang=en
|
|
39
|
Andreasen D, Fog JU, Biggs W, Salomon J,
Dahslveen IK, Baker A and Mouritzen P: Improved microRNA
quantification in total RNA from clinical samples. Methods.
50:S6–S9. 2010. View Article : Google Scholar : PubMed/NCBI
|
|
40
|
Ramón-Núñez LA, Martos L, Fernández-Pardo
Á, Oto J, Medina P, España F and Navarro S: Comparison of protocols
and RNA carriers for plasma miRNA isolation. Unraveling RNA carrier
influence on miRNA isolation. PLoS One. 12:e01870052017. View Article : Google Scholar : PubMed/NCBI
|
|
41
|
Danielson KM, Rubio R, Abderazzaq F, Das S
and Wang YE: High throughput sequencing of extracellular RNA from
human plasma. PLoS One. 12:e01646442017. View Article : Google Scholar : PubMed/NCBI
|
|
42
|
Moret I, Sánchez-Izquierdo D, Iborra M,
Tortosa L, Navarro-Puche A, Nos P, Cervera J and Beltrán B:
Assessing an improved protocol for plasma microRNA extraction. PLoS
One. 8:e827532013. View Article : Google Scholar : PubMed/NCBI
|
|
43
|
Gautam A, Kumar R, Dimitrov G, Hoke A,
Hammamieh R and Jett M: Identification of extracellular miRNA in
archived serum samples by next-generation sequencing from RNA
extracted using multiple methods. Mol Biol Rep. 43:1165–1178. 2016.
View Article : Google Scholar : PubMed/NCBI
|
|
44
|
Promega: Maxwell® RSC miRNA
Plasma and Serum Kit: Instructions for Use of Product AS1680.
https://www.promega.co.uk/products/nucleic-acid-extraction/rna/maxwell-rscmirna-tissue-plasma-serum-kit/?catNum=AS1460#protocols
|
|
45
|
Promega: Maxwell® RSC
Instrument, AS4500. https://www.promega.co.uk/products/lab-automation/maxwell-instruments/maxwell-rsc-instrument/?catNum=AS4500
|
|
46
|
Interplate Calibrator, Inter-run variation
compensation, SYBR Protocol. TATAA Biocenter AB; Göteborg: 2017
|
|
47
|
de Ronde MW, Ruijter JM, Lanfear D,
Bayes-Genis A, Kok MG, Creemers EE, Pinto YM and Pinto-Sietsma SJ:
Practical data handling pipeline improves performance of qPCR-based
circulating miRNA measurements. RNA. 23:811–821. 2017. View Article : Google Scholar : PubMed/NCBI
|
|
48
|
Livak KJ and Schmittgen TD: Analysis of
relative gene expression data using real-time quantitative PCR and
the 2(-Delta Delta C(T)) method. Methods. 25:402–408. 2001.
View Article : Google Scholar : PubMed/NCBI
|
|
49
|
El-Khoury V, Pierson S, Kaoma T, Bernardin
F and Berchem G: Assessing cellular and circulating miRNA recovery:
The impact of the RNA isolation method and the quantity of input
material. Sci Rep. Jan 20–2016.(Epub ahead of print). doi:
org/10.1038/srep19529. View Article : Google Scholar : PubMed/NCBI
|
|
50
|
Ford KL, Anwar M, Heys R, Ahmed EM, Caputo
M, Game L, Reeves BC, Punjabi PP, Angelini GD, Petretto E, et al:
Optimisation of laboratory methods for whole transcriptomic RNA
analyses in human left ventricular biopsies and blood samples of
clinical relevance. PLoS One. 14:e02136852019. View Article : Google Scholar : PubMed/NCBI
|
|
51
|
Rice J, Roberts H, Burton J, Pan J, States
V, Rai SN and Galandiuk S: Assay reproducibility in clinical
studies of plasma miRNA. PLoS One. 10:e01219482015. View Article : Google Scholar : PubMed/NCBI
|
|
52
|
Wong RK, MacMahon M, Woodside JV and
Simpson DA: A comparison of RNA extraction and sequencing protocols
for detection of small RNAs in plasma. BMC Genomics. 20:4462019.
View Article : Google Scholar : PubMed/NCBI
|
|
53
|
Meerson A and Ploug T: Assessment of six
commercial plasma small RNA isolation kits using qRT-PCR and
electrophoretic separation: higher recovery of microRNA following
ultracentrifugation. Biol Methods Protoc. 1:bpw0032016. View Article : Google Scholar : PubMed/NCBI
|
|
54
|
Burgos KL, Javaherian A, Bomprezzi R,
Ghaffari L, Rhodes S, Courtright A, Tembe W, Kim S, Metpally R and
Van Keuren-Jensen K: Identification of extracellular miRNA in human
cerebrospinal fluid by next-generation sequencing. RNA. 19:712–722.
2013. View Article : Google Scholar : PubMed/NCBI
|
|
55
|
Guo Y, Vickers K, Xiong Y, Zhao S, Sheng
Q, Zhang P, Zhou W and Flynn CR: Comprehensive evaluation of
extracellular small RNA isolation methods from serum in high
throughput sequencing. BMC Genomics. 18:502017. View Article : Google Scholar : PubMed/NCBI
|
|
56
|
Tan GW, Khoo AS and Tan LP: Evaluation of
extraction kits and RT-qPCR systems adapted to high-throughput
platform for circulating miRNAs. Sci Rep. 5:94302015. View Article : Google Scholar : PubMed/NCBI
|
|
57
|
Keller A, Rounge T, Backes C, Ludwig N,
Gislefoss R, Leidinger P, Langseth H and Meese E: Sources to
variability in circulating human miRNA signatures. RNA Biol.
14:1791–1798. 2017. View Article : Google Scholar : PubMed/NCBI
|