Introduction
Nonalcoholic fatty liver disease (NAFLD) is a
metabolic stress-induced liver injury closely associated with
insulin resistance (IR) and genetic susceptibility (1). The disease spectrum includes
nonalcoholic simple fatty liver (NAFL), nonalcoholic
steatohepatitis (NASH) and related liver cirrhosis and
hepatocellular carcinoma (1). With
economic development, unhealthy lifestyles and high-calorie diets
are increasing, leading to an increase in the incidence of NAFLD.
NAFLD affects ~25% of the adult population worldwide and brings a
huge burden to human wellbeing (2).
Therefore, the prevention and treatment of NAFLD are under
intensive focus worldwide.
The development of systemic biology and epigenetics
has provided an in-depth insight into the association between
genotype and phenotype of NAFLD (3). The epigenetic changes of NAFLD include
histone modification, DNA methylation and changes in microRNAs
(miRs/miRNAs). miRNAs are small, 18–25 nucleotide, non-coding,
highly conserved regulatory RNAs that regulate gene expression at
the post-transcriptional level (3,4). These
miRNAs regulate >30% of human mRNAs and are also involved in a
wide array of biological processes, including cell apoptosis,
differentiation, development, proliferation and metabolism
(5). The miRNAs that are closely
associated with NAFLD have been extensively studied (3–5).
miRNA-122 (miR-122) is the most abundant specific miRNA in the
liver, accounting for about 70% of the total miRNA in adult liver
(6). Previous studies have found
that the expression of miR-122 in the serum of NAFLD patients is
significantly increased (4,5) and in vitro studies demonstrate
that the overexpression of miR-122 enhances the activity of alanine
aminotransferase (7).
The current treatment model for NAFLD is weight loss
and comorbid management, without any specific drugs (8). In addition, improving the lifestyle is
an effective treatment for NAFLD, but it can be difficult for
individuals to abide by it. Some proposed medications have not
shown significant efficacy and long-term safety (9). Silibinin is a flavonoid compound and
the main component of silymarin in lipophilic milk thistle extract
that is widely used for treating liver diseases (9). A previous study demonstrated that
silibinin can enhance lipolysis by increasing the expression of
triglyceride lipase, thereby reducing liver fat production, and can
also downregulate the expression of genes, such as forkhead box O1,
phosphoenolpyruvate carboxykinase and glucose-6-phosphatase to
inhibit gluconeogenesis. Thus, silibinin improves high-fat-induced
fatty liver and IR. The underlying mechanism may be to reduce
visceral obesity, enhance lipolysis and inhibit gluconeogenesis
(10). However, a previous study
demonstrated that serum miR-122 levels and expression in NAFLD
patients and fatty liver cells are increased, respectively
(4), suggesting that silibinin and
miR-122 are associated with lipid metabolism and NAFLD; however,
the specific associations and mechanisms of action remain to be
elucidated. Therefore, the present study constructed an NAFLD model
using C57BL/6JC mice fed a high-fat diet (HFD) and the association
between miR-122 and NAFLD and lipid metabolism in the liver was
observed. Subsequently, silibinin was administered to this animal
model to investigate the intervention effect of silibinin on the
fatty liver of mice fed HFD and whether silibinin affected the
expression of miR-122. Finally, in the NAFLD model palmitic acid
(PA)-induced HepG2 cell line, miR-122 was regulated by transfection
of mimics and the intervention was effectuated by silibinin to
detect the expression levels of related lipid metabolism genes and
proteins. Whether silibinin could improve liver lipid metabolism
through the regulation of miR-122 was investigated. Therefore, the
pathogenesis of NAFLD and putative therapeutic targets were
revealed, providing a theoretical basis and novel ideas for
clinical medication.
Materials and methods
Animal experiments
A total of 36 male C57BL/6JC mice (age, 7 weeks)
were purchased from Beijing Vitong Lihua Experimental Animal
Technology Co., Ltd., and reared in the barrier system for animal
experiments in Clinical Research Center of Hebei Provincial
People's Hospital. Mice were maintained at 20–25°C with 40–60%
humidity and 12-h light/dark cycles. The mice were randomly divided
into two groups after 1 week of adaptive feeding: 12 mice in the
control group (normal diet, ND) and 24 mice in the high-fat diet
(HFD) group. In the HFD group, 60% calories were from fat, 20% from
protein and 20% from carbohydrates. After 4 weeks, the HFD group
was randomly divided into the HFD group and the HFD + silibinin
(SIL) group with 12 mice each. The HFD + SIL group was administered
54 mg/kg body weight of SIL daily intragastrically and the ND and
the HFD groups were administered with the same volume of normal
saline intragastrically. The adult (human) dose was converted to
the mouse dose in terms of body surface area based on the
pharmacological test methodology (11). At a dose per body weight, the
equivalent dose in mice was 9.1 times that in humans. The adult
dose of silibinin is based on the manufacturer's instructions.
Silibinin was mixed with food and fed to the mice (no anesthetic
was employed).
At the end of the 8-week feeding, the mice were
fasted overnight and anesthetized intraperitoneally with 1% sodium
pentobarbital at 60 mg/kg. The blood sample was withdrawn from the
eyeball and serum collected by centrifugation at 865 × g for 20 min
at 4°C and stored at −80°C for later use. Acute massive blood loss
in the orbital artery of mice was used and the mice succumbed
immediately.
After the mice succumbed, the liver was removed and
weighed. Several pieces of liver tissue were collected and frozen
in liquid nitrogen before storage at −80°C for subsequent reverse
transcription-quantitative (RT-q) PCR and western blot analysis.
Some liver tissues were placed in 10% neutral formaldehyde solution
(pH=7.4) and fixed for hematoxylin and eosin (H&E) staining. In
addition, a portion of the liver tissue was embedded in optimal
cutting temperature compound and stored at −80°C. Frozen sections
were prepared for oil red O staining.
During the experiment, body weight, blood glucose
and food intake of the mice were measured. The volume of blood
collection for the glucose measurements was 2 µl.
Cell culture and treatment
Short tandem repeats were used to identify the HepG2
cells (Shanghai Saibaikang Bio Co., Ltd.) used in the present
study. HepG2 cells are a hepatoma cell line. HepG2 cells were
cultured in minimum essential medium (MEM, HyClone; Cytiva)
containing 10% fetal bovine serum (FBS, Zhejiang Tianhang
Biotechnology Co., Ltd.), at 37°C with 5% CO2. A HepG2
cell steatosis model was established by culture medium containing
0.25 mmol/l PA for 48 h. HepG2 cells were transfected with
miR-122-mimic (Guangzhou RiboBio Co., Ltd.) and negative control
(Guangzhou RiboBio Co., Ltd.) and silibinin was used for cell
interference. HepG2 cells were cultured in MEM medium of 5% FBS for
48 h as miR-122 mimic transfection control. The transfection steps
are described below. First, 1–5×10⁵ cells were
inoculated into a six-well plate containing complete medium with PA
interference for 24 h to achieve the confluence of 50–60% for
transfection. Second, 5 µl 20 µM miR-122 mimic with 120 µl 1X
Ribofect™ CP Buffer (Guangzhou RiboBio Co., Ltd.) was mixed with 12
µl Ribo FECT™ CP Reagent and incubated at room temperature for 5
min. Finally, the above transfection compounds were added to the
1863 µl Lopti-MEM medium (Guangzhou RiboBio Co., Ltd.) and mixed
gently. After transfection for 4–6 h, the medium containing 5% FBS
was changed and silybin was added for intervention for 24 h
following transfection for 18–20 h (after 24 h of transfection) to
collect the cells (namely, after transfection for 48 h, all
indicators were assessed for cell detection). The quantification of
lipids by oil red O staining and triglyceride (TG) assay was
performed to measure the TG level in HepG2 cells using a TG
quantitative kit (Applygen Technologies, Inc.), according to the
manufacturer's instructions.
Intraperitoneal glucose tolerance test
(iPGTT)
For iPGTT, mice were fasted for 12 h and then
injected intraperitoneally with glucose (2 g/kg), as described
previously. Blood glucose from the mouse tail vein was measured at
each of the following time points: 0, 15, 30, 60 and 120 min. The
tail tip of the mouse was cut short and blood was dripped onto a
Roche rapid glucometer strip (Roche Diagnostics) to measure blood
glucose.
Serum insulin determination
The insulin level of mice was determined by double
anti-sandwich enzyme-linked immunosorbent assay (ELISA). A volume
of 5 µl of the standard and the sample was coated to the bottom of
the plate, followed by addition of 75 µl enzyme-labeled antibody.
The reaction was incubated at room temperature for 120 min.
Finally, after washing, 100 µl of the color substrate was added to
each well and incubated in a room temperature shaker for 30 min.
The reaction was terminated with 100 µl termination solution and
the absorbance was measured at the wavelength of 450 nm using an
enzyme-labeled instrument (Thermo Fisher Scientific, Inc.). The
standard curve was plotted according to the standard substance of
different concentrations and the insulin level of the sample was
calculated based on the standard curve and the absorbance of the
sample.
Liver histology
H&E staining was conducted to analyze the
pathologic alterations. Briefly, liver tissues were fixed with 4%
paraformaldehyde for 24 h at room temperature and then embedded in
paraffin. Subsequently, tissues were sliced into 4 µm sections
followed by deparaffinization. Deparaffinization was performed by
incubation with xylene for 40 min, anhydrous ethanol for 10 min and
75% alcohol for 5 min. Following washing with running water,
tissues were stained with hematoxylin for 2–3 min and eosin for 1
min at room temperature. Stained tissues were observed using an
OLFV-34CM/XE light microscope (Olympus Corporation).
The frozen fresh tissue was used for oil red O
staining to analyze the accumulation of lipids in the liver. Liver
tissues were frozen and cut into 8 µm sections. The sections placed
on slides and air-dried for 30 min. Subsequently, tissues were
fixed with paraformaldehyde for 15–20 min at room temperature.
Following washing with running water, the sections were stained
with oil red O for 8–10 min and counterstained with hematoxylin for
3–5 min at room temperature. Images were captured using an
OLFV-34CM/XE light microscope. TG levels in liver tissues were
determined according to the instructions of the TG quantitative kit
(Applygen Technologies, Inc.).
RNA extraction and RT-qPCR measurement
of mRNA expression of fatty acid synthase (FAS), acetyl-CoA
carboxylase (ACC) and carnitine palmitoyl transferase 1A
(CPT1A)
The mRNA expression of FAS, ACC and CPT1A in the
liver and HepG2 cells were determined by RT-qPCR. First, the mRNA
was extracted according to the instructions of the mRNA extraction
and separation kit (Tiangen Biochemical Technology (Beijing) Co.,
Ltd.). Second, the reverse transcription reaction was performed on
the Mastercycler gradient gene amplification instrument (Eppendorf)
by referring to the instructions of the mRNA reverse transcription
kit (Beijing Tiangen Biochemical Technology Co., Ltd.). Finally,
the reaction system was set up according to the instructions of the
mRNA amplification kit and amplification was performed on the ABI
7500 PCR instrument (Applied Biosystems; Thermo Fisher Scientific,
Inc.). The following thermocycling conditions were used for qPCR:
Pre-denaturation at 95°C for 15 min; 40 cycles of denaturation at
95°C for 10 sec, annealing at 58°C for 20 sec and extension at 72°C
for 32 sec. cDNA synthesis and qPCR were performed according to the
manufacturer's protocols. Subsequently, the data were analyzed
using the ABI 7500 fluorescence quantitative PCR analysis software
(Applied Biosystems; Thermo Fisher Scientific, Inc.). β actin was
set as the internal reference gene and the baseline was set as 3–15
cycles, following which the Ct values of each sample amplification
were obtained. The control group samples were set as standard 1 and
the relative quantitative value (RQ value) of the expression level
of each target gene in each sample was obtained according to the
equation, RQ=2−ΔΔCq (12). The following primer sequences were
synthesized by Invitrogen (Thermo Fisher Scientific, Inc.): FAS
forward, 5′-AGAACCTCCAGTCGTGTGAG-3′ and reverse,
5′-GGGCATGGAGGGACTTGAAT-3′; ACC forward,
5′-ATGGGCGGAATGGTCTCTTTC-3′ and reverse,
5′-TGGGGACCTTGTCTTCATCAT-3′; CPT1A forward,
5′-GACTCCGCTCGCTCATTCC-3′ and reverse,
5′-TCGATGCCATCAGGGGTGAC-3′.
RT-qPCR to estimate the miR-122
expression
miR-122 expression in liver and HepG2 cells were
determined by RT-qPCR. First, miRNA was extracted using the miRNA
extraction and separation kit (Beijing Tiangen Biochemical
Technology Co., Ltd.). Second, the reverse transcription reaction
was performed on the Mastercycler gradient gene amplification
instrument by referring to the instructions of the miRNA reverse
transcription kit (Beijing Tiangen Biochemical Technology Co.,
Ltd.). Finally, the reaction system was set up according to the
instructions of the miRNA amplification kit and performed on the
ABI 7500 PCR instrument (Applied Biosystems; Thermo Fisher
Scientific, Inc.). The primers for miR-122 were obtained from
Guangzhou RiboBio Co. Ltd: miR-122 forward,
5′-AAACGCCAUUAUCACACUAAAU-3′ and reverse,
5′-UGGAGUGUGACAAUGGUGUUUG-3′. The following thermocycling
conditions were used for qPCR: Pre-denaturation at 95°C for 15 min;
40 cycles of denaturation at 94°C for 20 sec and
annealing/extension at 60°C for 34 sec. cDNA synthesis and qPCR
were performed according to the manufacturer's protocols. Following
amplification, the data were analyzed using ABI 7500 fluorescence
quantitative PCR analysis software (Applied Biosystems; Thermo
Fisher Scientific, Inc.). U6 (cat. no. CD201-0145; Tiangen Biotech
Co., Ltd.) was set as the internal reference gene and the baseline
was set as 3–15 cycles to obtain the Ct value of each sample and
gene amplification. The control group samples were set as standard
1 and the RQ value of the expression level of each target gene in
each sample was obtained according to the RQ=2−ΔΔCq
(12), which was used for
statistical analysis.
Western blot analyses of FAS, ACC and
PT1A
The protein expression levels of FAS, ACC and CPT1A
were determined by western blotting. Protein samples were extracted
from liver tissue and HepG2 cells using RIPA buffer (Beijing
Solarbio Science & Technology Co., Ltd.) and protein
concentrations were determined using the BCA protein assay kit
(Applygen Technologies, Inc.). Then, an equivalent of 50 µg protein
was separated via 5% SDS-PAGE (DYY-III; Beijing Liuyi Biotechnology
Co., Ltd.) and transferred to the polyvinylidene fluoride membrane.
Then, the membrane was blocked with 5% Tris Buffered saline Tween
(TBST; 5% Tween-20) in skimmed milk at room temperature for 2–4 h.
Subsequently, the membrane was probed with primary antibodies (all
1:1,000) targeted against: FAS (cat. no. 3180S; Cell Signaling
Technology, Inc.), ACC (cat. no. 3676S; Cell Signaling Technology,
Inc.) rabbit monoclonal, CPT1A (cat. no. ARP44796_P050; Aviva
Systems Biology), β-actin rabbit monoclonal (cat. no. AP0060;
Bioworld Technology, Inc.) and GAPDH rabbit polyclonal (cat. no.
AP0063; Bioworld Technology, Inc.) antibodies overnight at 4°C on a
shaker (TS-1; Haimen Qilin Medical Instrument Factory), followed by
incubation with horseradish peroxidase-labeled goat anti-rabbit
secondary antibody (cat. no. CW0103S; 1:5,000; Beijing Kangwei
Century Biotechnology Co., Ltd.) at room temperature for 1 h.
Protein bands were visualized using enhanced chemiluminescence
reagent (Thermo Fisher Scientific, Inc.) and an imaging system
(Analytik Jena AG). GAPDH was used as the loading control. Protein
expression was semi-quantified using ImageJ software (version
1.5.3; National Institutes of Health).
Statistical analyses
All data were analyzed by SPSS v21.0 software (IBM
Corp.). Measurement data with normal distribution or close to
normal distribution were expressed as mean ± standard deviation,
while measurement data without normal distribution were expressed
as median (quartile). The t-test was used for the normal mean of
two samples with homogeneous variance and a non-parametric rank-sum
test was used for non-normal distribution or uneven variance.
One-way analysis of variance was used for comparison among groups
with post hoc tests Bonferroni for homogeneous variance and
Tamhane's T2 for non-homogeneous variance. P<0.05 was considered
to indicate a statistically significant difference.
Results
Silibinin improves glucose tolerance
in HFD mice
The bodyweight of mice in the HFD group was greater
compared with mice in the silibinin and control groups (P<0.05;
Fig. 1A), although no significant
differences were observed in liver weight and food intake between
the three groups (P>0.05; Fig. 1B
and C). Also, no significant difference was observed in fasting
glucose and fasting insulin among the three groups (P>0.05;
Fig. 1D and E). The iPGTT was
performed to verify the effect of silibinin on glucose
metabolism-related abnormalities. The blood glucose of the HFD
group increased significantly at 15, 30, 60 and 120 min as compared
with the ND group and the area under the blood glucose curve
increased significantly (P<0.05; Fig. 1F and G).
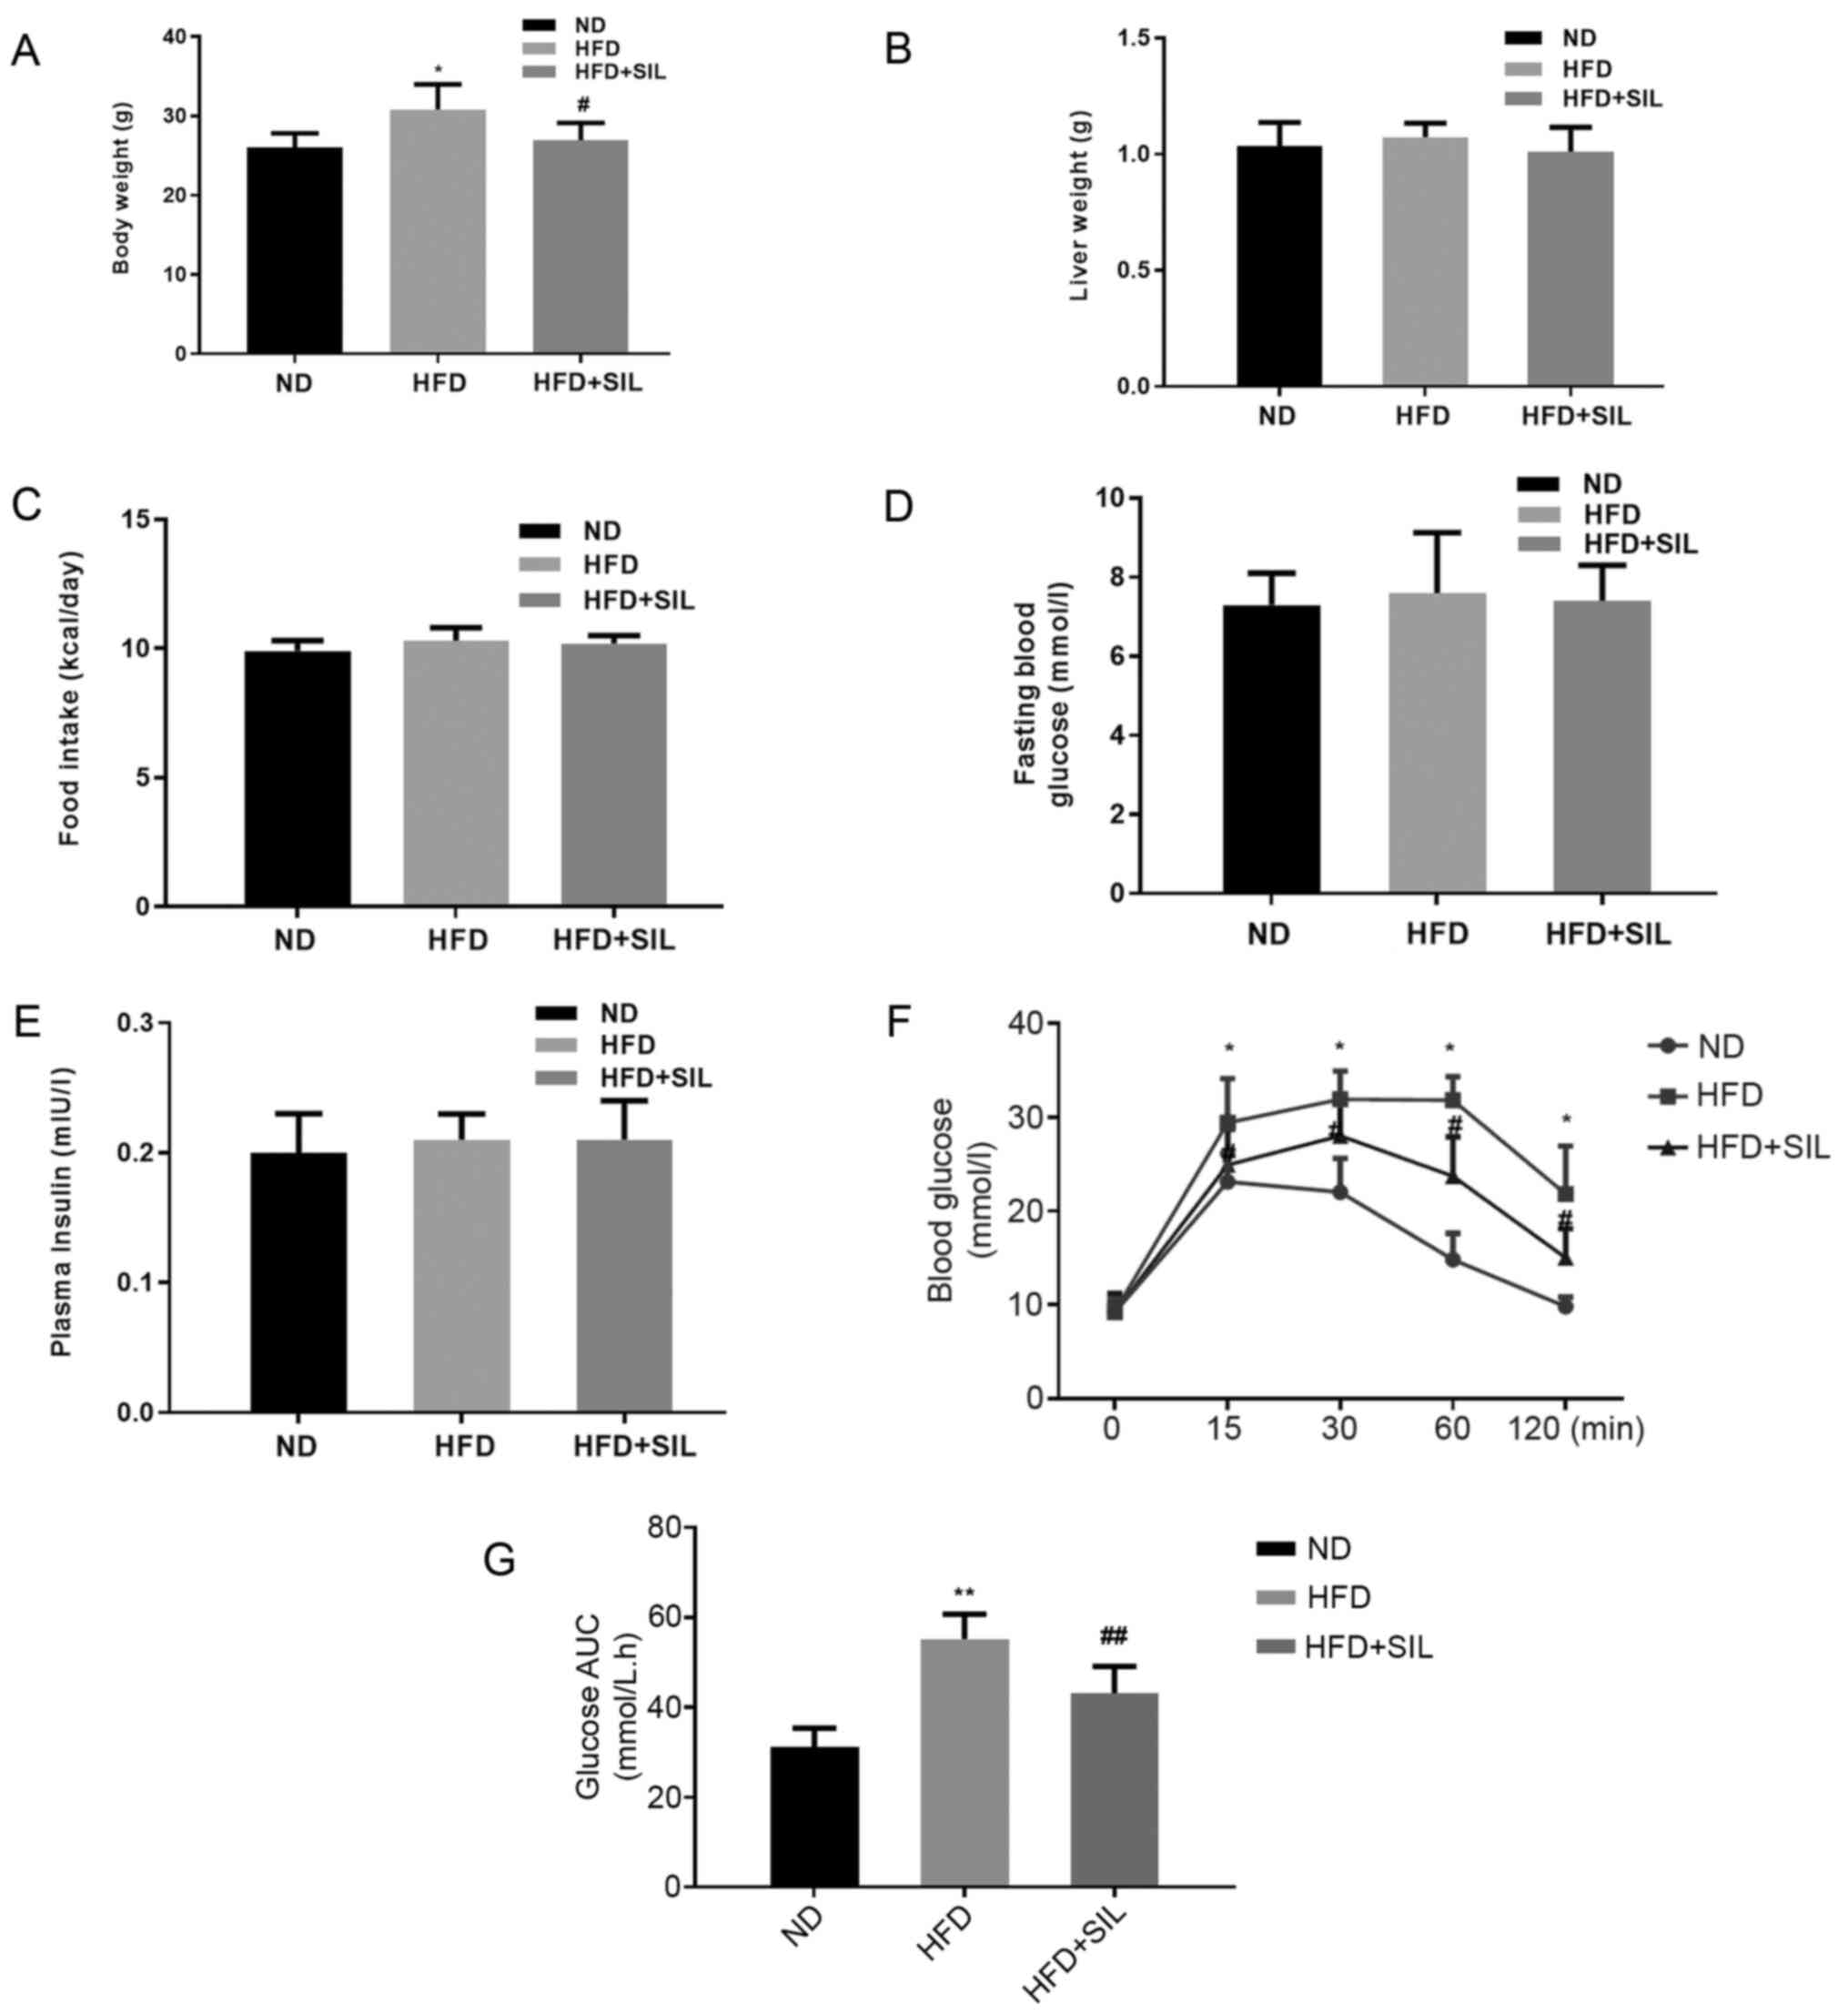 | Figure 1.Comparison of body weight, liver wet
weight, food intake, fasting glucose, fasting insulin,
intraperitoneal glucose tolerance test and area under the glucose
curve. (A) Body weight, (B) liver weight and (C) food intake of
mice in each group. Data shown as mean ± standard deviation;
*P<0.05 vs. ND and #P<0.05 vs. HFD. (D) Fasting
Blood Glucose, (E) Plasma insulin, (F) intraperitoneal glucose
tolerance test. (G) area under curve of glucose of mice in each
group. Data shown as the mean ± standard deviation. *P<0.05 and
**P<0.01 vs. ND, #P<0.05 and
##P<0.01 vs. HFD. ND, normal diet; HFD, high-fat
diet; SIL, silibinin. |
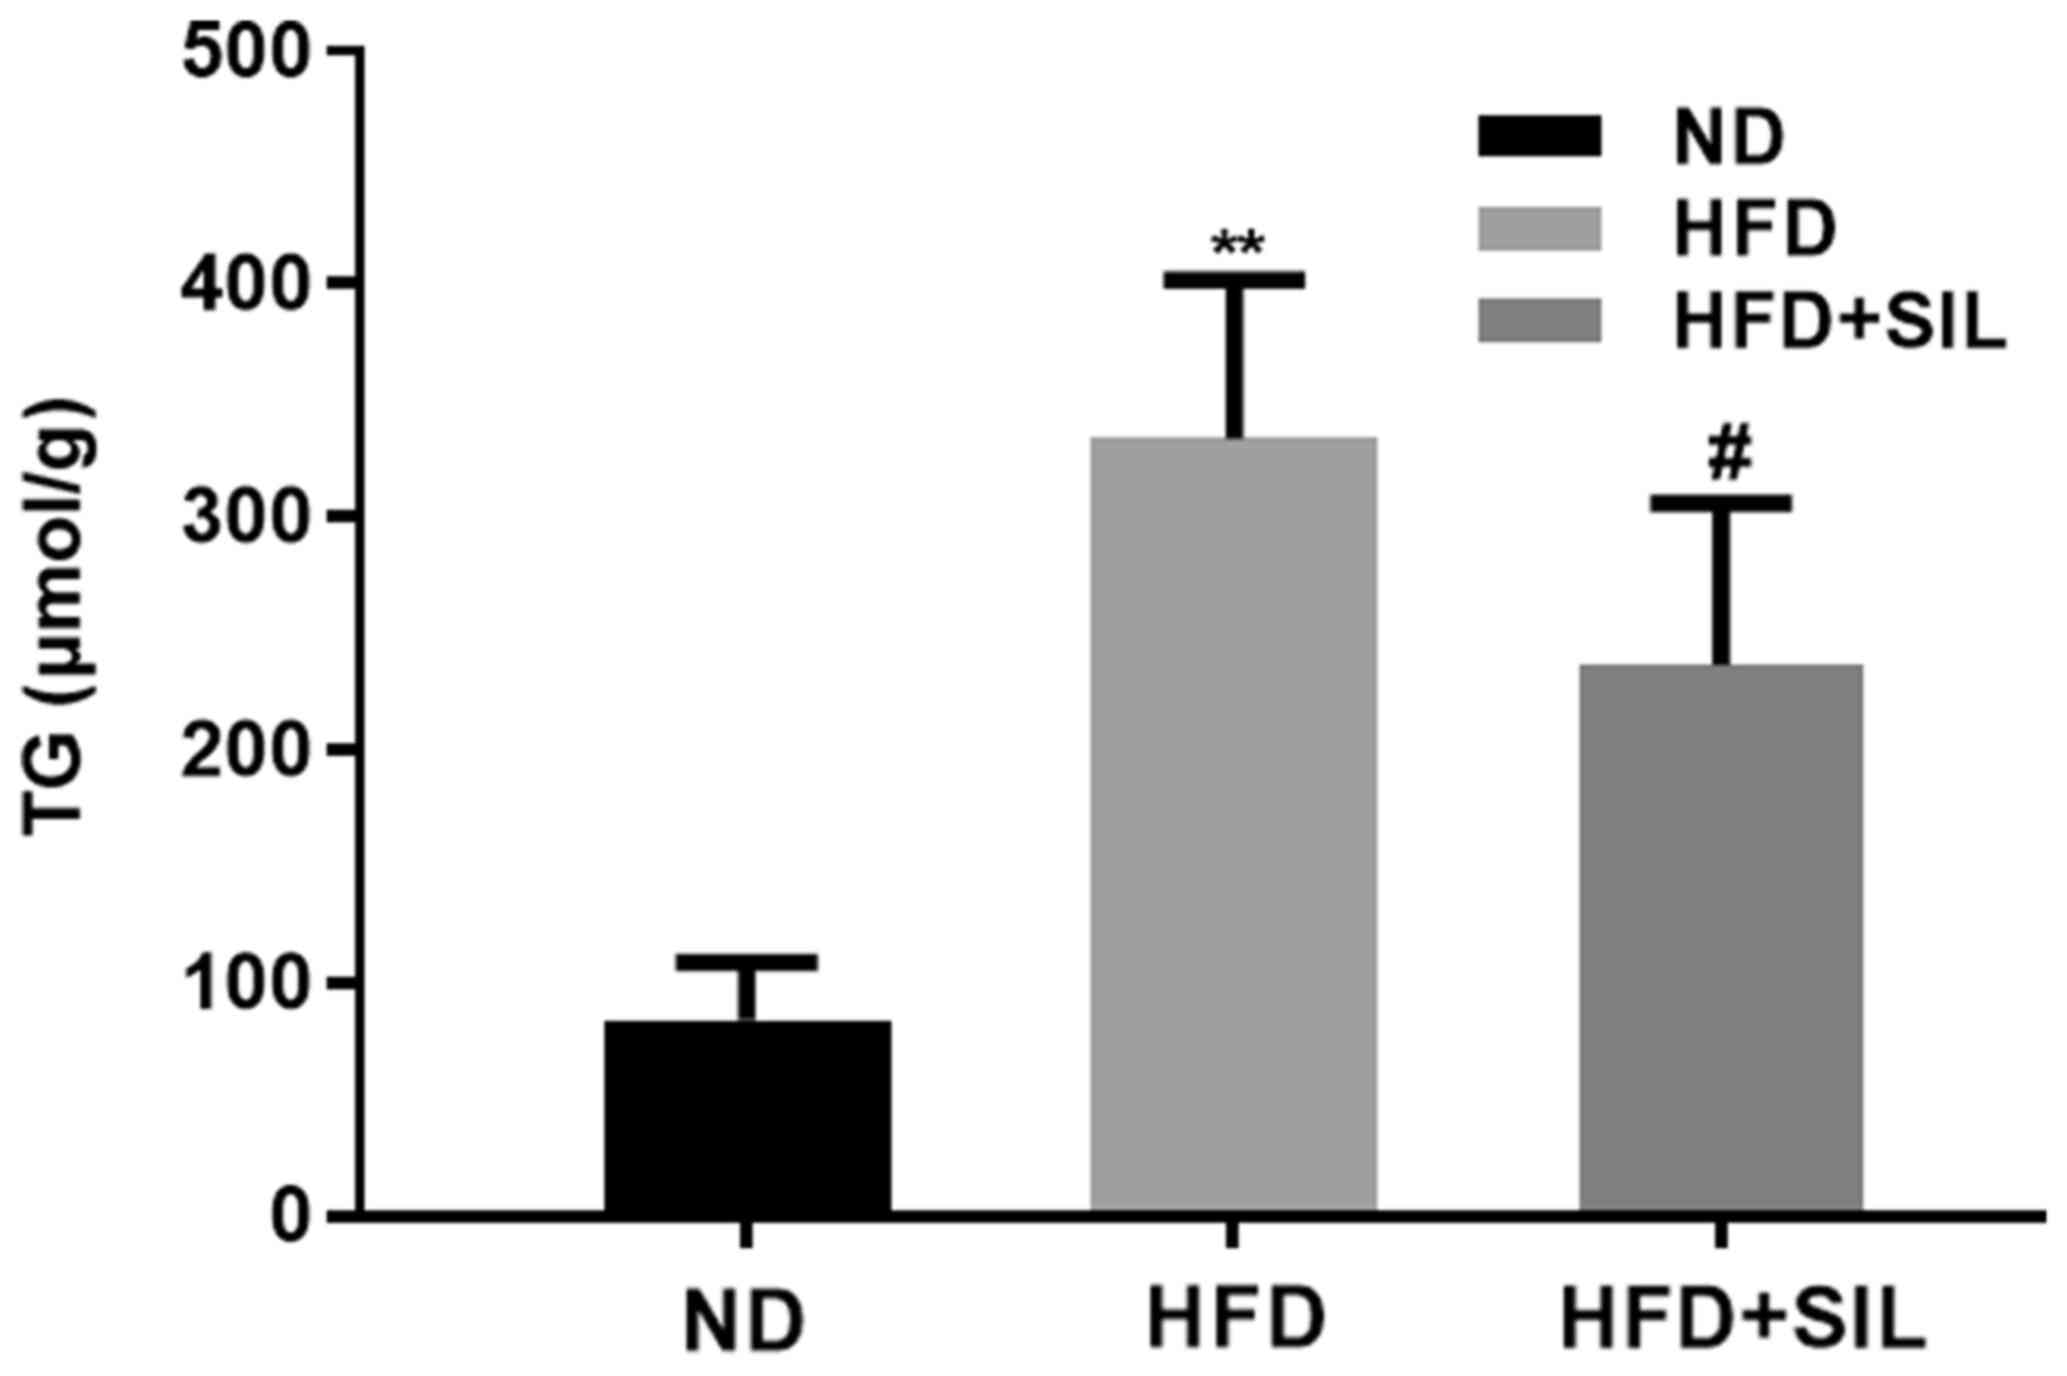
Silibinin treatment reduces hepatic
steatosis induced by HFD
The liver TG content was significantly increased in
the HFD group compared with the normal diet group (P<0.01),
while that in the silibinin group was significantly reduced
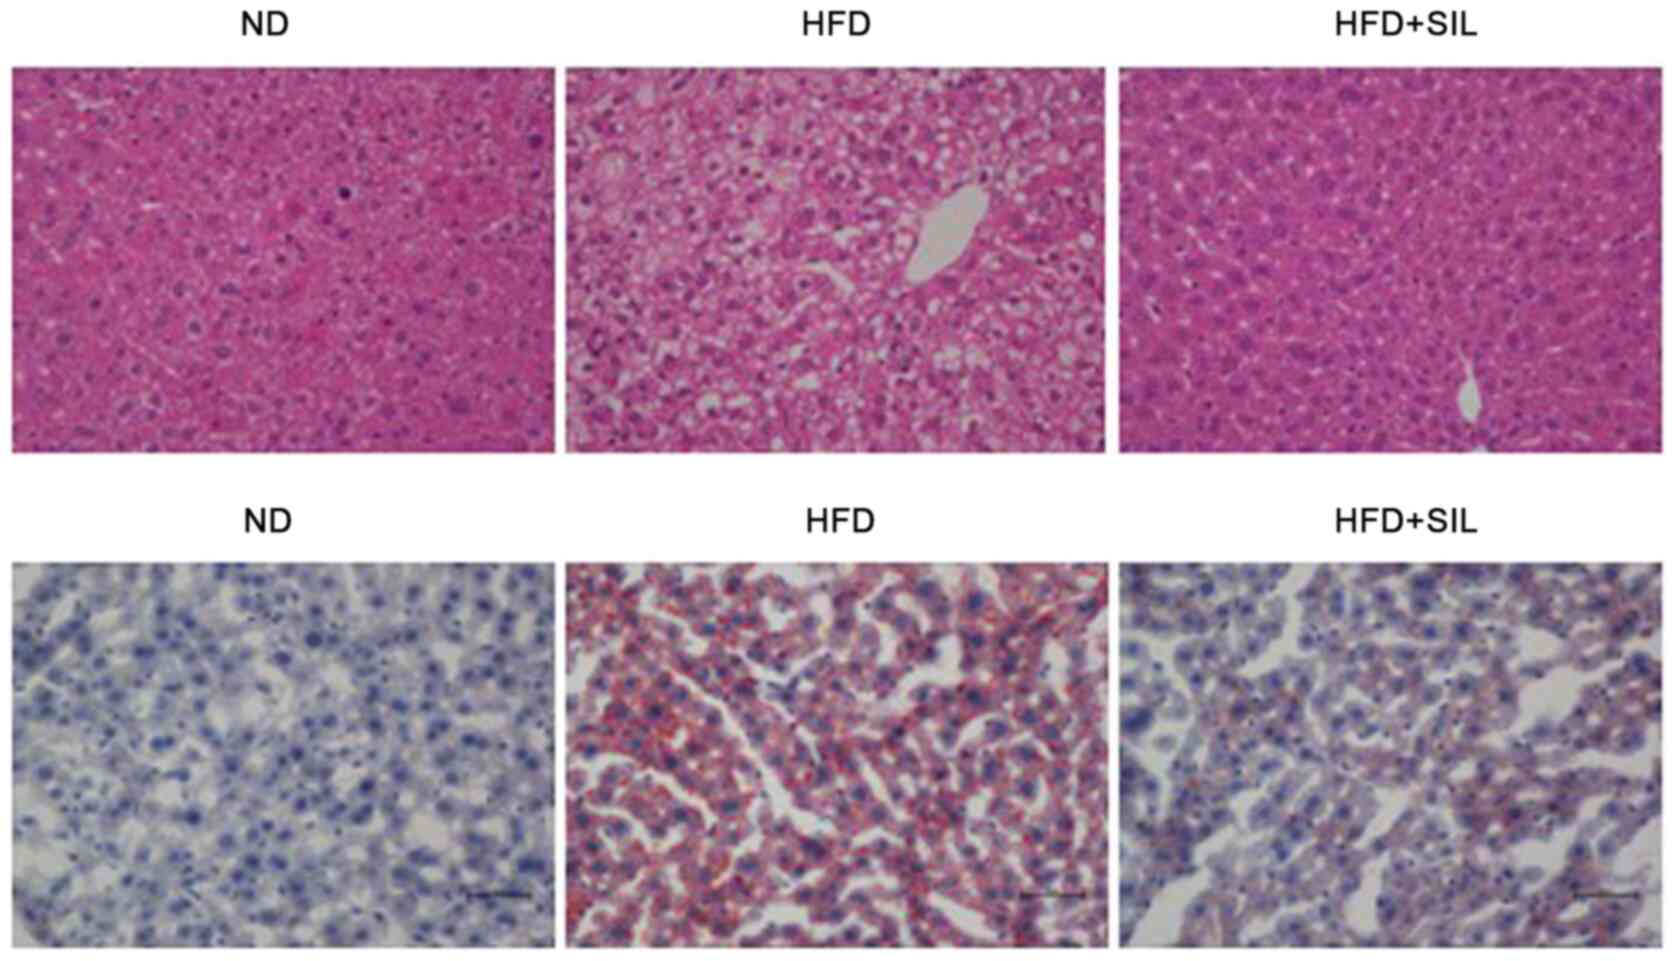
compared with the HFD group (P<0.01; Fig. 2). Light microscopy and histological
examination of tissue sections stained with H&E and oil red O
were performed to determine whether silibinin affected the hepatic
lipid accumulation in mice. The results of H&E staining
demonstrated a severe ballooning degeneration of liver hepatocytes
in the HFD group and a reduction of hepatic steatosis in the
silibinin group. Oil red O staining demonstrated a large number of
lipid droplets in the HFD group, whereas lipid droplets in the
HFD+SIL group were markedly reduced compared with the HFD group.
The oil red O staining confirmed the changes in the H&E-stained
sections (Fig. 3). The lipid
accumulation in the liver was induced by fat, which was reduced by
silibinin after feeding for 4 weeks. The gene expression of the key
enzymes involved in hepatic lipid metabolism was quantified by
RT-qPCR and western blotting. Compared with the normal diet group,
the mRNA and protein expressions of FAS and ACC were increased in
the HFD group (P<0.01), while that of CPT1A was decreased
(P<0.01). Compared with the HFD group, the mRNA and protein
expressions of FAS and ACC were decreased in the silibinin group
and that of CPT1A was increased (P<0.01; Fig. 4).
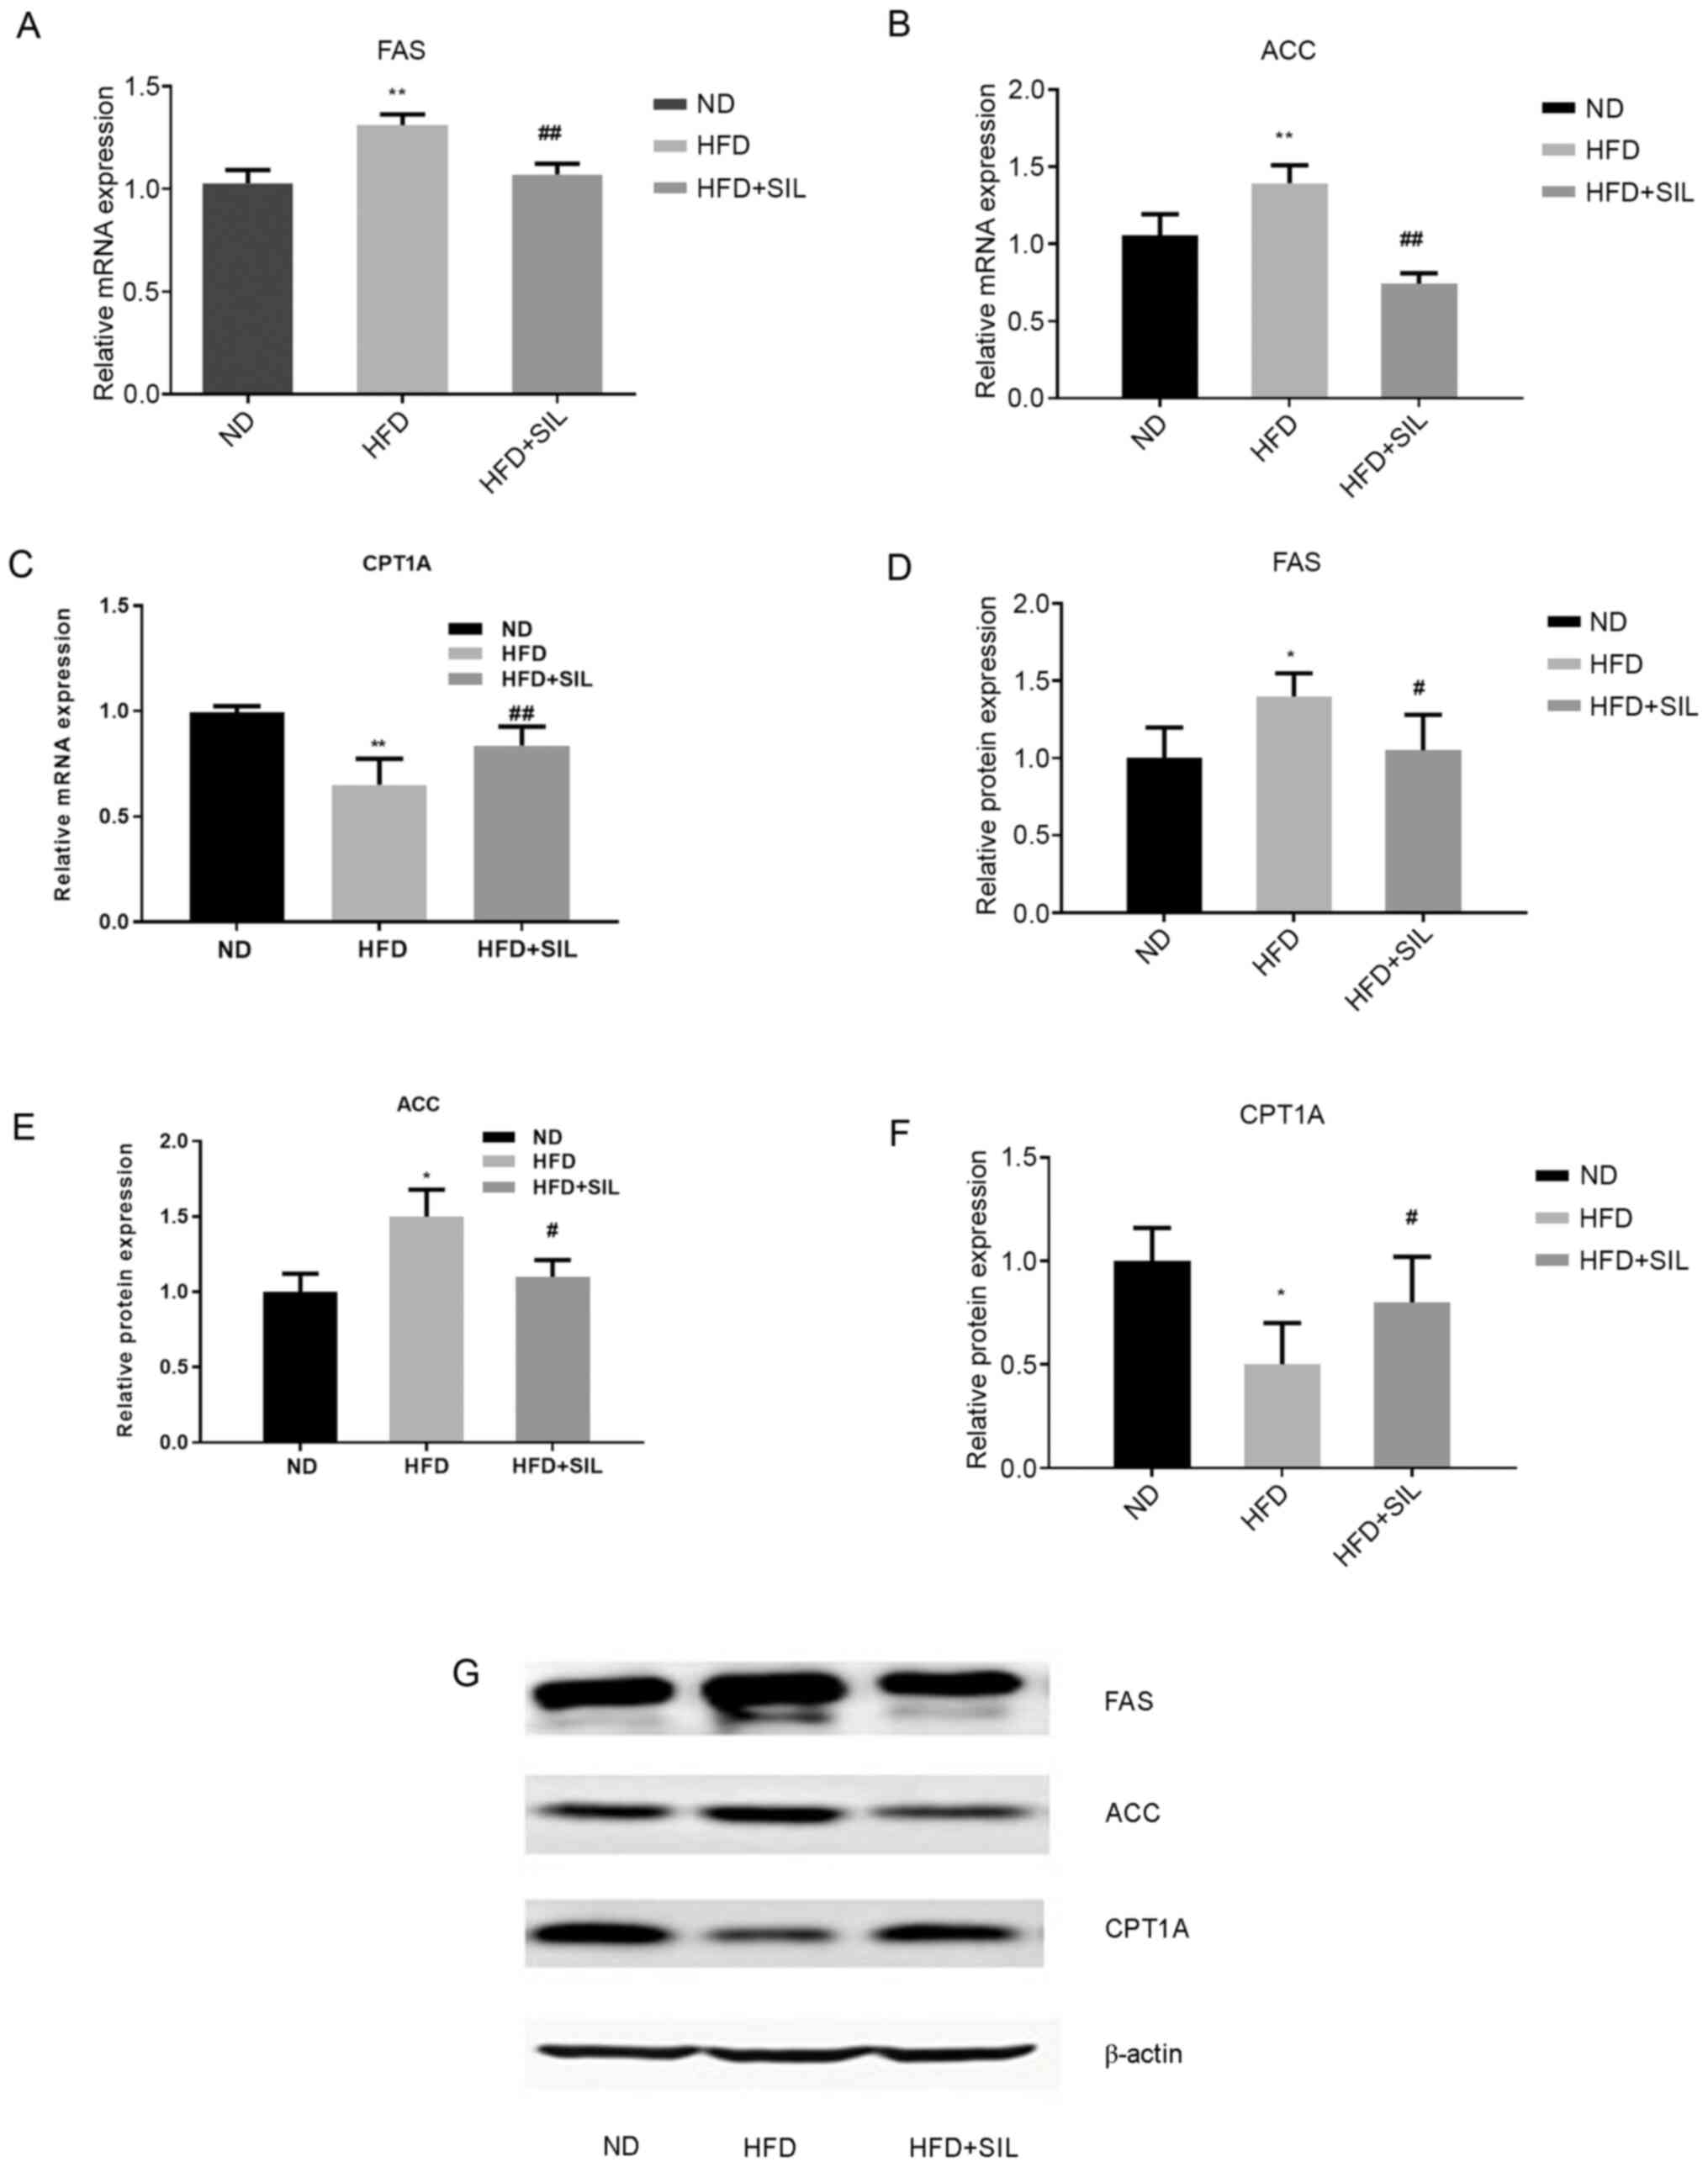 | Figure 4.Effects of silibinin intervention on
mRNA and protein expression levels of FAS, ACC and CPT1A in mice
livers. Relative mRNA expression of (A) FAS, (B) ACC and (C) CPT1A
in livers. Data shown as mean ± standard deviation. Relative
protein expression of (D) FAS, (E) ACC and (F) CPT1A in liver. (G)
Western blot analysis of protein expression. Data shown as the mean
± standard deviation. *P<0.05 and **P<0.01 vs. ND,
#P<0.05 and ##P<0.01 vs. HFD. FAS,
fatty acid synthase; ACC, acetyl-CoA carboxylase; CPT1A, carnitine
palmitoyl transferase 1A; ND, normal diet; HFD, high-fat diet; SIL,
silibinin. |
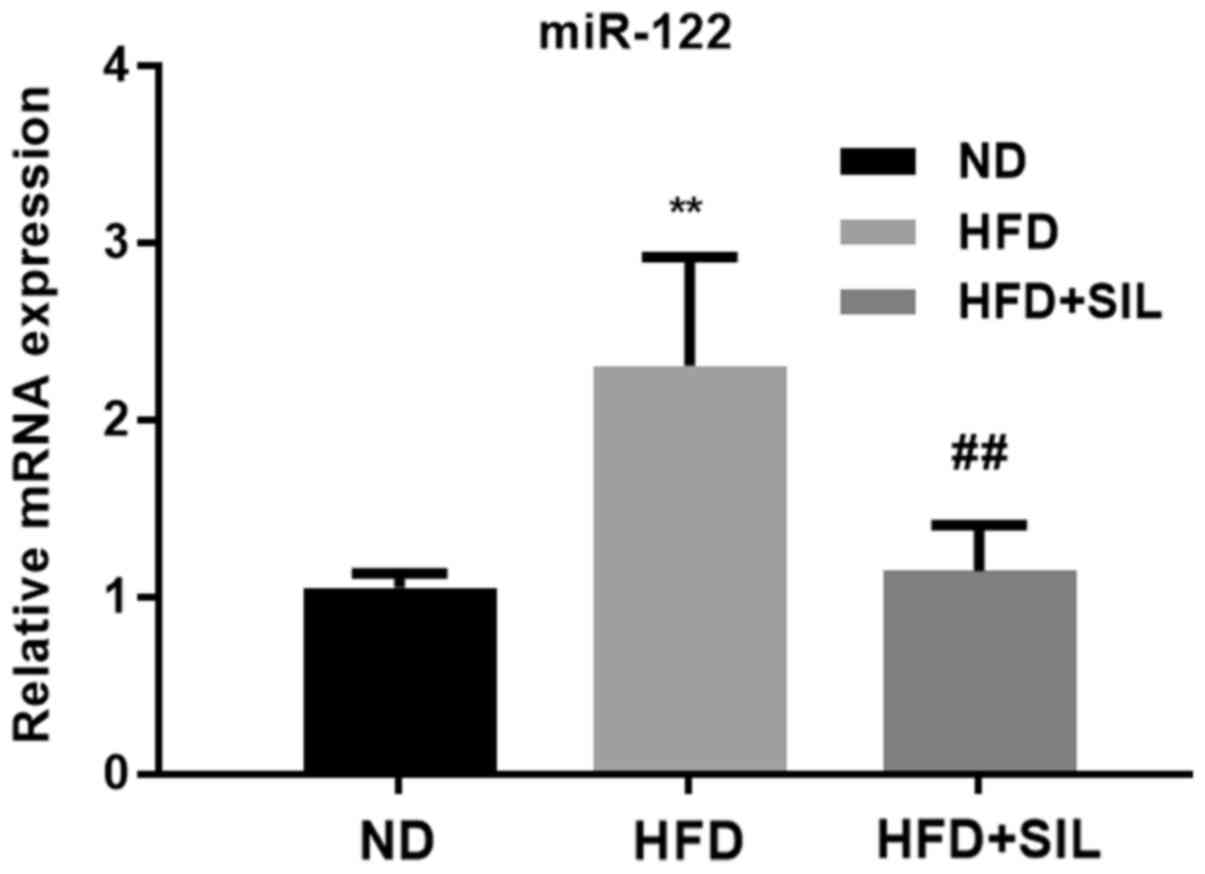
Expression of miR-122 in mice livers
of each group
Compared with the normal diet group, the expression
of miR-122 was significantly increased in the HFD group
(P<0.01). Compared with the HFD group, the expression of miR-122
was significantly decreased in the silibinin group (P<0.01;
Fig. 5).
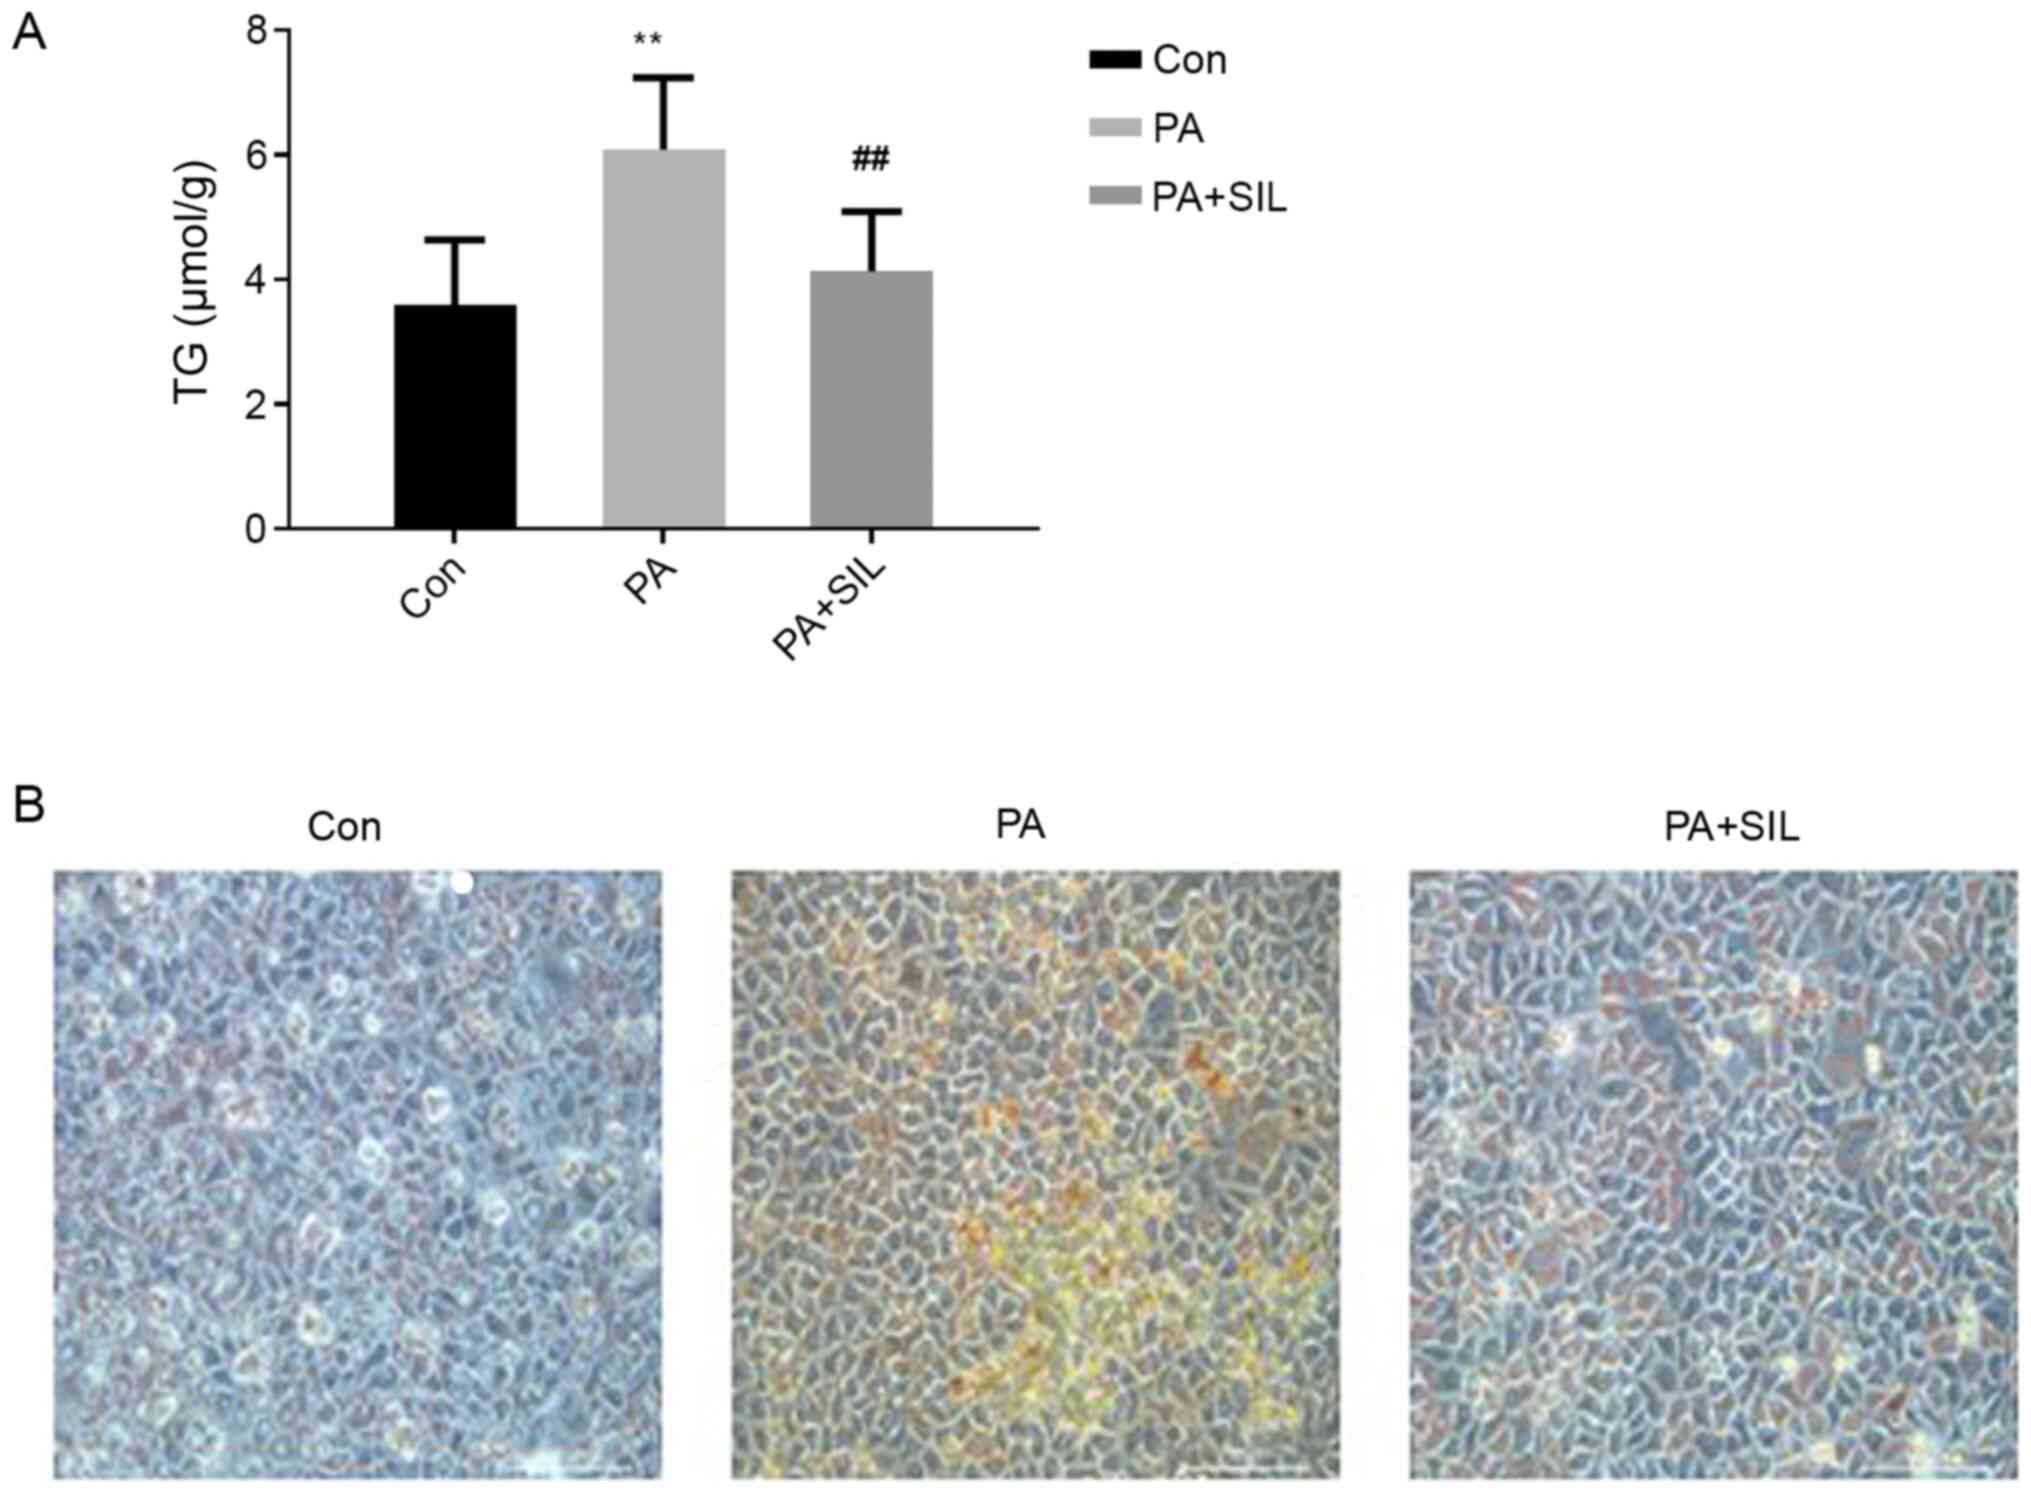
Silibinin treatment improves hepatic
lipid metabolism in HepG2 cells
Compared with the Con group, the TG content in HepG2
cells increased significantly after PA intervention (P<0.01).
Compared with the PA group, TG content in the PA + SIL group was
significantly decreased (P<0.01; Fig. 6A). Oil red O staining is illustrated
in Fig. 6B. Cells in the Con group
had no obvious lipid droplets, while cells in the PA group had a
large number of red staining lipid droplets and lipid droplets in
the PA + SIL group were significantly reduced compared with the PA
group.
Effects of Silibinin on miR-122
expression in HepG2 cells cultured in normal medium and in the
presence of PA
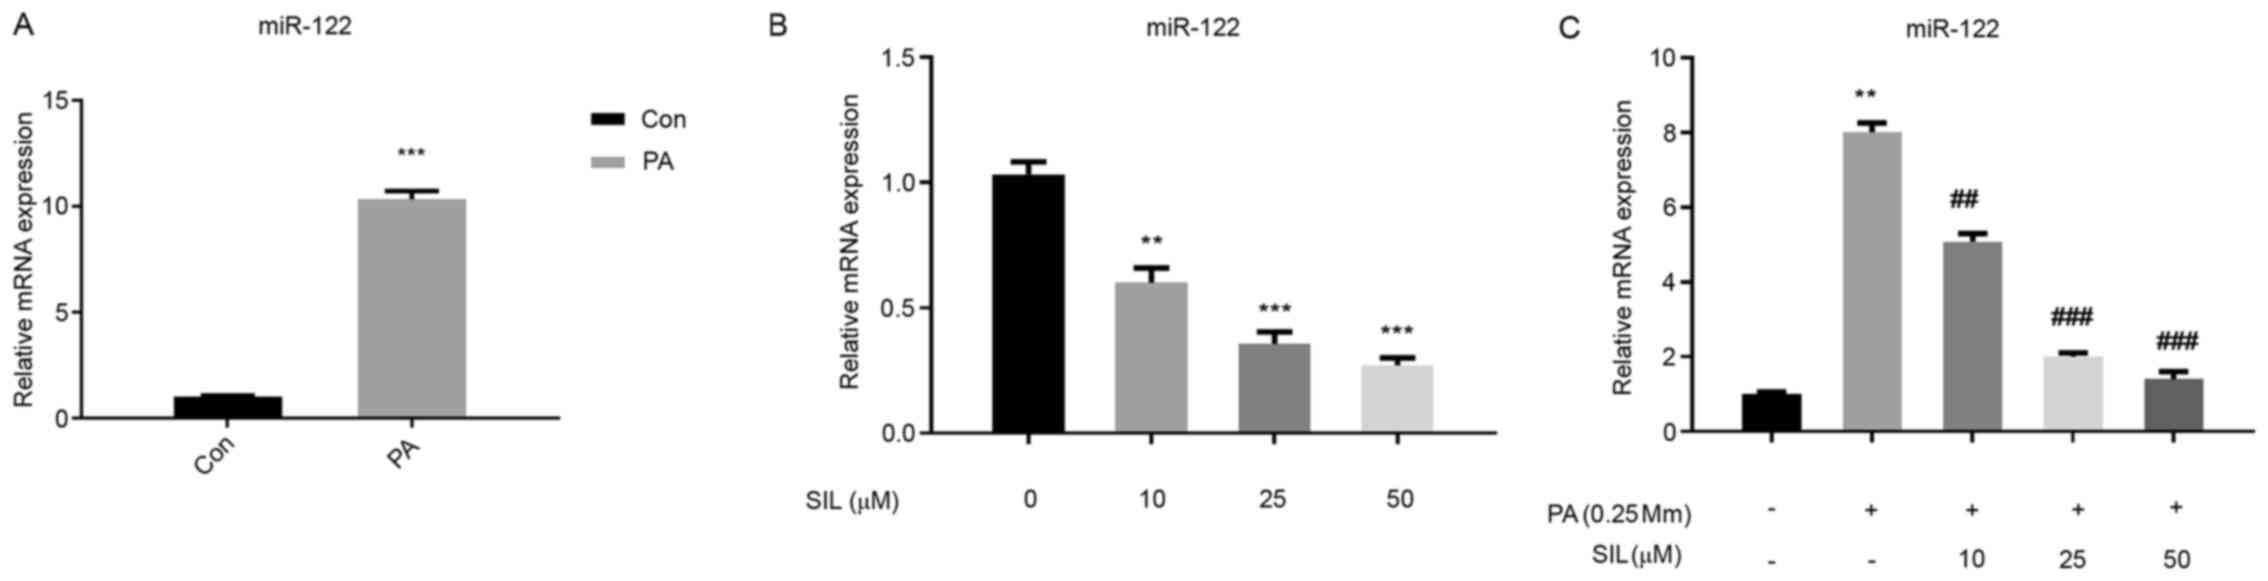
Compared with the Con group, the miR-122 expression
in the PA intervention group was significantly increased
(P<0.01; Fig. 7A). Following SIL
intervention in ordinary medium cells at different doses, the
expression of miR-122 decreased significantly with the increase in
SIL dose (Fig. 7B). Compared with
the PA group, the expression of miR-122 in the PA + SIL group
decreased (P<0.01) and the decreasing range was elevated with
the increase in SIL dose (Fig.
7C).
Effects of silibinin intervention on mRNA and
protein expression levels of FAS, ACC and CPT1A in HepG2 cells
cultured with PA. Compared with the Con group, the mRNA and protein
expression of FAS and ACC increased in the PA group (P<0.01),
while that of CPT1A decreased significantly (P<0.01). Compared
with the PA group, the mRNA and protein expressions of FAS and ACC
decreased in the PA + SIL group (P<0.01) and that of CPT1A was
increased significantly (P<0.01; Fig. 8).
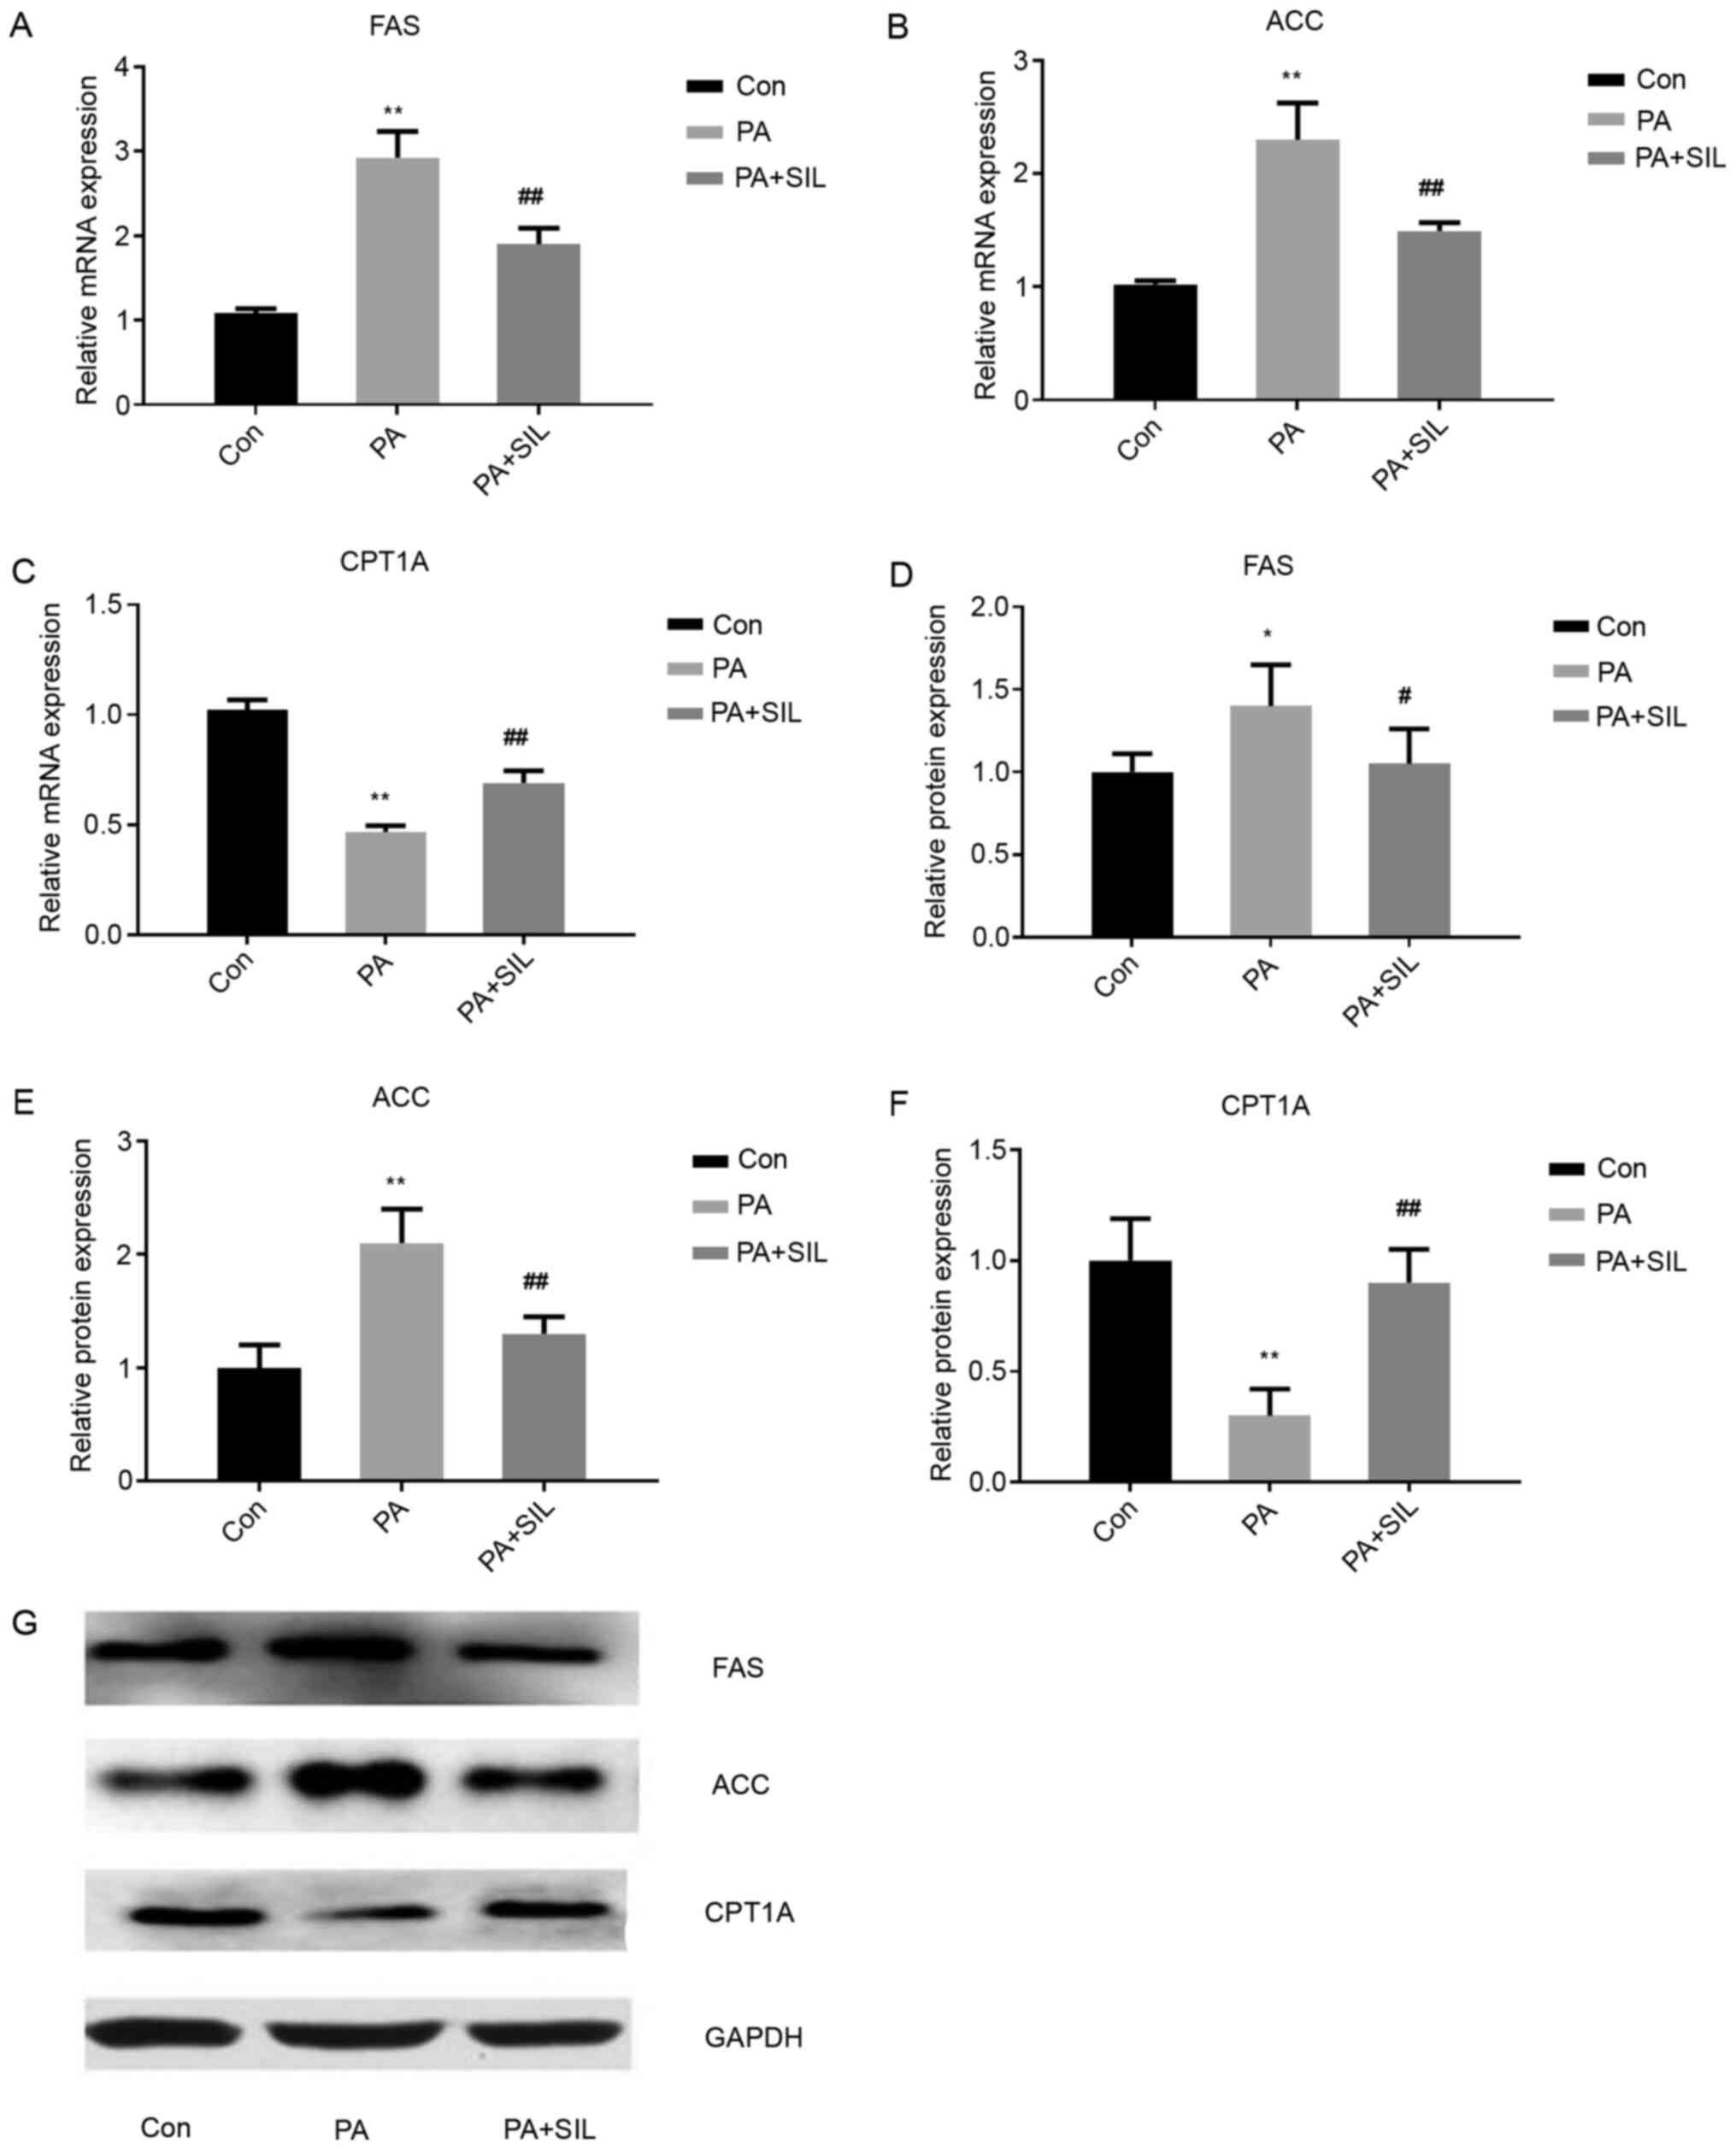 | Figure 8.Effects of silibinin intervention on
mRNA and protein expression levels of FAS, ACC and CPT1A in HepG2
cells cultured with PA. Relative mRNA expression of (A) FAS, (B)
ACC and (C) CPT1A in HepG2 cells. Data shown as the mean ± standard
deviation. The relative protein expression of (D) FAS, (E) ACC and
(F) CPT1A in HepG2 cells. (G) Western blot analysis of protein
expression. Data shown as mean ± standard deviation. *P<0.05 and
**P<0.01 vs. Con, #P<0.05 and
##P<0.01 vs. PA. miR, microRNA; FAS, fatty acid
synthase; ACC, acetyl-CoA carboxylase; CPT1A, carnitine palmitoyl
transferase 1A; PA, palmitic acid; Con, control; SIL,
silibinin. |
Silibinin affects liver lipid
metabolism by regulating miR-122 expression
Following miR-122-mimic transfection in HepG2 cells,
the miR-122 mRNA level in the miR-122-mimic group was significantly
higher than that in the control group (Empty; P<0.05),
indicating a successful miR-122-mimic transfection (Fig. 9A). Compared with the Con group, the
mRNA expression of FAS and ACC increased in the PA group
(P<0.01), while that of CPT1A decreased (P<0.01). Compared
with the PA group, the mRNA expression of FAS and ACC decreased in
the PA + SIL group (P<0.01) and that of CPT1A increased
(P<0.01). Following transfection with NCmiR-122mimic the mRNA
expressions of FAS and ACC were decreased (P<0.01) and that of
CPT1A increased (P<0.01) in the PA + SIL + NCmiR-122mimic group,
compared with the PA group. Following transfection with miR-122
mimic, compared with the PA + SIL group and PA + SIL +
NCmiR-122mimic group, the mRNA expression of FAS and ACC was
significantly increased in the PA + SIL + miR-122 mimic group
(P<0.01) and that of CPT1A was significantly decreased
(P<0.01; Fig. 9B-D). Compared
with the Con group, the protein level of FAS and ACC in the PA
group increased, while that of CPT1A decreased (P<0.01).
Compared with the PA group, the protein expression of FAS and ACC
in the PA + SIL group decreased (P<0.01), while that of CPT1A
increased (P<0.01). Following transfection with NCmiR-122mimic,
the protein expressions of FAS and ACC were decreased (P<0.01)
and that of CPT1A increased (P<0.01) in the PA + SIL +
NCmiR-122mimic group compared with the PA group. Following
transfection with miR-122 mimic, compared with the PA + SIL group
and PA + SIL + NCmiR-122mimic group, the protein expression of FAS
(P<0.05) and ACC (P<0.05) in the PA + SIL + miR-122 mimic
group increased and that of CPT1A decreased significantly
(P<0.01; Fig. 9E-H).
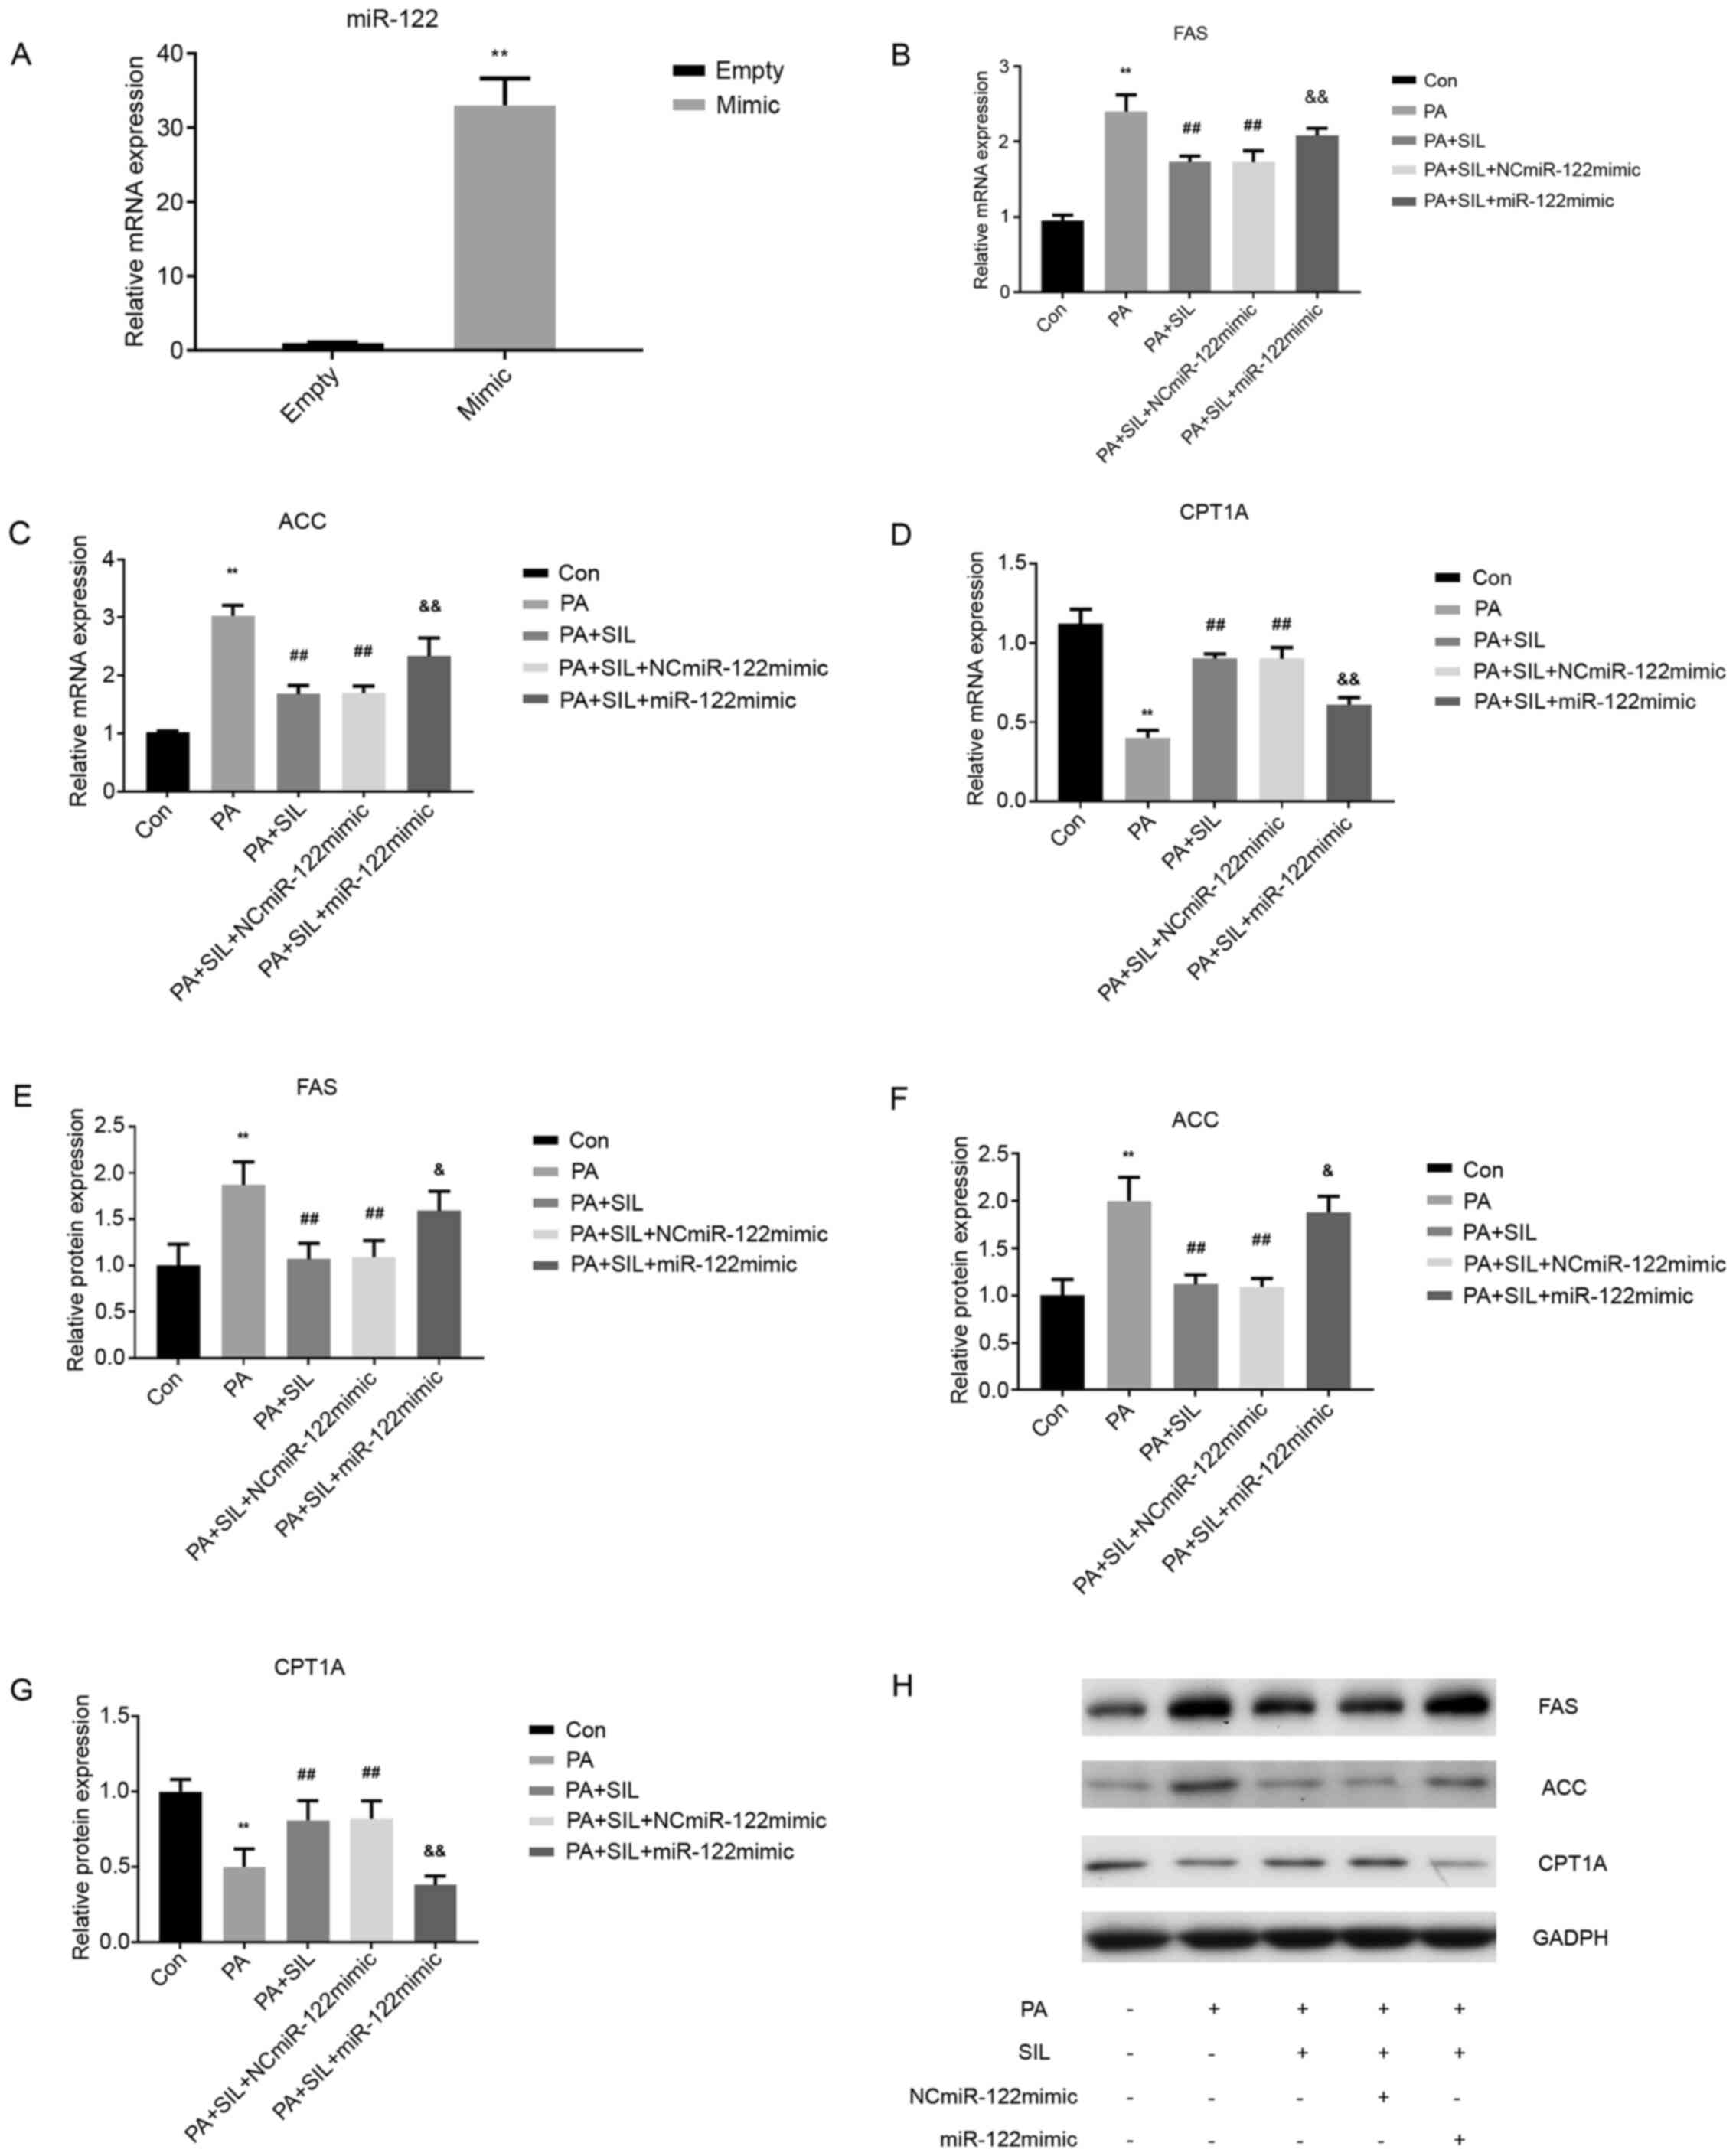 | Figure 9.Silibinin affects liver lipid
metabolism by regulating miR-122 expression. (A) Effect of miR-122
mimic on the level of miR-122 in HepG2. Data shown as the mean ±
standard deviation. **P<0.01 vs. Empty. The relative mRNA
expression of (B) FAS, (C) ACC and (D) CPT1A in HepG2 cells
following transfection. Data shown as the mean ± SD. **P<0.01
vs. con, ##P<0.01 vs. PA,
&&P<0.01 vs. PA + SIL. The relative protein
expression of (E) FAS, (F) ACC and (G) CPT1A in HepG2 cells
following transfection. (H) Western blot analysis of protein
expression. Data shown as the mean ± standard deviation.
**P<0.01 vs. con, ##P<0.01 vs. PA,
&P<0.05 and &&P<0.01 vs. PA
+ SIL and PA + SIL + NCmiR-122mimic. miR, microRNA; FAS, fatty acid
synthase; ACC, acetyl-CoA carboxylase; CPT1A, carnitine palmitoyl
transferase 1A; PA, palmitic acid; Con, control; NC, negative
control; SIL, silibinin. |
Discussion
The increasing prevalence of NAFLD has become a
public health challenge. It is a complex and multifactorial disease
that involves numerous genetic, environmental and metabolic factors
and is closely associated with obesity, type 2 diabetes and
metabolic syndrome. The liver plays a key role in lipid metabolism.
Fatty liver is the result of the accumulation of various lipids in
liver cells (10). The following
mechanisms may contribute to the development of the simple fatty
liver disease: i) Increased dietary fat intake or increased
visceral/subcutaneous adipose tissue lipolysis leads to the
increase in free fatty acids; ii) Reduced free fatty acid
oxidation; iii) Increase of de novo lipogenesis of the
liver; and iv) Reduced low-density lipoprotein in the liver reduces
the secretion of TGs (13). Some
patients with NAFLD can develop steatohepatitis, liver fibrosis and
cirrhosis (14). In addition, a
previous study demonstrated that cardiovascular, malignant and
liver-related morbidity and mortality risks are higher in patients
with NAFLD (14). A number of
studies have proved that silibinin increases insulin sensitivity,
improves hepatic steatosis, reduces oxidative stress, protects the
livers and improves metabolic syndrome (10,15–17).
In the present study, silibinin was used to intervene in the
HFD-induced NAFLD model in vivo and in vitro to
explore the mechanism underlying silibinin intervention in
NAFLD.
Changes in lifestyle and dietary structure increases
the incidence of fatty liver, especially HFD and high-calorie diet
(3). In vivo and in
vitro studies have shown that high lipids lead to lipid
deposition in fatty liver and liver cancer HepG2 cells of mice
(17,18). Simultaneously, the expression of
lipid de novo synthesis indicators, FAS and ACC increase and
the expression of fatty acid β oxidation indicator CPT1A decreases
(18,19). In the present study, HFD-fed mice
and 0.25 mmol/l PA-treated HepG2 cells were successfully
established NAFLD models in vivo and in vitro,
respectively. It was found that high-fat intervention resulted in
lipid deposition in mouse liver and HepG2 cells (expressed as
H&E-stained lipid droplet vacuoles and/or oil red O staining).
In addition, the TG content in liver tissue and HepG2 cells and the
expression of FAS and ACC increased, while the expression of CPT1A,
an indicator of fatty acid oxidation, decreased. These findings
suggested that high fat stimulates the de novo lipid
synthesis in liver cells and inhibits mitochondrial oxidation of
fatty acids at the animal and cellular levels. These results were
similar to those of the aforementioned previous studies, which
demonstrated that high-fat intervention causes lipid deposition,
elevates the index of lipid synthesis and decreases the index of
fatty acid oxidation.
HFD-fed mice and HepG2 cells with PA intervention
represent a caloric overload state that leads to obesity, IR and
liver steatosis. In the present study, silibinin reduced the lipid
deposition in HepG2 cells and improved IR and hepatic lipid
deposition in HFD mice. Animal experiments have demonstrated that
silibinin improves the fatty liver of HFD mice by regulating liver
glucose metabolism and improving IR (10). In vitro experiments have
demonstrated that silibinin targets IRS-1/PI3K/Akt to improve IR
and hepatic lipid deposition in an NAFLD cell model induced by PA.
The present study conducted western blot analysis with a
phosphor-AKT antibody using the same samples as described in
Fig. 4D-G (20). Another study demonstrated that
silibinin inhibits oxidative stress, reduces liver damage,
regulates liver lipid homeostasis and protects the liver (17). The results of the present study were
consistent with those of the previous studies that silibinin can
improve lipid deposition and IR in an NAFLD model.
The present study also observed the mediating effect
of miR-122 on hepatic lipid deposition induced by hyperlipidemia
and the intervention effect of silibinin. miRNAs have been under
intensive investigation in recent years and achievements have been
made in the fields of cell growth, apoptosis, metabolism,
inflammation, immune regulation and tumor (3–5). The
role of miRNA in the development of fatty liver has also aroused
interest. Feng et al (21)
found that miR-200c expression is upregulated in HFD-fed rats and
fatty acid-treated HepG2 cells. Calo et al (22) demonstrated that following miR-21
knockdown in the liver, glucose intolerance, lipid deposition and
obesity are improved in HFD mice. In addition, for a non-invasive
test, serum miR-34a, miR-122 and miR-192 have been identified as
potential biomarkers for NAFLD (23). As the most abundant miRNA expressed
in the liver, miR-122 has been widely studied. A number of studies
have shown that miR-122 mediates the occurrence and development of
the fatty liver. For example, Miyaaki et al (4) found that miR-122 knockdown resulted in
the upregulation of lipid metabolism genes, including FAS, HMGCR
reductase and sterol binding element-binding protein, and miR-122
expression is significantly upregulated in simple fatty liver
degeneration or NASH and positively correlated with the severity of
hepatocyte steatosis. Su et al (24) fed mice HFD for 10 weeks and found
that the liver size increased 3.6 times in these mice along with
the increased expression of FAS and decreased expression of CPT1A.
Naderi et al (25) used the
liver biopsy of clinical samples and found that the miR-122
expression in the NAFLD group was significantly upregulated
compared with the normal obese control group. Miyaaki et al
(4) demonstrated that the miR-122
level in the liver of patients with severe steatosis (>33%) was
significantly higher compared with patients with mild steatosis
(<33%). In the present study, the expression of miR-122 in
HFD-fed mice and HepG2 cells with PA intervention increased, that
of FAS and ACC also increased, while that of CPT1A decreased.
Silibinin intervention reduced the expression of FAS and ACC and
increased the expression of CPT1A, while the expression of miR-122
was downregulated. Thus, the findings of the present study were
consistent with the above studies and both in vivo and in
vitro experimental results indicated that the expression of
miR-122 is positively associated with the occurrence and
development of NAFLD.
In the present study, miR-122 expression of HepG2
cells in normal medium and PA medium was significantly decreased
after intervention with silibinin at different concentrations in
HepG2 cells and the reduction of miR-122 was dose-dependent with
silibinin concentration. It was hypothesized that silibinin reduced
the expression of miR-122. In order to further explore the effect
of silibinin on miR-122 in lipid metabolism, the present study used
a miR-122 mimic and transfection technique to overexpress miR-122,
followed by silibinin interference in HepG2 cells cultured with PA.
Consequently, the effect of silibinin on improving lipid deposition
was inhibited and mRNA and protein expressions of FAS and ACC were
increased, while that of CPT1A was decreased, suggesting that
silibinin improves lipid metabolism by reducing miR-122 expression.
At present, there are no relevant studies on the regulation of
miR-122 expression by silibinin, to the best of the authors'
knowledge, and only a few studies have confirmed that silybin
changes the expression of miRNA in cancer cells (26,27).
In summary, silibinin improved lipid metabolism by
reducing miR-122 expression. miR-122 may become a new therapeutic
target for improving fatty liver and the molecular mechanism
requires further study.
Acknowledgements
Not applicable.
Funding
The present study was supported by the Natural
Science Foundation of Hebei Province (grant no. H2019307114).
Availability of data and materials
The datasets used and/or analyzed during the current
study are available from the corresponding author on reasonable
request.
Authors' contributions
LY and QL conceived the study, participated in data
collection, analysis and interpretation, and drafted the
manuscript. HZ and YW contributed to collecting samples and
materials, and analyzing data. YL, SC, GS and LR participated in
the analysis and interpretation of the results. All authors read
and approved the final manuscript and consented to publish this
manuscript. LY and QL confirmed the authenticity of all the raw
data.
Ethics approval and consent to
participate
All experimental procedures were approved by the
Animal Ethic Board of Hebei Research Institute for Endocrine and
Metabolic Diseases (approval number 202024) and were in accord with
China's National Code of the Animal Care for Scientific
Experimentation. Hebei Research Institute for Endocrine and
Metabolic Diseases is affiliated to Hebei General Hospital.
Patient consent for publication
Not applicable.
Competing interests
The authors declare that they have no competing
interests.
References
|
1
|
Committee of Hepatology, Chinese Research
Hospital Association; Fatty Liver Expert Committee, Chinese Medical
Doctor Association; National Workshop on Fatty Liver and Alcoholic
Liver Disease, Chinese Society of Hepatology; National Workshop on
Liver and Metabolism, Chinese Society of Endocrinology, Chinese
Medical Association, . Expert recommendations on standardized
diagnosis and treatment for fatty liver disease in China (2019
revised edition). Zhonghua Gan Zang Bing Za Zhi. 27:748–753.
2019.(In Chinese). PubMed/NCBI
|
|
2
|
Yu Y, Cai J, She Z and Li H: Insights into
the epidemiology, pathogenesis, and therapeutics of nonalcoholic
fatty liver diseases. Adv Sci (Weinh). 6:18015852018. View Article : Google Scholar : PubMed/NCBI
|
|
3
|
Liu XL, Cao HX and Fan JG: MicroRNAs as
biomarkers and regulators of nonalcoholic fatty liver disease. J
Dig Dis. 17:708–715. 2016. View Article : Google Scholar : PubMed/NCBI
|
|
4
|
Miyaaki H, Ichikawa T, Kamo Y, Taura N,
Honda T, Shibata H, Milazzo M, Fornari F, Gramantieri L, Bolondi L
and Nakao K: Significance of serum and hepatic microRNA-122 levels
in patients with non-alcoholic fatty liver disease. Liver Int.
34:e302–307. 2014. View Article : Google Scholar : PubMed/NCBI
|
|
5
|
Yamada H, Suzuki K, Ichino N, Ando Y,
Sawada A, Osakabe K, Sugimoto K, Ohashi K, Teradaira R, Inoue T, et
al: Associations between circulating microRNAs (miR-21, miR-34a,
miR-122 and miR-451) and non-alcoholic fatty liver. Clin Chim Acta.
424:99–103. 2013. View Article : Google Scholar : PubMed/NCBI
|
|
6
|
Chai C, Rivkin M, Berkovits L, Simerzin A,
Zorde-Khvalevsky E, Rosenberg N, Klein S, Yaish D, Durst R,
Shpitzen S, et al: Metabolic circuit involving free fatty acids,
microRNA 122, and triglyceride synthesis in liver and muscle
tissues. Gastroenterology. 153:1404–1415. 2017. View Article : Google Scholar : PubMed/NCBI
|
|
7
|
Yamada H, Ohashi K, Suzuki K, Munetsuna E,
Ando Y, Yamazaki M, Ishikawa H, Ichino N, Teradaira R and Hashimoto
S: Longitudinal study of circulating miR-122 in a rat model of
non-alcoholic fatty liver disease. Clin Chim Acta. 446:267–271.
2015. View Article : Google Scholar : PubMed/NCBI
|
|
8
|
Singh S, Osna NA and Kharbanda KK:
Treatment options for alcoholic and non-alcoholic fatty liver
disease: A review. World J Gastroenterol. 23:6549–6570. 2017.
View Article : Google Scholar : PubMed/NCBI
|
|
9
|
Salomone F, Godos J and Zelber-Sagi S:
Natural antioxidants for non-alcoholic fatty liver disease:
Molecular targets and clinical perspectives. Liver Int. 36:5–20.
2016. View Article : Google Scholar : PubMed/NCBI
|
|
10
|
Yao J, Zhi M, Gao X, Hu P, Li C and Yang
X: Effect and the probable mechanisms of silibinin in regulating
insulin resistance in the liver of rats with non-alcoholic fatty
liver. Braz J Med Biol Res. 46:270–277. 2013. View Article : Google Scholar : PubMed/NCBI
|
|
11
|
Nair A, Morsy MA and Jacob S: Dose
translation between laboratory animals and human in preclinical and
clinical phases of drug development. Drug Dev Res. 79:373–382.
2018. View Article : Google Scholar : PubMed/NCBI
|
|
12
|
Livak KJ and Schmittgen TD: Analysis of
relative gene expression data using real-time quantitative PCR and
the 2(-Delta DeltaC(T)) method. Methods. 25:402–408. 2001.
View Article : Google Scholar : PubMed/NCBI
|
|
13
|
Tilg H and Moschen AR: Evolution of
inflammation in nonalcoholic fatty liver disease: The multiple
parallel hits hypothesis. Hepatology. 52:1836–1846. 2010.
View Article : Google Scholar : PubMed/NCBI
|
|
14
|
Lindenmeyer CC and McCullough AJ: The
natural history of nonalcoholic fatty liver disease-an evolving
view. Clin Liver Dis. 22:11–21. 2018. View Article : Google Scholar : PubMed/NCBI
|
|
15
|
Bouderba S, Sanchez-Martin C, Villanueva
GR, Detaille D and Koceir EA: Beneficial effects of silibinin
against the progression of metabolic syndrome, increased oxidative
stress, and liver steatosis in Psammomys obesus, a relevant animal
model of human obesity and diabetes. J Diabetes. 6:184–192. 2014.
View Article : Google Scholar : PubMed/NCBI
|
|
16
|
Vecchione G, Grasselli E, Voci A, Baldini
F, Grattagliano I, Wang DQ, Portincasa P and Vergani L: Silybin
counteracts lipid excess and oxidative stress in cultured steatotic
hepatic cells. World J Gastroenterol. 22:6016–6026. 2016.
View Article : Google Scholar : PubMed/NCBI
|
|
17
|
Salamone F, Galvano F, Cappello F,
Mangiameli A, Barbagallo I and Li Volti G: Silibinin modulates
lipid homeostasis and inhibits nuclear factor kappa B activation in
experimental nonalcoholic steatohepatitis. Transl Res. 159:477–486.
2012. View Article : Google Scholar : PubMed/NCBI
|
|
18
|
Cui CX, Deng JN, Yan L, Liu YY, Fan JY, Mu
HN, Sun HY, Wang YH and Han JY: Silibinin Capsules improves high
fat diet-induced nonalcoholic fatty liver disease in hamsters
through modifying hepatic de novo lipogenesis and fatty acid
oxidation. J Ethnopharmacol. 208:24–35. 2017. View Article : Google Scholar : PubMed/NCBI
|
|
19
|
Salomone F, Barbagallo I, Godos J, Lembo
V, Currenti W, Cinà D, Avola R, D'Orazio N, Morisco F, Galvano F
and Li Volti G: Silibinin restores NAD+ levels and
induces the SIRT1/AMPK pathway in non-alcoholic fatty liver.
Nutrients. 9:10862017. View Article : Google Scholar
|
|
20
|
Zhang Y, Hai J, Cao M, Zhang Y, Pei S,
Wang J and Zhang Q: Silibinin ameliorates steatosis and insulin
resistance during non-alcoholic fatty liver disease development
partly through targeting IRS-1/PI3K/Akt pathway. Int
Immunopharmacol. 17:714–720. 2013. View Article : Google Scholar : PubMed/NCBI
|
|
21
|
Feng YY, Xu XQ, Ji CB, Shi CM, Guo XR and
Fu JF: Aberrant hepatic microRNA expression in nonalcoholic fatty
liver disease. Cell Physiol Biochem. 34:1983–1997. 2014. View Article : Google Scholar : PubMed/NCBI
|
|
22
|
Calo N, Ramadori P, Sobolewski C, Romero
Y, Maeder C, Fournier M, Rantakari P, Zhang FP, Poutanen M, Dufour
JF, et al: Stress-activated miR-21/miR-21* in hepatocytes promotes
lipid and glucose metabolic disorders associated with high-fat diet
consumption. Gut. 65:1871–1881. 2016. View Article : Google Scholar : PubMed/NCBI
|
|
23
|
Liu CH, Ampuero J, Gil-Gomez A,
Montero-Vallejo R, Rojas A, Muñoz-Hernández R, Gallego-Durán R and
Romero-Gómez M: miRNAs in patients with non-alcoholic fatty liver
disease: A systematic review and meta-analysis. J Hepatol.
69:1335–1348. 2018. View Article : Google Scholar : PubMed/NCBI
|
|
24
|
Su D, Zhang R, Hou F, Chi J, Huang F, Yan
S, Liu L, Deng Y, Wei Z and Zhang M: Lychee pulp phenolics
ameliorate hepatic lipid accumulation by reducing miR-33 and
miR-122 expression in mice fed a high-fat diet. Food Funct.
8:808–815. 2017. View Article : Google Scholar : PubMed/NCBI
|
|
25
|
Naderi M, Pazouki A, Arefian E, Hashemi
SM, Jamshidi-Adegani F, Gholamalamdari O, Soudi S, Azadmanesh K,
Samiee SM, Merat S, et al: Two triacylglycerol pathway genes,
CTDNEP1 and LPIN1, are down-regulated by hsa-miR-122-5p in
hepatocytes. Arch Iran Med. 20:165–171. 2017.PubMed/NCBI
|
|
26
|
Khakinezhad Tehrani F, Ranji N, Kouhkan F
and Hosseinzadeh S: Apoptosis induction and proliferation
inhibition by silibinin encapsulated in nanoparticles in MIA PaCa-2
cancer cells and deregulation of some miRNAs. Iran J Basic Med Sci.
23:469–482. 2020.PubMed/NCBI
|
|
27
|
Zadeh MM, Motamed N, Ranji N, Majidi M and
Falahi F: Silibinin-induced apoptosis and downregulation of
microRNA-21 and microRNA-155 in MCF-7 human breast cancer cells. J
Breast Cancer. 19:45–52. 2016. View Article : Google Scholar : PubMed/NCBI
|