Introduction
As a calcineurin inhibitor, tacrolimus is currently
used as the first-line immunosuppressant by organ transplant
recipients in the clinical setting. Post-transplantation diabetes
mellitus (PTDM), also known as post-transplantation new-onset
diabetes, is a common complication following kidney
transplantation. The incidence of PTDM after solid organ
transplantation is 2–53% (1),
whereas the incidence of PTDM after renal transplantation is 10–40%
(2). PTDM can increase the risk of
cardiovascular disease in transplant recipients (3), as well as reduce the survival time of
the graft and the transplant recipients (4). The United Renal Data System analyzed
11,659 kidney transplant recipients and reported that PTDM was
significantly correlated with increased graft failure,
death-censored graft failure and mortality (5). Multiple studies have shown that the
use of tacrolimus was a risk factor for PTDM after transplantation
(6,7) The Chinese Guidelines for Diagnosis and
Treatment of Diabetes After Organ Transplantation (2019 edition)
stated that the risk of PTDM caused by tacrolimus was five times
than that caused by cyclosporine (8). Studies have also shown that PTDM
caused by tacrolimus may be associated with its influence on
insulin secretion and insulin resistance (9,10), but
the specific mechanism of action is yet to be fully determined. It
is well known that the pathophysiological characteristics of PTDM
are similar to those of type 2 diabetes (11). Min6 mouse insulinoma cells are
established from islet tumors in transgenic non-obese diabetic mice
expressing the 40 large T antigen of the simian virus. Their
endocrine function is similar to that of normal pancreatic β cells,
and thus, can be used as an ideal model for studying the function
of pancreatic β cells (12).
The PI3K/Akt signaling pathway is the main
downstream molecular pathway of insulin (13). PI3K activates Akt by activating the
binding of Akt and phosphoinositide dependent kinase (PDK)-1.
Activated Akt can activate or inhibit its downstream target protein
through phosphorylation, which serves an important role in cell
proliferation and metabolism (14).
The PI3K/Akt signaling pathway can promote the proliferation and
survival of islet β cells. mTOR is a serine/threonine protein
kinase that is activated by the PI3K/Akt signaling pathway coupled
with the tryptophan kinase, and it serves a key role in sensing
nutritional signals and regulating cell proliferation (15). Tacrolimus exerts its
immunosuppressive effect by interfering with
Ca2+/calmodulin calcineurin signaling pathways. It has
been reported that tacrolimus has direct effects to reversibly
inhibit insulin gene transcription, leading to a decline in insulin
mRNA levels, insulin synthesis and ultimately insulin secretion
(16). Tacrolimus can upregulate
the expression and activity of caspase-3 and induce the apoptosis
of islet cells after treatment with tacrolimus for 24 h, which may
be associated with the decreased levels of Akt phosphorylation
caused by tacrolimus (17).
Therefore, the aim of the present study was to investigate whether
the PI3K/Akt/mTOR signaling pathway served an important role in the
pathogenesis of PTDM induced by tacrolimus.
Materials and methods
Reagents and antibodies
Tacrolimus (cat. no. 104987-11-3; purity, ≥99%) was
purchased from Wuhan Xinxin Jiali Biological Technology Co., Ltd.
The mouse insulin ELISA kit (cat. no. 71584) was purchased from
Abbkine Scientific Co., Ltd. The Cell Counting Kit (CCK)-8 kit
(cat. no. C0038), Bradford protein assay kit (cat. no. P0006), BCA
protein assay kit (cat. no. P0012S), caspase-3 activity assay kit
(cat. no. C1116), total superoxide dismutase (SOD) assay kit with
WST-8 (cat. no. S0101) and lipid peroxidation malondialdehyde (MDA)
assay kit (cat. no. S0131) were purchased from Beyotime Institute
of Biotechnology. The primary antibody against PI3K (cat. no.
60225-1-Ig) was purchased from ProteinTech Group, Inc., specific
primary antibodies against Akt (cat. no. 4691), mTOR (cat. no.
2983), phosphorylated (p)-Akt (Ser473; cat. no. 4060) and p-mTOR
(Ser2448; cat. no. 5536) were purchased from Cell Signaling
Technology, Inc., and β-actin (cat. no. BM0627) was purchased from
Wuhan Boster Biological Technology Co., Ltd. The HRP-conjugated
goat anti-mouse (cat. no. BA1051) and the goat anti-rabbit (cat.
no. BA1054) secondary antibodies were purchased from Wuhan Boster
Biological Technology Co., Ltd.
Cell culture
Min6 mouse insulinoma cells were purchased from The
Cell Bank of Type Culture Collection of Chinese Academy of
Sciences. Cells were cultured with DMEM (Gibco; Thermo Fisher
Scientific, Inc.) containing 15% FBS (PAN-Biotech GmbH) under 5%
CO2 at 37°C and grown to 70–80% confluence.
CCK-8 assay
Min6 cells were seeded in 96-well plates (100
µl/well). After treating with different concentrations of
tacrolimus (100, 50, 30, 25, 20, 15, 10, 5, 3, 2 and 0 ng/ml) at
37°C for 48 h, 10 µl CCK-8 reagent was added into each well for
incubation at 37°C for 30 min, according to the manufacturer's
instructions. The absorbance of each well was measured at 450 nm
using a microplate reader (Shenzhen Leidu Technology Co., Ltd.).
Cell viability rate=(OD in the experimental group/OD in the control
group) ×100; where OD is the optical density.
Glucose-stimulated insulin
release
Min6 cells (1×10⁵/well) were cultured in
24-well culture plates with DMEM containing 15% FBS or different
concentrations of tacrolimus at 37°C for 48 h. To each well 2.8 or
16.7 mmol/l glucose solution (Biofroxx; neoFroxx GmbH) was added
for 30 min at 37°C. Subsequently, the supernatant was collected by
centrifugation at 1,000 × g for 20 min at room temperature, and the
mouse insulin ELISA kit was used to determine the insulin content,
according to the manufacturer's protocols. Finally, the stimulation
index (SI), which approximately reflects the function of the islets
(18), was calculated. SI=(the
insulin content stimulated by high glucose solution) / (the insulin
content stimulated by low glucose solution).
Caspase-3 activity assay
Min6 cells (1.3×10⁶/well) were inoculated
into a 6-well plate and cultured with 5, 25 and 50 ng/ml tacrolimus
at 37°C for 48 h. Cells were collected by centrifugation at 600 × g
for 5 min at 4°C, lysed on ice for 15 min with lysis buffer
(Beyotime Institute of Biotechnology), followed by centrifugation
at 16,000 × g for 15 min at 4°C. Finally, the protein supernatant
was collected and the Bradford method was used to determine the
protein concentration in each well. The standard curve of
p-nitroaniline (pNA) was made and the reaction system was
established according to the manufacturer's protocols of the
caspase-3 activity assay kit. The absorbance at 405 nm of each well
was determined, and the activity of caspase-3 was normalized to the
protein content of each sample.
Detection of SOD and MDA
activities
Min6 cells (2×10⁶/well) were seeded in a
6-well plate and incubated for 12 h with DMEM containing 15% FBS at
37°C; subsequently, the cells were treated with 5, 25 and 50 ng/ml
tacrolimus at 37°C for 48 h. After collecting the supernatant by
centrifugation at 12,000 × g for 5 min at 4°C, the protein
concentration in each well was determined using the BCA method, and
the SOD and MDA activities were determined using the SOD assay kit
with WST-8 and the MDA assay kit, respectively. The activities of
SOD and MDA were then normalized to the protein content of each
sample.
Reverse transcription-quantitative PCR
(RT-qPCR) assay
Min6 cells (2×10⁶/well) were seeded in a
6-well plate and treated with 5, 25 and 50 ng/ml tacrolimus at 37°C
for 48 h. The total RNA from cells was extracted using
TRIzol® reagent (Invitrogen; Thermo Fisher Scientific,
Inc.), and the quality of the RNA was evaluated according to the
A260/A280 ratio. cDNA was synthesized using 3.2 µg total RNA from
each sample, 2 µl Oligo(dT)18 (10 µM), 4 µl dNTP (2.5
mM), 4 µl 5X HiScript buffer, 1 µl HiScript reverse transcriptase,
0.5 µl ribonuclease inhibitor and RNase-free ddH2O up to
a total volume of 20 µl at 25°C for 5 min, 50°C for 15 min, 85°C
for 5 min and 4°C for 10 min. qPCR was performed using an ABI
QuantStudio 6 system (Applied Biosystems; Thermo Fisher Scientific,
Inc.) with SYBR Green Master mix (Vazyme Biotech Co., Ltd.). The
total volume (20 µl) of each PCR reaction consisted of 10 µl SYBR
Green Master Mix, 4 µl cDNA, 0.4 µl 50X ROX Reference Dye 2, 4.8 µl
ddH2O and 0.4 µl each of forward and reverse primers (10
µM). qPCR was performed using the following thermocycling
conditions: Initial denaturation at 50°C for 2 min and 95°C for 10
min, followed by 40 cycles of 95°C for 30 sec and 60°C for 30 sec.
β-actin was used as the internal control. The murine primer
sequences were as follows: β-actin forward,
5′-CACGATGGAGGGGCCGGACTCATC-3′ and reverse,
5′-TAAAGACCTCTATGCCAACACAGT-3′; PI3K forward,
5′-ACCTGGACTTAGAGTGTGCC-3′ and reverse, 5′-TCAGCAGTGTCTCGGAGTTT-3′;
Akt forward, 5′-CTGCCCTTCTACAACCAGGA-3′ and reverse,
5′-CATACACATCCTGCCACACG-3′; and mTOR forward,
5′-CGCTACTGTGTCTTGGCATC-3′ and reverse, 5′-GGTTCATGCTGCTTAGTCGG-3′.
The relative expression levels of PI3K, Akt and mTOR genes were
expressed as the difference of the quantitation cycle number value
(ΔCq) between the target genes and the β-actin gene. The
2−∆∆Cq method was used to determine the relative gene
expression (19). The experiments
were performed in triplicate.
Western blot analysis
Min6 cells were seeded in a 6-well plate and
cultured with different concentrations of tacrolimus for 48 h,
washed three times with PBS, and then 80 µl pre-cooled RIPA lysis
buffer (Beyotime Institute of Biotechnology) containing PMSF was
added and lysed on ice for 30 min. The cellular proteins were
collected by centrifugation at 10,000 × g for 5 min at 4°C and the
BCA protein assay kit was used for protein quantification. The
protein supernatant and the loading buffer were mixed at a volume
ratio of 4:1, incubated in a boiling water bath for 10 min and 40
µg protein from each group was separated by 10% SDS-PAGE. Proteins
were transferred to a PVDF membrane and blocked with Tris-HCl
buffered salt solution (TBS containing 0.05% Tween-20) containing
5% skim milk for 2 h at room temperature. The membranes were
incubated with different primary antibodies against PI3K (1:5,000),
Akt (1:1,000), mTOR (1:500), p-Akt (1:2,000), p-mTOR (1:1,000) and
β-actin (1:500) overnight at 4°C in a shaker, after which they were
washed five times with TBST and incubated with an appropriate
HRP-conjugated secondary antibody (1:50,000) at 37°C for 2 h. After
washing five times with TBST, ECL solution (Beijing Applygen
Technologies, Inc.) was added and reacted for 5 min at room
temperature. The blots were then imaged using the Bio-Rad
chemiluminescence imaging system (Bio-Rad Laboratories, Inc.) and
the optical density value of each color band was measured with
Image-Pro Plus software (version 6.0; Media Cybernetics, Inc.). The
gray ratio of target proteins (PI3K, Akt, mTOR)/β-actin, p-Akt/Akt
and p-mTOR/mTOR was used to determine the relative protein
expression levels in each group.
Statistical analysis
Statistical analysis was conducted on GraphPad Prism
8.0.1 (GraphPad Software, Inc.). All data are presented as the mean
± SD of three independent experiments. Significant differences were
performed using one-way ANOVA, followed by the Tukey-Kramer
post-test. P<0.05 was considered to indicate a statistically
significant difference.
Results
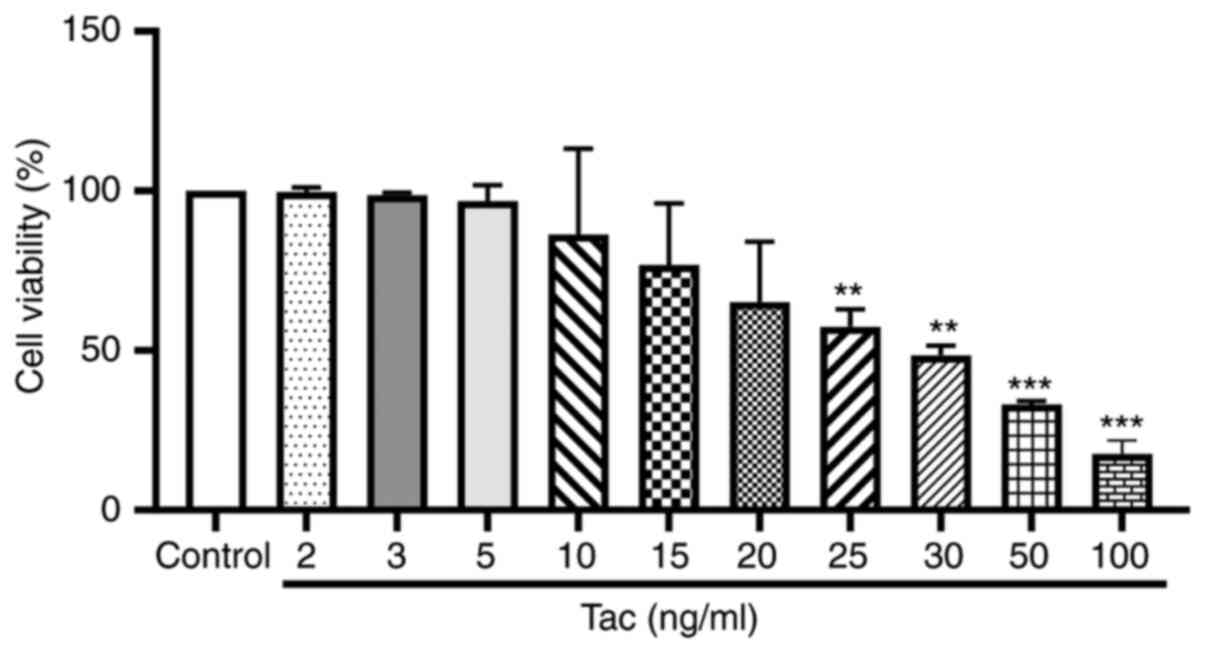
Tacrolimus inhibits the viability of
Min6 cells
The viability of Min6 cells after treatment with
different concentrations of tacrolimus is shown in Fig. 1. The IC50 value was
calculated as 30.44 ng/ml. Thus, 5, 25 and 50 ng/ml were selected
as the low, moderate and high concentrations of tacrolimus,
respectively, in the following experiments.
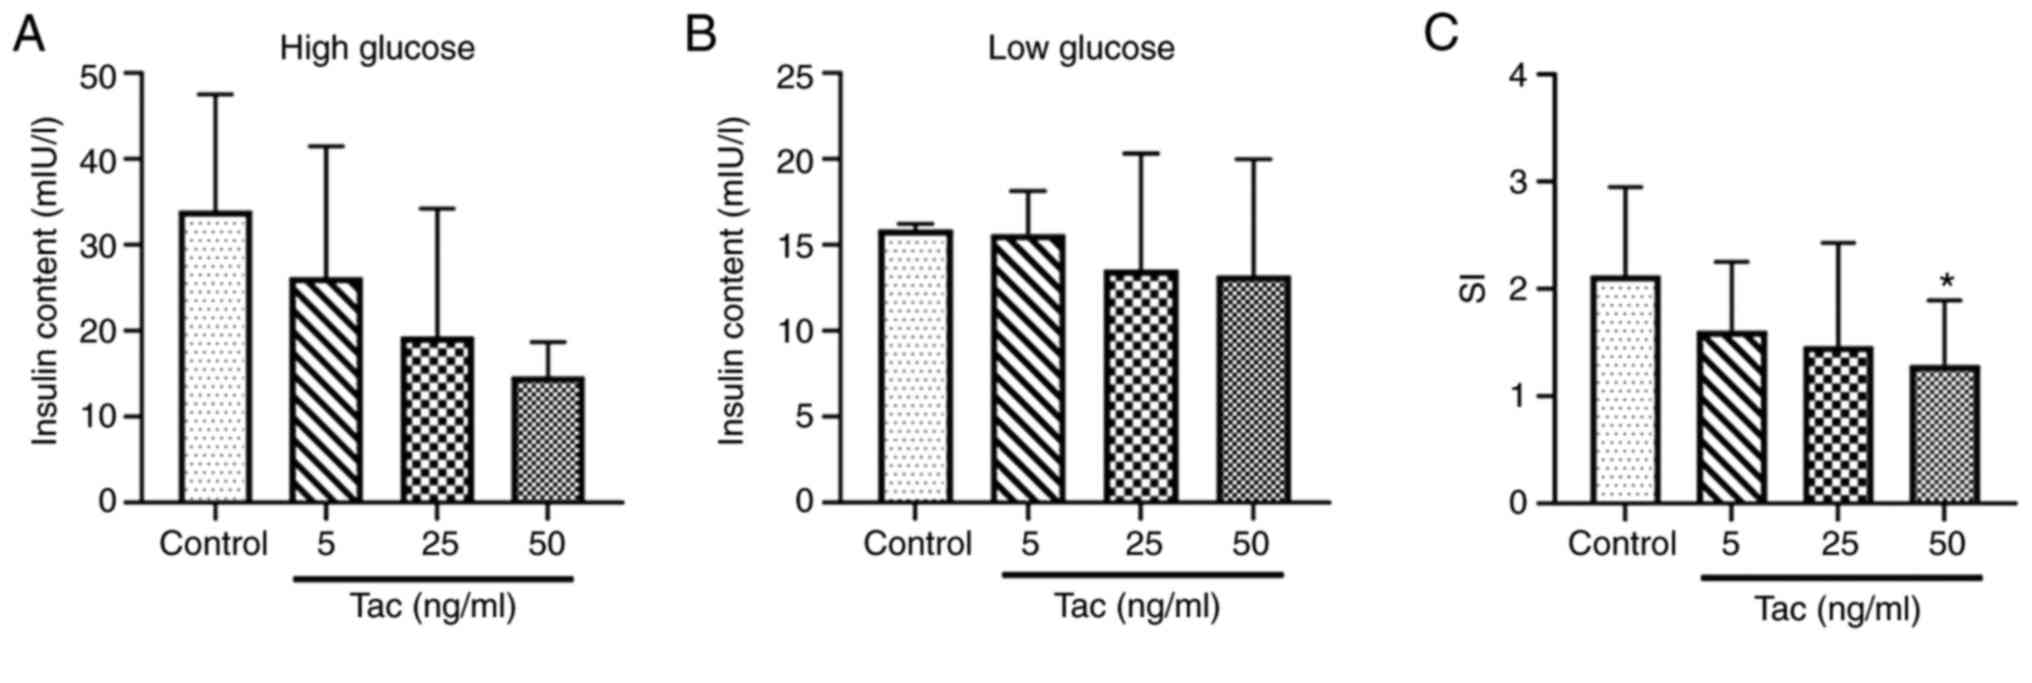
Tacrolimus inhibits glucose-stimulated
insulin release of Min6 cells
The results demonstrated that, compared with the
control group, the insulin secretion contents stimulated by high
glucose solution (16.7 mmol/l) were decreased after treatment with
5, 25 and 50 ng/ml tacrolimus (Fig.
2A), although no significant differences were identified
(P>0.05), and the insulin secretion contents in the low glucose
(2.8 mmol/l) treatment groups showed no obvious decrease
(P>0.05; Fig. 2B); the SI in the
50 ng/ml tacrolimus group showed a significant decrease compared
with the control group (P<0.05; Fig.
2C), which suggested that tacrolimus could inhibit the
secretion function of islet cells.
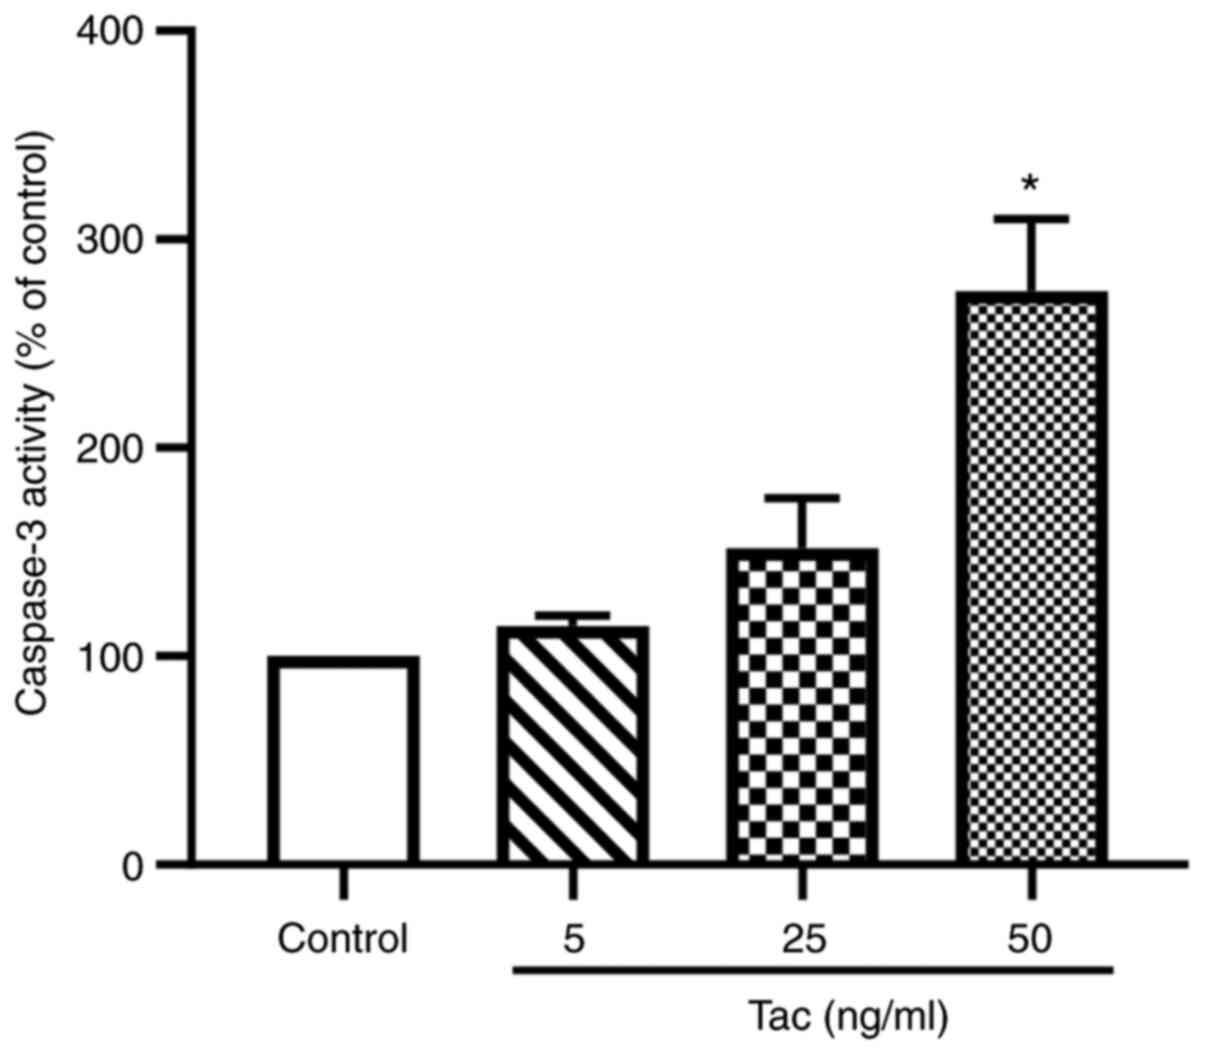
Tacrolimus induces the apoptosis of
Min6 cells
As shown in Fig. 3,
after treatment with 5, 25 and 50 ng/ml tacrolimus for 48 h, the
caspase-3 activities were notably increased compared with the
control group. Treatment with 25 ng/ml tacrolimus could enhance the
activity of caspase-3 by 51.7%, whereas 50 ng/ml tacrolimus could
significantly increase the activity of caspase-3 by 175.1%
(P<0.05). These results suggested that tacrolimus may induce the
apoptosis of islet β cells.
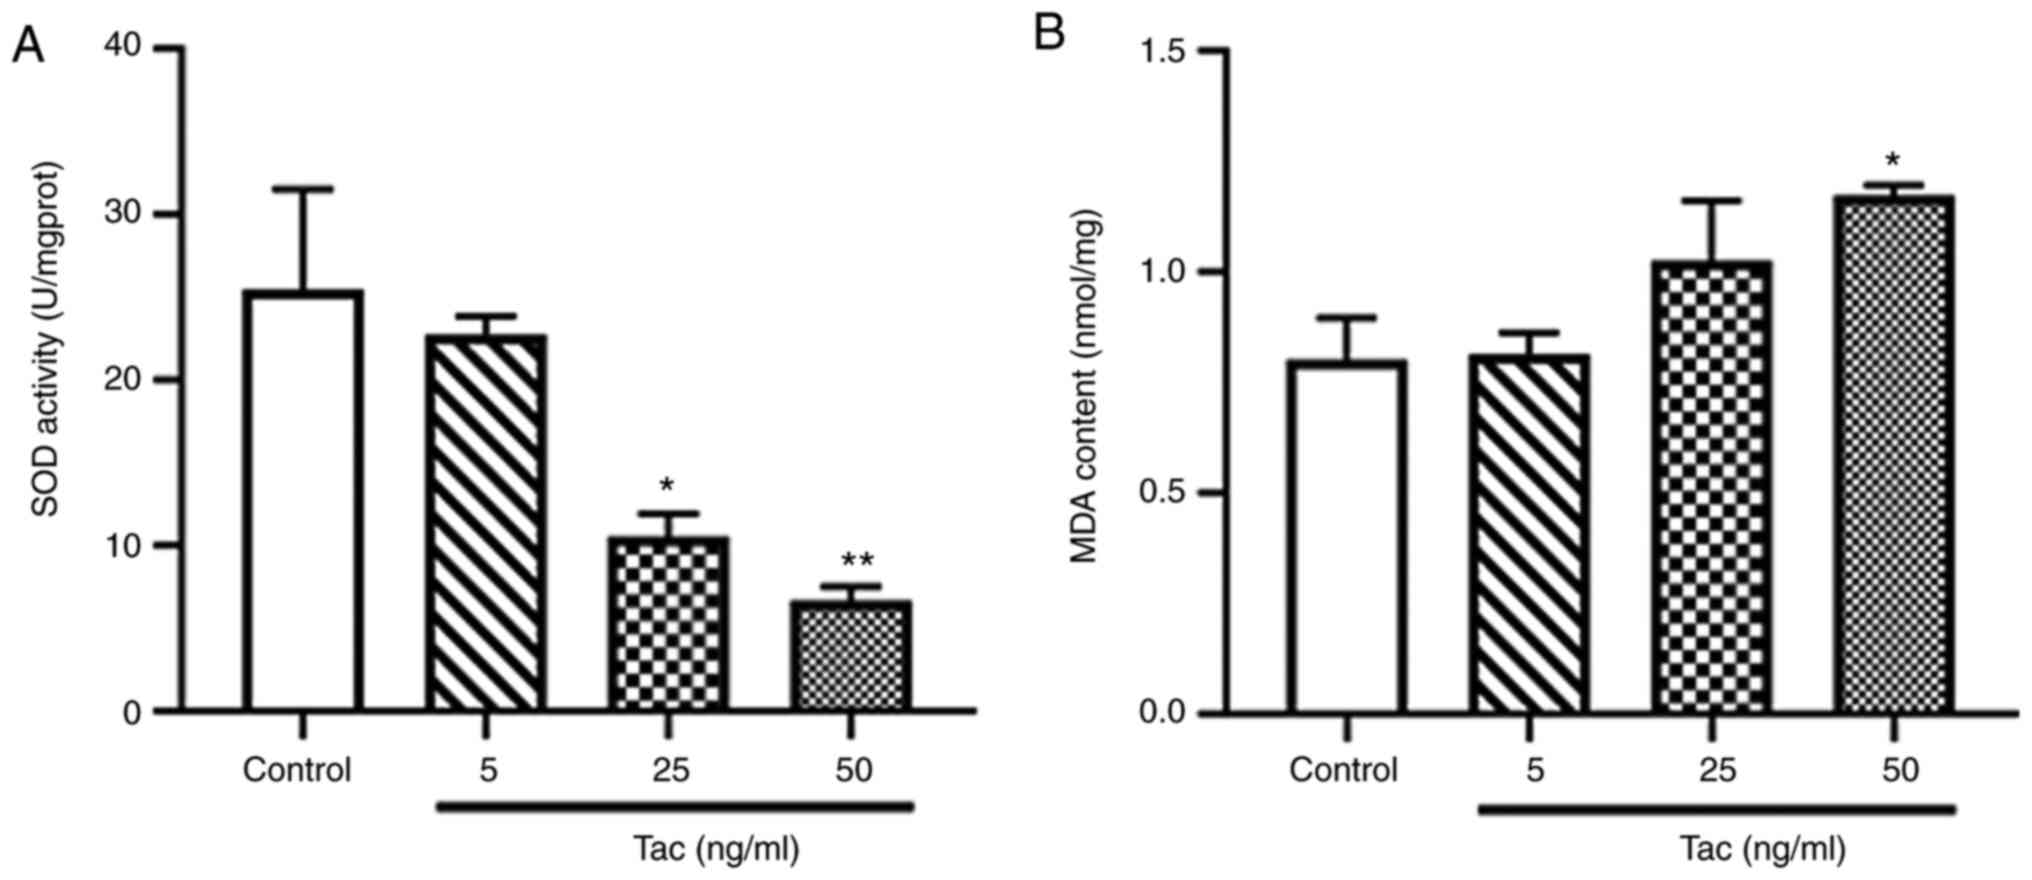
Tacrolimus decreases SOD activity and
increases the MDA level
The activity of SOD in Min6 cells was significantly
inhibited following treatment with 25 and 50 ng/ml tacrolimus for
48 h (P<0.05 and P<0.01; Fig.
4A), especially in the 50 ng/ml tacrolimus group. Moreover, it
was found that 50 ng/ml tacrolimus significantly increase the level
of MDA in Min6 cells treated with tacrolimus for 48 h (P<0.05;
Fig. 4B). These results suggested
that tacrolimus may cause oxidative stress in pancreatic β
cells.
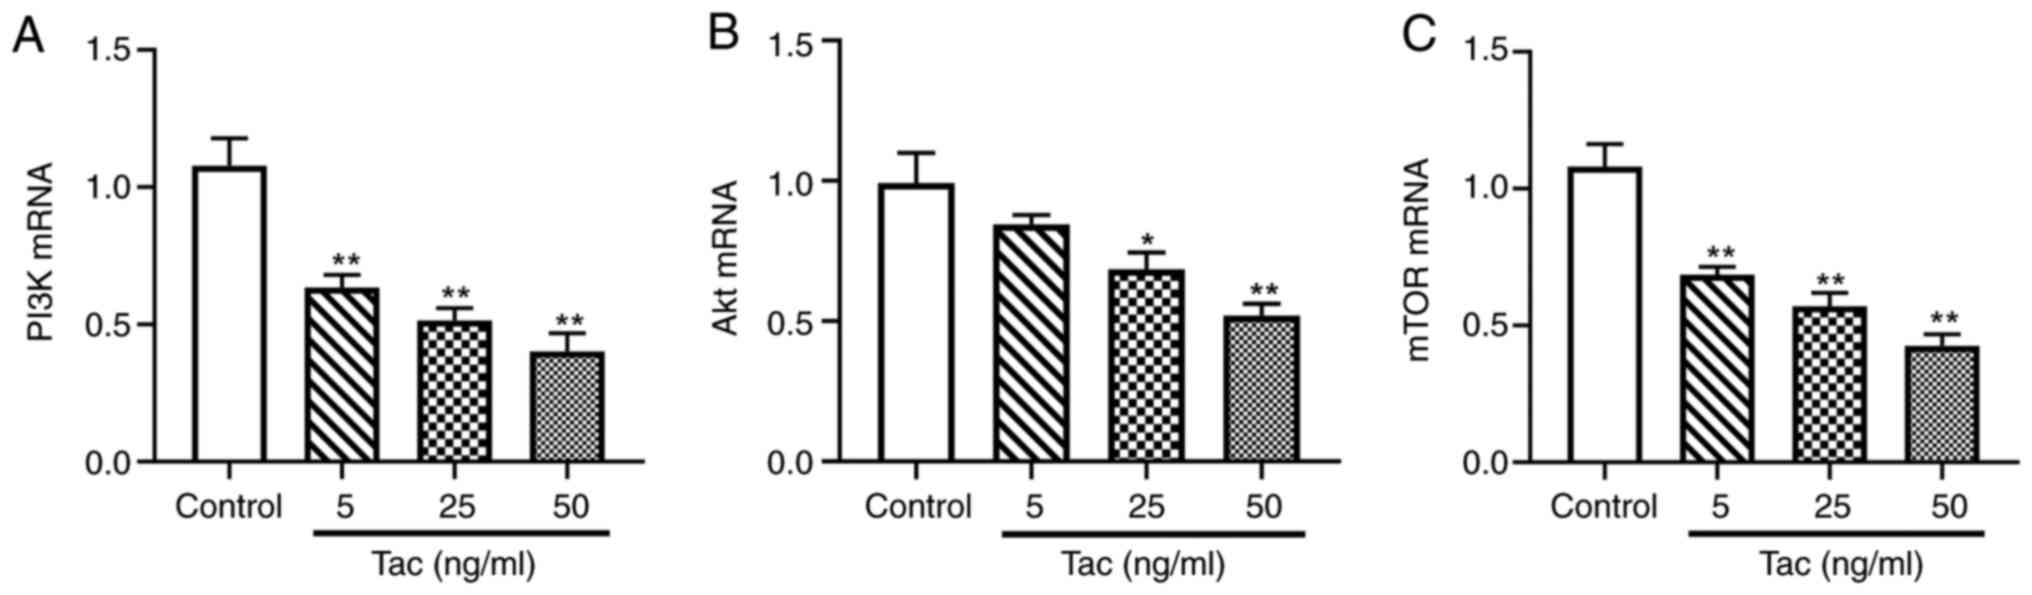
Tacrolimus decreases the mRNA
expression levels of PI3K, Akt and mTOR
As presented in Fig.
5, compared with the control group, 5, 25 and 50 ng/ml
tacrolimus treatments significantly downregulated the mRNA
expression levels of PI3K and mTOR (P<0.01). Tacrolimus
concentrations of 25 ng/ml (P<0.05) and 50 ng/ml (P<0.01),
but not 5 ng/ml (P>0.05), also significantly reduce the
expression level of Akt mRNA. These results indicated that
tacrolimus decreased the mRNA expression levels of components of
the PI3K/Akt/mTOR pathway.
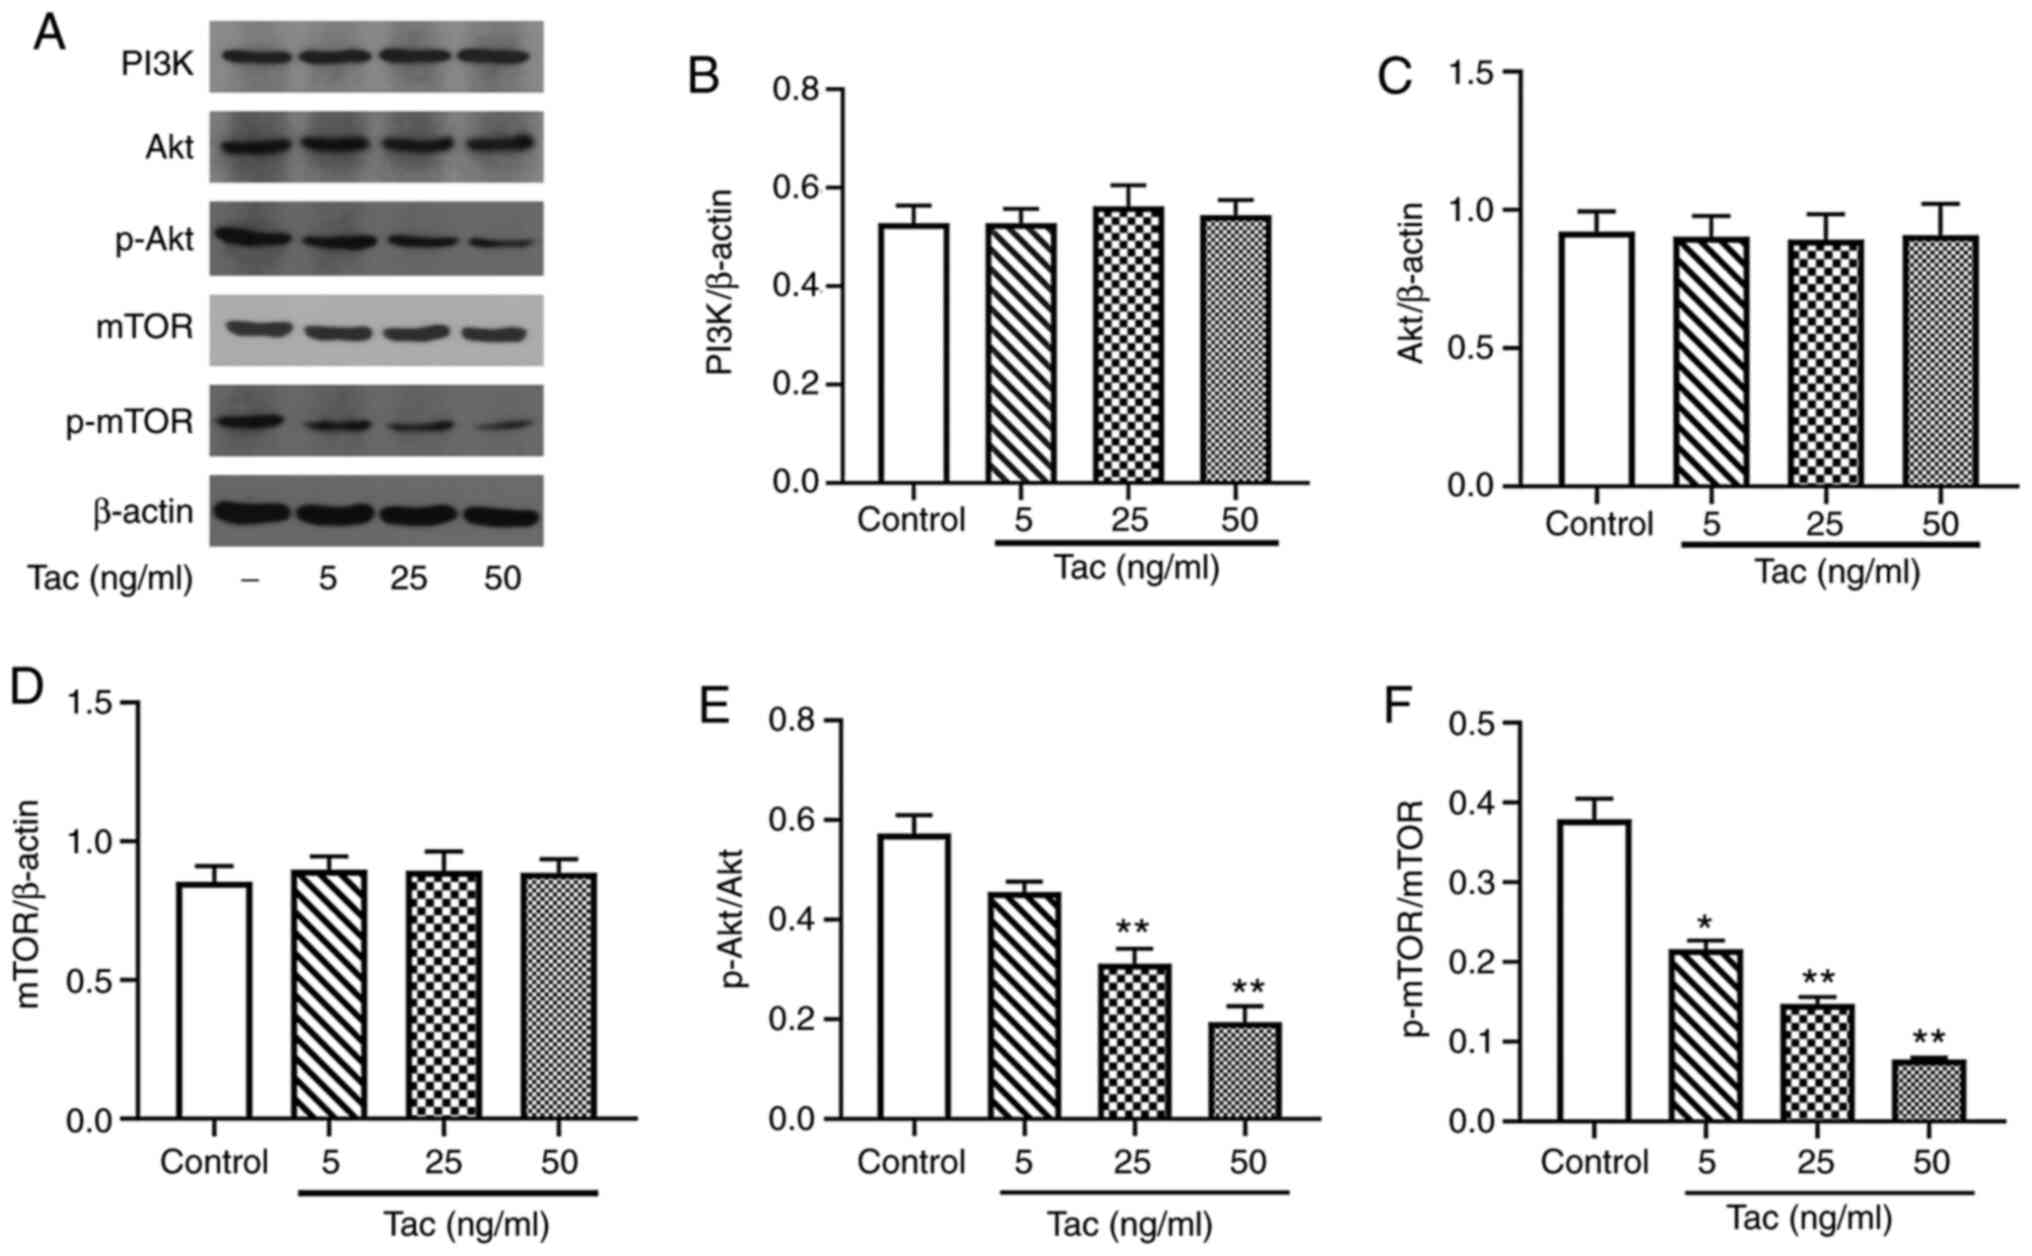
Tacrolimus inhibits the expression
levels of p-Akt and p-mTOR but not PI3K, Akt and mTOR
Compared with the control group, the expression
levels of total PI3K, Akt and mTOR proteins showed no significant
difference when treated with different concentrations of tacrolimus
(P>0.05; Fig. 6A-D). However,
after 48 h treatment with 25 and 50 ng/ml tacrolimus, the
expression levels of p-Akt and p-mTOR in Min6 cells were
significantly decreased compared with the control group (P<0.01;
Fig. 6A, E and F). Furthermore, 5
ng/ml tacrolimus significantly decreased the expression level of
p-mTOR protein (P<0.05), but had no significant effect on the
expression level of p-Akt protein (P>0.05).
Discussion
PTDM is a known side effect in transplant
recipients; it is associated with the use of immunosuppressant
drugs, such as tacrolimus (20).
Previous studies have suggested that the possible mechanisms of
PTDM caused by tacrolimus include direct β cell toxicity, reducing
the utility of glucose, inhibition of insulin secretion and
increasing insulin resistance (21,22).
However, the specific mechanism of action has not been fully
elucidated. Direct β cell toxicity is manifested by swelling of the
cytoplasm, formation of vacuoles and induction of cell damage and
apoptosis (23). Tacrolimus can
quickly and directly inhibit insulin exocytosis and affect
glucose-, glucagon-like peptide-1- and potassium chloride-induced
insulin release, as well as increase the caspase-3 activity of
human islet cells after treatment with tacrolimus for 24 h
(17). Soleimanpour et al
(24) reported that tacrolimus
could inhibit mouse pancreatic β cell proliferation and induce
human pancreatic β cell apoptosis, both of which are accompanied by
a decrease of intracellular phosphorylation of Akt. Tacrolimus can
reduce the expression of neuronal PAS domain protein 4 (Npas4) by
inhibiting the activity of calcineurin, thereby causing toxic
effects on β cells. In addition, overexpression of Npas4 can
inhibit the tacrolimus-induced apoptosis of Min6 cells, and the
molecular mechanism may be associated with Akt,
Ca2+/calmodulin-dependent protein kinase and the
downstream signaling molecules of calcineurin (25). Results from the present study
demonstrated that tacrolimus reduced the relative viability of Min6
cells, decreased insulin secretion stimulated by glucose solution
and enhanced the activity of caspase-3 in Min6 cells, which
suggested that tacrolimus may inhibit the viability and the insulin
secretion function of Min6 cells, as well as induce the apoptosis
of Min6 cells.
In previous studies, oxidative stress has been
linked with both the physiological response to insulin and the
pathophysiological mechanisms of diabetes mellitus (26–28);
it is also known to be enhanced in renal transplant recipients
compared with the general population (29). The level of MDA, an oxidative stress
biomarker, is higher in patients with established diabetes mellitus
compared with healthy controls (30,31).
Yepes-Calderón et al (32)
reported that plasma MDA concentration was inversely and
independently associated with long-term risk of PTDM in renal
transplant recipients, and these findings support a potential
underrecognized role of oxidative stress in post-transplantation
glucose homeostasis. Moreover, Jin et al (33) observed that tacrolimus decreased
cell viability and increased reactive oxygen species production in
both insulin-secreting β-cell derived (INS-1) and human kidney-2
(HK-2) cell lines. SOD is an important peroxidase that can
eliminate the possible oxygen free radicals, whereas MDA is a lipid
peroxidation product mediated by oxygen free radicals, and it is
also an important indicator of tissue and cell damage caused by
oxygen free radicals (34). In the
present study, it was found that tacrolimus inhibited SOD activity
and increased cellular MDA levels, suggesting that it may reduce
the ability of Min6 cells to scavenge oxygen free radicals and
leads to oxidative stress, thereby causing the damage of islet β
cells.
The PI3K/Akt/mTOR signaling pathway serves an
important role in cell differentiation, proliferation, cellular
metabolism, cytoskeletal reorganization, apoptosis and survival
(35,36). This pathway also serves a pivotal
role in the metabolic and mitogenic actions of insulin and
insulin-like growth factor1 (37,38).
PI3K is closely associated with oxidative stress, and can inhibit
apoptosis induced by oxidative stress. PI3K p110 α and p110 β serve
important roles in promoting cellular proliferation and
homeostasis, as well as opposing apoptosis caused by oxidative
stress (39). The PI3K/Akt
signaling pathway has important regulatory effects on the
expression levels of genes involved in gluconeogenesis and fatty
acid synthesis by regulating the activity of downstream molecules,
in addition to having important regulatory effects on glucose
transport (37,40). The blockade of this signaling
pathway is one of the most basic mechanisms leading to type 2
diabetes and insulin resistance in peripheral tissues. mTOR
consists of mTOR complex (mTORC)1 and mTORC2. Both mTORC1 and
mTORC2 are activated by the PI3K signaling pathway coupled with
tyrosine kinase. However, mTORC1 is a downstream molecule of Akt
and is activated by p-Akt. As a PDK2, mTORC2 can fully activate Akt
through phosphorylation of the Ser473 site of Akt (41).
A study published in 2019 reported that the mTOR
inhibition may be a mechanism contributing to the diabetogenic
effect of tacrolimus (42). In the
present study, it was demonstrated that tacrolimus could markedly
decrease the expression levels of PI3K, Akt and mTOR mRNA in
vitro. Moreover, tacrolimus showed no obvious effects on the
expression levels of total PI3K, Akt and mTOR proteins, but it
could inhibit p-Akt and p-mTOR expression in Min6 cells in a
dose-dependent manner, especially for p-mTOR. The possible reasons
why the PCR data do not correlate with the western blotting data
for PI3K, Akt and mTOR, include that the transcription and
translation process of mRNA is not synchronized with protein
expression, not all mRNA is expressed and mRNA extracted in PCR is
mainly from the nucleus, whereas proteins extracted for western
blotting are from the entire cell (43). Collectively, the present results
suggested that tacrolimus may lead to diabetes mellitus through the
inhibition of the PI3K/Akt/mTOR signaling pathway.
At present, the prevention and treatment measures
for PTDM caused by tacrolimus mainly include blood glucose
monitoring, replacement of immunosuppressive treatment options,
such as replacing tacrolimus with cyclosporine, and adopting
hypoglycemic programs similar to those for type 2 diabetes,
including changing lifestyle, oral hypoglycemic drugs and insulin
therapy (44). However, a large
number of clinical studies are required to further verify the
effectiveness and safety of long-term use of hypoglycemic drugs in
the treatment of PTDM. The results of the present study suggested
that it may be possible to develop drugs targeting the
PI3K/Akt/mTOR signaling pathway for the prevention and treatment of
PTDM in future.
In summary, results from the present study indicated
that tacrolimus inhibited the viability and insulin secretion of
pancreatic β cells and induced the apoptosis of islet β cells by
inhibiting the expression levels of PI3K, Akt and mTOR genes and
reducing the phosphorylation of Akt and mTOR proteins in the
PI3K/Akt/mTOR signaling pathway. This may be considered as one of
the specific mechanisms of PTDM caused by tacrolimus. However, the
in vivo effects of tacrolimus on the PI3K/Akt/mTOR signaling
pathway remain to be further investigated.
Acknowledgements
Not applicable.
Funding
The present study was supported by the Foundation of
Hubei Province Health and Family Planning Scientific Research
Project (grant no. WJ2018H0080).
Availability of data and materials
The datasets used and/or analyzed during the current
study are available from the corresponding author on reasonable
request.
Authors' contributions
LT conceived and designed the experiments, performed
the experiments, analyzed the data, wrote the manuscript and
prepared figures. WL, YZhan, FZ, YZhao, LZ, JL, ZS, MY and CZ
performed the experiments, analyzed the data and contributed
reagents and analysis tools. LT and WL confirm the authenticity of
all raw data. AY conceived the experiments and corrected the
manuscript. All authors read and approved the final manuscript.
Ethics approval and consent to
participate
Not applicable.
Patient consent for publication
Not applicable.
Competing interests
The authors declare that they have no competing
interests.
References
|
1
|
Gomes MB and Cobas RA: Post-transplant
diabetes mellitus. Diabetol Metab Syndr. 1:142009. View Article : Google Scholar : PubMed/NCBI
|
|
2
|
Jenssen T and Hartmann A: Emerging
treatments for post-transplantation diabetes mellitus. Nat Rev
Nephrol. 11:465–477. 2015. View Article : Google Scholar : PubMed/NCBI
|
|
3
|
Cosio FG, Kudva Y, van der Velde M, Larson
TS, Textor SC, Griffin MD and Stegall MD: New onset hyperglycemia
and diabetes are associated with increased cardiovascular risk
after kidney transplantation. Kidney Int. 67:2415–2421. 2005.
View Article : Google Scholar : PubMed/NCBI
|
|
4
|
Revanur VK, Jardine AG, Kingsmore DB,
Jaques BC, Hamilton DH and Jindal RM: Influence of diabetes
mellitus on patient and graft survival in recipients of kidney
transplantation. Clin Transplant. 15:89–94. 2001. View Article : Google Scholar : PubMed/NCBI
|
|
5
|
Kasiske BL, Snyder JJ, Gilbertson D and
Matas AJ: Diabetes mellitus after kidney transplantation in the
United States. Am J Transplant. 3:178–185. 2003. View Article : Google Scholar : PubMed/NCBI
|
|
6
|
Chowdhury TA: Post-transplant diabetes
mellitus. Clin Med (Lond). 19:392–395. 2019. View Article : Google Scholar : PubMed/NCBI
|
|
7
|
Bloom RD and Crutchlow MF: New-onset
diabetes mellitus in the kidney recipient: Diagnosis and management
strategies. Clin J Am Soc Nephrol. 3 (Suppl 2):S38–S48. 2008.
View Article : Google Scholar : PubMed/NCBI
|
|
8
|
Vincenti F, Friman S, Scheuermann E,
Rostaing L, Jenssen T, Campistol JM, Uchida K, Pescovitz MD,
Marchetti P, Tuncer M, et al: Results of an international,
randomized trial comparing glucose metabolism disorders and outcome
with cyclosporine versus tacrolimus. Am J Transplant. 7:1506–1514.
2007. View Article : Google Scholar : PubMed/NCBI
|
|
9
|
Chakkera HA, Kudva Y and Kaplan B:
Calcineurin inhibitors: Pharmacologic mechanisms impacting both
insulin resistance and insulin secretion leading to glucose
dysregulation and diabetes mellitus. Clin Pharmacol Ther.
101:114–120. 2017. View
Article : Google Scholar : PubMed/NCBI
|
|
10
|
van Hooff JP, Christiaans MH and van
Duijnhoven EM: Tacrolimus and posttransplant diabetes mellitus in
renal transplantation. Transplantation. 79:1465–1469. 2005.
View Article : Google Scholar : PubMed/NCBI
|
|
11
|
Caillard S, Eprinchard L, Perrin P, Braun
L, Heibel F, Moreau F, Kessler L and Moulin B: Incidence and risk
factors of glucose metabolism disorders in kidney transplant
recipients: Role of systematic screening by oral glucose tolerance
test. Transplantation. 91:757–764. 2011. View Article : Google Scholar : PubMed/NCBI
|
|
12
|
Ishihara H, Asano T, Tsukuda K, Katagiri
H, Inukai K, Anai M, Kikuchi M, Yazaki Y, Miyazaki JI and Oka Y:
Pancreatic beta cell line MIN6 exhibits characteristics of glucose
metabolism and glucose-stimulated insulin secretion similar to
those of normal islets. Diabetologia. 36:1139–1145. 1993.
View Article : Google Scholar : PubMed/NCBI
|
|
13
|
Huang X, Liu G, Guo J and Su Z: The
PI3K/AKT pathway in obesity and type 2 diabetes. Int J Biol Sci.
14:1483–1496. 2018. View Article : Google Scholar : PubMed/NCBI
|
|
14
|
Engelman JA, Luo J and Cantley LC: The
evolution of phosphatidylinositol 3-kinases as regulators of growth
and metabolism. Nat Rev Genet. 7:606–619. 2006. View Article : Google Scholar : PubMed/NCBI
|
|
15
|
Wullschleger S, Loewith R and Hall MN: TOR
signaling in growth and metabolism. Cell. 124:471–484. 2006.
View Article : Google Scholar : PubMed/NCBI
|
|
16
|
Redmon JB, Olson LK, Armstrong MB, Greene
MJ and Robertson RP: Effects of tacrolimus (FK506) on human insulin
gene expression, insulin mRNA levels, and insulin secretion in
HIT-T15 cells. J Clin Invest. 98:2786–2793. 1996. View Article : Google Scholar : PubMed/NCBI
|
|
17
|
Johnson JD, Ao Z, Ao P, Li H, Dai LJ, He
Z, Tee M, Potter KJ, Klimek AM, Meloche RM, et al: Different
effects of FK506, rapamycin, and mycophenolate mofetil on
glucose-stimulated insulin release and apoptosis in human islets.
Cell Transplant. 18:833–845. 2009. View Article : Google Scholar : PubMed/NCBI
|
|
18
|
Sakata N, Egawa S, Sumi S and Unno M:
Optimization of glucose level to determine the stimulation index of
isolated rat islets. Pancreas. 36:417–423. 2008. View Article : Google Scholar : PubMed/NCBI
|
|
19
|
Livak KJ and Schmittgen TD: Analysis of
relative gene expression data using real-time quantitative PCR and
the 2(-Delta Delta C(T)) method. Methods. 25:402–408. 2001.
View Article : Google Scholar : PubMed/NCBI
|
|
20
|
Prokai A, Fekete A, Pasti K, Rusai K,
Banki NF, Reusz G and Szabo AJ: The importance of different
immunosuppressive regimens in the development of posttransplant
diabetes mellitus. Pediatr Diabetes. 13:81–91. 2012. View Article : Google Scholar : PubMed/NCBI
|
|
21
|
Rangel EB: Tacrolimus in pancreas
transplant: A focus on toxicity, diabetogenic effect and drug-drug
interactions. Expert Opin Drug Metab Toxicol. 10:1585–1605. 2014.
View Article : Google Scholar : PubMed/NCBI
|
|
22
|
Rysz J, Franczyk B, Radek M,
Ciałkowska-Rysz A and Gluba-Brzózka A: Diabetes and cardiovascular
risk in renal transplant patients. Int J Mol Sci. 22:34222021.
View Article : Google Scholar : PubMed/NCBI
|
|
23
|
Drachenberg CB, Klassen DK, Weir MR,
Wiland A, Fink JC, Bartlett ST, Cangro CB, Blahut S and
Papadimitriou JC: Islet cell damage associated with tacrolimus and
cyclosporine: Morphological features in pancreas allograft biopsies
and clinical correlation. Transplantation. 68:396–402. 1999.
View Article : Google Scholar : PubMed/NCBI
|
|
24
|
Soleimanpour SA, Crutchlow MF, Ferrari AM,
Raum JC, Groff DN, Rankin MM, Liu C, De León DD, Naji A, Kushner JA
and Stoffers DA: Calcineurin signaling regulates human islet
{beta}-cell survival. J Biol Chem. 285:40050–40059. 2010.
View Article : Google Scholar : PubMed/NCBI
|
|
25
|
Speckmann T, Sabatini PV, Nian C, Smith RG
and Lynn FC: Npas4 transcription factor expression is regulated by
calcium signaling pathways and prevents tacrolimus-induced
cytotoxicity in pancreatic beta cells. J Biol Chem. 291:2682–2695.
2016. View Article : Google Scholar : PubMed/NCBI
|
|
26
|
Sottero B, Gargiulo S, Russo I, Barale C,
Poli G and Cavalot F: Postprandial dysmetabolism and oxidative
stress in type 2 diabetes: Pathogenetic mechanisms and therapeutic
strategies. Med Res Rev. 35:968–1031. 2015. View Article : Google Scholar : PubMed/NCBI
|
|
27
|
Rehman K and Akash MSH: Mechanism of
generation of oxidative stress and pathophysiology of type 2
diabetes mellitus: How are they interlinked? J Cell Biochem.
118:3577–3585. 2017. View Article : Google Scholar : PubMed/NCBI
|
|
28
|
Aouacheri O, Saka S, Krim M, Messaadia A
and Maidi I: The investigation of the oxidative stress-related
parameters in type 2 diabetes mellitus. Can J Diabetes. 39:44–49.
2015. View Article : Google Scholar : PubMed/NCBI
|
|
29
|
Pérez Fernandez R, Martín Mateo MC, De
Vega L, Bustamante Bustamante J, Herrero M and Bustamante Munguira
E: Antioxidant enzyme determination and a study of lipid
peroxidation in renal transplantation. Ren Fail. 24:353–359. 2002.
View Article : Google Scholar
|
|
30
|
Tsikas D: Assessment of lipid peroxidation
by measuring malondialdehyde (MDA) and relatives in biological
samples, Analytical and biological challenges. Anal Biochem.
524:13–30. 2017. View Article : Google Scholar : PubMed/NCBI
|
|
31
|
Noberasco G, Odetti P, Boeri D, Maiello M
and Adezati L: Malondialdehyde (MDA) level in diabetic subjects.
Relationship with blood glucose and glycosylated hemoglobin. Biomed
Pharmacother. 45:193–196. 1991. View Article : Google Scholar : PubMed/NCBI
|
|
32
|
Yepes-Calderón M, Sotomayor CG, Gomes-Neto
AW, Gans ROB, Berger SP, Rimbach G, Esatbeyoglu T, Rodrigo R,
Geleijnse JM, Navis GJ and Bakker SJL: Plasma malondialdehyde and
risk of new-onset diabetes after transplantation in renal
transplant recipients: A prospective cohort study. J Clin Med.
8:4532019. View Article : Google Scholar
|
|
33
|
Jin J, Jin L, Luo K, Lim SW, Chung BH and
Yang CW: Effect of empagliflozin on tacrolimus-induced pancreas
islet dysfunction and renal injury. Am J Transplant. 17:2601–2616.
2017. View Article : Google Scholar : PubMed/NCBI
|
|
34
|
Ho E, Karimi Galougahi K, Liu CC, Bhindi R
and Figtree GA: Biological markers of oxidative stress:
Applications to cardiovascular research and practice. Redox Biol.
1:483–491. 2013. View Article : Google Scholar : PubMed/NCBI
|
|
35
|
Vivanco I and Sawyers CL: The
phosphatidylinositol 3-Kinase AKT pathway in human cancer. Nat Rev
Cancer. 2:489–501. 2002. View
Article : Google Scholar : PubMed/NCBI
|
|
36
|
Engelman JA: Targeting PI3K signalling in
cancer: Opportunities, challenges and limitations. Nat Rev Cancer.
9:550–562. 2009. View Article : Google Scholar : PubMed/NCBI
|
|
37
|
Whiteman EL, Cho H and Birnbaum MJ: Role
of Akt/protein kinase B in metabolism. Trends Endocrinol Metab.
13:444–451. 2002. View Article : Google Scholar : PubMed/NCBI
|
|
38
|
Asano T, Fujishiro M, Kushiyama A, Nakatsu
Y, Yoneda M, Kamata H and Sakoda H: Role of phosphatidylinositol
3-kinase activation on insulin action and its alteration in
diabetic conditions. Biol Pharm Bull. 30:1610–1616. 2007.
View Article : Google Scholar : PubMed/NCBI
|
|
39
|
Matheny RW Jr and Adamo ML: PI3K p110
alpha and p110 beta have differential effects on Akt activation and
protection against oxidative stress-induced apoptosis in myoblasts.
Cell Death Differ. 17:677–688. 2010. View Article : Google Scholar : PubMed/NCBI
|
|
40
|
Chen XW, Leto D, Xiong T, Yu G, Cheng A,
Decker S and Saltiel AR: A Ral GAP complex links PI 3-kinase/Akt
signaling to RalA activation in insulin action. Mol Biol Cell.
22:141–152. 2011. View Article : Google Scholar : PubMed/NCBI
|
|
41
|
Sudarsanam S and Johnson DE: Functional
consequences of mTOR inhibition. Curr Opin Drug Discov Devel.
13:31–40. 2010.PubMed/NCBI
|
|
42
|
Rodriguez-Rodriguez AE, Donate-Correa J,
Rovira J, Cuesto G, Luis-Ravelo D, Fernandes MX, Acevedo-Arozena A,
Diekmann F, Acebes A, Torres A and Porrini E: Inhibition of the
mTOR pathway: A new mechanism of β cell toxicity induced by
tacrolimus. Am J Transplant. 19:3240–3249. 2019. View Article : Google Scholar : PubMed/NCBI
|
|
43
|
Slobodin B, Han R, Calderone V, Vrielink
JAFO, Loayza-Puch F, Elkon R and Agami R: Transcription impacts the
efficiency of mRNA Translation via Co-transcriptional N6-adenosine
Methylation. Cell. 169:326–337.e12. 2017. View Article : Google Scholar : PubMed/NCBI
|
|
44
|
Juan Khong M and Ping Chong Ch: Prevention
and management of new-onset diabetes mellitus in kidney
transplantation. Neth J Med. 72:127–134. 2014.PubMed/NCBI
|