Introduction
As indicated by global cancer statistics, cervical
squamous cell carcinoma and endocervical adenocarcinoma (CESC)
ranks as the fourth most common cause of cancer-related mortality
in women (1,2). On average, the 5-year survival rate of
patients with CESC is 17% (3).
Human papillomavirus (HPV) infection is considered the leading
cause of CESC (4). However, it is
suggested that other unknown mechanisms may be involved in CESC
occurrence (4). It has been
determined that inflammation plays an important role in tumor
development (5). In addition to HPV
infection, several other factors have been identified as crucial
regulators of CESC progression, such as G-rich RNA sequence binding
factor 1 and transmembrane emp24 domain-containing protein 5
(6). Thus far, the exact mechanisms
underpinning CESC occurrence and progression remain elusive.
Therefore, exploration of the mechanisms underlying the
pathogenesis of CESC, and the development of novel treatment
strategies, are essential.
Chaperone containing TCP1 (CCT) is a bicyclic
chaperone complex comprising 8 unequal components (CCT1-CCT8)
(7). CCT family members are of
importance for actin and tubulin folding, which is necessary for
cellular migration and cell cycle progression (8). Although CCT1 (9), CCT2 (10), CCT4 (11) and CCT8 (12) have been implicated in cellular
proliferation, little is known of the function of CCT3 in
tumorigenesis. Recent research in kidney cancer has identified CCT3
as a novel target and indicator of carcinoma, upstream of
yes-associated protein and transcription factor CP2 (13). The expression of CCT3 was also found
to be increased in hepatocellular carcinoma (HCC), which was
associated with poor patient prognosis (14). In addition, CCT3 upregulation in
thyroid papillary carcinoma (PTC) has been demonstrated to induce
PTC cell proliferation, cell cycle arrest and apoptosis (15). In gastric cancer (GC), experimental
CCT3-knockdown suppressed GC cellular proliferation and induced
apoptosis. However, the exact role of CCT3 in the occurrence of
CESC remains unclear.
The present study aimed to determine the correlation
between CCT3 expression and CESC prognosis and the role of CCT3 in
the progression of CESC. For this purpose, the Tumor Immune
Estimation Resource and Gene Expression Profiling Interactive
Analysis databases were used to analyze the mRNA and protein
expression levels of CCT3 in CESC samples. The effects of CCT3 on
the proliferation and migration of CESC in vitro were
determined using various methods, including proliferation,
Transwell and flow cytometric assays.
Materials and methods
Cell lines and culture
HeLa and SiHa cells were obtained from The Cell Bank
of Type Culture Collection of the Chinese Academy of Sciences. All
cells were cultured in RPMI-1640 medium (HyClone; Cytiva)
supplemented with 10% FBS (Gibco; Thermo Fisher Scientific, Inc.)
at 37°C (5% CO2).
Construction of lentivirus expression
cassette and transfection
To generate the cellular knockdown model, CCT3 short
hairpin RNA (shRNA; 5′-GCTGTGAAGCTGCAGACTT-3′) and shRNA negative
control (shCtrl; 5′-TTCTCCGAACGTGTCACGT-3′) were designed by
Shanghai GeneChem Co., Ltd. A lentivirus expression cassette
expressing CCT3 shRNA was cloned as described in a previous study
(16). Briefly, after annealing,
shRNA fragments were integrated into a lentiviral GV493 vector
(hU6-MCS-CBh-GFP-IRES-puromycin; Shanghai GeneChem Co., Ltd.). To
generate the overexpression model, the CCT3 and FN1 coding
sequences were synthesized by Shanghai GeneChem Co., Ltd. and
integrated into lentiviral GV492
(Ubi-MCS-3FLAG-CBh-gcGFP-IRES-puromycin). The empty GV492 vector
was used as a negative control (OECtrl). A total of
4×10⁵ 293FT cells per well were seeded into a 6 well
plate, and transduced with the target gene construct and the
envelope, packaging and recombinant lentiviral plasmids (3rd
generation system; Cyagen Biosciences, Inc.) at 37°C. After 48 h,
the cells were centrifuged at 10,000 × g for 4 h (4°C) and the
virus-containing supernatant was harvested. HeLa and SiHa cells at
the 3rd passage were then infected (multiplicity of infection, 50)
using 5 µg/ml Polybrene. The cells were cultured at 37°C for 3 days
in RPMI-1640 medium containing 10% FBS and 1 µg/ml puromycin (in
order to select puromycin-resistant cells) and 0.25 µg/ml puromycin
was used for maintenance. Similarly, HeLa and SiHa cells
transfected with blank lentivirus were used to generate the
controls (shCtrl and OECtrl). After 2 days, reverse
transcription-quantitative PCR (RT-qPCR) was performed to confirm
target gene expression. All transfections were conducted using
Lipofectamine® 2000 (Invitrogen; Thermo Fisher
Scientific, Inc.).
Reverse transcription-quantitative PCR
(RT-qPCR)
Total RNA was extracted from cells using
TRIzol® reagent (Invitrogen; Thermo Fisher Scientific,
Inc.) and reverse transcribed into cDNA using the RevertAid First
Strand cDNA Synthesis kit (Promega Corporation) following the
manufacturer's instructions. qPCR was subsequently performed using
iQ™ SYBR-Green Supermix (Bio-Rad Laboratories, Inc.) as previously
described (16,17). The qPCR reaction conditions were as
follows: Initial denaturation at 95°C for 30 sec, followed by 40
cycles at 95°C for 5 sec, 60°C for 10 sec and 72°C for 30 sec. The
specific primers were as follows: CCT3 forward,
5′-TCAGTCGGTGGTCATCTTTGG-3′ and reverse,
5′-CCTCCAGGTATCTTTTCCACTCT-3′; and GAPDH forward,
5′-TGACTTCAACAGCGACACCCA-3′ and reverse,
5′-CACCCTGTTGCTGTAGCCAAA-3′. Relative expression levels were
calculated using the 2−∆∆Cq method (18).
Cell viability assay
Cell viability was determined using an MTT assay.
HeLa and SiHa cells infected with CCT3 shRNA lentivirus and/or FN1
overexpression lentivirus were seeded into 96-well plates
(2×10³ cells/well) and incubated at 37°C for 5 days.
Following incubation, MTT (Sigma-Aldrich; Merck KGaA) solution was
added to each well, followed by incubation for a further 4 h. The
MTT solution was then aspirated and 100 µl DMSO (Sigma-Aldrich;
Merck KGaA) was added to dissolve the formazan crystals. The number
of viable cells was counted using an automated microplate reader
(Molecular Devices, LLC) at a wavelength of 570 nm.
Celigo® adherent cell
cytometry system
HeLa and SiHa cells infected with CCT3 shRNA
lentivirus and/or the FN1 overexpression lentivirus were harvested
in the logarithmic growth phase (Gibco; Thermo Fisher Scientific,
Inc.), resuspended in complete medium and seeded into 96-well
plates (2×10³ cells/well). After plating, a Celigo Image
Cytometer (Nexcelom) was used to evaluate the number of cells by
scanning for green fluorescence daily, for 5 days at room
temperature.
Flow cytometric analysis
HeLa and SiHa cells were transfected with CCT3 shRNA
or the associated negative control. An apoptosis assay was
performed using the Annexin V-FITC/propidium iodide (PI) Apoptosis
Detection kit (Nanjing KeyGen Biotech Co., Ltd.) following the
manufacturer's protocol. The cells were analyzed using a flow
cytometer (FACSCalibur; BD Biosciences) and FlowJo V10.0 (BD
Biosciences). Cells were also stained using a PI staining kit
(Nanjing KeyGen Biotech Co., Ltd.) and the cell cycle was evaluated
by flow cytometry as previously described (16).
Cellular migration and invasion
assays
Cellular invasion and migration assays were
conducted using 24-well Transwell plates with or without Matrigel,
respectively (BD Biosciences). For the migration assay, transfected
cells (1×10⁵) were seeded into the upper chamber without
Matrigel. For the invasion assay, transfected cells
(1×10⁵) were seeded in the upper Matrigel-coated chamber
without serum; for both assay types, the lower chamber was filled
with culture medium supplemented with 15% FBS as a chemoattractant
and cultured for 48 h in 37°C. The migratory and invasive cells in
the lower chamber were room temperature formalin-fixed for 30 min,
stained with crystal violet at room temperature for 20 min and
washed with PBS. Cells were counted by Olympus CX35 light
microscope.
Western blot analysis
Cells were harvested using an enzymatic digestion
method. Subsequently, ice-cold lysis buffer (50 mM Tris, 150 mM
NaCl, 0.5% EDTA and 0.5% NP-40) was added and cells were incubated
for 20 min at 4°C. Centrifugation was performed at 13,000 × g at
4°C for 15 min. Total protein concentration was determined using a
BCA Protein Quantification kit. Total protein (30 µg/lane) was
separated via SDS-PAGE on a 10% gel and subsequently transferred to
a PVDF membrane using the Bio-Rad Transfer System (Bio-Rad
Laboratories, Inc.). Membranes were blocked with 5% non-fat dry
milk for 1 h at room temperature and incubated with primary
antibodies overnight at 4°C (Table
SI). Following secondary antibody incubation for 1 h at room
temperature (HRP-conjugated anti-rabbit and anti-mouse; both
1:3,000; cat. nos. 7074 and 7076, respectively; Cell Signaling
Technology, Inc.), protein expression was determined using the
Pierce ECL System (Thermo Fisher Scientific, Inc.). The protein
band density was determined using ImageJ (version 1.53; National
Institutes of Health).
Bioinformatics analysis
CCT3 mRNA expression in cancer and normal tissues
was analyzed using Tumor Immune Estimation Resource (TIMER) 2.0
(http://timer.comp-genomics.org/) and the
Gene Expression Profiling Interactive Analysis (GEPIA; http://gepia.cancer-pku.cn/) database and Gene
Expression Omnibus (GEO) datasets [GSE63514, https://www.ncbi.nlm.nih.gov/geo/query/acc.cgi?acc=GSE63514
(19), GSE46857, https://www.ncbi.nlm.nih.gov/geo/query/acc.cgi?acc=GSE46857
(20) and GSE9750, https://www.ncbi.nlm.nih.gov/geo/query/acc.cgi?acc=GSE9750
(21) datasets]. The associations
between patient overall survival and disease-free survival, and
CCT3 mRNA expression levels were analyzed using TIMER 2.0 and the
GEPIA database. The protein expression level of CCT3 in cancer and
normal tissues was analyzed using the Protein Atlas database
(https://www.proteinatlas.org/).
Statistical analysis
All data are presented as the mean ± SD. Statistical
differences between two groups were determined using the unpaired
Student's t-test, and one-way ANOVA with Tukey's post hoc test was
used to analyze the differences between multiple groups. P<0.05
was considered to indicate a statistically significant difference.
Overall survival was assessed using the Kaplan-Meier method. The
log-rank test was applied to determine significant differences.
Correlation between CCT3 and FN1 was calculated using Spearman's
method. All statistical analyses were performed using GraphPad
Prism 6 software (GraphPad Software, Inc.).
Results
Evaluation of CCT3 expression level in
GEO and The Cancer Genome Atlas (TCGA) datasets
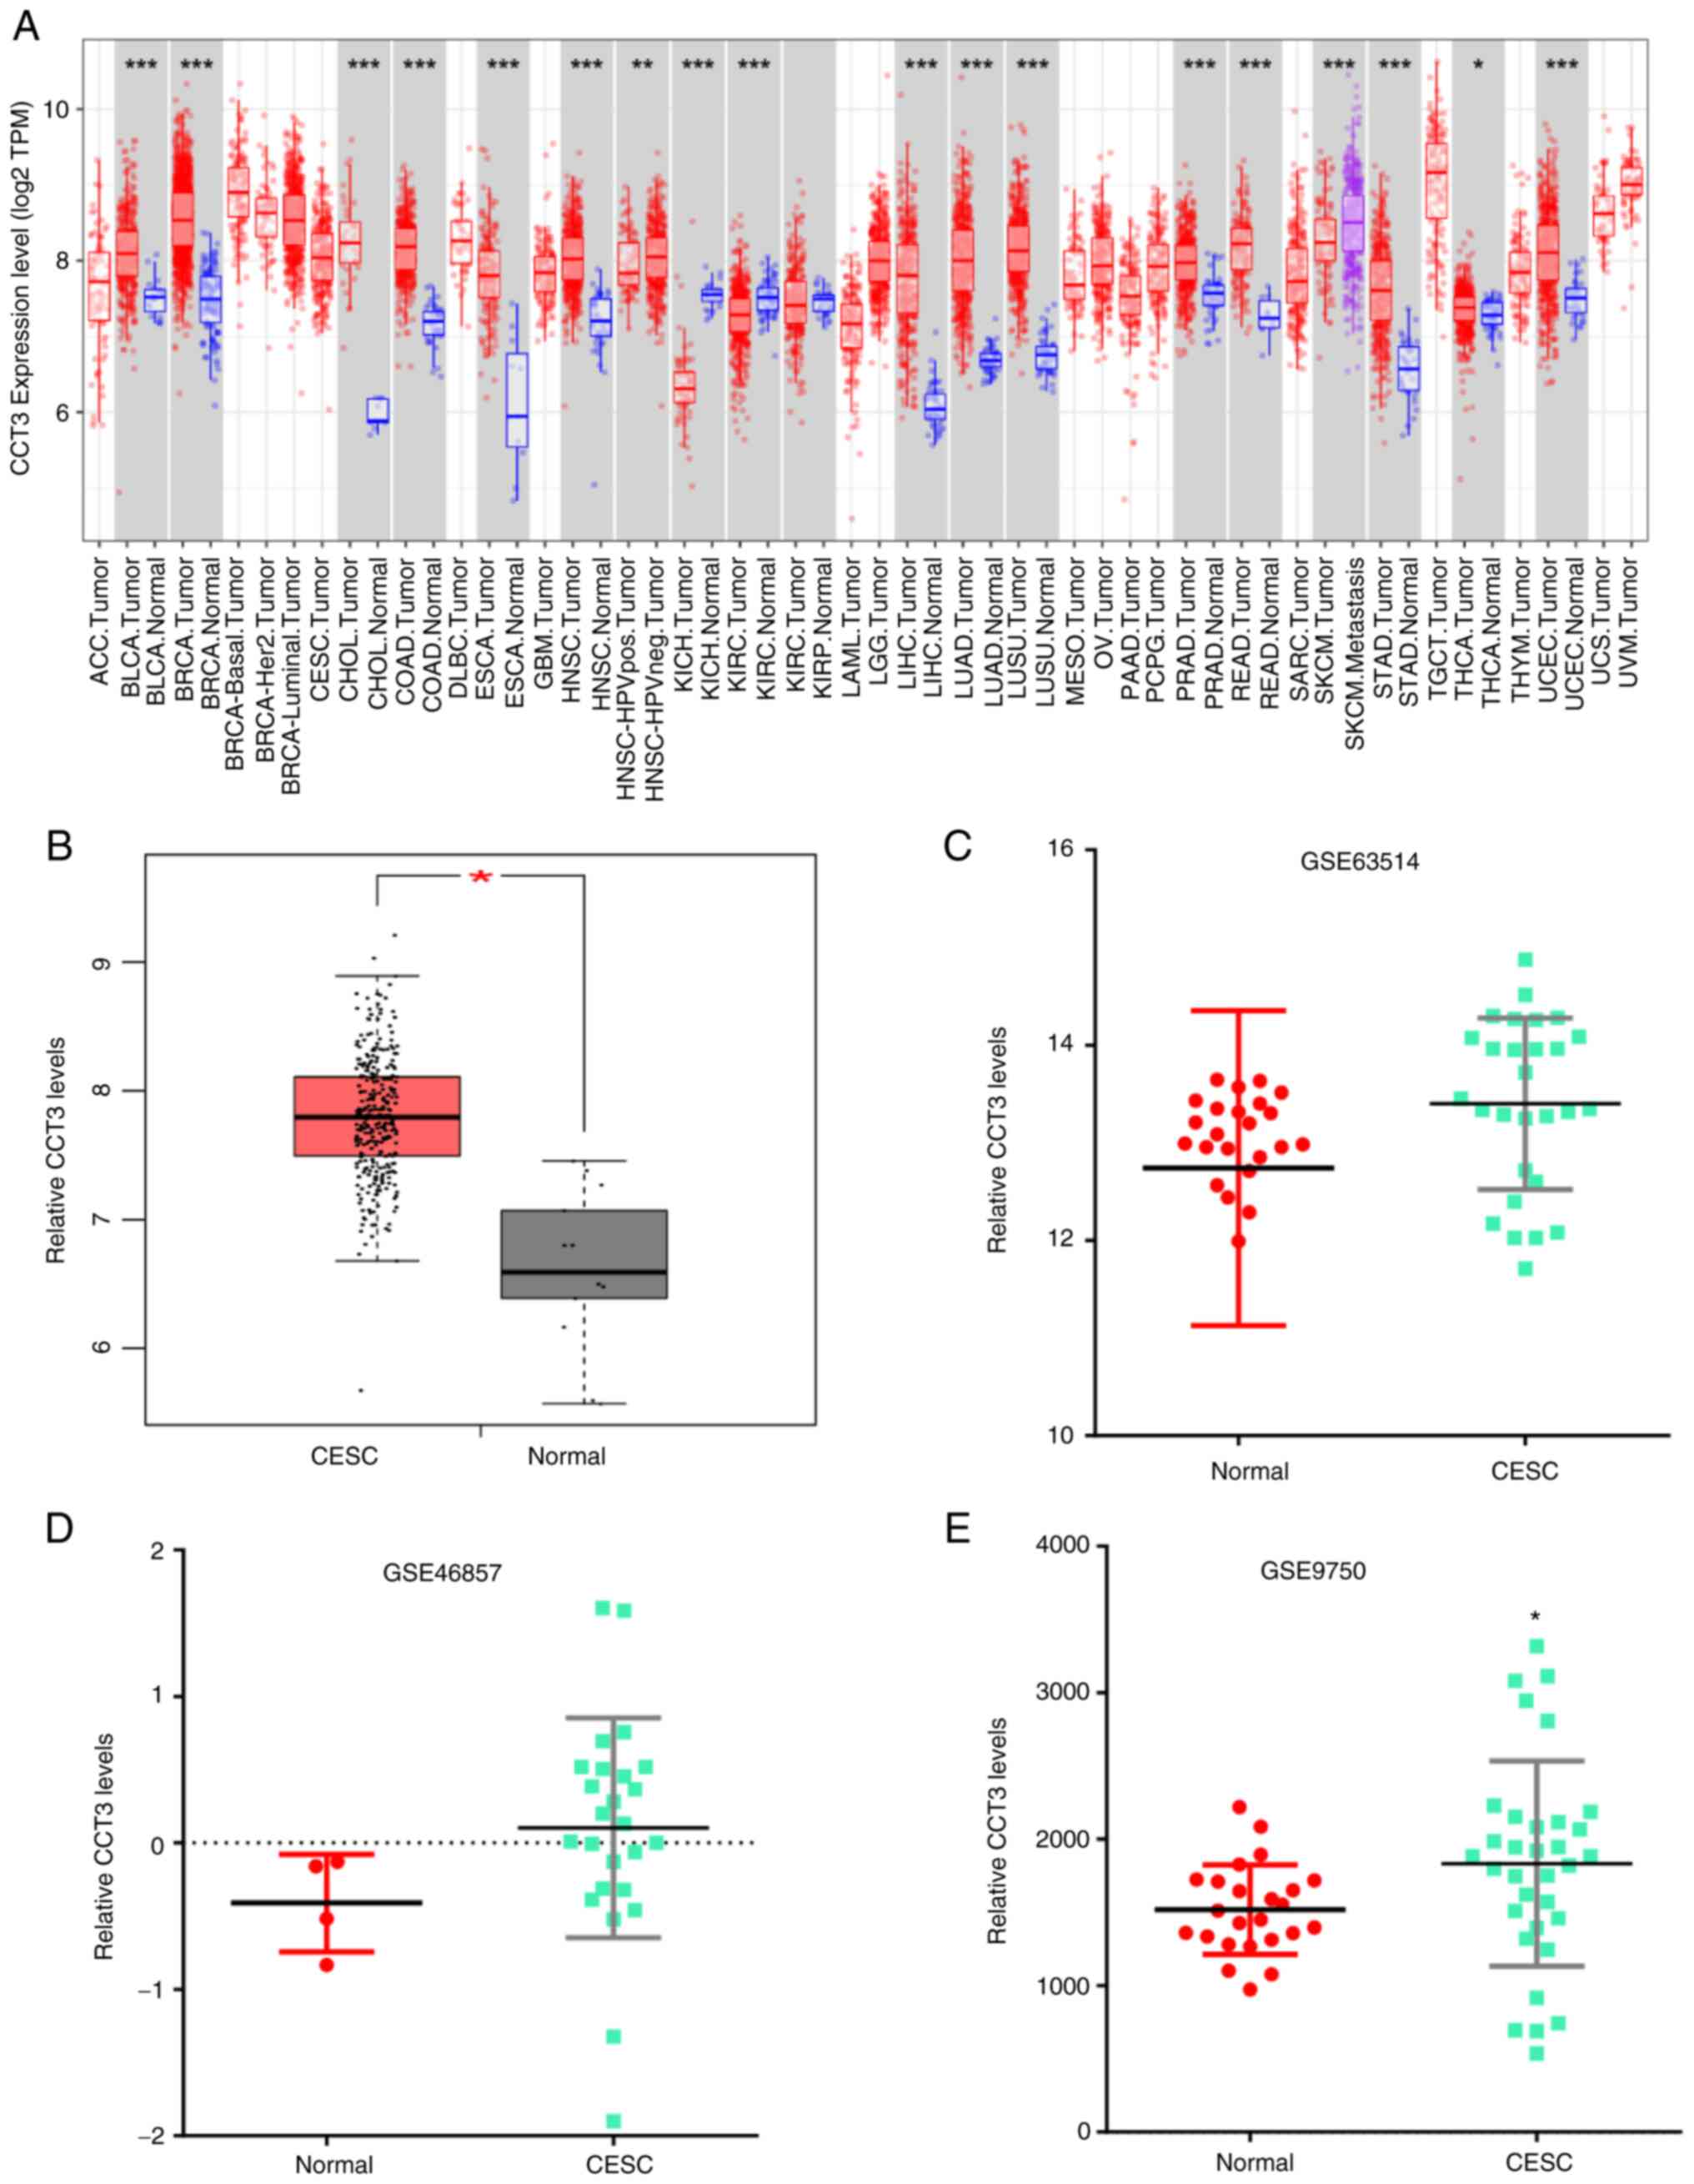
To determine the role of CCT3 in tumor progression,
CCT3 mRNA expression was first measured in various tumors using the
TIMER database. The data revealed that CCT3 expression was
increased in multiple types of human cancer compared with healthy
individuals (Fig. 1A).
Additionally, the analysis of GEPIA datasets revealed that CCT3
expression was markedly increased in 50 paired CESC tumors
(Fig. 1B). The upregulated
expression of CCT3 in tumors was further confirmed in the GSE63514,
GSE46857 and GSE9750 datasets (Fig.
1C-E). These results indicated that CCT3 may play a role in
CESC.
Increased expression of CCT3 is
associated with poor patient prognosis
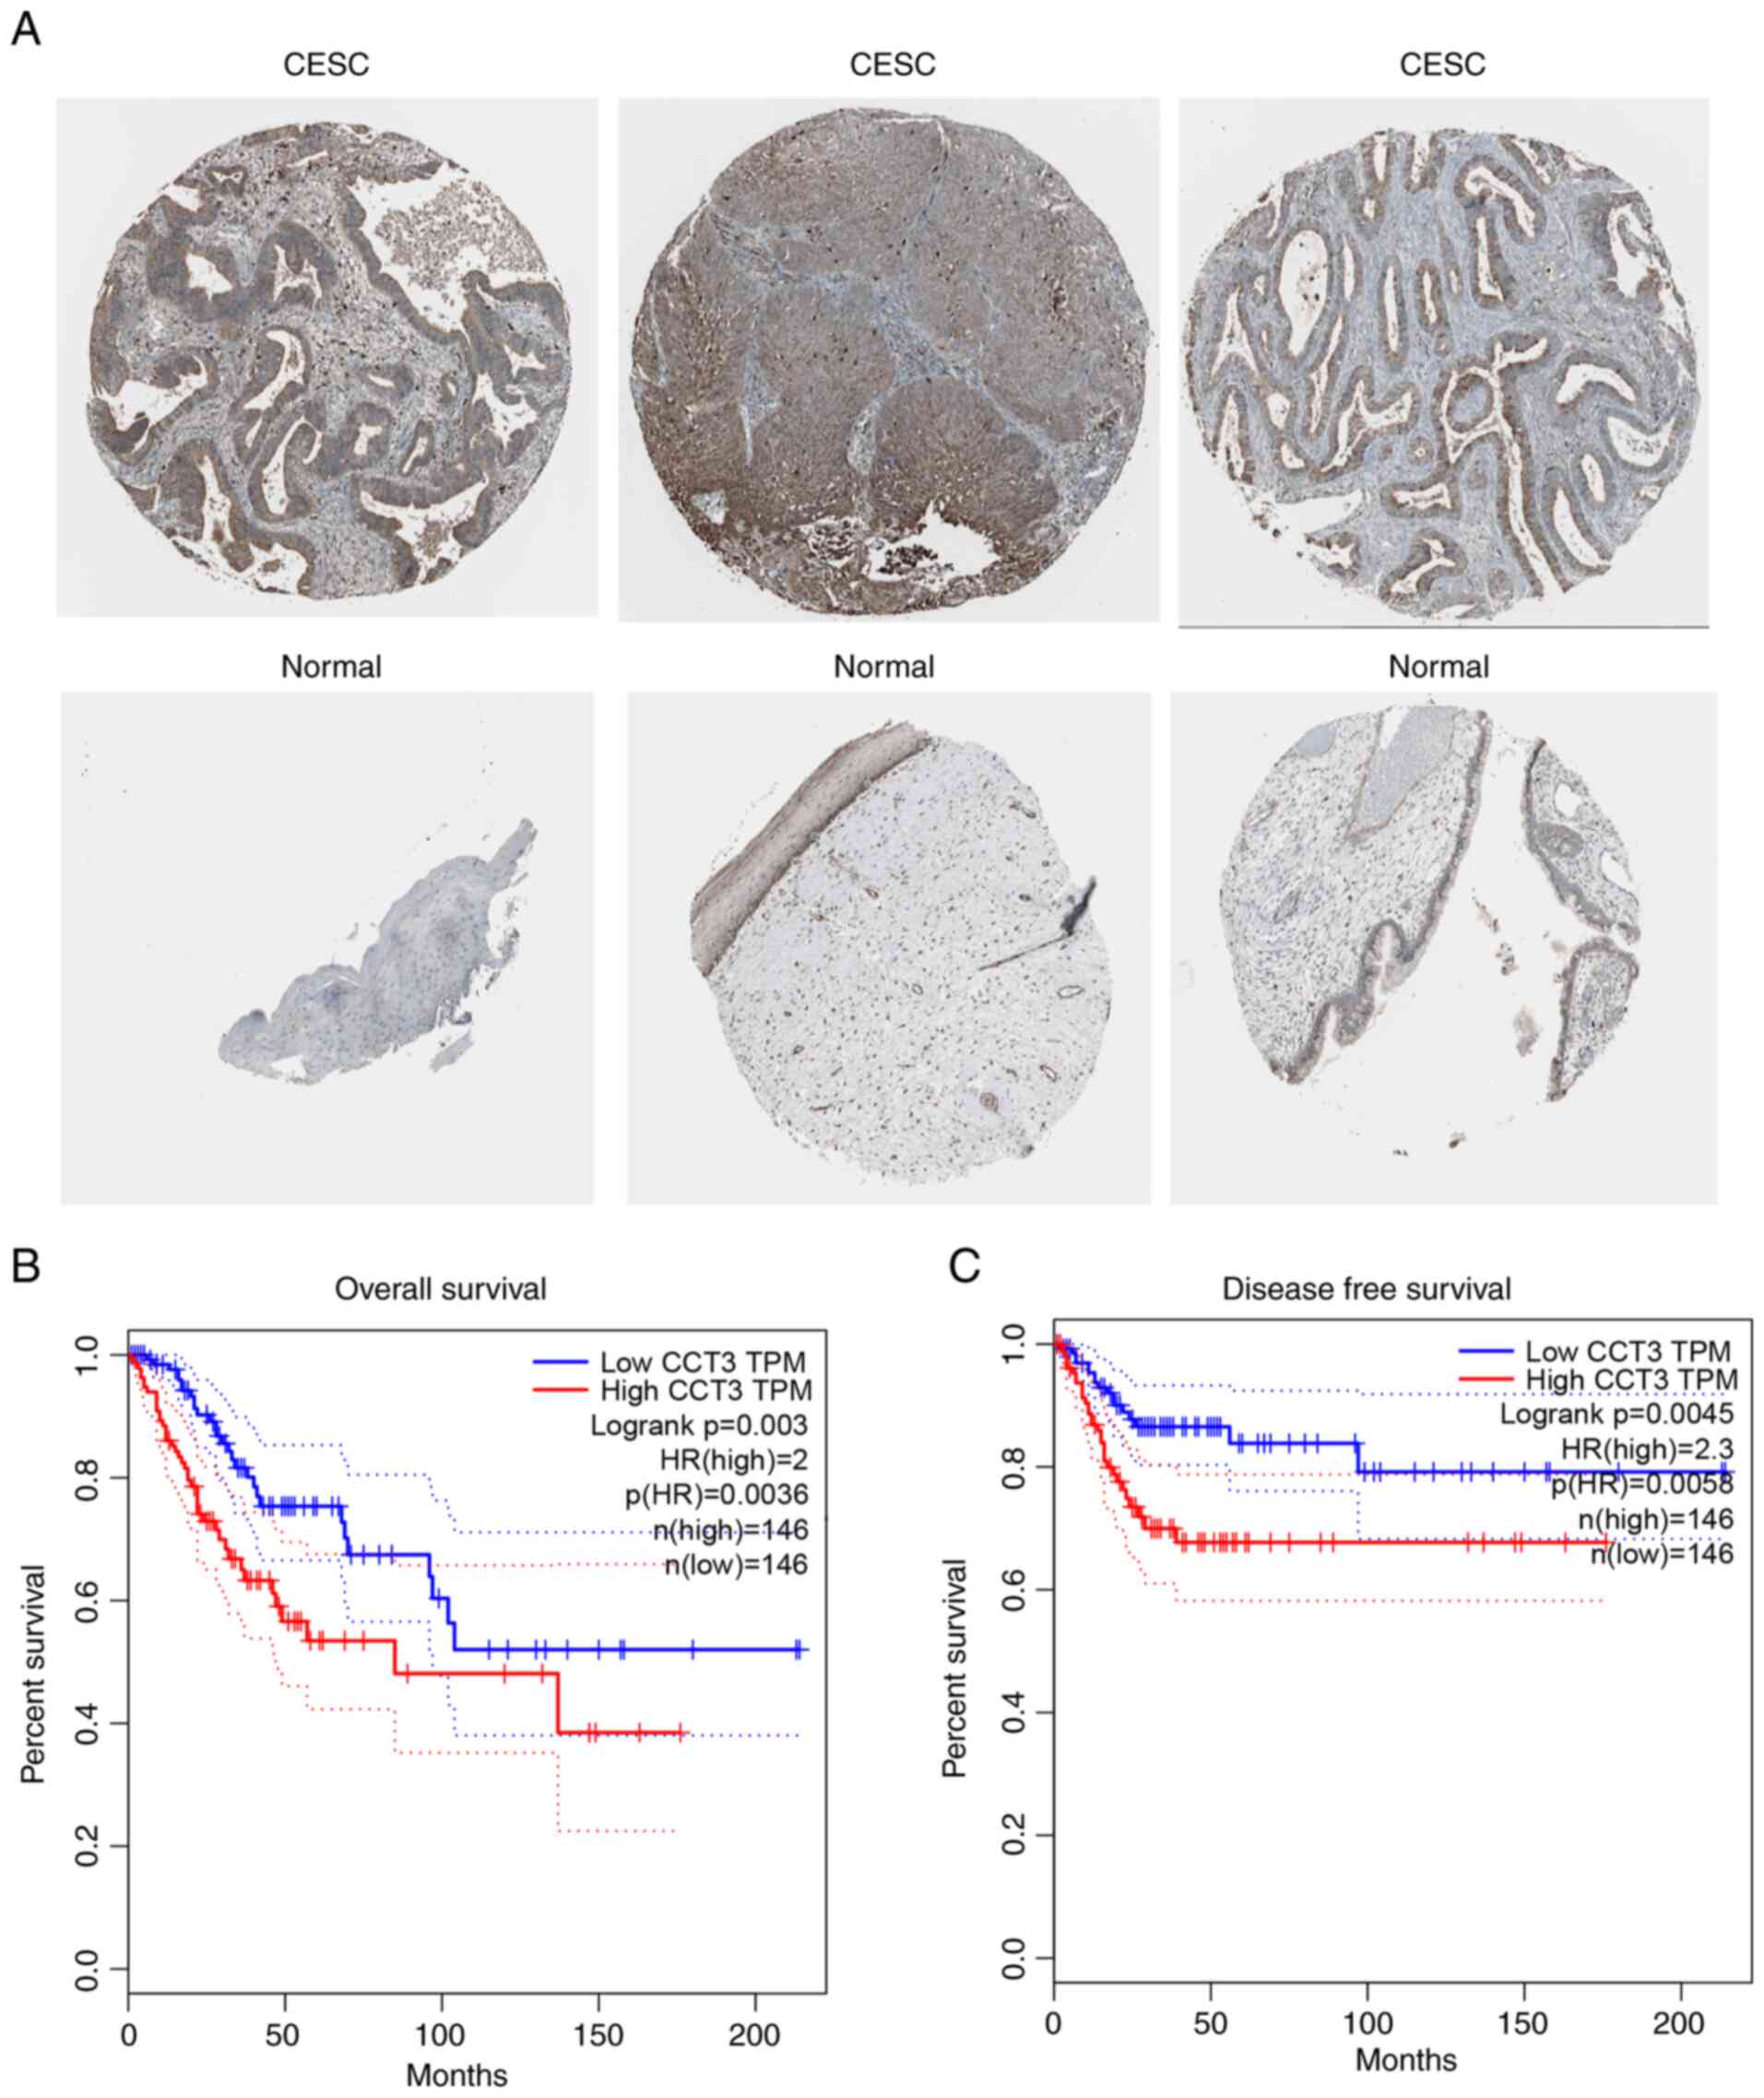
The results of the present study further revealed
that in the Protein Atlas database, CCT3 protein expression was
increased in CESC samples compared with normal samples (Fig. 2A). Furthermore, increased CCT3
expression was associated with a shorter overall survival rate, as
indicated by Kaplan-Meier survival using the GEPIA database
(Fig. 2B). The results also
revealed that a higher expression level of CCT3 was associated with
the poor disease-free survival of patients with CESC, as determined
using data from the GEPIA database (Fig. 2C). These findings demonstrated that
CCT3 may be a potential biomarker for CESC that may be involved in
regulating cancer progression.
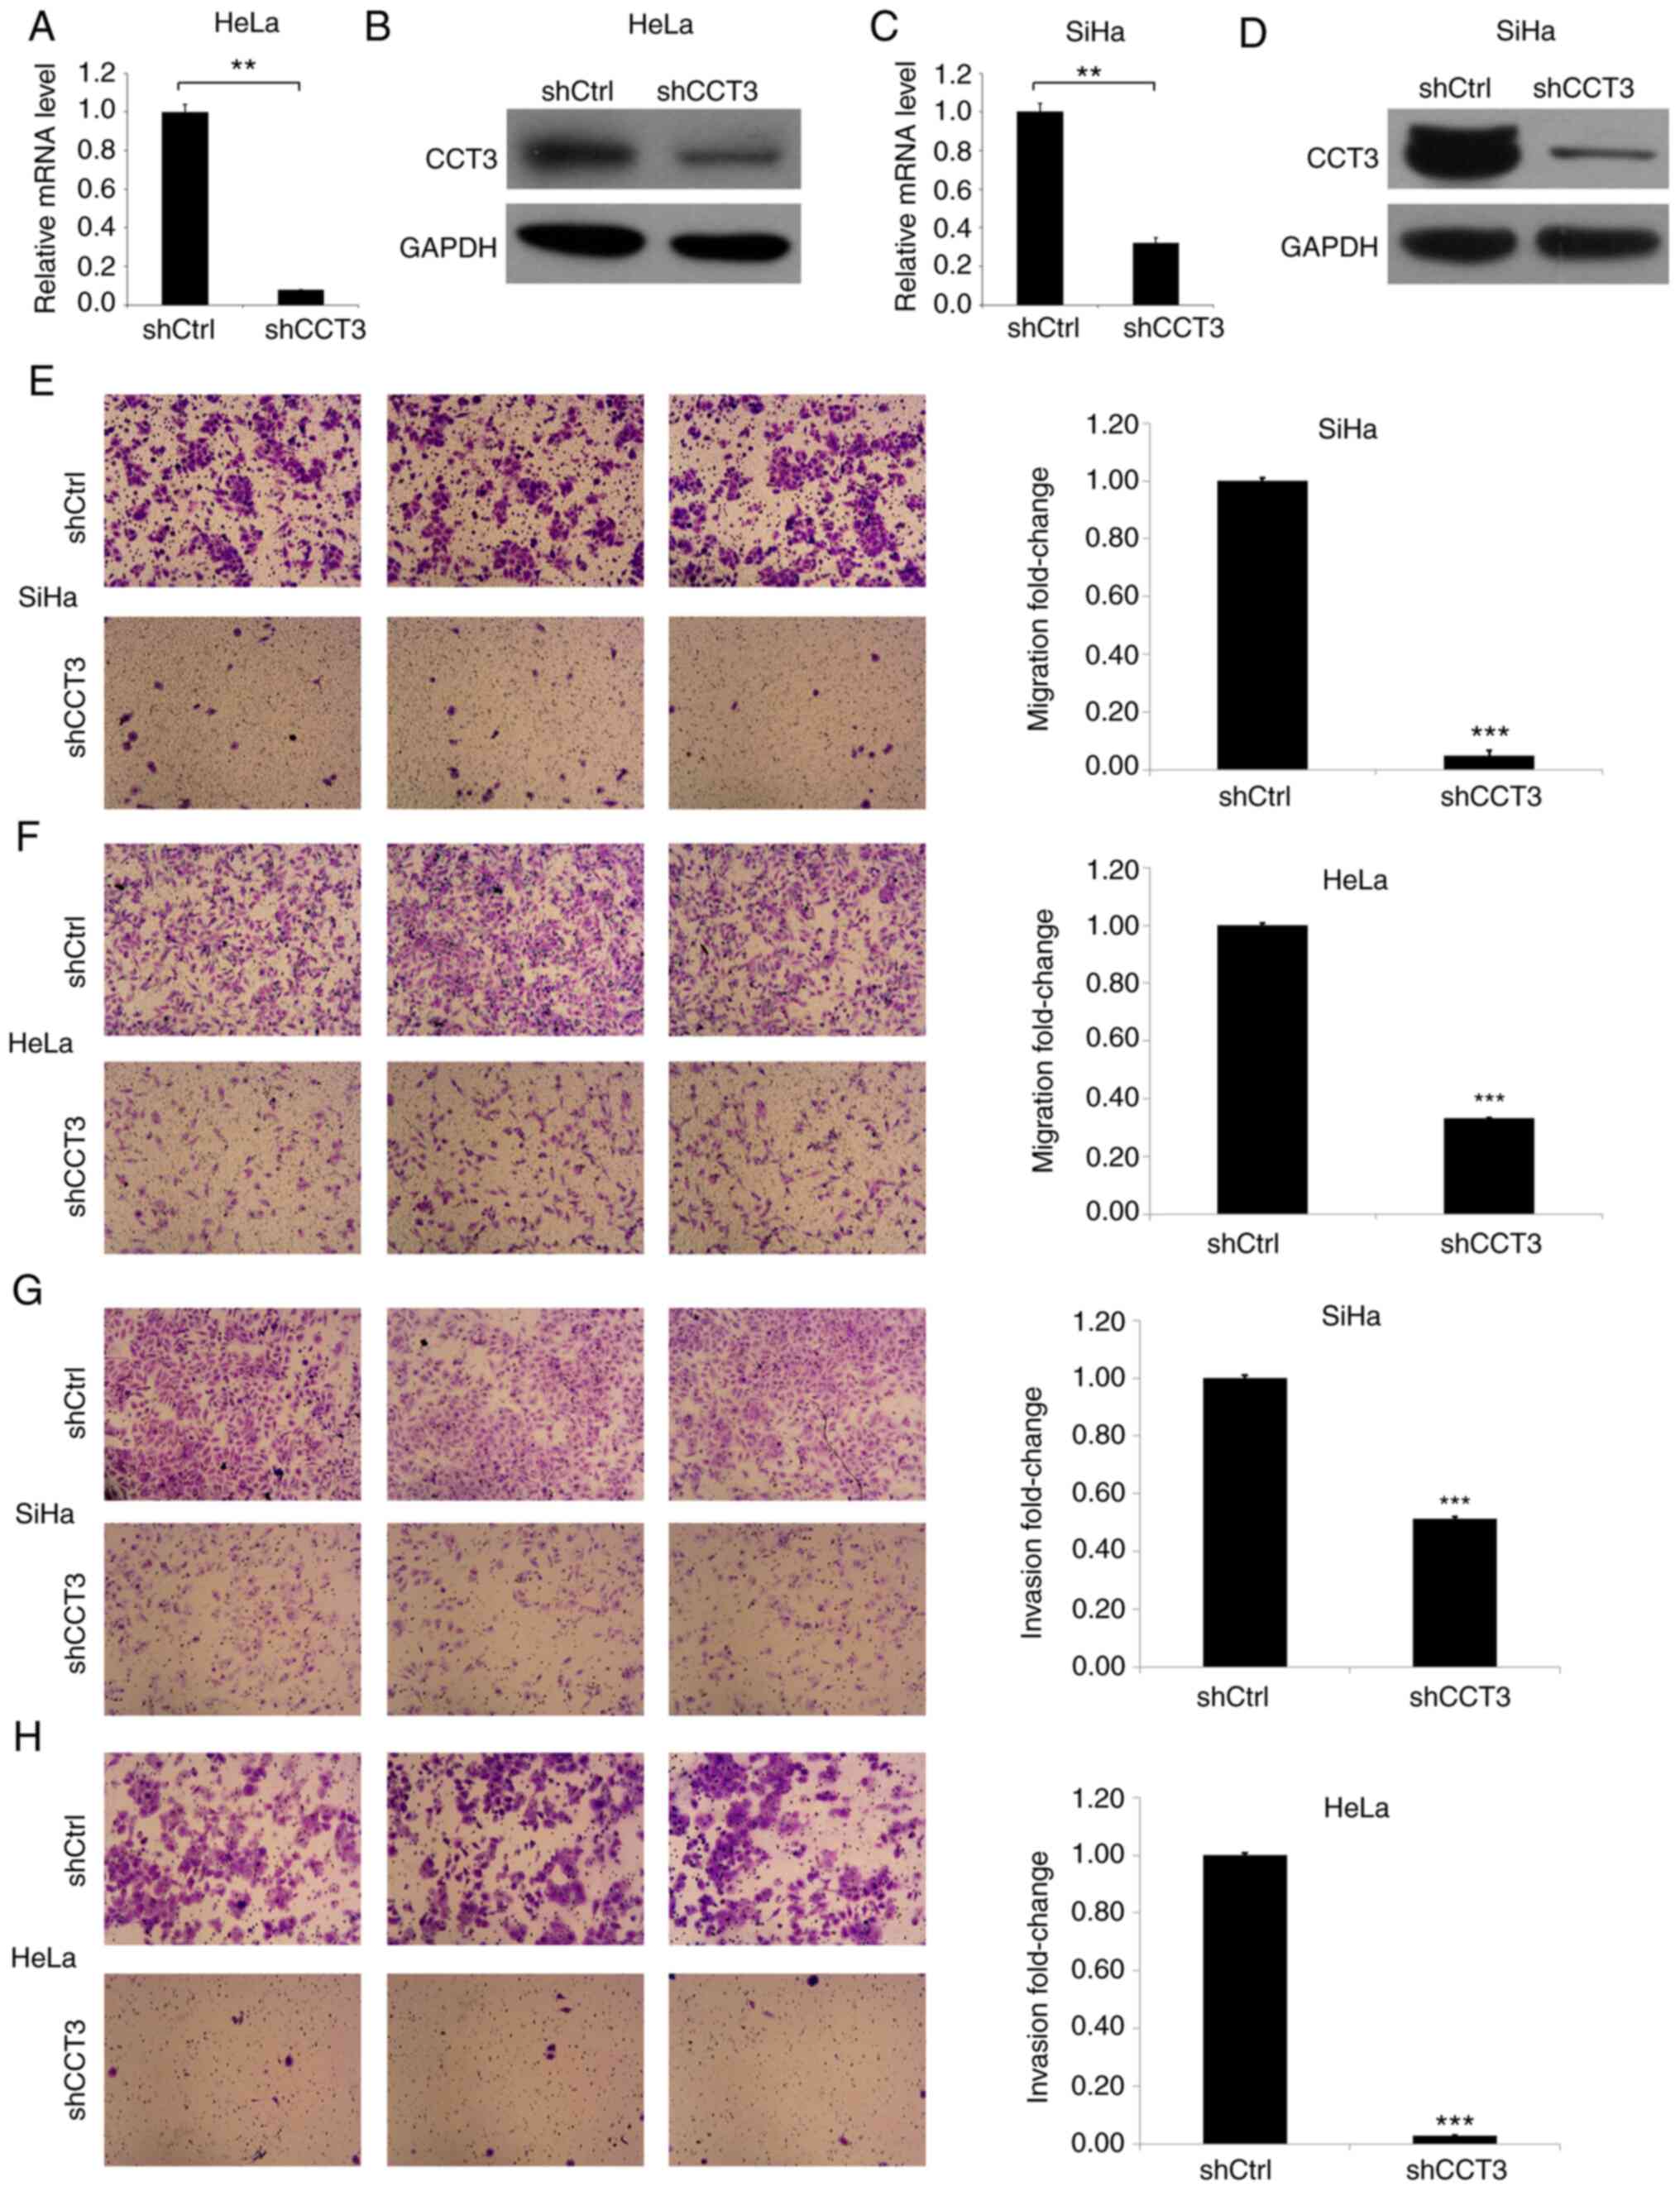
CCT3-knockdown decreases cellular
migration and invasion ability
Next, HeLa and SiHa cells were established in which
CCT3 expression was knocked down (Fig.
3). CCT3 mRNA and protein levels were then determined in the
HeLa and SiHa cells transfected with CCT3 shRNA (Fig. 3A-D). The results of the Transwell
assay indicated that the CCT3-knockdown inhibited the migration of
HeLa and SiHa cells by ~90 and 70%, respectively (Fig. 3E and F). Subsequently, the effects
of CCT3-knockdown on CESC cell invasiveness were evaluated. The
results revealed that the invasiveness of HeLa and SiHa cells was
decreased by ~90 and 45%, respectively, in the CCT3-knockdown
groups compared with the control groups (Fig. 3G and H).
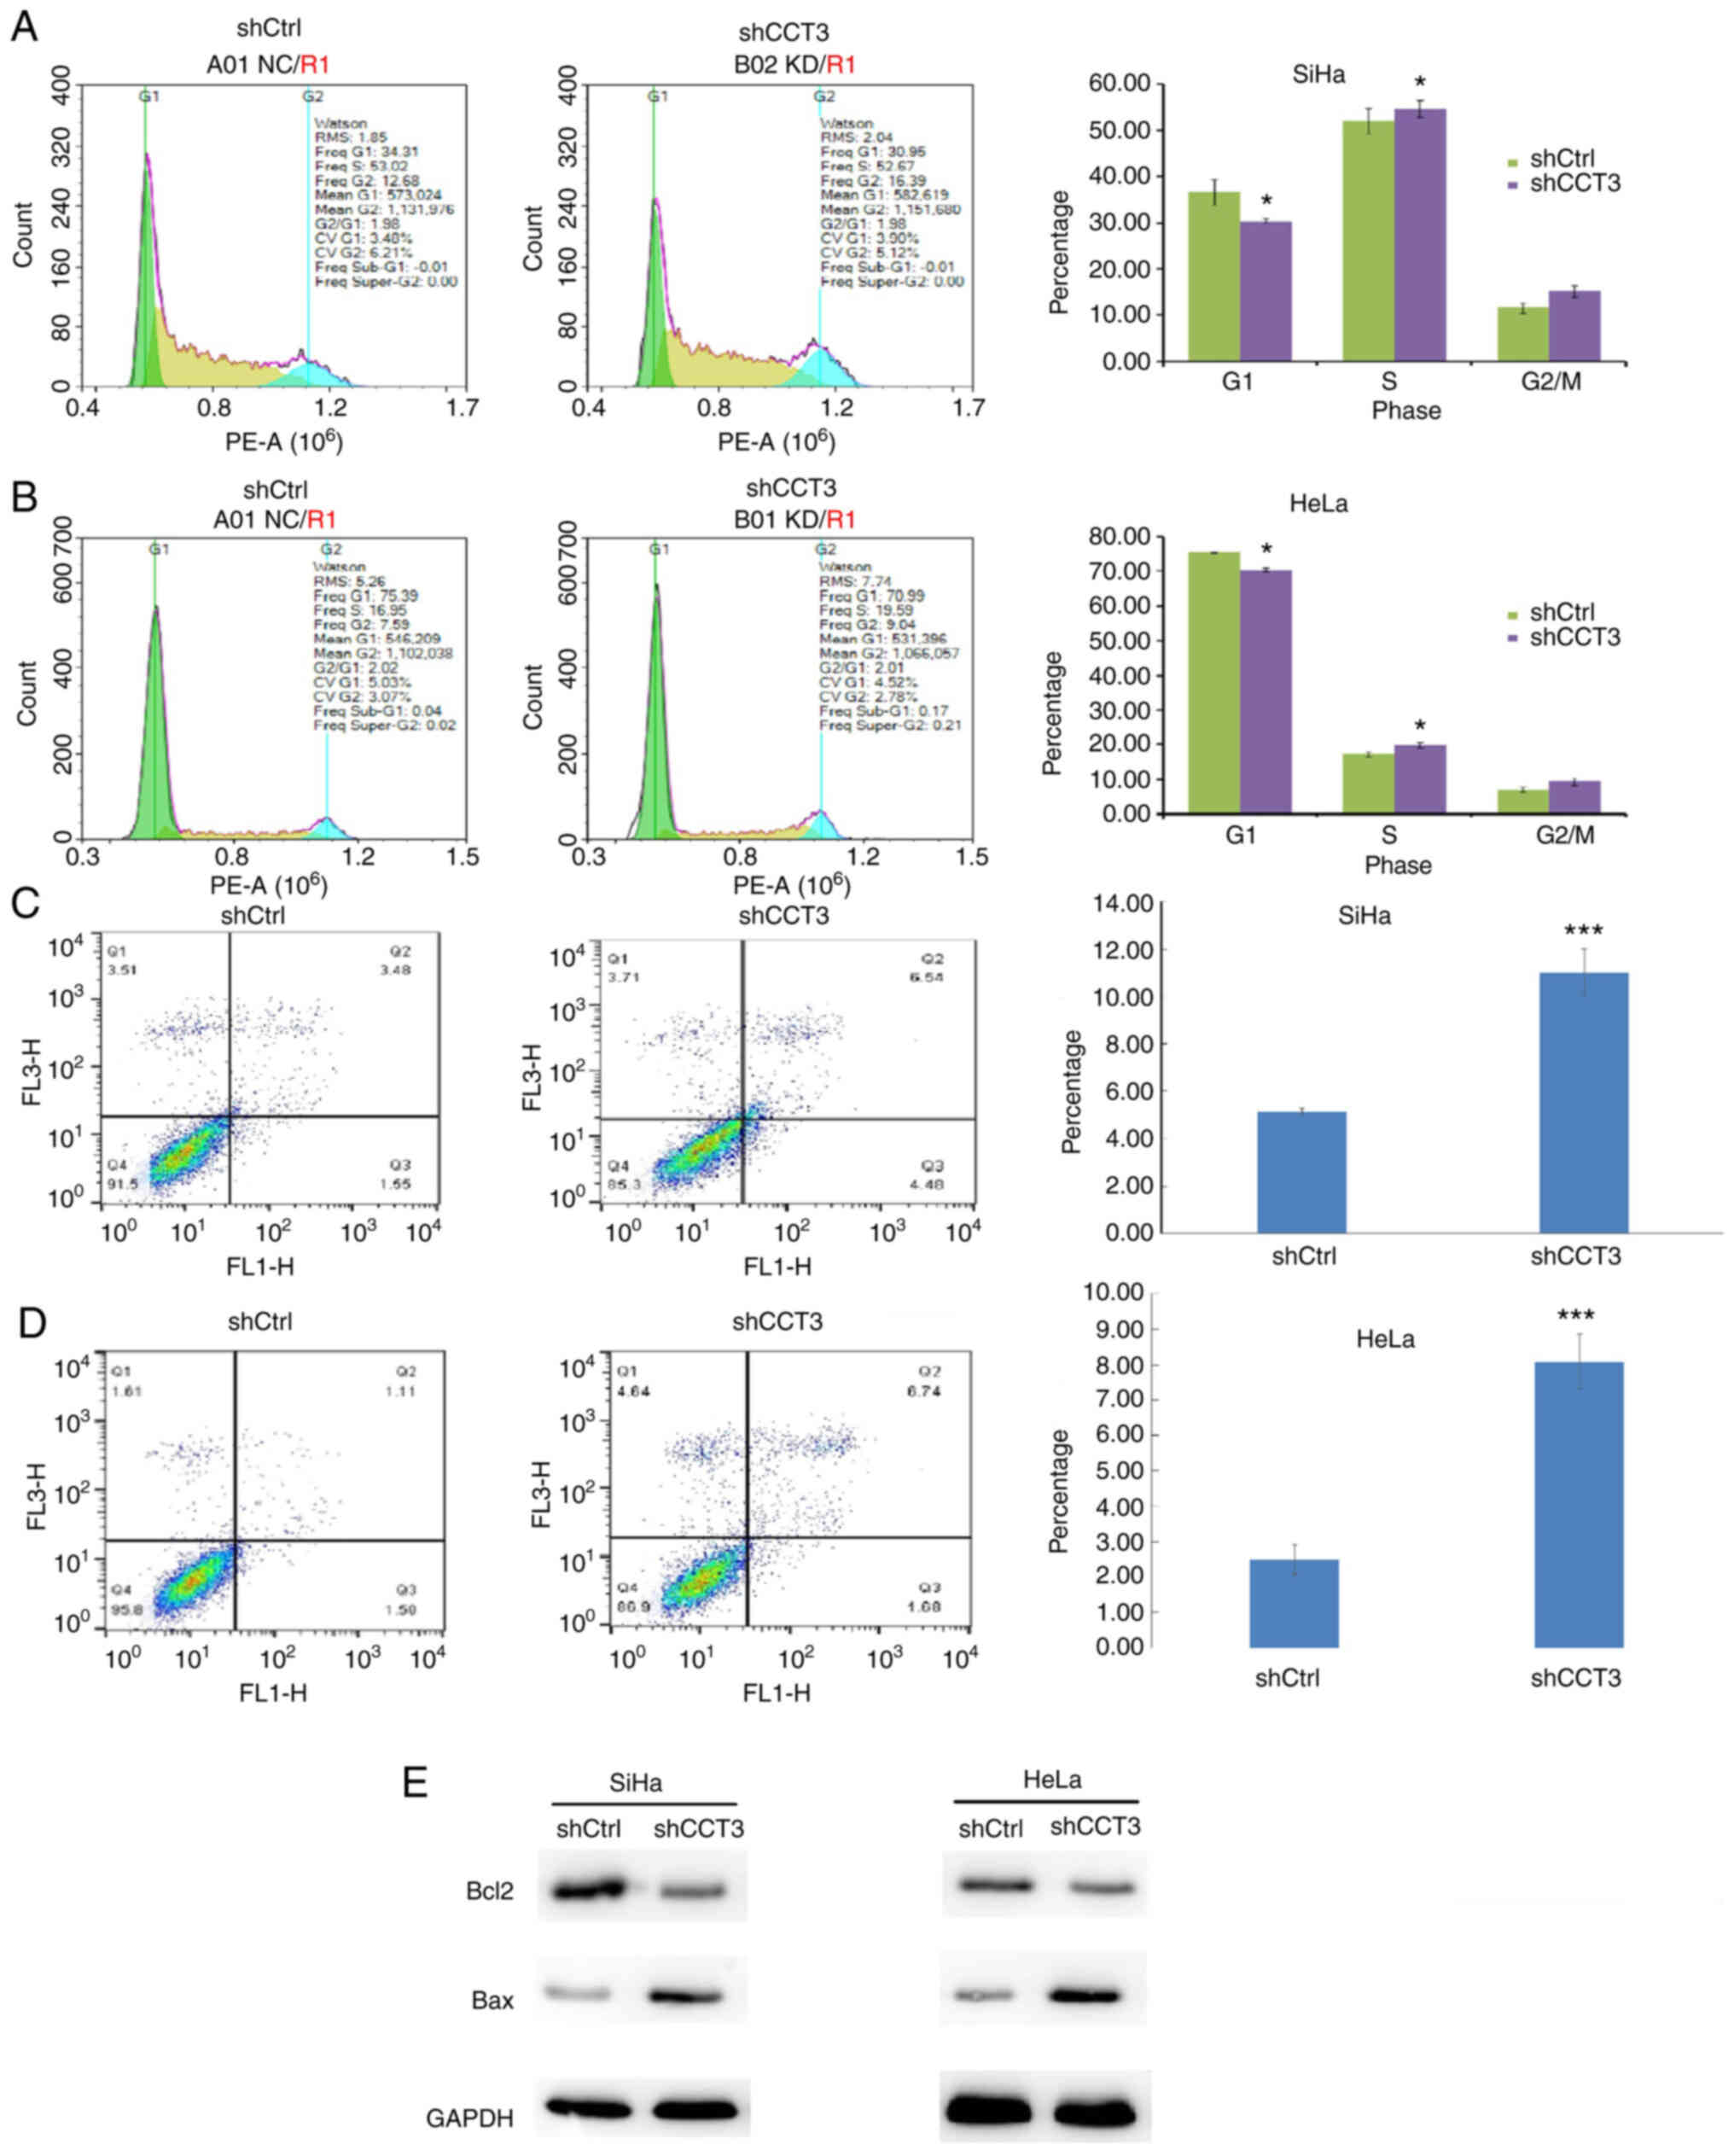
CESC cell cycle progression is
inhibited, and apoptosis is induced, following CCT3-knockdown
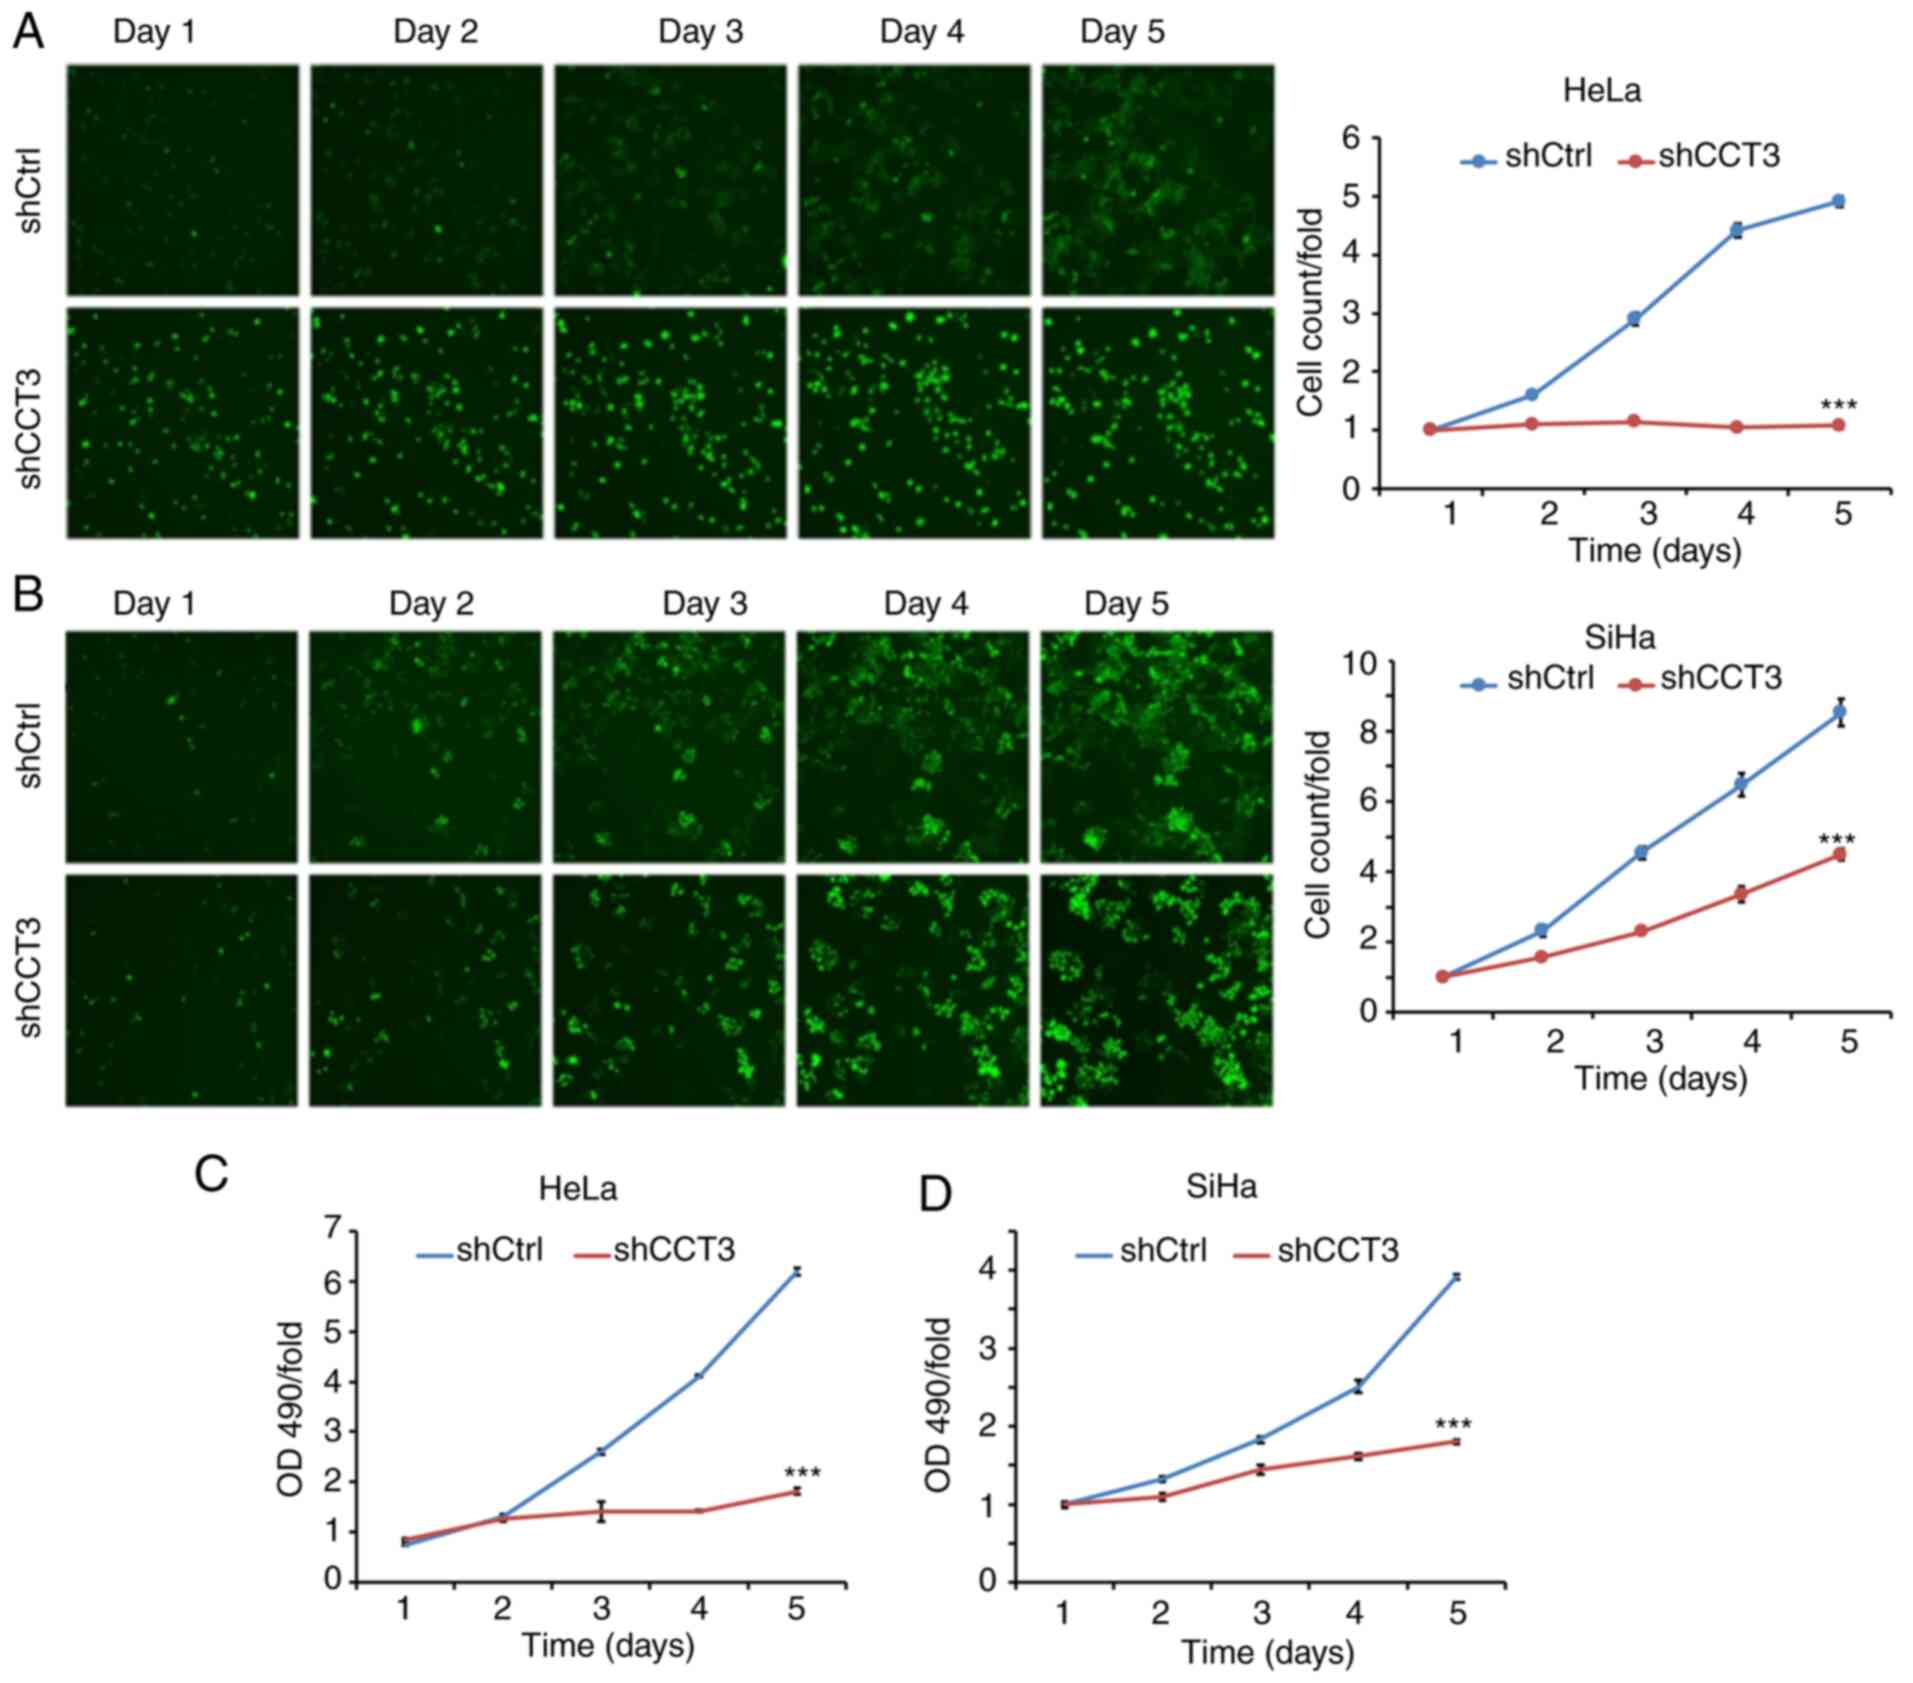
Cellular proliferation analysis using Celigo
(Fig. 4A and B) and MTT (Fig. 4C and D) assays demonstrated that
CCT3-knockdown significantly inhibited the proliferation of both
HeLa and SiHa cells. CCT3 has been reported to participate in cell
cycle regulation (22). The present
study data revealed that decreased expression of CCT3 increased the
proportion of cells in the G2/M phase, but decreased the G0/G1
ratio in SiHa and HeLa cells (Fig. 5A
and B, respectively). The results also revealed that SiHa and
HeLa cells with knocked down CCT3 expression exhibited higher
levels of apoptosis (Fig. 5C and
D). Moreover, expression of the pro-apoptotic protein Bcl2 was
inhibited following CCT3-knockdown, while anti-apoptotic Bax was
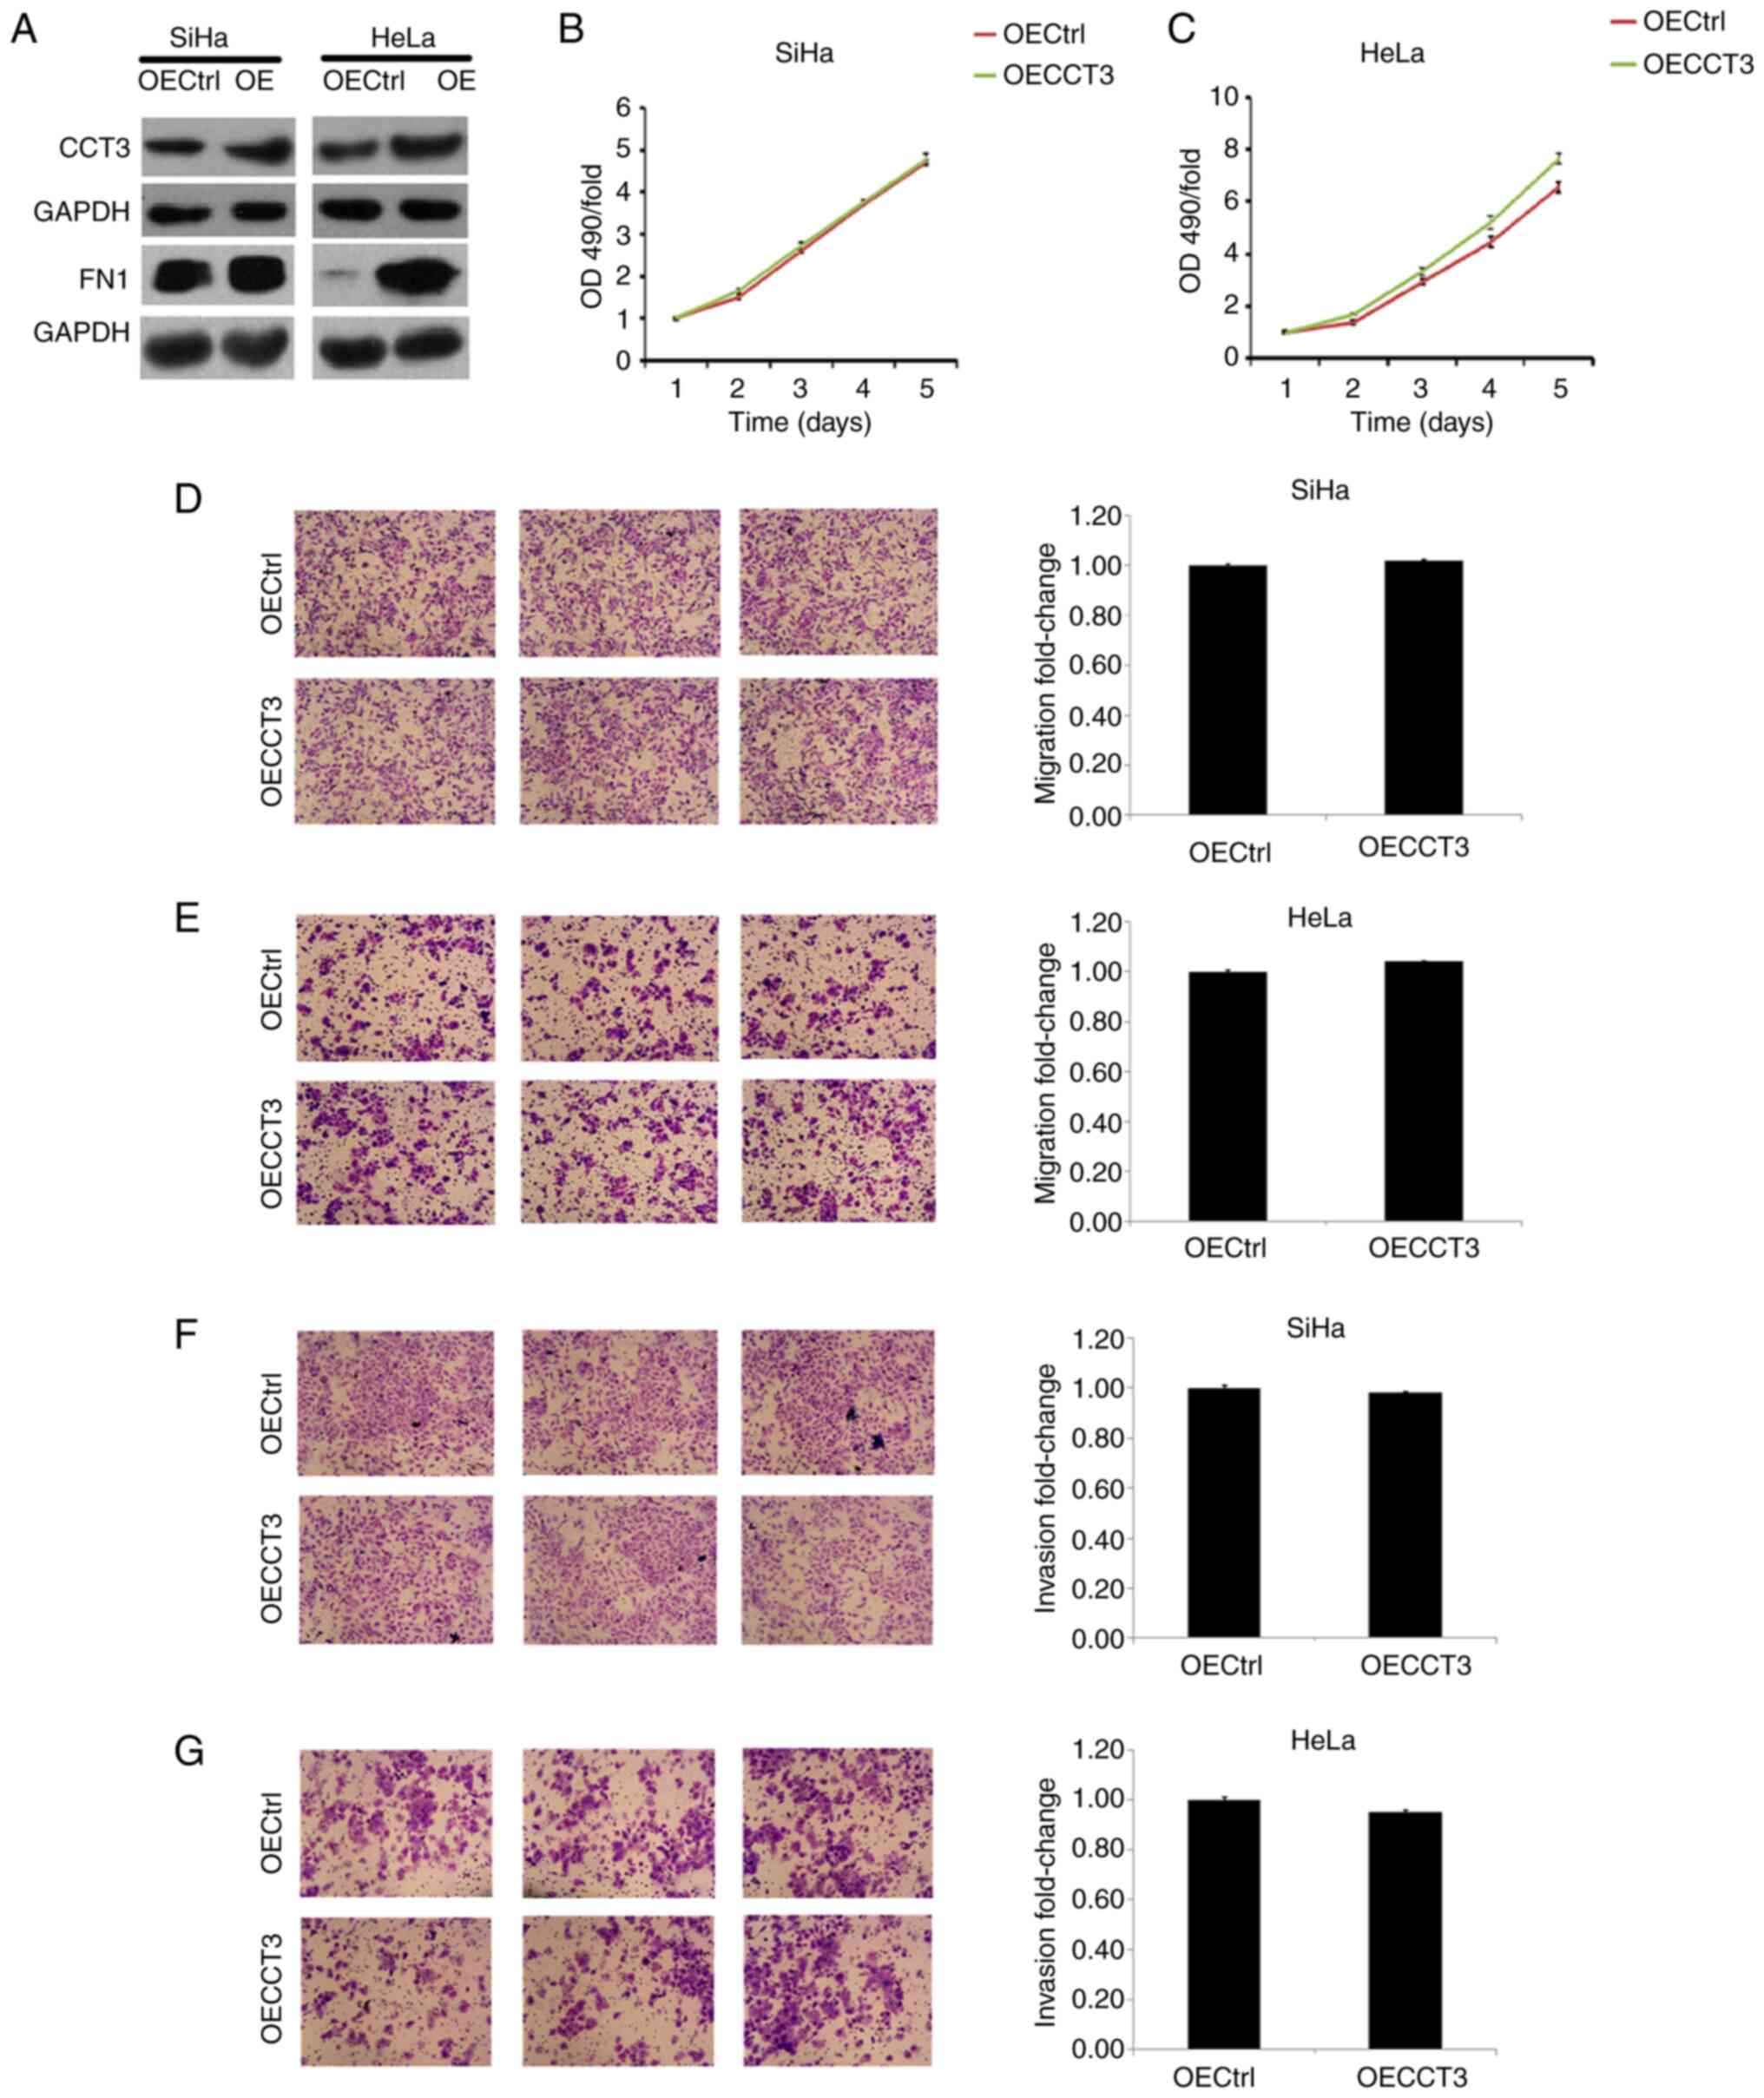
upregulated in both SiHa and HeLa cells (Fig. 5E). However, a promotive effect of
CCT3 overexpression in cellular proliferation, migration and
invasiveness was not observed in HeLa or SiHa cells (Fig. 6A-F). However, these results still
suggest that CCT3 promoted CESC cell proliferation, migration and
invasiveness.
CCT3 affects the expression of
multiple key cancer regulators in CESC
To evaluate the potential mechanisms of action of
CCT3 in CESC, the expression levels of multiple proliferation,
migration and cell cycle regulators [including cadherin (CDH)1,
CDH2, phosphorylated (p)-p38, FN1, matrix metalloproteinase (MMP)2,
Twist-related protein (TWIST), MMP9, Snail, mTOR, MYC, NF-κB-p65,
p-mTOR, vimentin (VIM), p-NF-κB-p65, p-β-catenin, p38, β-catenin
and Slug] were detected in SiHa cells following CCT3-knockdown. The
results revealed that the protein levels of p-p38, FN1 and MMP9
were markedly downregulated following CCT3-knockdown (Fig. 7A). Among these proteins, FN1 was
selected for further validation as other downstream proteins were
unable to rescue CCT3 knockdown-induced cell proliferative
inhibition (data not shown). Of note, CCT3 expression was
significantly and positively correlated with that of FN1 in CESC
(Fig. 7B). A higher expression
level of FN1 was also associated with a shorter disease-free
survival time in CESC (Fig. 7C and
D). These results suggested that FN1 may function as a
downstream regulator of CCT3 in human CESC.
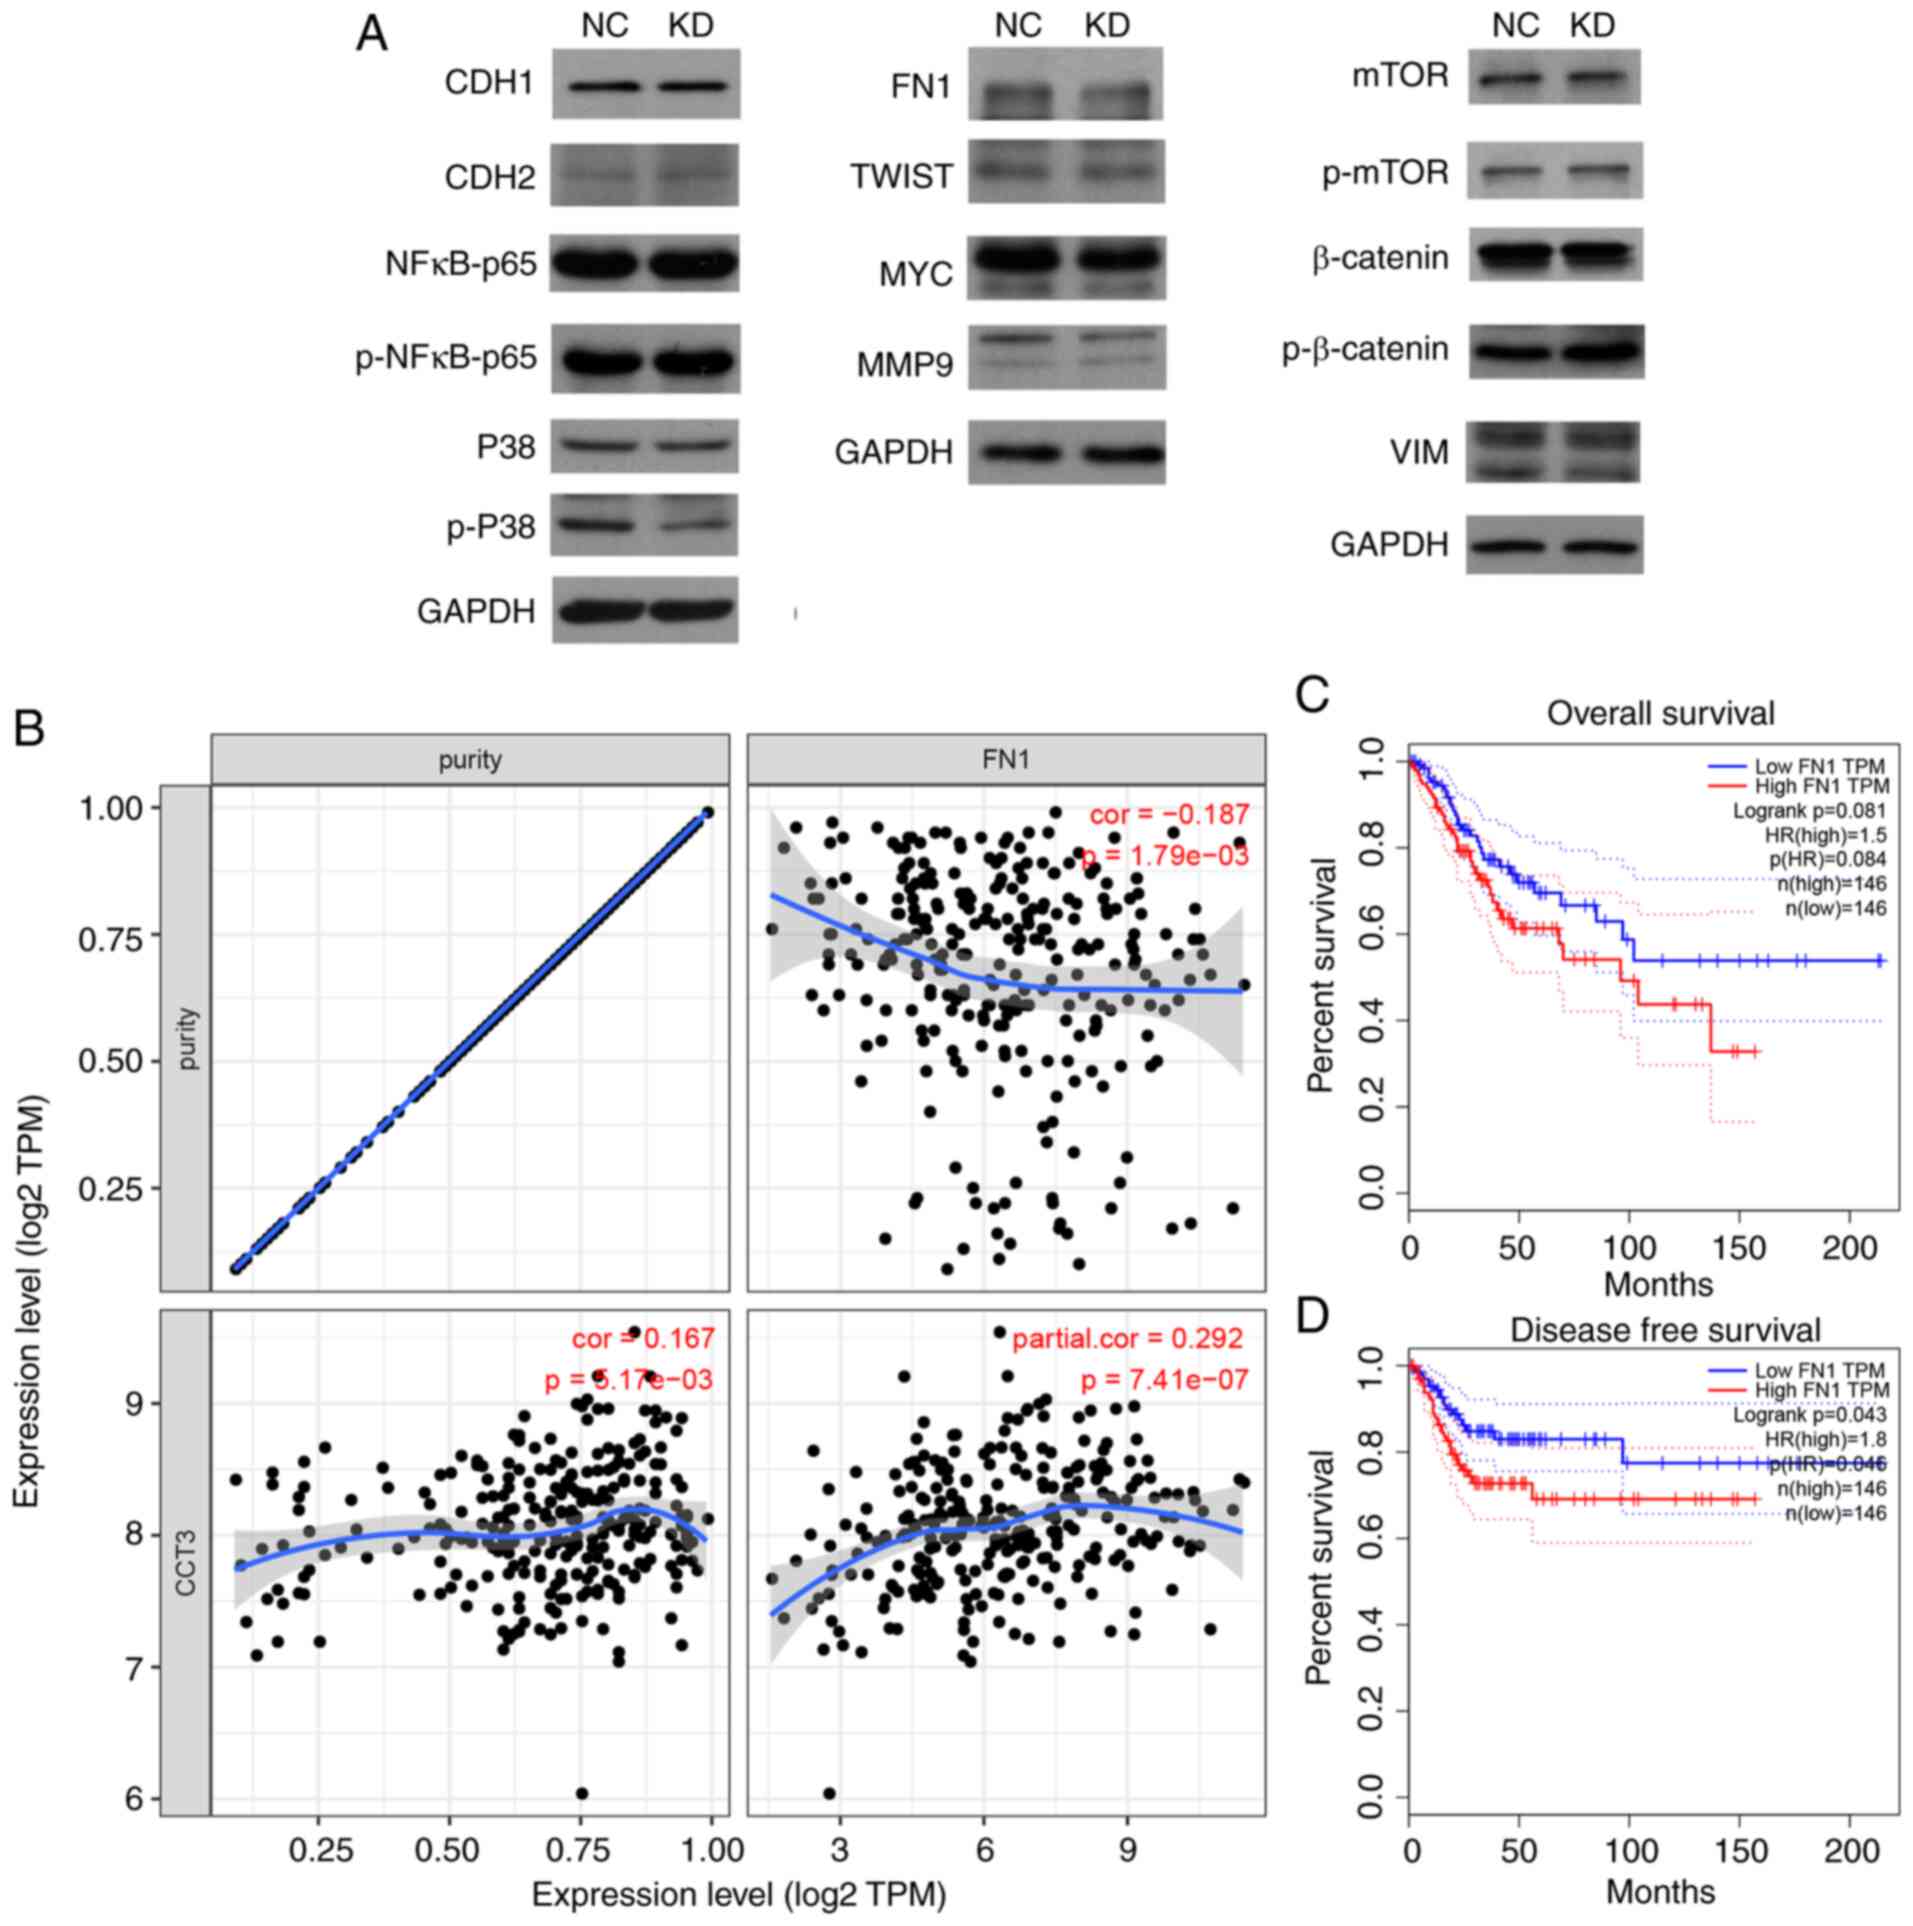 | Figure 7.CCT3-knockdown suppresses FN1
expression. (A) Protein expression levels of CDH1, CDH2, p-p38,
FN1, MMP2, TWIST, MMP9, Snail, mTOR, MYC, NF-κB-p65, p-mTOR, VIM,
p-NF-κB-p65, p-β-catenin, p38, β-catenin and Slug were detected
following CCT3-knockdown in SiHa cells. (B) CCT3 expression was
significantly positively correlated with FN1 expression in CESC. (C
and D) Higher expression of CCT3 was associated with a shorter
disease-free survival time, but not with overall survival time in
CESC. CCT3, chaperonin containing TCP1 subunit 3; CESC, cervical
squamous cell carcinoma and endocervical adenocarcinoma; CDH1,
cadherin 1; CDH2, cadherin 2; FN1, fibronectin 1; MMP2, matrix
metalloproteinase 2; TWIST, Twist-related protein; MMP9, matrix
metalloproteinase 9; VIM, vimentin; p-, phosphorylated; NC,
negative control; KD, knockdown; OE, overexpression. |
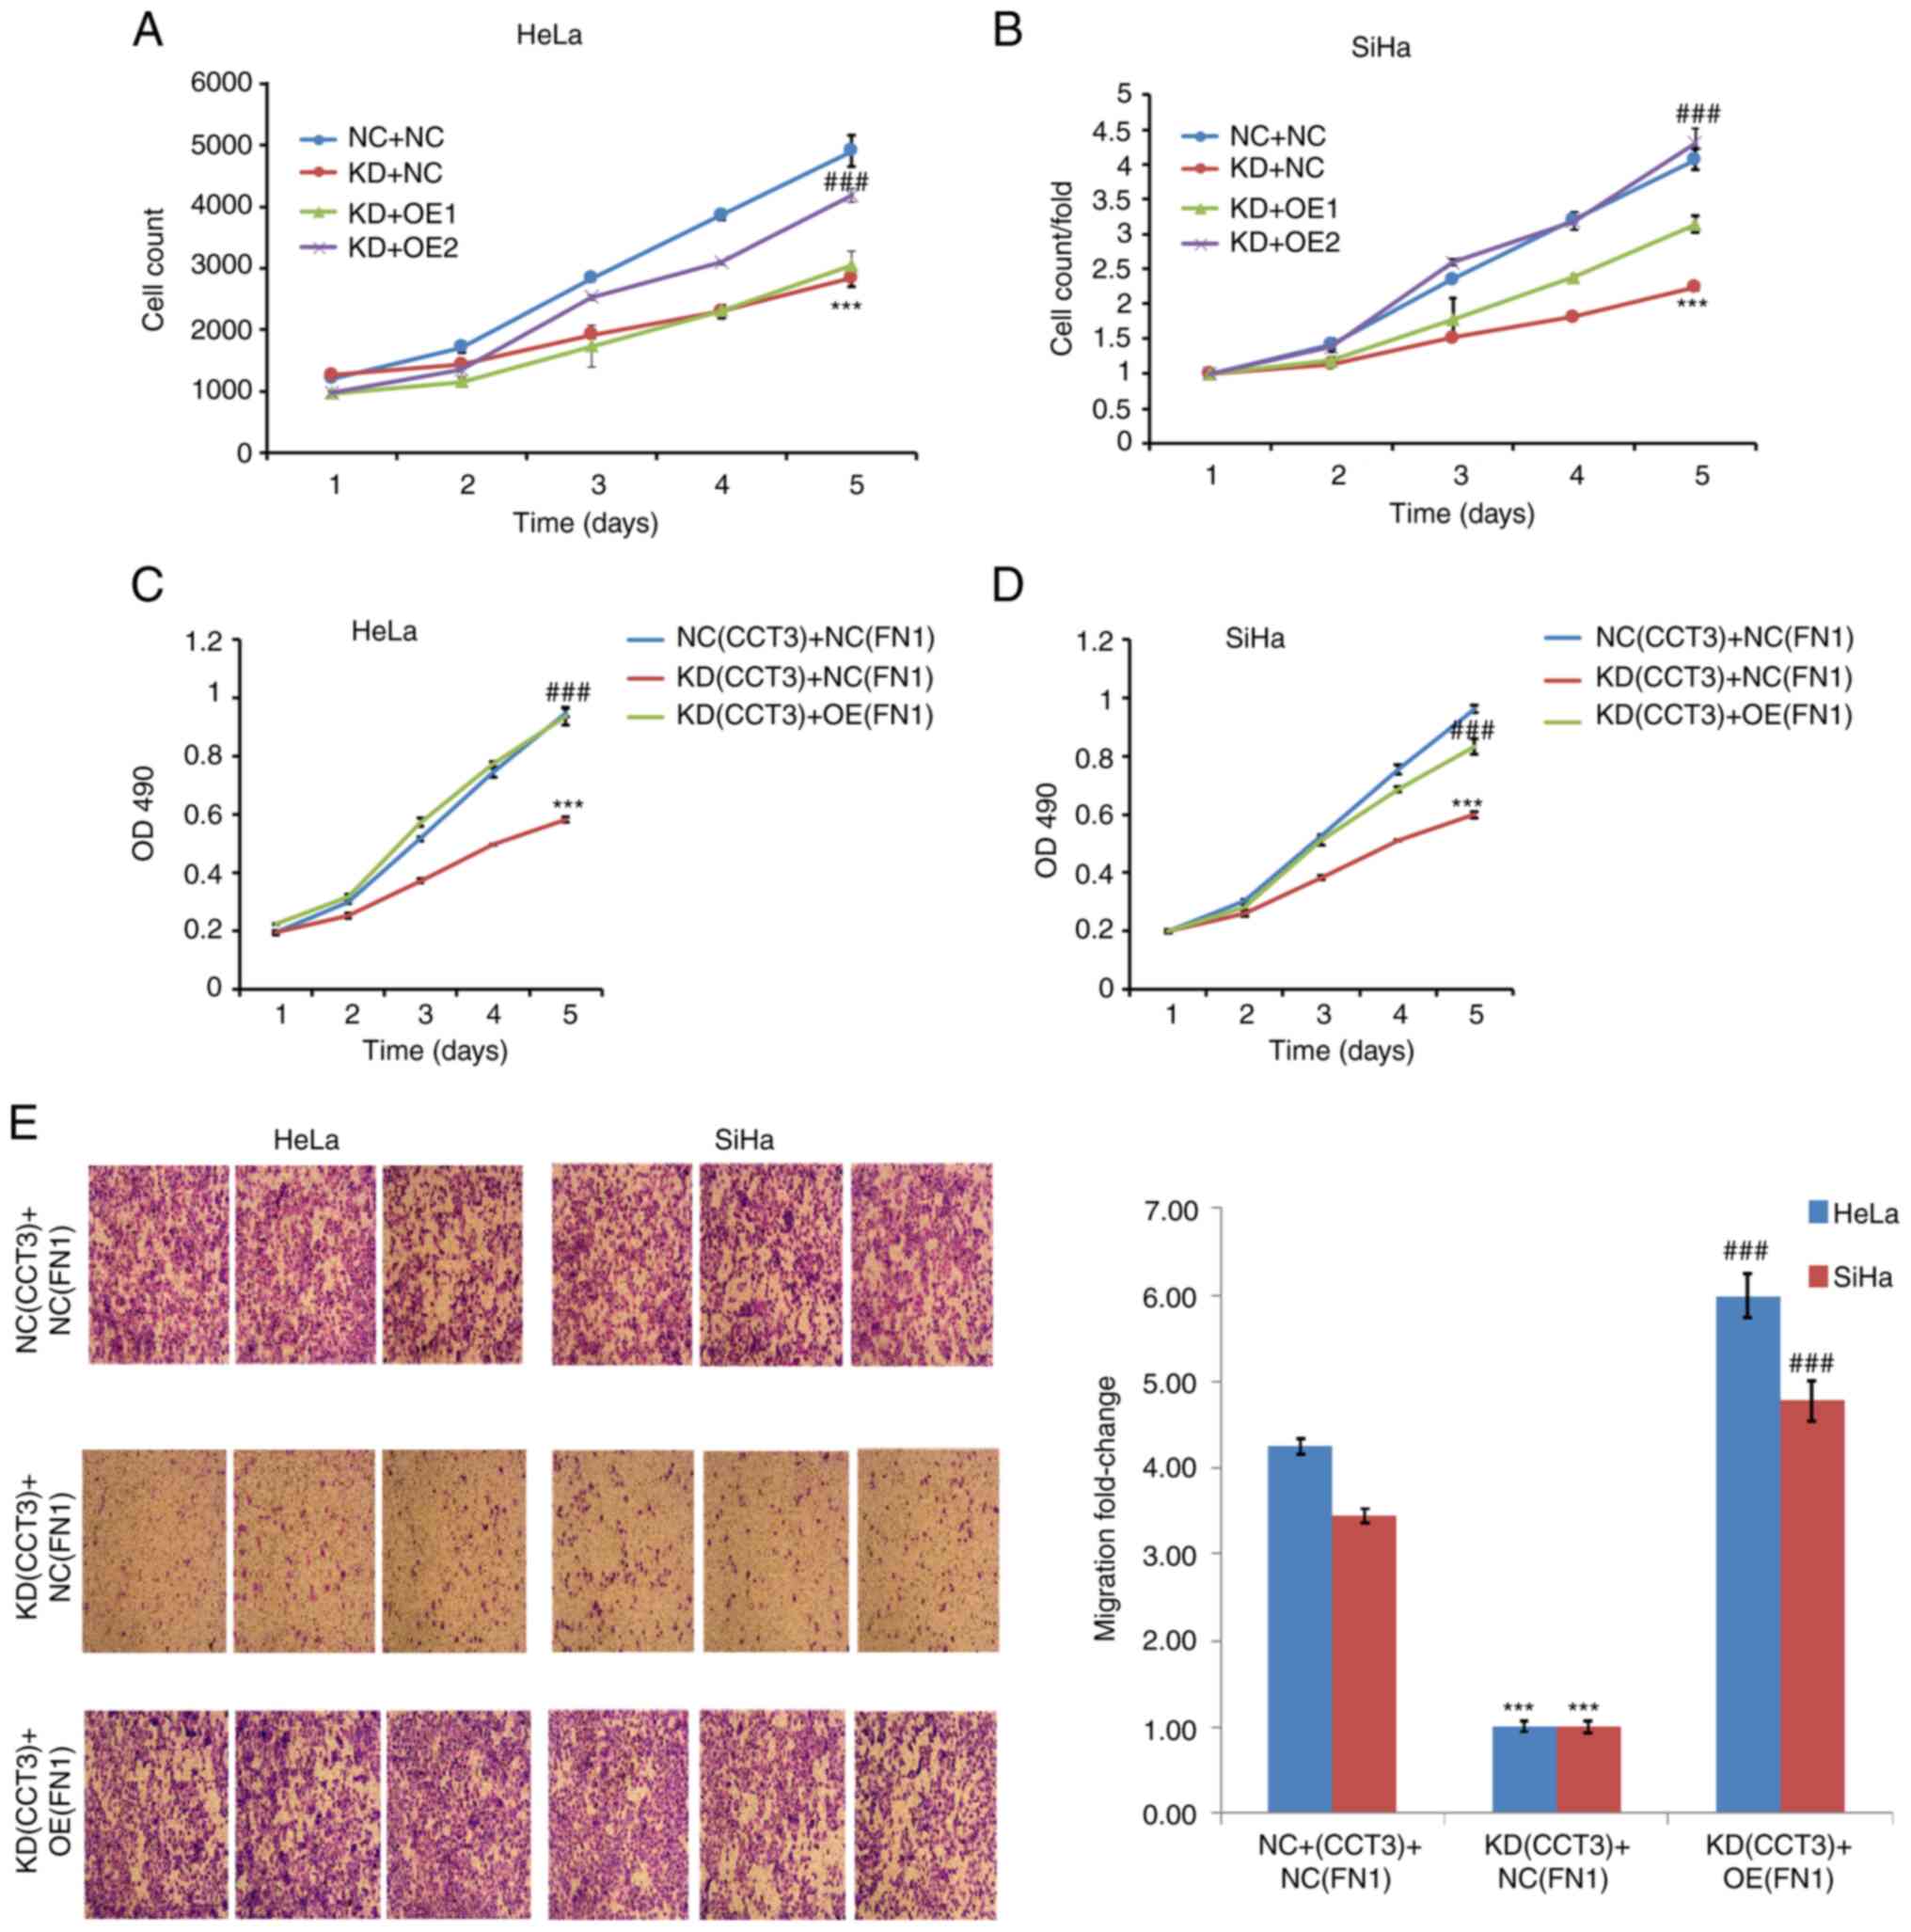
Overexpression of FN1 rescues the
effects on CESC mediated by CCT3-knockdown
The present study further investigated the
association between CCT3 and FN1. Cell viability assays revealed
that the overexpression of FN1 significantly reversed the
suppressive effects of CCT3-knockdown on the proliferation of both
HeLa and SiHa cells (Fig. 8A-D).
Furthermore, the results of the Transwell assays revealed that the
overexpression of FN1 significantly reversed the suppressive
effects of CCT3-knockdown on the migration of SiHa and HeLa cells
(Fig. 8E). Collectively, these data
suggested that the regulatory effects of CCT3 on CESC cell
functions were mediated via the FN1 gene.
The present study identified that CCT3 expression
levels were upregulated in CESC tissues, which was associated with
poor patient prognosis. Moreover, the findings revealed that CCT3
suppressed apoptosis and promoted cell cycle progression and
metastatic capacity via the FN1 signaling pathway, which
demonstrated that CCT3 may prove to be a potential biomarker for
CESC.
Discussion
CESC is a major cause of cancer-related mortality
among women in China (2). However,
the mechanisms regulating the development of CESC remain largely
unknown. It is thus imperative to investigate the underlying
mechanisms, and to identify promising prognostic indicators, for
CESC. The results of the present study revealed that CCT3
expression levels were higher in CESC tissues, and that this was
associated with a poor prognosis.
CCT proteins have been demonstrated to play an
elementary role in human cancers, including breast cancer and lung
cancer, and multiple members of this family have been found to be
abnormally expressed, and to be associated with tumor development
(7,23–25).
For example, CCT2 expression was found to be upregulated in liver
(26), colon (10) and lung cancer (27). Higher CCT2 levels are also
associated with shorter overall survival times in patients with
non-small cell lung cancer (27).
CCT8 expression has been revealed to be upregulated in HCC and
glioma, and to promote cellular proliferation and migration therein
(28). Furthermore, CCT3 expression
was found to be upregulated in liver, breast cancer and colorectal
cancer (22,26,29).
To the best of our knowledge, the present study was the first to
detect the expression patterns and prognostic value of CCT3 in CESC
using TCGA and GEO databases, where CCT3 expression was found to be
upregulated in tumor samples compared with normal tissues.
Bioinformatics analysis also confirmed CCT3 as a
tumor promoter in CESC cell models. Kaplan-Meier survival and Cox
proportional hazards regression analyses indicated that CCT3
expression was associated with the shorter survival time of
patients with CESC. Furthermore, in vitro studies indicated
that CCT3 promoted the metastatic capacity of tumor cells;
CCT3-knockdown significantly reduced the migration and invasiveness
of CESC cells. However, when CCT3 was overexpressed, limited
increases in CESC cell proliferation and migration were observed.
This may be attributed to the fact that high expression of
background CCT3 (or exogenous upregulation) in CESC cells is
sufficient for promoting cellular proliferation and migration. In
previous studies, CCT3 was found to be a regulator of the cell
cycle in multiple cancer types (15,22,26).
Thus, the present study further validated the potential effects of
CCT3-knockdown, demonstrating a marked suppression in CESC cell
proliferation and cell cycle progression, and apoptosis promotion.
After screening multiple cancer regulators, FN1 expression levels
were downregulated when CCT3 was inhibited. Moreover, FN1
overexpression rescued the inhibitory effect of CCT3. These data
identified that FN1 may be a downstream target of CCT3. To the best
of our knowledge, the present study demonstrated for the first time
that CCT3 promoted FN1 expression in CESC cells.
FN1 is a member of the FN protein family, is widely
expressed in multiple cell types, and plays pivotal roles in
cellular adhesion and migration processes (30). Previous research has demonstrated
that higher expression levels of FN1 are associated with advanced
tumor stage (31). FN1 has been
reported to be involved in tumor metastasis and extracellular
matrix-related changes, such as the epithelial-mesenchymal
transition (32). The
downregulation of FN1 has also been shown to suppress colorectal
tumorigenesis by regulating proliferation, migration and invasion
(33), and emerging evidence has
indicated that FN1 is an important regulator of tumor cell
chemoresistance (34). In addition,
mechanistic analyses have suggested that FN1 may interact with
vascular endothelial growth factor A, and play a primary role in
non-small cell lung cancer (35).
Moreover, FN1 was reported to promote Src and caspase-8
phosphorylation in lung cancer cells. The present study identified
multiple proliferation, migration and cell cycle regulators in SiHa
cells following CCT3-knockdown, including CDH1, CDH2, p-p38, FN1,
MMP2, TWIST, MMP9, mTOR, MYC, NF-κB-p65, p-mTOR, VIM, p-NF-κB-p65,
p-β-catenin, p38 and β-catenin. FN1 protein levels were suppressed
following CCT3-knockdown in CESC cells, and thus, FN1 may be a
downstream target of CCT3. FN1 was subsequently selected for
further validation. However, this does not mean that there are no
other proteins of research value in this context, such as p53,
retinoblastoma or PTEN (36,37).
Furthermore, cell viability and Transwell assays revealed that the
overexpression of FN1 significantly reversed the suppressive
effects of CCT3-knockdown on the proliferation and migration of
HeLa and SiHa cells. Collectively, these data suggest that CCT3
induced its effects on cellular functions via regulation of the FN1
gene.
In conclusion, the results of the present study
indicated that CCT3 acts as an oncogene in CESC, and was found to
be associated with a poor patient prognosis. The data also
indicated that CCT3 promoted cellular invasion and migration
ability. Moreover, CCT3 was found to be involved in regulating FN1
gene expression, thus regulating cell cycle and migration
progression. Collectively, the data indicate that CCT3 may be
regarded as a prognostic indicator of CESC, and may prove to be a
novel target for the treatment of CESC.
Supplementary Material
Supporting Data
Acknowledgements
Not applicable.
Funding
The present study was supported by internal funding
from The First Hospital of China Medical University (Shenyang,
China).
Availability of data and materials
The datasets used and/or analyzed during the current
study are available from the corresponding author on reasonable
request.
Authors' contributions
LD designed the experiments and wrote the paper. XZ
performed the experiments and participated in study design and
writing. Both authors have read and approved the manuscript. LD and
XZ confirm the authenticity of all the raw data.
Ethics approval and consent to
participate
Not applicable.
Patient consent for publication
Not applicable.
Competing interests
The authors declare that they have no competing
interests
Glossary
Abbreviations
Abbreviations:
|
CESC
|
cervical squamous cell carcinoma and
endocervical adenocarcinoma
|
|
CCT3
|
chaperone containing TCP1 subunit
3
|
|
FN1
|
fibronectin 1
|
|
GEO
|
Gene Expression Omnibus
|
|
TCGA
|
The Cancer Genome Atlas
|
References
|
1
|
Torre LA, Bray F, Siegel RL, Ferlay J,
Lortet-Tieulent J and Jemal A: Global cancer statistics, 2012. CA
Cancer J Clin. 65:87–108. 2015. View Article : Google Scholar : PubMed/NCBI
|
|
2
|
Zhang X, Li F and Zhu L: Clinical
significance and functions of microRNA-93/CDKN1A axis in human
cervical cancer. Life Sci. 209:242–248. 2018. View Article : Google Scholar : PubMed/NCBI
|
|
3
|
Zhu X, Zhou L, Li R, Shen Q, Cheng H, Shen
Z and Zhu H: AGER promotes proliferation and migration in cervical
cancer. Biosci Rep. 38:BSR201713292018. View Article : Google Scholar : PubMed/NCBI
|
|
4
|
Zhu H, Shen Z, Luo H, Zhang W and Zhu X:
Chlamydia Trachomatis Infection-Associated Risk of Cervical Cancer:
A Meta-Analysis. Medicine (Baltimore). 95:e30772016. View Article : Google Scholar : PubMed/NCBI
|
|
5
|
Zhu H, Luo H, Shen Z, Hu X, Sun L and Zhu
X: Transforming growth factor-β1 in carcinogenesis, progression,
and therapy in cervical cancer. Tumour Biol. 37:7075–7083. 2016.
View Article : Google Scholar : PubMed/NCBI
|
|
6
|
Yang Z, Sun Q, Guo J, Wang S, Song G, Liu
W, Liu M and Tang H: GRSF1-mediated MIR-G-1 promotes malignant
behavior and nuclear autophagy by directly upregulating TMED5 and
LMNB1 in cervical cancer cells. Autophagy. 15:668–685. 2019.
View Article : Google Scholar : PubMed/NCBI
|
|
7
|
Lin YF, Tsai WP, Liu HG and Liang PH:
Intracellular beta-tubulin/chaperonin containing TCP1-beta complex
serves as a novel chemotherapeutic target against drug-resistant
tumors. Cancer Res. 69:6879–6888. 2009. View Article : Google Scholar : PubMed/NCBI
|
|
8
|
Vallin J and Grantham J: The role of the
molecular chaperone CCT in protein folding and mediation of
cytoskeleton-associated processes: Implications for cancer cell
biology. Cell Stress Chaperones. 24:17–27. 2019. View Article : Google Scholar : PubMed/NCBI
|
|
9
|
Klimczak M, Biecek P, Zylicz A and Zylicz
M: Heat shock proteins create a signature to predict the clinical
outcome in breast cancer. Sci Rep. 9:75072019. View Article : Google Scholar : PubMed/NCBI
|
|
10
|
Park SH, Jeong S, Kim BR, Jeong YA, Kim
JL, Na YJ, Jo MJ, Yun HK, Kim DY, Kim BG, et al: Activating CCT2
triggers Gli-1 activation during hypoxic condition in colorectal
cancer. Oncogene. 39:136–150. 2020. View Article : Google Scholar : PubMed/NCBI
|
|
11
|
Wang L, Zhao H, Li J, Xu Y, Lan Y, Yin W,
Liu X, Yu L, Lin S, Du MY, et al: Identifying functions and
prognostic biomarkers of network motifs marked by diverse chromatin
states in human cell lines. Oncogene. 39:677–689. 2020. View Article : Google Scholar : PubMed/NCBI
|
|
12
|
Liu P, Kong L, Jin H, Wu Y, Tan X and Song
B: Differential secretome of pancreatic cancer cells in
serum-containing conditioned medium reveals CCT8 as a new biomarker
of pancreatic cancer invasion and metastasis. Cancer Cell Int.
19:2622019. View Article : Google Scholar : PubMed/NCBI
|
|
13
|
Liu Y, Zhang X, Lin J, Chen Y, Qiao Y, Guo
S, Yang Y, Zhu G, Pan Q, Wang J, et al: CCT3 acts upstream of YAP
and TFCP2 as a potential target and tumour biomarker in liver
cancer. Cell Death Dis. 10:6442019. View Article : Google Scholar : PubMed/NCBI
|
|
14
|
Qian EN, Han SY, Ding SZ and Lv X:
Expression and diagnostic value of CCT3 and IQGAP3 in
hepatocellular carcinoma. Cancer Cell Int. 16:552016. View Article : Google Scholar : PubMed/NCBI
|
|
15
|
Shi X, Cheng S and Wang W: Suppression of
CCT3 inhibits malignant proliferation of human papillary thyroid
carcinoma cell. Oncol Lett. 15:9202–9208. 2018.PubMed/NCBI
|
|
16
|
Cui F, Hu J, Fan Y, Tan J and Tang H:
Knockdown of spindle pole body component 25 homolog inhibits cell
proliferation and cycle progression in prostate cancer. Oncol Lett.
15:5712–5720. 2018.PubMed/NCBI
|
|
17
|
Wan X, Pu H, Huang W, Yang S, Zhang Y,
Kong Z, Yang Z, Zhao P, Li A, Li T, et al: Androgen-induced
miR-135a acts as a tumor suppressor through downregulating RBAK and
MMP11, and mediates resistance to androgen deprivation therapy.
Oncotarget. 7:51284–51300. 2016. View Article : Google Scholar : PubMed/NCBI
|
|
18
|
Livak KJ and Schmittgen TD: Analysis of
relative gene expression data using real-time quantitative PCR and
the 2(-Delta Delta C(T)) Method. Methods. 25:402–408. 2001.
View Article : Google Scholar : PubMed/NCBI
|
|
19
|
den Boon JA, Pyeon D, Wang SS, Horswill M,
Schiffman M, Sherman M, Zuna RE, Wang Z, Hewitt SM, Pearson R, et
al: Molecular transitions from papillomavirus infection to cervical
precancer and cancer: Role of stromal estrogen receptor signaling.
Proc Natl Acad Sci USA. 112:E3255–E3264. 2015. View Article : Google Scholar : PubMed/NCBI
|
|
20
|
Thomas A, Mahantshetty U, Kannan S,
Deodhar K, Shrivastava SK, Kumar-Sinha C and Mulherkar R:
Expression profiling of cervical cancers in Indian women at
different stages to identify gene signatures during progression of
the disease. Cancer Med. 2:836–848. 2013. View Article : Google Scholar : PubMed/NCBI
|
|
21
|
Scotto L, Narayan G, Nandula SV,
Arias-Pulido H, Subramaniyam S, Schneider A, Kaufmann AM, Wright
JD, Pothuri B, Mansukhani M, et al: Identification of copy number
gain and overexpressed genes on chromosome arm 20q by an
integrative genomic approach in cervical cancer: Potential role in
progression. Genes Chromosomes Cancer. 47:755–765. 2008. View Article : Google Scholar : PubMed/NCBI
|
|
22
|
Xu G, Bu S, Wang X, Zhang H and Ge H:
Suppression of CCT3 inhibits the proliferation and migration in
breast cancer cells. Cancer Cell Int. 20:2182020. View Article : Google Scholar : PubMed/NCBI
|
|
23
|
Dun MD, Smith ND, Baker MA, Lin M, Aitken
RJ and Nixon B: The chaperonin containing TCP1 complex (CCT/TRiC)
is involved in mediating sperm-oocyte interaction. J Biol Chem.
286:36875–36887. 2011. View Article : Google Scholar : PubMed/NCBI
|
|
24
|
Nadler-Holly M, Breker M, Gruber R, Azia
A, Gymrek M, Eisenstein M, Willison KR, Schuldiner M and Horovitz
A: Interactions of subunit CCT3 in the yeast chaperonin CCT/TRiC
with Q/N-rich proteins revealed by high-throughput microscopy
analysis. Proc Natl Acad Sci USA. 109:18833–18838. 2012. View Article : Google Scholar : PubMed/NCBI
|
|
25
|
Syed A, Lukacsovich T, Pomeroy M, Bardwell
AJ, Decker GT, Waymire KG, Purcell J, Huang W, Gui J, Padilla EM,
et al: Miles to go (mtgo) encodes FNDC3 proteins that interact with
the chaperonin subunit CCT3 and are required for NMJ branching and
growth in Drosophila. Dev Biol. 445:37–53. 2019. View Article : Google Scholar : PubMed/NCBI
|
|
26
|
Yao L, Zou X and Liu L: The TCP1 ring
complex is associated with malignancy and poor prognosis in
hepatocellular carcinoma. Int J Clin Exp Pathol. 12:3329–3343.
2019.PubMed/NCBI
|
|
27
|
Carr AC, Khaled AS, Bassiouni R, Flores O,
Nierenberg D, Bhatti H, Vishnubhotla P, Manuel JP, Santra S and
Khaled AR: Targeting chaperonin containing TCP1 (CCT) as a
molecular therapeutic for small cell lung cancer. Oncotarget.
8:110273–110288. 2017. View Article : Google Scholar : PubMed/NCBI
|
|
28
|
Qiu X, He X, Huang Q, Liu X, Sun G, Guo J,
Yuan D, Yang L, Ban N, Fan S, et al: Overexpression of CCT8 and its
significance for tumor cell proliferation, migration and invasion
in glioma. Pathol Res Pract. 211:717–725. 2015. View Article : Google Scholar : PubMed/NCBI
|
|
29
|
Nibbe RK, Markowitz S, Myeroff L, Ewing R
and Chance MR: Discovery and scoring of protein interaction
subnetworks discriminative of late stage human colon cancer. Mol
Cell Proteomics. 8:827–845. 2009. View Article : Google Scholar : PubMed/NCBI
|
|
30
|
Wang J, Deng L, Huang J, Cai R, Zhu X, Liu
F, Wang Q, Zhang J and Zheng Y: High expression of Fibronectin 1
suppresses apoptosis through the NF-κB pathway and is associated
with migration in nasopharyngeal carcinoma. Am J Transl Res.
9:4502–4511. 2017.PubMed/NCBI
|
|
31
|
Li B, Shen W, Peng H, Li Y, Chen F, Zheng
L, Xu J and Jia L: Fibronectin 1 promotes melanoma proliferation
and metastasis by inhibiting apoptosis and regulating EMT.
OncoTargets Ther. 12:3207–3221. 2019. View Article : Google Scholar : PubMed/NCBI
|
|
32
|
Soikkeli J, Podlasz P, Yin M, Nummela P,
Jahkola T, Virolainen S, Krogerus L, Heikkilä P, von Smitten K,
Saksela O, et al: Metastatic outgrowth encompasses COL-I, FN1, and
POSTN up-regulation and assembly to fibrillar networks regulating
cell adhesion, migration, and growth. Am J Pathol. 177:387–403.
2010. View Article : Google Scholar : PubMed/NCBI
|
|
33
|
Cai X, Liu C, Zhang TN, Zhu YW, Dong X and
Xue P: Down-regulation of FN1 inhibits colorectal carcinogenesis by
suppressing proliferation, migration, and invasion. J Cell Biochem.
119:4717–4728. 2018. View Article : Google Scholar : PubMed/NCBI
|
|
34
|
Yang X, Hu Q, Hu LX, Lin XR, Liu JQ, Lin
X, Dinglin XX, Zeng JY, Hu H, Luo ML, et al: miR-200b regulates
epithelial-mesenchymal transition of chemo-resistant breast cancer
cells by targeting FN1. Discov Med. 24:75–85. 2017.PubMed/NCBI
|
|
35
|
Wang Y, Huang L, Wu S, Jia Y, Yang Y, Luo
L, Bi A and Fang M: Bioinformatics analyses of the role of vascular
endothelial growth factor in patients with non-small cell lung
cancer. PLoS One. 10:e01392852015. View Article : Google Scholar : PubMed/NCBI
|
|
36
|
Balasubramaniam SD, Balakrishnan V, Oon CE
and Kaur G: Key molecular events in cervical cancer development.
Medicina (Kaunas). 55:3842019. View Article : Google Scholar : PubMed/NCBI
|
|
37
|
Nero C, Ciccarone F, Pietragalla A and
Scambia G: PTEN and Gynecological cancers. Cancers (Basel).
11:14582019. View Article : Google Scholar : PubMed/NCBI
|