Introduction
Patients with muscle-invasive bladder cancer (MIBC)
are treated with either bladder-preserving radiotherapy or
cystectomy (1,2). Whilst cystectomy patients have about
a 50% probability of surviving for 5 years, radiotherapy can
achieve complete response in up to 70% of patients (3). However 50% of patients will develop
metastases and their 5-year survival rate is between 20 and 30%.
Survival is improved by adding chemotherapy (1,2).
High levels of hypoxia in solid tumours are
associated with an adverse prognosis, which led to interest in
developing approaches for its measurement and targeting (4). The UK BCON (bladder carbogen
nicotinamide) trial showing that giving hypoxia-modifying carbogen
and nicotinamide (CON) with radiotherapy improved the 3-year
overall rate by 13% for patients with bladder cancer (5,6).
As there are standard-of-care options for MIBC patients, our group
developed a signature to assess tumour hypoxia and explored its
potential for identifying patients likely to benefit from having
radiotherapy plus CON.
The derivation of the signature and validation in
multiple bladder cancer patient cohorts is described in an earlier
publication (7). A gene
expression network was built in a discovery cohort using a list of
611 seed genes shown to be upregulated in hypoxia across multiple
tumour types (7). A seed gene was
considered most likely to be relevant for bladder cancer if
co-expressed with other seed genes. A final list of 24 genes was
selected from the network as those that were prognostic and
associated with a poor prognosis in the discovery cohort. The
signature was then validated for prognostic significance in
multiple independent cohorts.
Hypoxia scores were calculated as the median
expression value of the 24 signature genes in each sample.
Individual cohort median hypoxia scores were used as a cut-off as
it was pre-specified in a power calculation (7). Using the pre-defined median cut-off
value the signature was shown to be prognostic in a meta-analysis
of six cohorts (n=679). We then showed the signature predicted
benefit from having CON with radiotherapy in patients recruited
into the BCON trial (7). Our
published signature validation work used gene expression data
generated from fresh frozen or archival formalin fixed paraffin
embedded (FFPE) tissue. As RNA levels in FFPE samples decline over
time (8), implementing a hypoxia
signature clinically requires deriving a cut-off using recently
obtained FFPE material. We also needed to identify a platform for
generating hypoxia scores prospectively in a future
biomarker-driven clinical trial, identify whether intra-tumour
heterogeneity might be a barrier to implementation and confirm that
hypoxia scores increased in bladder cancer cell lines in response
to hypoxia. The objectives of the work reported here, therefore,
were to: i) derive cut-off values using RNA extracted from recently
diagnosed MIBC patients that could be used in a clinical trial; ii)
demonstrate that the signature can be implemented using several
platforms; iii) determine the reliability of signature scores
generated from multiple samples from the same patient; and iv)
investigate whether hypoxia scores increased in vitro in
cell lines exposed to low oxygen. The three platforms we selected
to compare for our 24-gene signature were qPCR (TLDA), NanoString
(nCounter) and microarray (Affymetrix Clariom S).
Materials and methods
Patient samples
Samples were obtained for two cohorts of MIBC
patients. Ethics approval was obtained from the institute where the
experiments were performed (Manchester Cancer Research Centre
Biobank; research tissue bank ethics reference: 18/NW/0092). All
patients provided written consent for use of their pre-treatment
FFPE MIBC tissue in research. The ethics application was fully
reviewed permitting publication of the research findings. The mean
(range) sample age of a prospectively collected cohort (n=51) at
the time of processing was 6 (3–8)
months. The second, retrospective, cohort (n=51) provided multiple
pre-treatment FFPE MIBC samples (2–18 per patient) from 10
patients. The mean (range) sample age was 7 (5.7-9.3) years.
Two 10 µm sections were taken per sample for RNA
extraction. An adjacent 4 µm section underwent histological review
by an experienced specialist uropathologist (HD) and used to ensure
tumour cellularity was >30%. RNA was extracted from the two 10
µm sections using the Roche High Pure FFPET RNA isolation kit. RNA
quantification and purity were determined on a NanoDrop UV–Vis
Spectrophotometer (Thermo Fisher Scientific, Inc.) and a Qubit
fluorometer (Invitrogen; Thermo Fisher Scientific, Inc.). RNA
extracted from the recent samples was run on TLDA cards, NanoString
nSolver and Clariom S array. The older samples were assayed using
Clariom S arrays.
Reverse transcription and
pre-amplification
Complementary DNA (cDNA) was generated using a
high-capacity RNA-to-cDNA kit (Applied Biosciences; Themo Fisher
Scientific, Inc.). One sample of cDNA was subject to
pre-amplification using a custom preamp pool mix. This consisted of
primers to genes present on the TaqMan human EC card array (Applied
Biosystems) and a preamp TaqMan Fast Advanced Master Mix (2X;
Thermo Fisher Scientific, Inc.). The pre-amplification step
involved 14 cycles on a 2720 thermal cycler.
Applied Biosystems TLDA cards
Custom TLDA cards were generated using a gene
selector tool (Thermo Fisher Scientific, Inc.) that identified
probes for the signature genes (Table
I), ECs (9) and the
hypoxia-sensitive marker, carbonic anhydrase 9 (CA9). Following
reverse transcription and pre-amplification, cDNA was loaded onto
the TLDA cards and subject to qPCR on a Quantstudio12 (Applied
Biosystems; Thermo Fisher Scientific, Inc.). Each HS was generated
using the following formula: 2-(median of signature genes-geomean
of the endogenous controls).
 | Table I.Signature genes with the Thermo Fisher
gene probe. |
Table I.
Signature genes with the Thermo Fisher
gene probe.
| Signature gene | Gene probe |
|---|
| CAV1 | Hs00971716_m1 |
| COL5A1 | Hs00609133_m1 |
| ITGA5 | Hs01547673_m1 |
| P4HA2 | Hs00990001_m1 |
| SLC16A1 | Hs01560299_m1 |
| TGFB1 | Hs00998133_m1 |
| DPYSL2 | Hs00265851_m1 |
| SRPX | Hs00959148_m1 |
| TRAM2 | Hs00950945_m1 |
| SYDE1 | Hs00973080_m1 |
| LRP1 | Hs00233856_m1 |
| PDLIM2 | Hs00917389_m1 |
| SAV1 | Hs00560416_m1 |
| AHNAK2 | Hs00292832_m1 |
| CAD | Hs00983188_m1 |
| CYP1B1 | Hs00164383_m1 |
| DAAM1 | Hs00982998_m1 |
| DSC2 | Hs00951428_m1 |
| SLC2A3 | Hs00359840_m1 |
| FUT11 | Hs00543033_m1 |
| GLG1 | Hs00939452_m1 |
| GULP1 | Hs01061497_m1 |
| LDLR | Hs01092524_m1 |
| THBS4 | Hs00170261_m1 |
NanoString nSolver customised
panel
A customised codeset was designed by NanoString
technologies (NanoString Technologies) for a gene panel comprising
the 24 hypoxia signature genes, eight ECs selected as previously
described (9) and CA9. Samples
were prepared at a concentration of 20 ng/µl from stock RNA. The
samples (5 µl) were loaded into individual wells in 12 tube PCR
hydridisation strips containing 3 µl reporter codeset, 5 µl
hybridisation buffer and 2 µl capture probeset. The strips were
then frozen and submitted to the University of Manchester Genomics
Core Facility Hub for processing. Sixty ROC and RLF files were
uploaded into nSolver 4.0, downloaded from NanoString Technologies
website (NanoString.com). Positive control and
codeset normalisations were carried out by calculating a scaling
factor based on the geomean of the positive controls (A-E) and the
ECs respectively.
Affymetrix Clariom S full
transcriptome arrays
RNA extracted from both the recent and older sample
cohorts were subject to Clariom S analysis. RNA (8 ng/µl in a 9 µl
volume) was prepared for gene expression arrays with the Clariom S
pico HT human assay (Thermo Fisher Scientific, Inc.). Sample
hybridisation on Clariom S arrays was carried out by Yourgene
Health (Manchester, UK). Batches of CEL files were GC SST (Signal
Space Transformation with probe Guanine Cytosine Count Correction)
RNA normalised using Affymetrix Array Power Tools (https://www.thermofisher.com/uk/en/home/life-science/microarray-analysis/microarray-analysis-partners-programs/affymetrix-developers-network.html).
The log2 summarised gene level expression values
generated were batch corrected using the ComBat function from the
Bioconductor package sva. Hypoxia scores were calculated as the
median expression of the 24 signature genes.
Cell lines and hypoxia
experiments
Authenticated bladder cancer cell lines J82 and
RT112 (American Type Culture Collection) were screened routinely
for mycoplasma. Cells were maintained in Eagle's Minimum Essential
Medium (EMEM) supplemented with 10% foetal bovine serum (FBS)
(Gibco) and 2 mM L-glutamine in a humidified atmosphere of 95%
O2 and 5% CO2 at 37°C. Although ATCC
recommends RPMI-1640 (9 mM glucose) for RT112, EMEM was used for
both cell lines because: i) it has a glucose content of 4.5 mM,
which is similar to the concentration found in human plasma; and
ii) excess glucose affects the expression of glycolytic enzymes and
other hypoxia-response genes (10,11). For each cell line, 10 cm diameter
petri-dishes containing 10 ml of medium were seeded using
0.5×10⁶ cells and incubated at 37°C in a humidified 5%
CO2:95% air atmosphere (normoxia). After 24 h, medium
was replaced in one dish of each cell line under normoxic
conditions. Media in the other dishes were replaced with
pre-equilibrated hypoxic medium in a Whitley 35 Hypoxystation (Don
Whitley Scientific Limited) at 37°C at 0.1% O2:5%
CO2. After 24 h of incubation under normoxic and hypoxic
conditions, the cells were washed twice with PBS (PBS
pre-equilibrated in hypoxia was used for cells maintained under
hypoxic conditions) then harvested by rotating and scraping in PBS.
The detached cells were transferred to 1 ml RNAse free microfuge
tubes and the tubes centrifuged at 4°C for 10 min at 10,000 rpm.
The supernatant was removed and the cell pellets frozen at −80°C
for RNA extraction. RNA was extracted from the pelleted cell lines
using RNeasy Plus Mini Kit (Qiagen) and Qiagen QIAshredder Kit
following the manufacturer's instructions. Reverse transcription
was performed as for the clinical samples. Pre-amplification was
carried out using a custom preamp pool mix. This consisting of
primers to genes present on the TaqMan human EC card array (Applied
Biosystems; Thermo Fisher Scientific, Inc.) and a preamp TaqMan
Fast Advanced Master Mix (2X; Thermo Fisher Scientific, Inc.). The
pre-amplification step involved 14 cycles on a 2720 thermal
cycler.
Statistical analyses
For each sample, the HS was considered high if
greater or equal to the median HS for the whole cohort. A pre-study
power calculation determined that a minimum of 34 samples should be
analysed to generate an absolute value for a cut-off for clinical
application with a 95% confidence interval and accounting for 10%
error. The study was not powered or set up to study associations
with prognosis. Cross platform correspondence was determined by
Spearman regression (correlation) analysis and concordance.
Concordance was defined as the proportion of cases where hypoxia
status concurred between each platform. Inter- and intra-tumour
heterogeneity was assessed as coefficient of variation (CoV).
Significant differences between mean values of HS generated in the
cell data were compared using the Student's t-test (unpaired).
Results
Comparing hypoxia scores obtained
using different platforms
The mean (range) yields of RNA were 338 (64–956)
ng/µl for the 51 recent samples. The mean (range) RNA quality
ratios were 1.92 (1.63-2.19) for 260/280 and 1.73 (0.97-2.19) for
260/230. Tumour cellularity was <30% in 4 of the 51 samples from
the recent cohort, which were then excluded from further analysis.
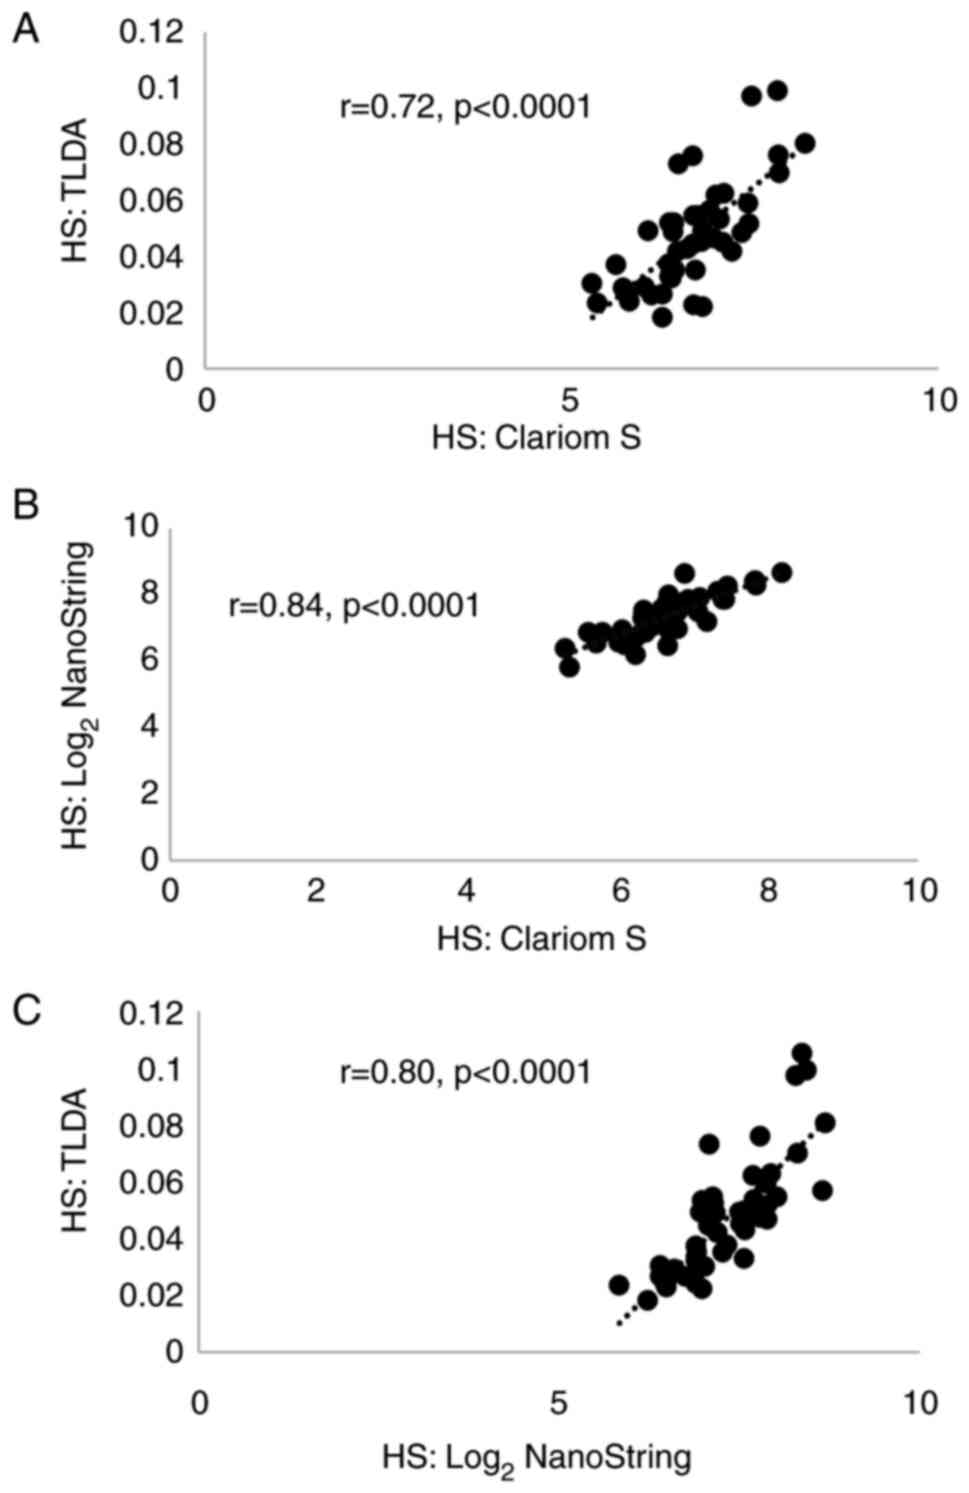
Table II summarises the results
of the cross-platform comparisons in 47 patients. There were strong
correlations (r>0.70, P<0.0001; Fig. 1) between HS values generated using
the three platforms. The levels of concordance were also high: 73%
for TLDA and Clariom; 78% for Clariom and NanoString; and 78% for
TLDA and NanoString. As the most significant correlation and
highest concordance were with NanoString, further analyses were
carried out using this platform.
| Table II.Platform comparisons in recent
samples from 47 patients. |
Table II.
Platform comparisons in recent
samples from 47 patients.
| Platforms
compared | Correlation
coefficient (significance)a | Concordance |
|---|
| Clariom S vs.
TLDA | 0.72
(P<0.0001) | 73% |
| Clariom S vs.
NanoString | 0.84
(P<0.0001) | 78% |
| TLDA vs.
NanoString | 0.80
(P<0.0001) | 78% |
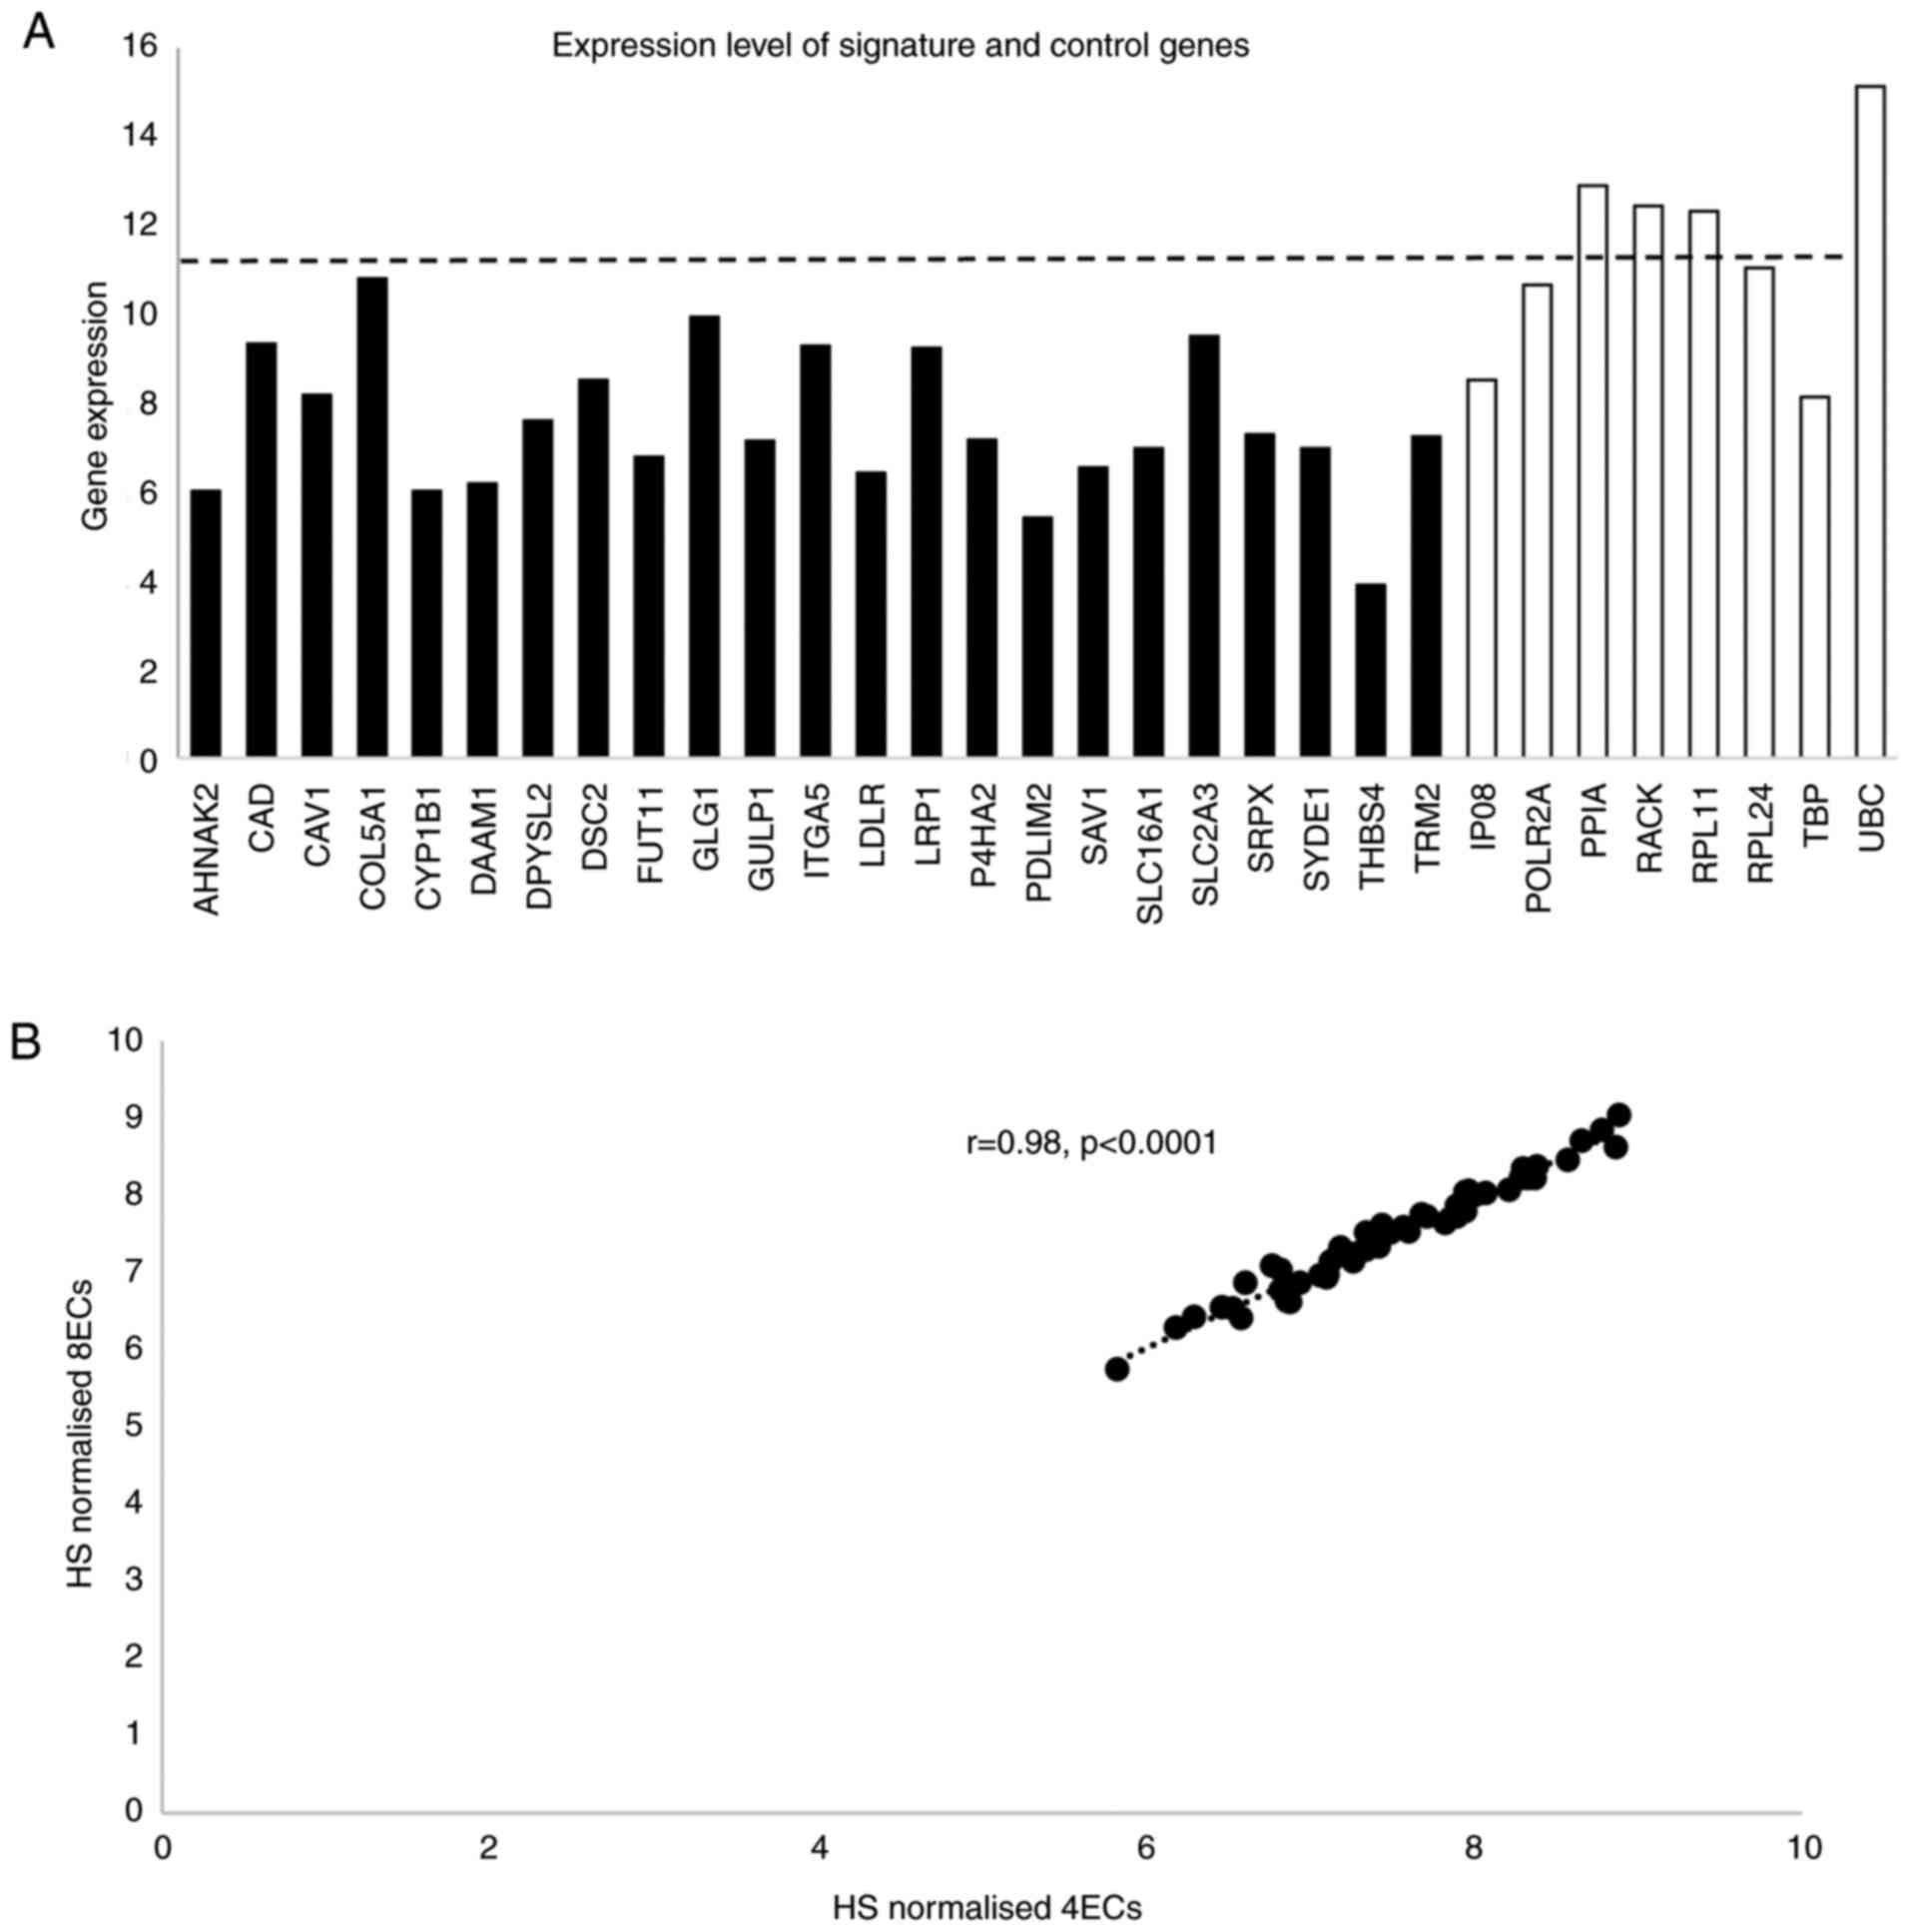
Expression levels of signature EC genes determined
by NanoString are shown in Fig.
2A. Four of the EC genes had higher expression than the highest
expressed signature gene. To ensure that the HS was not biased by
including four highly expressed EC genes, normalisation was carried
out using four genes expressed at a level similar to the signature
genes and also using all eight EC genes. As HS values derived by
either normalisation were highly correlated (rho=0.98, P<0.0001;
Fig. 2B), HS was generated using
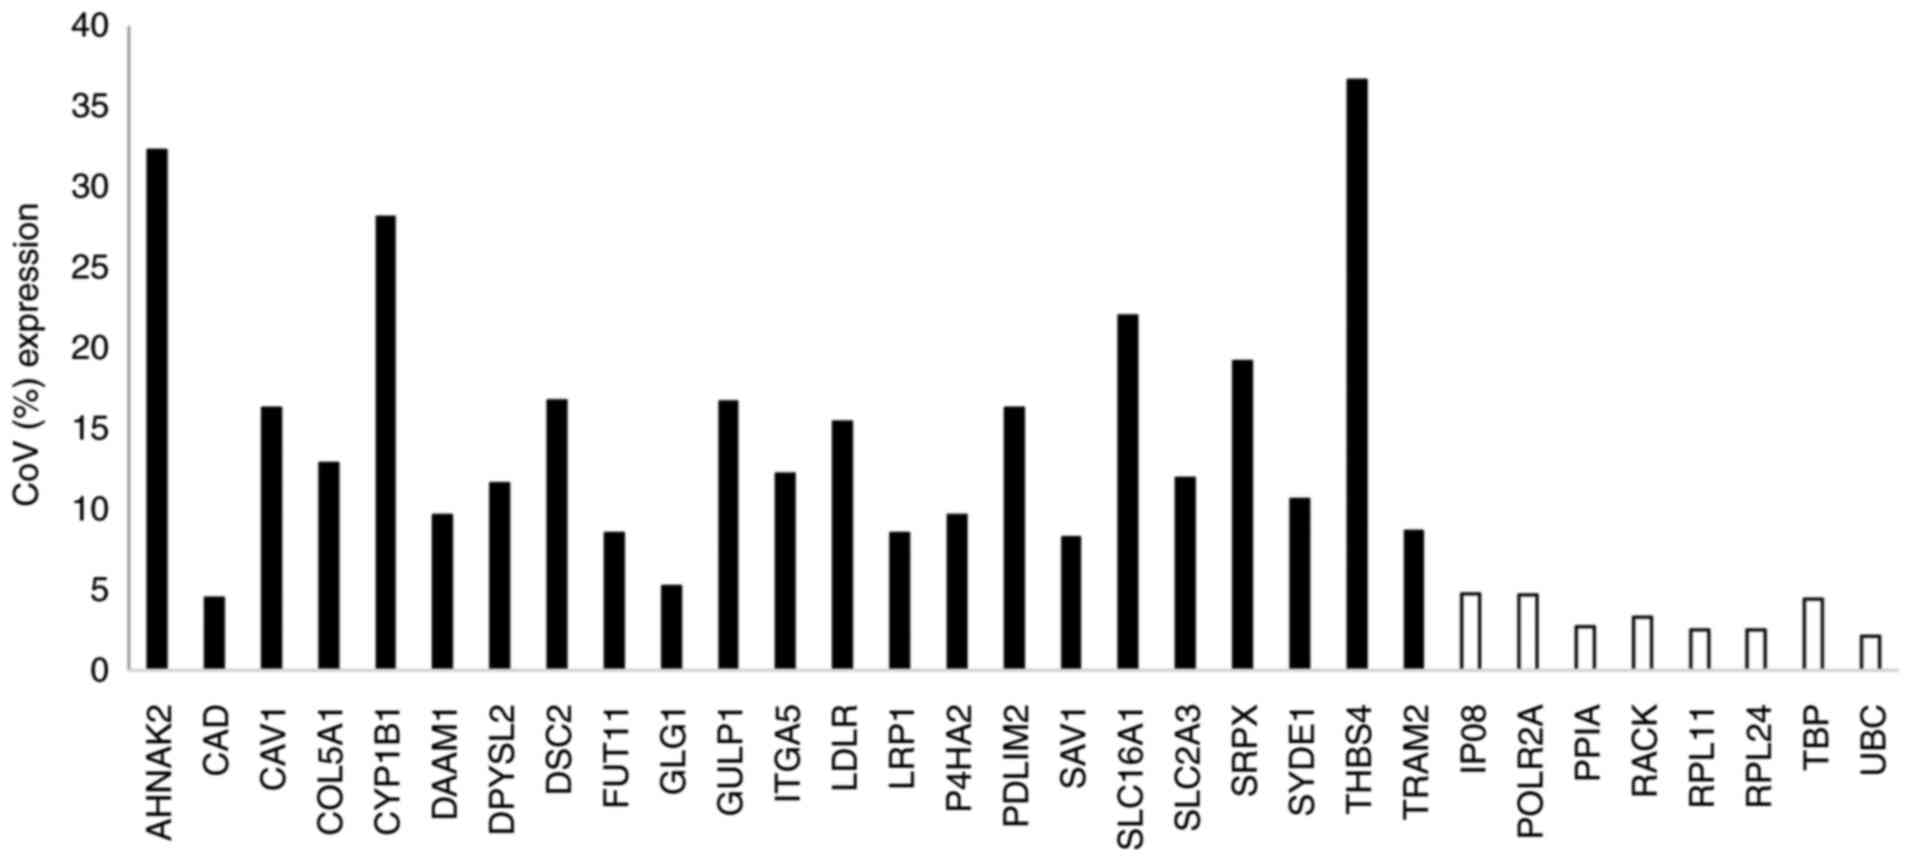
all 8 EC genes. The CoV for the signature genes ranged from 4.5 to
36.6% (Fig. 3) and, with the
exception of CAD, were greater than for the EC genes (range
2.1% for UBC to 4.68% for POLR2A).
The median HS values generated for the 47 samples
using Clariom S, TLDA and NanoString were 6.667, 0.047 and 7.328
respectively.
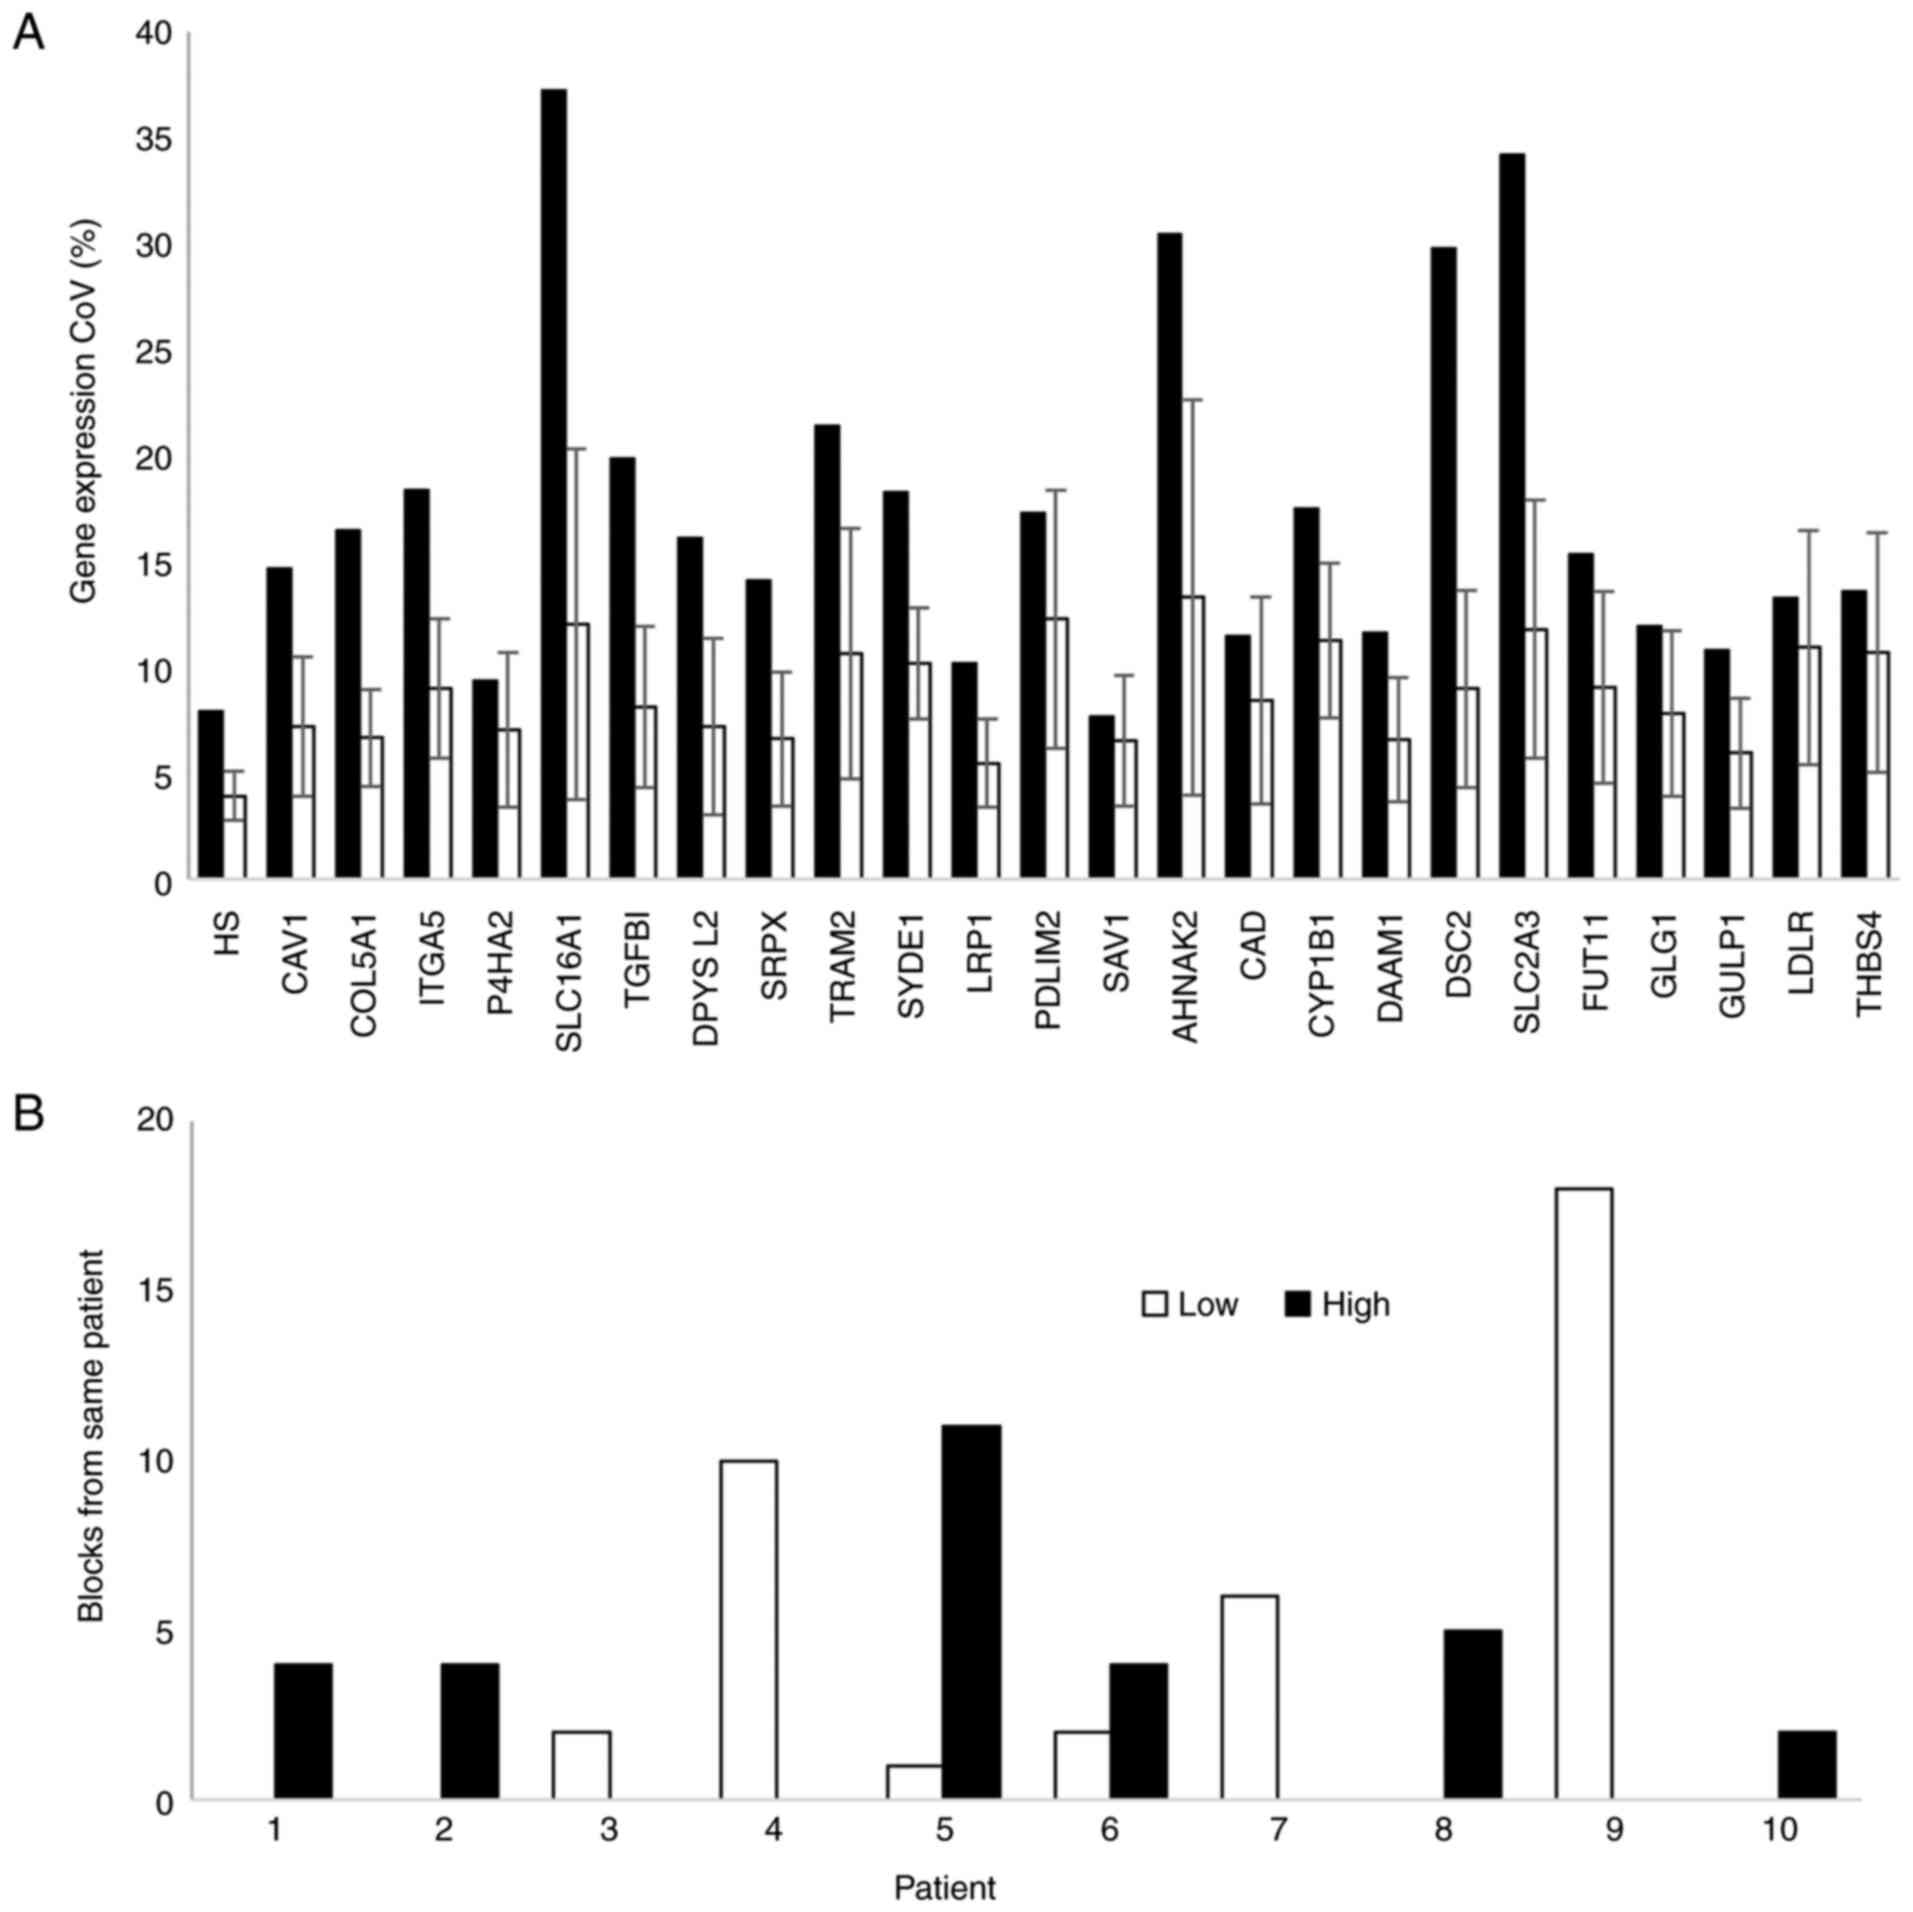
Intra- and inter-tumour variability in
hypoxia score
Three blocks from the older patient cohort with
tumour cellularity was <30% were excluded from further analysis.
Intra- and inter-tumour variation in the expression of each gene in
the bladder-cancer hypoxia signature was determined in blocks from
48 patients. Multiple blocks were available for 10 patients.
Variability in gene expression and HS was assessed using the
Clariom S platform. Inter-tumour variation in HS values was higher
(CoV=7.95) than intra-tumour variation (mean CoV=3.93%; Fig. 4A). Hypoxia status was consistent
in all blocks for 8 patients, but differed for two patients
(Fig. 4B).
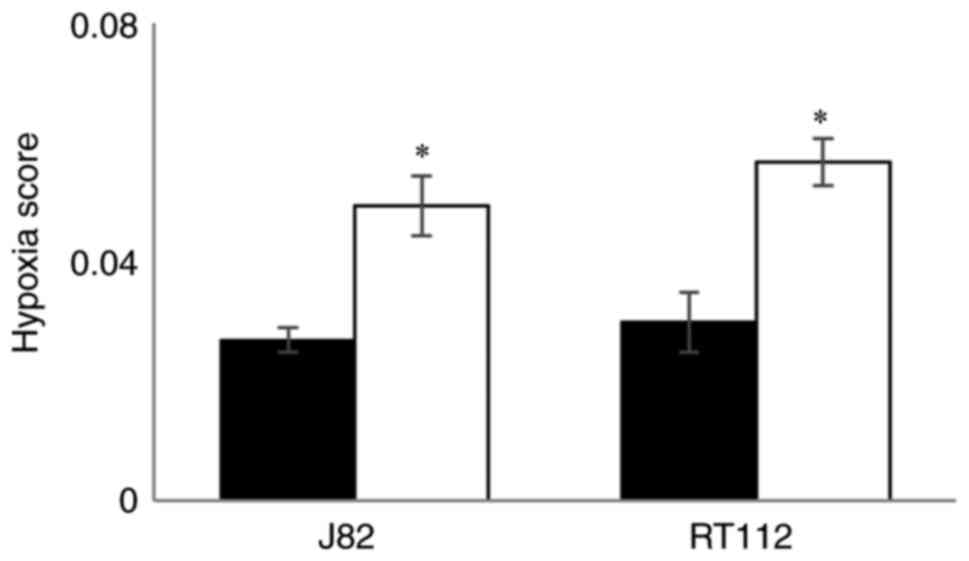
Effect of hypoxia on HS values in
bladder cancer cell lines
Hypoxia scores generated using TLDA for RT112 and
J82 bladder cancer cell lines exposed to hypoxia (0.1%
O2) for 24 h and compared with cells maintained in the
presence of 21% O2. The mean and SD of the HS values in
hypoxic and normal O2 levels are shown in Fig. 5. For both cell lines HS values
were higher (P<0.02) in cells exposed to hypoxia demonstrating
that the signature responds to low O2.
Discussion
Our study derived cut-off values for a 24-gene
bladder-specific hypoxia signature that could be used in a future
biomarker driven clinical trial. We also showed that the signature
can be implemented using several platforms and would not be limited
by intra-tumour heterogeneity; and then confirmed the hypoxia
relevance of our signature in bladder cancer by showing increased
hypoxia scores in vitro in cell lines exposed to low
oxygen.
Molecular testing is a rapidly evolving area,
particularly for breast cancer (e.g. Oncotype DX, MammaPrint,
Prosigna, Breast Cancer Index), and clinical implementation
requires selecting an appropriate platform. Platforms for measuring
RNA expression include full transcriptomic arrays/RNAseq and
targeted panels. Microarrays/RNAseq provide information on all
transcribed genes, which is useful in developing gene signatures
but is expensive and requires complex analysis when used for a
small number of genes in routine clinical practice. Quantitative
polymerase chain reaction (qPCR) measures relative gene expression
and is the gold standard method for bench marking gene expression.
Applied Biosystems customised TLDA cards can measure gene
expression for a small number of genes using qPCR (12,13). The approach uses a detection
system based on probes where complementary binding to cDNA results
in probe degradation and loss of quenching of a fluorescent beacon.
Each reaction well contains only one probe and so gene numbers
analysed are in the low twenties. NanoString nCounter technology
has the advantage that reverse transcription is not needed and a
larger number of genes (up to 800) can be analysed. QuantiGene
assays and targeted next generation sequencing are also used to
measure RNA expression.
Cross platform comparisons are required to
demonstrate transferability of signatures developed using full
transcriptomics onto targeted panels. For example, we previously
derived a 26-gene signature for measuring hypoxia in head and neck
cancer and showed a good correlation between microarray and TLDA
derived hypoxia scores (14). We
then used TLDA cards in a prospective clinical trial (15). A recent study (16) also demonstrated transferability
between array, nCounter and PCR-based platforms for a 38-gene
signature stratifying head and neck cancer response to primary or
adjuvant radiochemotherapy. In agreement with previous studies
(16,17), the bladder cancer hypoxia
signature expressed on the Clariom S microarray correlated closely
and showed greater concurrence with NanoString compared with
PCR-based techniques. It has also been shown that NanoString
demonstrates better correspondence between RNA from FFPE and
fresh-frozen tissue than does PCR (18). Reis et al (18) demonstrated that gene expression
data by NanoString showed a higher mean correlation (r=0.94)
between individual fresh-frozen and FFPE sample pairs compared to
real-time quantitative PCR (r=0.53) in a cohort of 19 patients with
oral carcinoma. Together these finding illustrate good
transferability of gene expression signatures across platforms.
We also examined the level of intra-tumour
variability in the bladder cancer hypoxia signature. Tumours
commonly exhibit histological and intratumour diversity that can
impact the powering of clinical trials (19). When a biomarker is heterogeneously
distributed within tissue, the ability to detect a specific effect
is diminished (20) requiring
larger cohort sizes in clinical trials. As expected, we found less
variation in the expression of our 24 signature genes and hypoxia
scores within than between tumours. Event number requirements are
related to gene signature length (21) probably due to the increased
susceptibility of shorter signatures to tumour heterogeneity.
Dibben et al (21)
demonstrated, that less events were required to achieve a power of
80% as the number of signature genes increased. The effect was
particularly apparent between 4 and 10 genes but reduced when
signature size increased to between 10 and 50 genes (21). Therefore, the 24 genes in our
signatures will limit heterogeneity.
Our group and collaborators develop hypoxia gene
signatures from seed genes taken from the literature or generated
by us in tumour-specific cell lines (22–24). The bladder gene signature was
developed using an a-priori approach based on established
hypoxia-sensitive genes and evaluated by demonstrating prognostic
capability. The resulting 24 gene signature was then validated
using gene expression data and outcome data from a further seven
patient cohorts. Here we confirm that hypoxia scores were higher in
bladder cancer cell lines exposed to hypoxia.
A potential limitation of our study is that we did
not examine relationships between hypoxia scores with
clinicopathological variables and patient outcomes. However, these
relationships have been reported previously. In a microarrayed
sub-group of the BCON cohort (n=151), patients stratified as high
hypoxia by the signature (i.e. those with hypoxia scores greater
than the cohort median) had higher tumour stages (P=0.03) and lower
pre-treatment haemoglobin levels (P=0.04). There were no
associations with sex, age, growth pattern and presence of
carcinoma in situ. Also, the prognostic and predictive value of the
24-gene signature was independent of clinicopathologic variables
and retained significance in multivariable analysis (7). We did not power the study reported
here for testing for prognostic significance or relationships with
clinical variables. However, the work generated here enables us to
test the signature prospectively using one of the platforms
tested.
In conclusion, our 24-gene bladder cancer hypoxia
signature is platform agnostic, i.e., hypoxia scores can be
generated using several gene expression approaches. There was a
better correlation between hypoxia scores generated using
NanoString and Clariom S gene arrays than that obtained using TLDA
cards. As NanoString can also accommodate probes for multiple
clinically relevant signatures (e.g. bladder cancer subtype
signatures), the platform could be used in a clinical trial. The
cut-off value determined prospectively in recent FFPE samples could
be used to identify patients with high levels of tumour hypoxia who
are most likely to benefit from having radiotherapy plus CON.
Acknowledgements
Not applicable.
Funding
This research was funded by the NIHR Efficacy and Mechanism
Evaluation programme (grant no. NIHR129943) and the MRC Confidence
in Concept -University of Manchester programme (grant no.
MC_PC_18056). CW, AC, TS are supported by NIHR Manchester
Biomedical Research Centre. HV was supported by Cancer Research UK
via funding to the Cancer Research Manchester Centre (grant no.
C147/A25254). OA was supported by a fellowship from the Mission
Sector of the Egyptian Ministry of Higher Education and Scientific
Research.
Availability of data and materials
The datasets used and/or analysed during the current
study are available from the corresponding author on reasonable
request. The transcriptomic datasets generated and/or analyzed
during the current study are available in the Gene Expression
Omnibus repository, under accession number GSE203149 (https://www.ncbi.nlm.nih.gov/geo/query/acc.cgi?acc=GSE203149;
publicly accessible, December 31, 2022).
Authors' contributions
CMLW, AC, PJH and TADS designed the study. RS and SV
performed cell studies (each can verify the data). Clariom S data
were normalised by BL and analysed by TADS, BL and TS confirm the
authenticity of all the raw data. KJR acquired clinical material
and analysed data. HD (pathologist) reviewed the histology for
tumour cellularity. SL, EM, JIJ, OAA, HV and TADS prepared samples,
extracted RNA and performed PCR. TADS, AC and CMLW wrote the paper.
All authors read, edited and approved the final version of the
manuscript.
Ethics approval and consent to
participate
Samples were obtained via the Manchester Cancer
Research Centre Biobank under research tissue bank ethics (ref.
18/NW/0092). Pre-treatment FFPE MIBC samples were collected from
recently treated patients who consented for use of their tissue in
research.
Patient consent for publication
Not applicable.
Competing interests
The authors declare that they have no competing
interests.
References
|
1
|
Huddart RA, Hall E, Lewis R, Porta N,
Crundwell M, Jenkins PJ, Rawlings C, Tremlett J, Campani L, Hendron
C, et al: Patient-reported quality of life outcomes in patients
treated for muscle-invasive bladder cancer with radiotherapy ±
chemotherapy in the BC2001 phase III randomised controlled trial.
Eur Urol. 77:260–268. 2020. View Article : Google Scholar : PubMed/NCBI
|
|
2
|
Rammant E, Van Wilder L, Van Hemelrijck M,
Pauwels NS, Decaestecker K, Van Praet C, Bultijnck R, Ost P, Van
Vaerenbergh T, Verhaeghe S, et al: Health-related quality of life
overview after different curative treatment options in
muscle-invasive bladder cancer: An umbrella review. Qual Life Res.
29:2887–2910. 2020. View Article : Google Scholar : PubMed/NCBI
|
|
3
|
Mak RH, Hunt D, Shipley WU, Efstathiou JA,
Tester WJ, Hagan MP, Kaufman DS, Heney NM and Zietman AL: Long-term
outcomes in patients with muscle-invasive bladder cancer after
selective bladder-preserving combined-modality therapy: A pooled
analysis of radiation therapy oncology group protocols 8802, 8903,
9506, 9706, 9906, and 0233. J Clin Oncol. 32:3801–3809. 2014.
View Article : Google Scholar : PubMed/NCBI
|
|
4
|
Larionova I, Rakina M, Ivanyuk E,
Trushchuk Y, Chernyshova A and Denisov E: Radiotherapy resistance:
Identifying universal biomarkers for various human cancers. J
Cancer Res Clin Oncol. 148:1015–1031. 2022. View Article : Google Scholar : PubMed/NCBI
|
|
5
|
Hoskin PJ, Rojas AM, Bentzen SM and
Saunders MI: Radiotherapy with concurrent carbogen and nicotinamide
in bladder carcinoma. J Clin Oncol. 28:4912–4918. 2010. View Article : Google Scholar : PubMed/NCBI
|
|
6
|
Song YP, Mistry H, Irlam J, Valentine H,
Yang LJ, Lane B, West C, Choudhury A and Hoskin PJ: Long-term
outcomes of radical radiation therapy with hypoxia modification
with biomarker discovery for stratification: 10-year update of the
BCON (bladder carbogen nicotinamide) phase 3 randomized trial
(ISRCTN45938399). Int J Radiat Oncol Biol Physics. 110:1407–1415.
2021. View Article : Google Scholar : PubMed/NCBI
|
|
7
|
Yang LJ, Taylor J, Eustace A, Irlam JJ,
Denley H, Hoskin PJ, Alsner J, Buffa FM, Harris AL, Choudhury A and
West CML: A gene signature for selecting benefit from hypoxia
modification of radiotherapy for high-risk bladder cancer patients.
Clin Cancer Res. 23:4761–4768. 2017. View Article : Google Scholar : PubMed/NCBI
|
|
8
|
Kong H, Zhu MG, Cui FY, Wang SY, Gao X, Lu
SH, Wu Y and Zhu HG: Quantitative assessment of short amplicons in
FFPE-derived long-chain RNA. Sci Rep. 4:72462009. View Article : Google Scholar : PubMed/NCBI
|
|
9
|
Smith TAD, AbdelKarem OA, Irlam-Jones JJ,
Lane B, Valentine H, Bibby BAS, Denley H, Choudhury A and West CML:
Selection of endogenous control genes for normalising gene
expression data derived from formalin-fixed paraffin-embedded
tumour tissue. Sci Rep. 10:172582020. View Article : Google Scholar : PubMed/NCBI
|
|
10
|
Dehne N, Hintereder G and Brüne B: High
glucose concentrations attenuate hypoxia-inducible factor-1alpha
expression and signaling in non-tumor cells. Exp Cell Res.
316:1179–89. 2010. View Article : Google Scholar : PubMed/NCBI
|
|
11
|
Liu Z, Jia X, Duan Y, Xiao H, Sundqvist
KG, Permert J and Wang F: Excess glucose induces hypoxia-inducible
factor-1α in pancreatic cancer cells and stimulates glucose
metabolism and cell migration. Cancer Biol Ther. 14:428–435. 2013.
View Article : Google Scholar : PubMed/NCBI
|
|
12
|
Huang P, Cheng CL, Chang YH, Liu CH, Hsu
YC, Chen JS, Chang GC, Ho BC, Su KY, Chen HY and Yu SL: Molecular
gene signature and prognosis of non-small cell lung cancer.
Oncotarget. 7:51898–51907. 2016. View Article : Google Scholar : PubMed/NCBI
|
|
13
|
Li JY, Xue Y, Wenger A, Sun YY, Wang Z,
Zhang CB, Zhang YQ, Fekete B, Rydenhag B, Jakola AS, et al:
Individual assignment of adult diffuse gliomas into the EM/PM
molecular subtypes using a TaqMan low-density array. Clin Cancer
Res. 25:7068–7077. 2019. View Article : Google Scholar : PubMed/NCBI
|
|
14
|
Betts GNJ, Eustace A, Patia S, Valentine
HR, Irlam J, Ramachandran A, Merve A, Homer JJ, Möller-Levet C,
Buffa FM, et al: Prospective technical validation and assessment of
intra-tumour heterogeneity of a low density array hypoxia gene
profile in head and neck squamous cell carcinoma. Eur J Cancer.
49:156–165. 2013. View Article : Google Scholar : PubMed/NCBI
|
|
15
|
Thomson D, Yang H, Baines H, Miles E,
Bolton S, West C and Slevin N: NIMRAD-a phase III trial to
investigate the use of nimorazole hypoxia modification with
intensity-modulated radiotherapy in head and neck cancer. Clin
Oncol (R Coll Radiol). 26:344–347. 2014. View Article : Google Scholar : PubMed/NCBI
|
|
16
|
Schmidt S, Linge A, Grosser M, Lohaus F,
Gudziol V, Nowak A, Tinhofer I, Budach V, Sak A, Stuschke M, et al:
Comparison of GeneChip, nCounter, and real-time PCR-based gene
expressions predicting locoregional tumor control after primary and
postoperative radiochemotherapy in head and neck squamous cell
carcinoma. J Mol Diag. 22:801–810. 2020. View Article : Google Scholar : PubMed/NCBI
|
|
17
|
Geiss GK, Bumgarner RE, Birditt B, Dahl T,
Dowidar N, Dunaway DL, Fell HP, Ferree S, George RD, Grogan T, et
al: Direct multiplexed measurement of gene expression with
color-coded probe pairs. Nat Biotech. 26:317–325. 2008. View Article : Google Scholar : PubMed/NCBI
|
|
18
|
Reis PP, Waldron L, Goswami RS, Xu W, Xuan
Y, Perez-Ordonez B, Gullane P, Irish J, Jurisica I and Kamel-Reid
S: mRNA transcript quantification in archival samples using
multiplexed, color-coded probes. BMC Biotechnol. 11:462011.
View Article : Google Scholar : PubMed/NCBI
|
|
19
|
Pintilie M, Iakovlev V, Fyles A, Hedley D,
Milosevic M and Hill RP: Heterogeneity and power in clinical
biomarker studies. J Clin Oncol. 27:1517–1521. 2009. View Article : Google Scholar : PubMed/NCBI
|
|
20
|
Li Y and Ryan L: Survival analysis with
heterogeneous covariate measurement error. J Am Stat Assoc.
99:724–735. 2004. View Article : Google Scholar
|
|
21
|
Dibben SM, Holt RJ, Davison TS, Wilson CL,
Taylor J, Paul I, McManus K, Kelly PJ, Proutski V, Harkin DP, et
al: Implications for powering biomarker discovery studies. J Mol
Diag. 14:130–139. 2012. View Article : Google Scholar : PubMed/NCBI
|
|
22
|
Yang LJ and West CML: Hypoxia gene
expression signatures as predictive biomarkers for personalising
radiotherapy. Br J Radiol. 92:201800362018. View Article : Google Scholar : PubMed/NCBI
|
|
23
|
Yang LJ, Forker L, Irlam JJ, Pillay N,
Choudhury A and West CML: Validation of a hypoxia related gene
signature in multiple soft tissue sarcoma cohorts. Oncotarget.
9:3946–3955. 2018. View Article : Google Scholar : PubMed/NCBI
|
|
24
|
Yang LJ, Roberts D, Takhar M, Erho N,
Bibby BAS, Thiruthaneeswaran N, Bhandari V, Cheng WC, Haider S,
McCorry AMB, et al: Development and validation of a 28-gene
hypoxia-related prognostic signature for localized prostate cancer.
EBioMedicine. 31:182–189. 2018. View Article : Google Scholar : PubMed/NCBI
|