Introduction
Nonalcoholic fatty liver disease (NAFLD) is a
disorder involving excess fat buildup in the liver. Causes of NAFLD
include insulin resistance, lifestyle diseases, abnormal lipid
metabolism, endocrine diseases, etc. Individuals with this
condition have fatty deposits in the liver without excessive
alcohol use (1). NAFLD is a risk
factor for the development of lifestyle-related diseases and should
be regarded as a systemic disease since obesity and
lifestyle-related diseases are frequently associated (1,2).
Classifications of NAFLD include nonalcoholic fatty liver, which
develops based on large-drop fat degeneration and rarely
progresses, and nonalcoholic steatohepatitis (NASH), which is
progressive and can result in liver cirrhosis and hepatocellular
carcinoma (3).
NASH is a pathological condition of NAFLD in which
fatty degeneration, inflammatory cell infiltration, and
hepatocellular injury (balloon-like degeneration) are observed
(4–6). Currently, it is estimated that ~25%
of the world population has NAFLD, with a high prevalence in obese
and diabetic subjects (7,8). The risk of progression to cirrhosis
and liver cancer is a problem in cases with highly advanced
fibrosis (9,10). Unfortunately, a promising marker
of initial fibrosis and a test method that can predict future
fibrosis has yet to be discovered.
In our previous study, we showed that various mRNA
and non-coding RNA expression changes occur in human liver cancer
patient tissues and can be classified by disease stage (11). Previously, it was also suggested
that microRNAs are altered in the NASH liver, and miR-122 and
miR-192 appear in the blood, which may serve as biomarkers for NASH
(12). Therefore, gene expression
in NASH liver tissue and blood samples could be examined to predict
future fibrosis. In this study, we used a mouse model of NASH
induced by a high-fat diet to examine gene expression in the liver
and to search for transcripts that could predict early liver
fibrosis in the future.
Materials and methods
Animals
Five-week-old C57BL/6NJcl male mice were purchased
from Clea Japan and acclimatized for 1 week before starting the
experiment. Food and water were fed ad libitum to the mice and
changed every two to three days. The bedding was changed once a
week. The mice were fed a choline-deficient, L-amino acid-defined,
high-fat diet (CDAHFD, A06071302, RESEARCH DIETS) consisting of 60
kcal% fat and 0.1% methionine by weight to induce the onset of NASH
(13). A dietary breeding
solid-type feed CE-2 (Clea Japan) was fed to a control mouse group
under the same conditions other than the diet. A sampling of six
animals in each control and NASH group was performed at 1, 2, and 6
weeks. One mouse from each group had the liver removed after
perfusion fixation with 4% paraformaldehyde, and the other four or
five had the liver removed after cardiac blood sampling. All
experiments were performed under anesthesia with the inhalation
anesthetic solution isoflurane (Pfizer Inc.). Anesthesia was
introduced by inhalation with a small animal anesthesia machine
(Muromachi Kikai) vaporized to a concentration of 4–5% and
maintained at 2–3%. Cervical dislocation was used for euthanasia
after liver removal, and death was confirmed by cessation of
respiration and heartbeat. Liver samples were stored at −80°C
immediately after collection, and blood samples were serum
separated immediately after collection. All animal experiments were
performed in accordance with the Guidelines for Animal
Experimentation of Hirosaki University, and complied with the
ARRIVE guidelines and the AVMA euthanasia guidelines 2020. The
procedures were approved by The Animal Research Committee of
Hirosaki University (approval nos. G18002).
Hematoxylin and eosin staining
Paraffin-embedded tissue was thin sliced at 4 µm.
The slide glass to which the paraffin-embedded section was attached
was deparaffinized, treated for hydrophilicity, and washed with
water. After 1 min, Mayer's hematoxylin solution (Wako) was applied
to dye the nuclei, and the excess color was rinsed with warm water
for 10 min. After staining with 0.5% eosin Y/ethanol solution
(Wako) for 10 sec, the slides were washed with water to remove
excess staining solution and separated with 75% ethanol. Specimens
were dehydrated with ethanol, rendered transparent with xylene, and
mounted with Marinol (Muto Chemical Co., Ltd.) and cover glass
(Matsunami Glass Industry Co.). The stained slides were visualized
under visible light using a BZ-X700 microscope (KEYENCE).
Sirius red staining
Slides with paraffin-embedded sections attached were
deparaffinized, treated for hydrophilicity, and washed with running
water for 5 min. After dyeing with Sirius red solution for 10 min,
the color was rinsed with water for 5 min, then dehydrated with
ethanol, rendered transparent with xylene, and mounted with Marinol
(Muto Kagaku Co., Ltd.) and cover glass (Matsunami Glass Industry
Co.). The stained slides were visualized under visible light using
a BZ-X700 microscope (KEYENCE).
Immunohistochemistry staining
Slides with paraffin sections attached were
deparaffinized, treated for hydrophilicity, and washed with water
for 5 min. Slides were treated with 3% H2O2
for 5 min to inactivate the endogenous peroxidase and washed with
water for 5 min. For antigen activation, the slides were placed in
a heat-resistant doze filled with citric acid buffer (pH 6.0) and
autoclaved at 115°C for 5 min. The slides were washed with TBS
buffer (25 mM Tris-HCl and 150 mM NaCl, pH 7.2) for 5 min and
treated with blocking solution (5% goat serum in TBS buffer) at
room temperature for 30 min. Next, the slides were incubated with
the blocking solution containing a primary rabbit monoclonal
antibody directed against α-smooth muscle actin (α-SMA) (Cell
Signaling Technology) at a 1:500 dilution at room temperature for
60 min, then washed three times with TBS buffer, and incubated at
room temperature for 60 min with EnVision +System-HRP Labelled
Polymer Anti-Rabbit (Dako). The slides were washed three more times
with TBS buffer and stained with 3,3′-diaminobenzidine and Mayer's
hematoxylin solutions.
RNA extraction
RNAs from livers, serum and serum exosomes were
extracted using the Isogen II reagent (Nippon gene), according to
the manufacturer's instructions. The quality and concentration of
total RNAs from livers were assessed using a NanoDrop
spectrophotometer (NanoDrop Technologies). All RNA samples had
260/280 nm absorbance ratios of 1.8-2.0. The concentration of RNAs
from serum and serum exosomes was measured using Qubit™
4 Fluorometer and Qubit™ microRNA Assay kit (Thermo
Fisher Scientific, Inc.).
The peaks of total RNAs were confirmed using an
Agilent 2100 Bioanalyzer and an Agilent RNA 6000 Pico Kit (Agilent
Technologies), according to the manufacturer's instructions.
Microarray analysis
Cyanine 3 (Cy3)-labeled complementary RNA (cRNA) was
synthesized from 150 ng of liver total RNA using a Low Input Quick
Amp Labeling Kit (Agilent Technologies), according to the
manufacturer's instructions. The synthesized Cy3-labeled cRNA was
hybridized with a microarray slide (SurePrint G3 Mouse GE 8×60 K
Microarray Kit; Agilent Technologies) at 65°C for 17 h. After
hybridization, the slides were washed with the Gene Expression Wash
Pack (Agilent Technologies). Cy3 fluorescence signals were detected
with a SureScan Microarray Scanner (Agilent Technologies).
Fluorescent images were quantified using Feature Extraction
software (Agilent Technologies). GeneSpring 14.5 software (Agilent
Technologies) was used for normalization and expression analysis.
Genes showing an expression level fold change >1.5 or higher
were analyzed by comparing the control and NASH groups. Function
prediction was performed using Ingenuity Pathway Analysis (IPA)
(Qiagen).
Real-time PCR
The expression of mouse collagen type III α1
(Col3a1) and glyceraldehyde-3-phosphate dehydrogenase (Gapdh) mRNAs
in mouse liver was determined by real-time PCR. Complementary DNA
(cDNA) was synthesized from total RNA using the Applied
Biosystems™ High-Capacity cDNA Reverse Transcription Kit
(Thermo Fisher Scientific, Inc.), according to the manufacturer's
instructions. Quantitative polymerase chain reaction (qPCR) was
performed using a Power SYBR Green PCR Master Mix (Thermo Fisher
Scientific, Inc.), 10 µM of forward and reverse primer pairs, and
the StepOne Plus Real-time PCR System (Thermo Fisher Scientific,
Inc.) under the following conditions: 10 min at 95°C, followed by
45 cycles each of 95°C for 15 sec, and 60°C for 60 sec with Gapdh
used as an internal control.
The expression level of miR-21 in mouse liver, serum
and serum exosomes was examined by real-time PCR. Exosomes from
serum were extracted using Total Exosome Isolation from serum
(Thermo Fisher Scientific, Inc.). The cDNAs from miR-21 were
synthesized using the TaqMan™ miRNA RT Kit and the
prescribed 5× RT primer (both from Thermo Fisher Scientific, Inc.),
according to the manufacturer's instructions. The qPCR for miR-21
was performed using a FastStart TaqMan probe master (Roche
Diagnostics), a 20× probe, and the StepOne Plus Real-Time PCR
System (Thermo Fisher Scientific, Inc.) under the following
conditions: 10 min at 95°C, followed by 45 cycles at 95°C for 15
sec, and 60°C for 60 sec with U6 snRNA as an internal control and
cel-miR-39 as an external control. The comparative Ct method was
used to determine expression levels.
Statistical analysis
Statcel 3 software (OMS Publishing Inc., Saitama,
Japan) was used to perform all statistical analyses. Unpaired
Student's t-test was performed to compare the results of the two
groups. P<0.05 was considered a statistically significant
difference.
Results
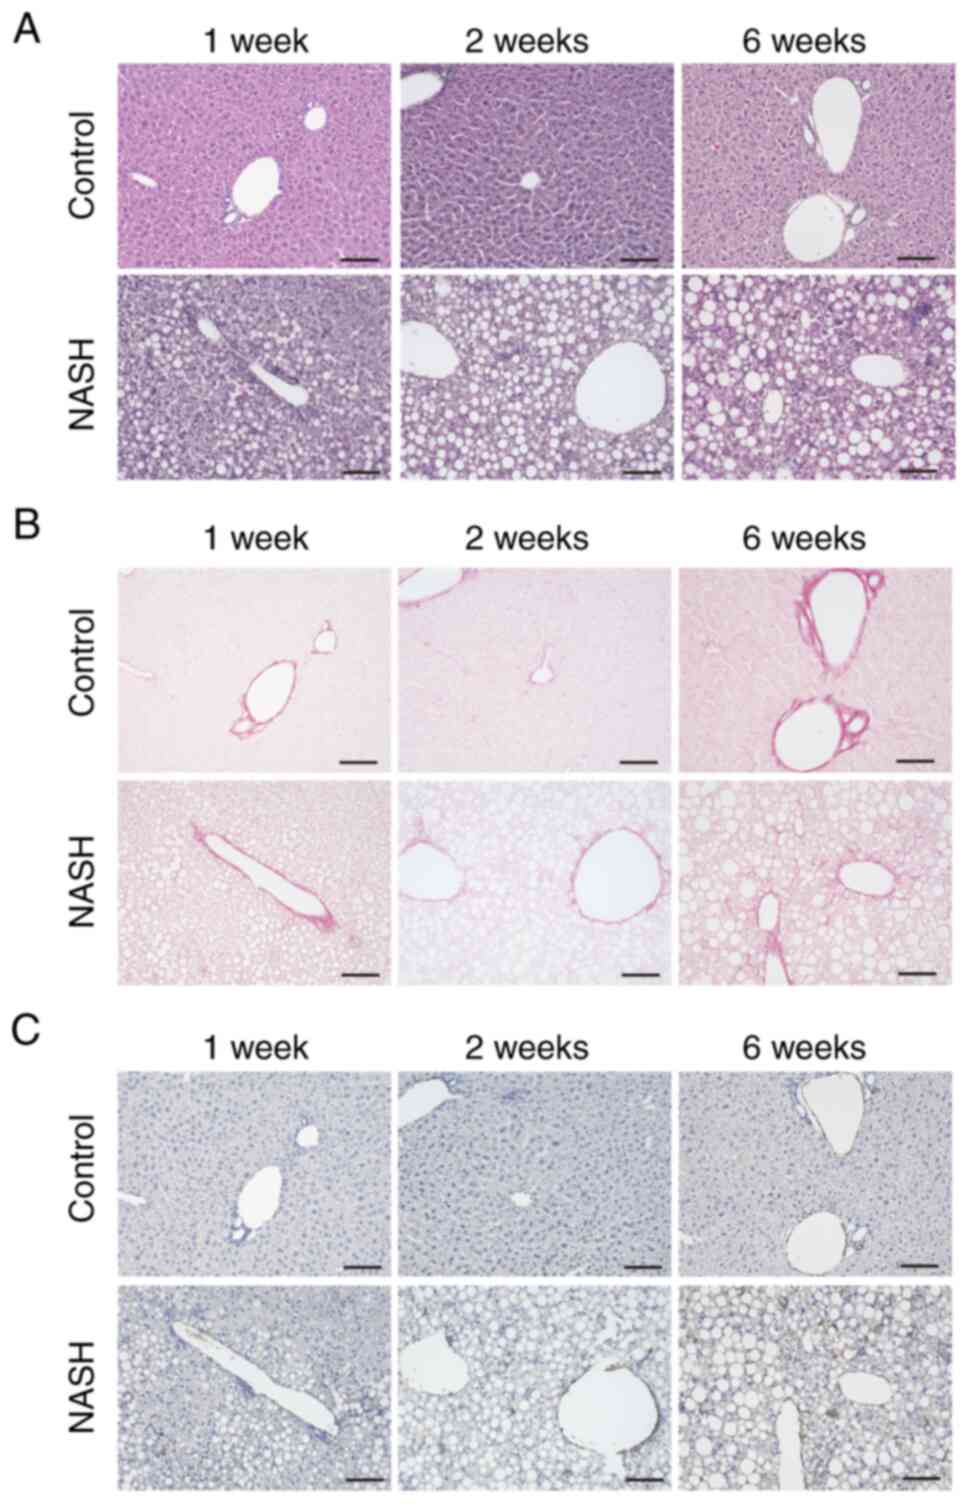
Histological changes in mouse NASH
livers
We harvested the livers of control and NASH mice at
1, 2, and 6 weeks after high-fat diet intake for histological
analysis to confirm the model. The livers of the control group mice
were histologically normal at all time points. In contrast, the
livers of the NASH mice showed hepatocellular damage and fat
droplets and the appearance of inflammatory cells by hematoxylin
and eosin staining after 2 and 6 weeks. At 1 week, some of the NASH
group showed changes (Fig. 1A).
Sirius red staining and α-SMA immunostaining revealed increasing
fibers and activated star cells in NASH mice 6 weeks after
ingesting the high-fat diet (Fig. 1B
and C). These results indicate that the entire liver is in a
NASH state after 2 weeks of high-fat diet intake and that liver
fibrosis occurs at 6 weeks.
Gene expression changes in mouse NASH
livers
To investigate the changes in gene expression
associated with NASH development, we performed mRNA microarray
analysis. We investigated genes with >1.5-fold difference in
expression in the NASH group compared to the control group. Mice at
1 week without complete NASH, 2 weeks with NASH, and 6 weeks with
advanced fibrosis were selected for analysis.
The numbers of genes upregulated more than 1.5-fold
in the livers of NASH mice compared to control mice were 2912, 2684
and 2791 in 1, 2 and 6 weeks, respectively (Fig. S1). Whereas, the numbers of genes
downregulated more than 1.5-fold in the livers of NASH mice
compared to control mice were 5243, 4288 and 4591 in 1, 2 and 6
weeks, respectively (Fig. S1).
These suggest that numerous gene expressions are altered by the
onset of NASH. The microarray data used in this study were
registered with Gene Expression Omnibus (GSE200409).
Functional change prediction by
IPA
Based on the mRNA expression data of mouse livers at
1, 2, and 6 weeks, we used IPA toxicity ontology analysis to
predict functional changes and determine which expressed genes
affect biological functions and diseases. Increased liver damage,
liver inflammation, liver steatosis and liver fibrosis was shown as
a predicted function. In addition, when we compared the
histological findings with the time when the cells started to show
hyperfunction by gene expression, there was a general agreement
between the two (Table I).
Interestingly, fibrosis was not clearly visible in the histological
findings until 6 weeks, but functional prediction by gene
expression was forecast to increase at 2 weeks.
 | Table I.Comparison of histological findings
and functional prediction by Ingenuity Pathway Analysis. |
Table I.
Comparison of histological findings
and functional prediction by Ingenuity Pathway Analysis.
| Time after high-fat
diet intake | Liver damage | Liver
inflammation | Liver steatosis | Liver fibrosis |
|---|
|
|
|
|
|---|
| Histological
findings | Functional
prediction | Histological
findings | Functional
prediction | Histological
findings | Functional
prediction | Histological
findings | Functional
prediction |
|---|
| 1 week | Damage | Hyperfunction | Partial
fatidation | No sign | Non-fibrosis | Mild
hyperfunction | Non-fibrosis | Mild
hyperfunction |
| 2 weeks | Damage | Hyperfunction | Fatidation | Hyperfunction | Mild fibrosis | Hyperfunction | Mild fibrosis | Hyperfunction |
| 6 weeks | Significant
damage | Hyperfunction | Fatidation | Hyperfunction | Fibrosis | Hyperfunction | Fibrosis | Hyperfunction |
As for liver fibrosis, the increase in the number of
molecules associated with fibrosis between 1 and 2 weeks was more
pronounced than at 6 weeks when histological findings confirmed
fibrosis. In addition, the Venn diagram of common liver
fibrosis-related expressed genes showed that there were 11 genes
common in all weeks (Fig. 2).
Changes in common genes and expression levels at 1, 2, and 6 weeks
are shown in Table II. There
were 54 genes in common between 2 and 6 weeks, and there was little
difference in the number of genes between 2 and 6 weeks. This
finding suggests that changes in gene expression associated with
the pathogenesis of NASH occur as early as 1 week and the
expression of fibrosis-associated molecules is already increased
from 1 or 2 weeks when a clear fibrosis image is observed on
pathological examination at 6 weeks.
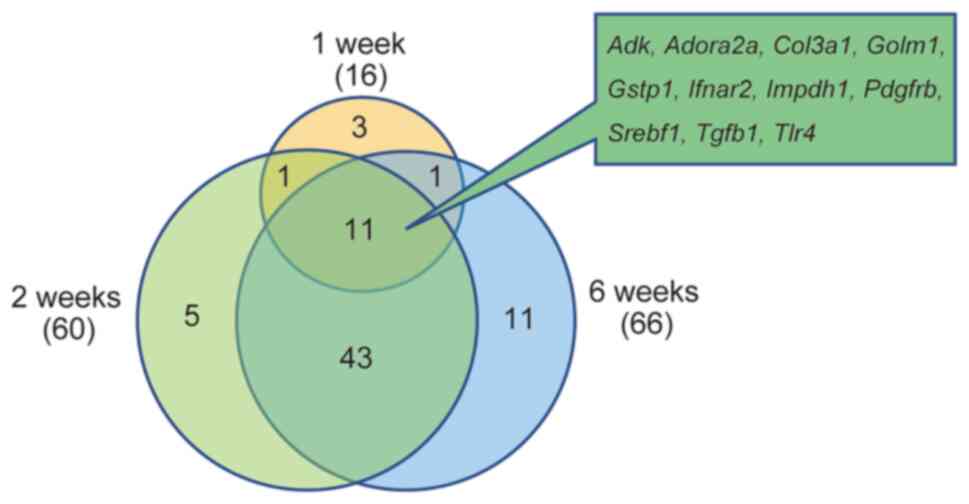 | Figure 2.Toxic ontology analysis of diseases
and functions by Ingenuity Pathway Analysis. Venn diagram of liver
fibrosis-related genes. The genes associated with liver fibrosis in
Table II are presented in the
Venn diagram. NASH, non-alcoholic steatohepatitis; Adk, adenosine
kinase; Adora2a, adenosine A2a receptor; Col3a1, collagen type III
α1; Golm1, golgi membrane protein 1; Gstp1, glutathione
S-transferase, pi1; Ifnar2, interferon (α and β) receptor 2;
Impdh1, inosine monophosphate dehydrogenase 1; Pdgfrb, platelet
derived growth factor receptor, β polypeptide; Srebf1, sterol
regulatory element binding transcription factor 1; Tgfb1,
transforming growth factor, β1; Tlr4, toll-like receptor 4. |
| Table II.Changes in gene expression of
fibrosis-related genes at 1, 2 and 6 weeks. |
Table II.
Changes in gene expression of
fibrosis-related genes at 1, 2 and 6 weeks.
|
| Fold-change |
|---|
|
|
|
|---|
| Genes | 1 week | 2 weeks | 6 weeks |
|---|
| Adk | 48.87 | −1.75 | −1.94 |
| Adora2a | 1.59 | 1.59 | 3.27 |
| Col3a1 | 4.74 | 6.74 | 9.61 |
| Golm1 | 2.62 | 4.97 | 4.88 |
| Gstp1 | −3.28 | −2.50 | −2.57 |
| Ifnar2 | −1.66 | −1.63 | −1.63 |
| Impdh1 | 1.86 | 2.16 | 2.02 |
| Pdgfrb | 1.80 | 2.00 | 3.33 |
| Srebf1 | −2.56 | −2.66 | −2.05 |
| Tgfb1 | 1.93 | 2.35 | 2.67 |
| Tlr4 | 1.80 | 2.73 | 2.64 |
Prediction of upstream regulatory
molecules by IPA upstream analysis
To investigate the upstream molecules involved in
the changes in gene expression, we performed IPA upstream analysis.
The upstream molecules predicted to be involved in the activation
or repression of gene expression are shown in Fig. S2. Among the upstream molecules,
transcription regulators, kinase, and enzyme changes were
particularly common. Among the upstream regulatory molecules, we
focused on miRNAs as promising biomarkers that can be measured in
the blood (Table III and
Fig. S2). The findings suggest
that various upstream regulatory molecules, including microRNAs,
are involved in the expression changes of NASH-related genes.
| Table III.Prediction of upstream regulatory
miRNAs by upstream analysis. |
Table III.
Prediction of upstream regulatory
miRNAs by upstream analysis.
| Prediction | 1 week | 2 weeks | 6 weeks |
|---|
| Activated | None | miR-223 | miR-223 |
|
| let-7 | let-7 | miR-122 |
|
| miR-122 | miR-122 | miR-181 |
|
| miR-17 | miR-135 | miR-196 |
| Inhibited | miR-148 | miR-148 | miR-21 |
|
| miR-196 | miR-196 | miR-30 |
|
|
| miR-21 | miR-7 |
|
|
| miR-7 |
|
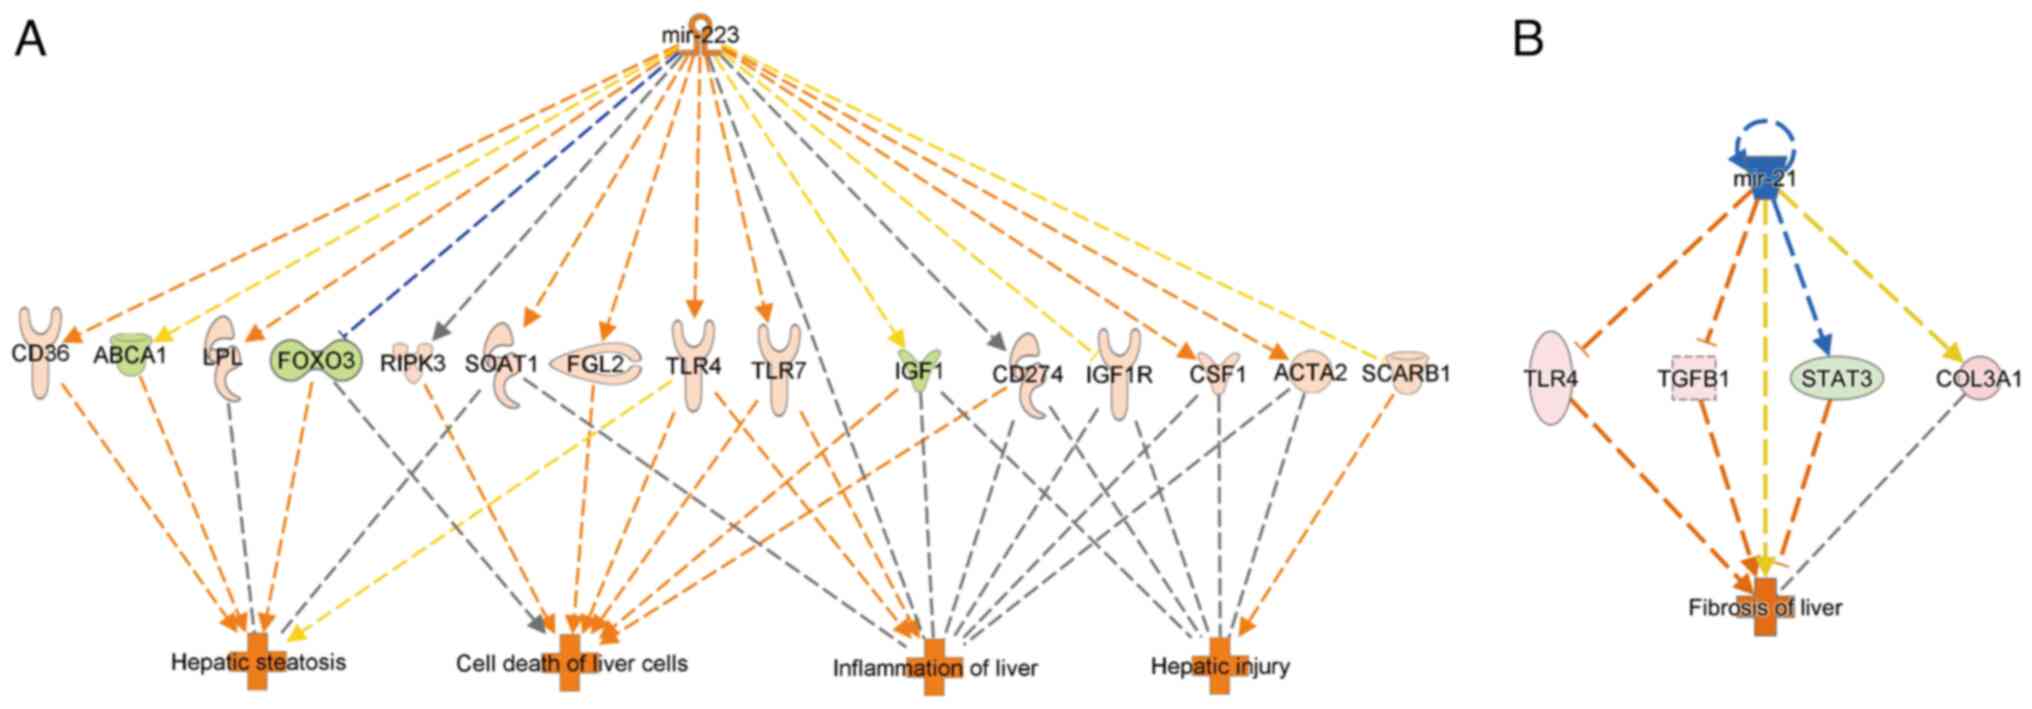
Integrated pathway analysis
From Table III,
we focused on miR-223, which was predicted to be active in
expression, and miR-21, which was predicted to be repressed. The
gene numbers for which these microRNAs were predicted to be
involved in the regulation of gene expression were evaluated
(Table IV). Based on an
integrated pathway between upstream molecules and gene expression
and function prediction in IPA (Fig.
3), miR-223 upregulation was predicted to enhance hepatocyte
adipogenesis, cell death, inflammation, and hepatocellular injury.
In contrast, miR-21 downregulation was predicted to enhance
fibrosis.
| Table IV.Number of genes expected to be
regulated by miR-223 and miR-21 in non-alcoholic steatohepatitis
liver. |
Table IV.
Number of genes expected to be
regulated by miR-223 and miR-21 in non-alcoholic steatohepatitis
liver.
| microRNA
(prediction) | 1 week | 2 weeks | 6 weeks |
|---|
| miR-223
(activated) | None | 54 | 57 |
| miR-21
(inhibited) | None | 71 | 73 |
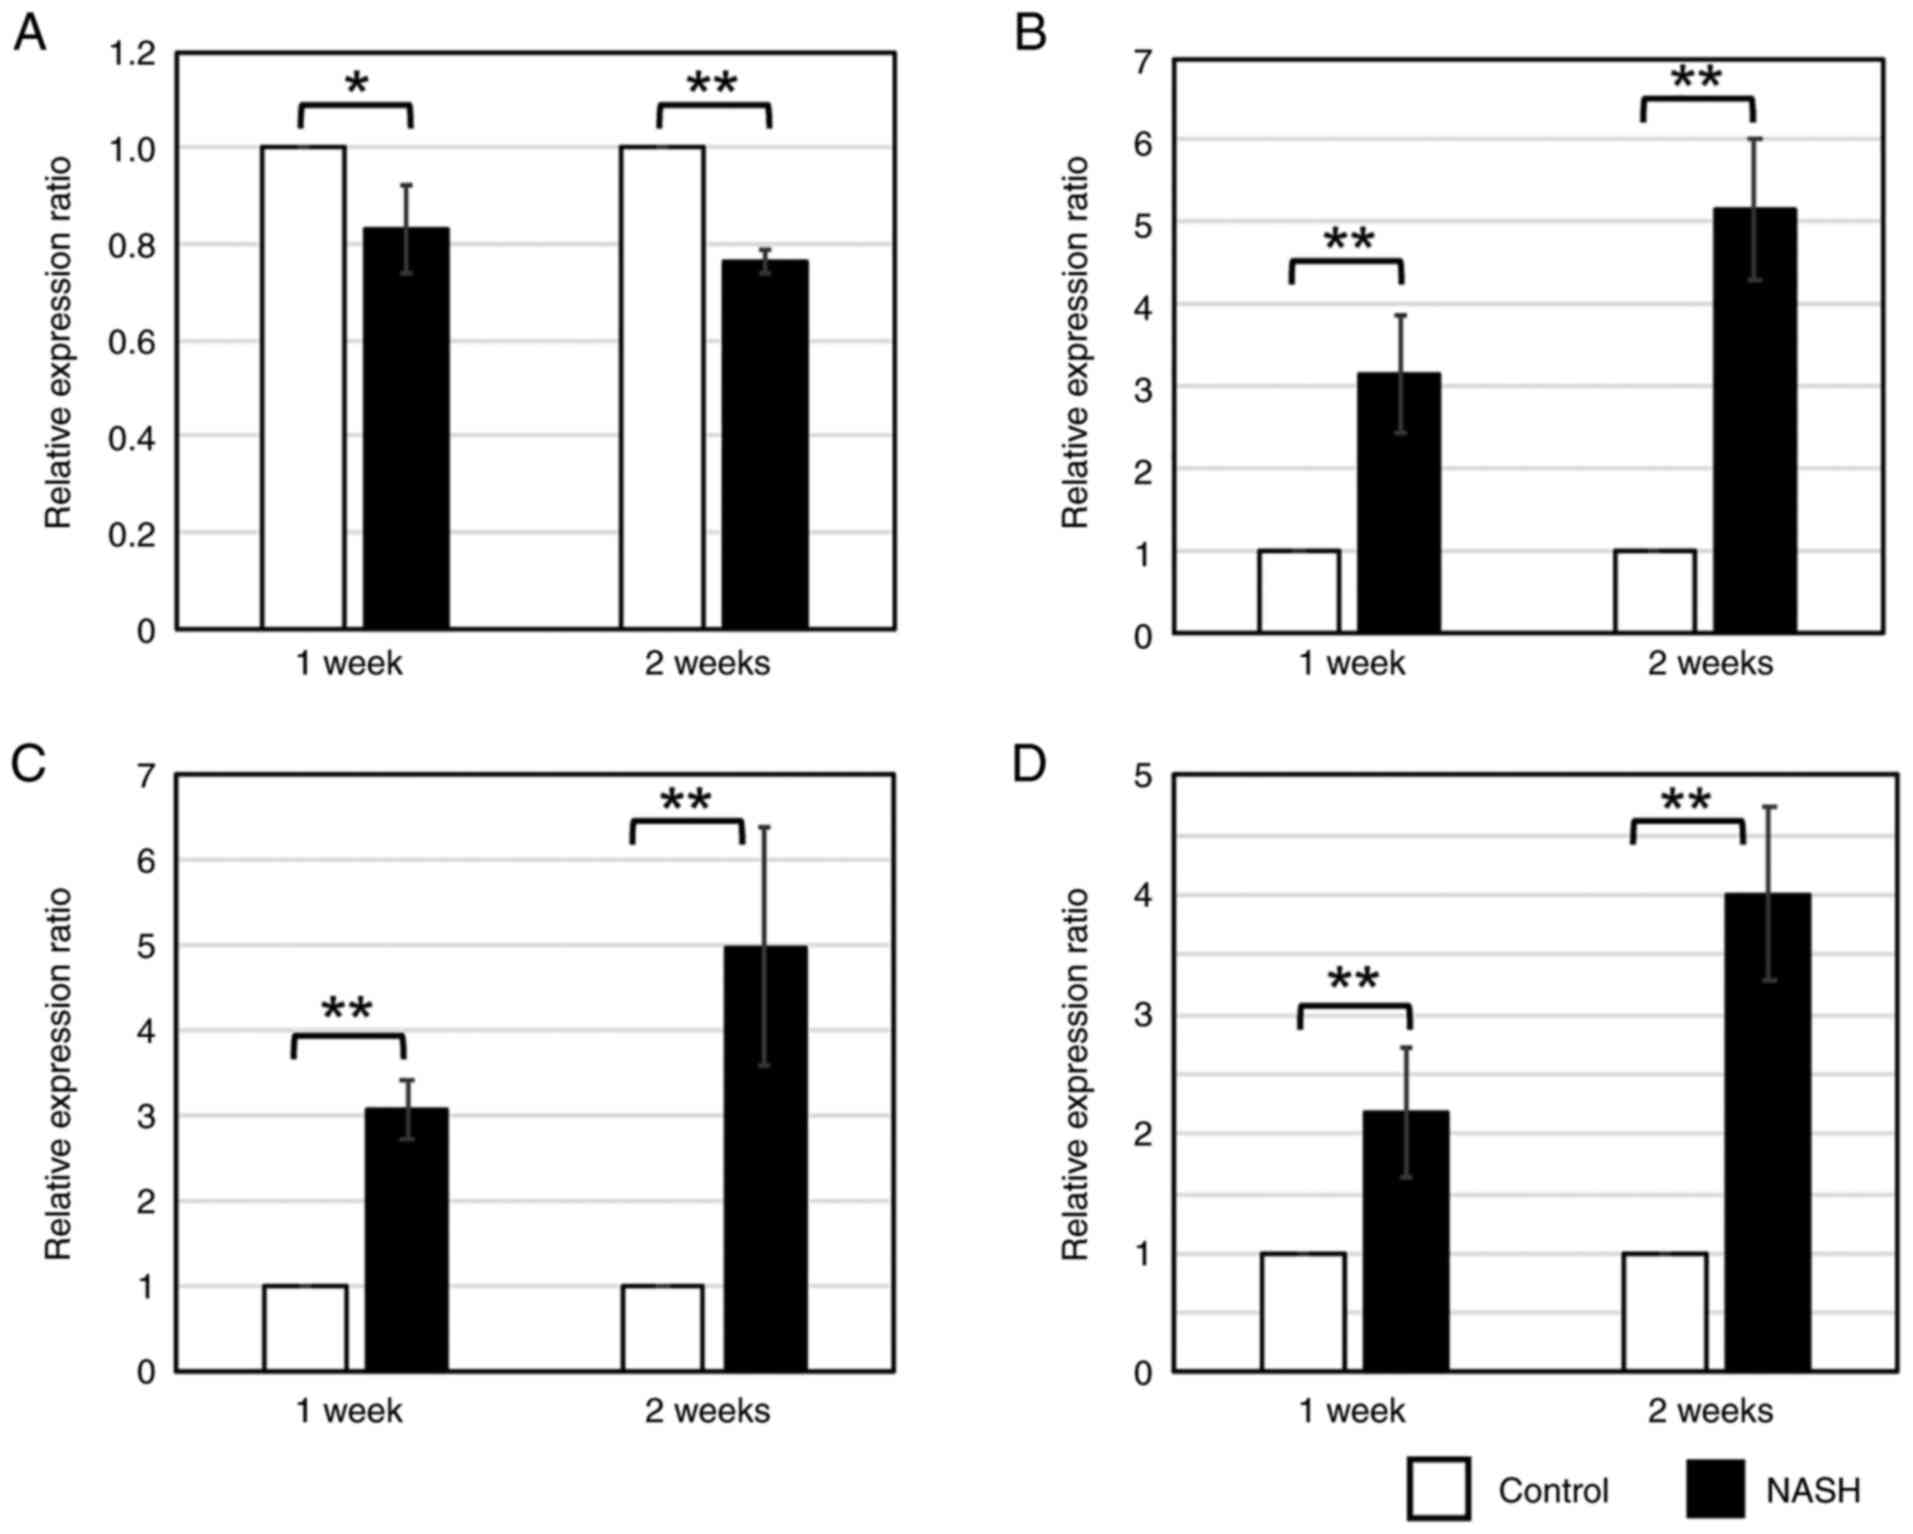
Altered expression of miR-21 and
fibrosis-related gene Col3a1
Real-time PCR was performed for miR-21, which was
predicted to be associated with liver fibrosis. Significant
downregulation of miR-21 expression was observed in NASH liver
tissues at 1 and 2 weeks (Fig.
4A). For Col3a1, a gene predicted to be regulated by miR-21 and
whose expression was predicted to increase over time, real-time PCR
using the primers in Table V
showed a significant increase in expression in NASH liver tissue at
weeks 1 and 2 (Fig. 4B). This
finding suggests that the expression of miR-21 in liver tissue
decreased and the expression of its target, Col3a1, increased.
| Table V.Primer pairs for reverse
transcription-quantitative PCR. |
Table V.
Primer pairs for reverse
transcription-quantitative PCR.
| Primer | Sequence
(5′-3′) | Amplicon size,
bp |
|---|
| Gapdh
forward |
GGGTTCCTATAAATACGGACTGC | 112 |
| Gapdh
reverse |
CCATTTTGTCTACGGGACGA |
|
| Col3a1
forward |
GCCCACAGCCTTCTACAC | 109 |
| Col3a1
reverse |
CCAGGGTCACCATTTCTC |
|
Interestingly, serum miR-21 expression and serum
exosomal miR-21 were significantly increased at 1 and 2 weeks of
high fat diet feeding compared to controls (Fig. 4C and D). These results suggest
that miR-21 may leak from the liver into the blood during the early
phase of NASH, and that fibrosis may be enhanced thereafter.
Discussion
In the study, liver fibrosis was predicted by mRNA
microarray analysis using mice fed a high-fat diet (CDAHFD) to
induce NASH. Hematoxylin and eosin staining after 2 weeks showed
features of NASH (inflammatory cell infiltration, fatty
degeneration, and hepatocellular damage). Sirius red staining after
6 weeks showed fibrosis, and α-SMA immunohistochemical staining
showed activation of hepatic stellate cells. In addition to
inflammation, fibrosis was observed in mice fed CDAHFD at 6 weeks
in a previous study (14). These
results suggest that 2 weeks of feeding is suitable for the NASH
model before fibrosis occurs and 6 weeks or later for advanced
fibrosis development when the high-fat diet is used in this
model.
We performed liver mRNA microarray analysis at 1, 2,
and 6 weeks after high-fat diet intake and analyzed the function of
genes with significant differences in IPA. When we compared
histological findings with the predicted time of increased
function, there was a general agreement, but the gene expression
changes in liver fibrosis preceded the histological changes. The
number of genes associated with liver fibrosis markedly increased
from the first to 2 weeks of feeding, suggesting that gene
expression changes prior to the time when fibrosis can be confirmed
by pathological examination and that examining changes in fibrosis
genes in liver biopsy specimens will enable prediction of future
fibrosis.
The upstream regulatory molecules were selected as a
relevant upstream regulatory molecule from the gene expression
results. Among the upstream regulatory molecules, we focused on
microRNAs, which can be analyzed using minimally invasive blood
samples since the goal is to use microRNAs as fibrosis biomarkers
in the future. We selected miR-223 and miR-21 as NASH-associated
microRNAs. Previously, it has been reported that miR-223 is
involved in cholesterol metabolism and cell apoptosis in the liver
(15,16) and expression of miR-223 is altered
in various liver diseases, and miR-223 expression is upregulated in
liver tissue of NASH model mice (17).
Among the genes regulated by miR-21 that were
predicted to be associated with liver fibrosis, we examined the
expression of Col3a1, which was predicted to be upregulated. We
found a significant increase in expression in liver tissue. Col3a1
is a gene for type III collagen, a major component of tissues with
elongation function, and accumulation of type III collagen is
observed in diseases associated with fibrosis (18). In this study, Col3a1 expression
was significantly increased in the NASH group after 1 week of
feeding, suggesting that fibrosis gene expression increases before
2 weeks when the onset of NASH can be confirmed by histological
findings.
Decreased expression of liver miR-21 was observed
very early in the development of NASH. However, it has been
previously reported that increased expression of miR-21 promotes
fibroblast proliferation and is associated with the development of
fibrosis due to abnormal deposition of extracellular matrix
(19). It is also known that
miR-21 is generally overexpressed in NASH, as inhibition of liver
miR-21 reduces hepatocyte damage, inflammation, and fibrogenesis
(20). These reports are
inconsistent with our results in the present study, suggesting that
miR-21 expression in the liver may differ depending on the timing
of NASH onset and the model used. On the other hand, the increase
in serum miR-21 with the onset of NASH was consistent with reports
by other investigators (21).
Therefore, monitoring blood miR-21 or exosomal miR-21 expression
may be more important for fibrosis detection than miR-21 expression
in the liver.
In this study, we newly showed that exosomal miR-21
in serum is increased in the blood of early NASH mice after 1 week
of high-fat diet intake, suggesting the emergence of fibrosis. In
the future, we would like to investigate the usefulness of serum
exosomal miR-21 as a fibrosis marker.
Supplementary Material
Supporting Data
Acknowledgements
Not applicable.
Funding
The present study was supported in part by The JSPS KAKENHI
(grant nos. 21H04844 and 20K21692).
Availability of data and materials
The datasets used and/or analyzed during the current
study are available from the corresponding author on reasonable
request.
Authors' contributions
KM and MC were major contributors in performing the
experiments and writing the manuscript. YK, MH, RM and SM helped
conduct the experiments. All authors read and approved the final
manuscript. KM and MC confirmed the authenticity of all the raw
data.
Ethics approval and consent to
participate
All experiments were performed in accordance with
The Guidelines for Animal Experimentation of the Hirosaki
University. The procedures were approved and monitored by The
Animal Research Committee of Hirosaki University (approval no.
G18002).
Patient consent for publication
Not applicable.
Competing interests
The authors declare that they have no competing
interests.
References
|
1
|
Ratziu V, Bellentani S, Cortez-Pinto H,
Day C and Marchesini G: A position statement on NAFLD/NASH based on
the EASL 2009 special conference. J Hepatol. 53:372–384. 2010.
View Article : Google Scholar : PubMed/NCBI
|
|
2
|
Cotter TG and Rinella M: Nonalcoholic
fatty liver disease 2020: The state of the disease.
Gastroenterology. 158:1851–1864. 2020. View Article : Google Scholar : PubMed/NCBI
|
|
3
|
Balakrishnan M and Loomba R: The role of
noninvasive tests for differentiating NASH from NAFL and diagnosing
advanced fibrosis among patients with NAFLD. J Clin Gastroenterol.
54:107–113. 2020. View Article : Google Scholar : PubMed/NCBI
|
|
4
|
Ludwig J, Viggiano TR, McGill DB and Oh
BJ: Nonalcoholic steatohepatitis: Mayo clinic experiences with a
hitherto unnamed disease. Mayo Clin Proc. 55:434–438.
1980.PubMed/NCBI
|
|
5
|
Matteoni CA, Younossi ZM, Gramlich T,
Boparai N, Liu YC and McCullough AJ: Nonalcoholic fatty liver
disease: A spectrum of clinical and pathological severity.
Gastroenterology. 116:1413–1419. 1999. View Article : Google Scholar : PubMed/NCBI
|
|
6
|
Brunt EM, Janney CG, Di Bisceglie AM,
Neuschwander-Tetri BA and Bacon BR: Nonalcoholic steatohepatitis: A
proposal for grading and staging the histological lesions. Am J
Gastroenterol. 94:2467–2474. 1999. View Article : Google Scholar : PubMed/NCBI
|
|
7
|
Huang DQ, El-Serag HB and Loomba R: Global
epidemiology of NAFLD-related HCC: Trends, predictions, risk
factors and prevention. Nat Rev Gastroenterol Hepatol. 18:223–238.
2021. View Article : Google Scholar : PubMed/NCBI
|
|
8
|
Younossi Z, Tacke F, Arrese M, Chander
Sharma B, Mostafa I, Bugianesi E, Wai-Sun Wong V, Yilmaz Y, George
J, Fan J and Vos MB: Global perspectives on nonalcoholic fatty
liver disease and nonalcoholic steatohepatitis. Hepatology.
69:2672–2682. 2019. View Article : Google Scholar : PubMed/NCBI
|
|
9
|
Argo CK, Northup PG, Al-Osaimi AM and
Caldwell SH: Systematic review of risk factors for fibrosis
progression in non-alcoholic steatohepatitis. J Hepatol.
51:371–379. 2009. View Article : Google Scholar : PubMed/NCBI
|
|
10
|
Yatsuji S, Hashimoto E, Tobari M, Taniai
M, Tokushige K and Shiratori K: Clinical features and outcomes of
cirrhosis due to non-alcoholic steatohepatitis compared with
cirrhosis caused by chronic hepatitis C. J Gastroenterol Hepatol.
24:248–254. 2009. View Article : Google Scholar : PubMed/NCBI
|
|
11
|
Nagai K, Kohno K, Chiba M, Pak S, Murata
S, Fukunaga K, Kobayashi A, Yasue H and Ohkohchi N: Differential
expression profiles of sense and antisense transcripts between
HCV-associated hepatocellular carcinoma and corresponding
non-cancerous liver tissue. Int J Oncol. 40:1813–1820.
2012.PubMed/NCBI
|
|
12
|
Tan Y, Ge G, Pan T, Wen D and Gan J: A
pilot study of serum microRNAs panel as potential biomarkers for
diagnosis of nonalcoholic fatty liver disease. PLoS One.
9:e1051922014. View Article : Google Scholar : PubMed/NCBI
|
|
13
|
Matsumoto M, Hada N, Sakamaki Y, Uno A,
Shiga T, Tanaka C, Ito T, Katsume A and Sudoh M: An improved mouse
model that rapidly develops fibrosis in non-alcoholic
steatohepatitis. Int J Exp Pathol. 94:93–103. 2013. View Article : Google Scholar : PubMed/NCBI
|
|
14
|
Toita R and Kang JH: Long-term profile of
serological biomarkers, hepatic inflammation, and fibrosis in a
mouse model of non-alcoholic fatty liver disease. Toxicol Lett.
332:1–6. 2020. View Article : Google Scholar : PubMed/NCBI
|
|
15
|
Wang L, Jia XJ, Jiang HJ, Du Y, Yang F, Si
SY and Hong B: MicroRNAs 185, 96, and 223 repress selective
high-density lipoprotein cholesterol uptake through
posttranscriptional inhibition. Mol Cell Biol. 33:1956–1964. 2013.
View Article : Google Scholar : PubMed/NCBI
|
|
16
|
Qadir XV, Chen W, Han C, Song K, Zhang J
and Wu T: miR-223 deficiency protects against fas-induced
hepatocyte apoptosis and liver injury through targeting
insulin-like growth factor 1 receptor. Am J Pathol. 185:3141–3151.
2015. View Article : Google Scholar : PubMed/NCBI
|
|
17
|
Katsura A, Morishita A, Iwama H, Tani J,
Sakamoto T, Tatsuta M, Toyota Y, Fujita K, Kato K, Maeda E, et al:
MicroRNA profiles following metformin treatment in a mouse model of
non-alcoholic steatohepatitis. Int J Mol Med. 35:877–884. 2015.
View Article : Google Scholar : PubMed/NCBI
|
|
18
|
Kuivaniemi H and Tromp G: Type III
collagen (COL3A1): Gene and protein structure, tissue distribution,
and associated diseases. Gene. 707:151–171. 2019. View Article : Google Scholar : PubMed/NCBI
|
|
19
|
Huang Y, He Y and Li J: MicroRNA-21: A
central regulator of fibrotic diseases via various targets. Curr
Pharm Des. 21:2236–2242. 2015. View Article : Google Scholar : PubMed/NCBI
|
|
20
|
Loyer X, Paradis V, Hénique C, Vion AC,
Colnot N, Guerin CL, Devue C, On S, Scetbun J, Romain M, et al:
Liver microRNA-21 is overexpressed in non-alcoholic steatohepatitis
and contributes to the disease in experimental models by inhibiting
PPARα expression. Gut. 65:1882–1894. 2016. View Article : Google Scholar : PubMed/NCBI
|
|
21
|
Becker PP, Rau M, Schmitt J, Malsch C,
Hammer C, Bantel H, Müllhaupt B and Geier A: Performance of serum
microRNAs −122, −192 and −21 as biomarkers in patients with
non-alcoholic steatohepatitis. PLoS One. 10:e01426612015.
View Article : Google Scholar : PubMed/NCBI
|