Introduction
Liver hepatocellular carcinoma (LIHC) is the most
common primary liver cancer and represents a major global health
challenge because of its high morbidity and mortality rates
(1). Despite advances in
therapeutic strategies, the prognosis of LIHC remains poor, with
limited effective treatment options for advanced stages of the
disease (2). Therefore,
understanding the molecular mechanisms underlying LIHC progression
and identifying novel biomarkers and therapeutic targets are
critical for improving patient outcomes.
Fibrosis, a hallmark of chronic liver disease, is a
key driver of hepatocarcinogenesis (3,4).
Fibrosis is characterized by excessive extracellular matrix
deposition, which leads to liver stiffness and impaired liver
function (5). The relationship
between liver fibrosis and LIHC development has been well
documented, with fibrosis acting as a critical predisposing factor
for tumorigenesis. Chronic liver injury and inflammation drive
fibrosis, which in turn creates a microenvironment conducive to
malignant transformation and cancer progression (6,7).
Similarly, ferroptosis, a form of regulated cell death
characterized by iron-dependent lipid peroxidation, has been
increasingly recognized for its role in cancer biology (8,9).
Ferroptosis is distinct from other forms of cell death, such as
apoptosis and necrosis, and involves the accumulation of lethal
lipid peroxides due to the failure of the antioxidant defenses of
the cell (10). The iron-dependent
nature of ferroptosis makes it particularly relevant in the context
of types of cancer, where iron metabolism is often dysregulated
(11). In cancer cells, increased
iron uptake and storage can fuel rapid cell proliferation and
survival but also predispose cells to ferroptosis under certain
conditions. Targeting ferroptosis represents a promising
therapeutic strategy, as it could exploit the unique
vulnerabilities of cancer cells, particularly those resistant to
conventional treatments (12).
The calcitonin receptor (CALCR) is known to play a
role in various biological processes, including cell proliferation
and immune responses (13,14). As a member of the G protein-coupled
receptor family, which consists of numerous seven-transmembrane
cell surface receptors, CALCR is primarily responsible for
regulating and transmitting extracellular signals, thereby
activating a range of intracellular signaling pathways (15,16).
This receptor has been implicated in modulating inflammatory
responses and cellular signaling pathways that are crucial for
cancer development and progression (17). Despite these findings, the specific
role of CALCR in LIHC, particularly in the context of fibrosis and
ferroptosis, remains to be elucidated. CALCR has been shown to
exacerbate the progression of renal cell carcinoma by stabilizing
CD44 (18), suggesting a potential
role for CALCR in the tumor microenvironment that may be relevant
to the progression of LIHC. Understanding the involvement of CALCR
in the immune microenvironment, fibrosis and ferroptosis could
provide new avenues for targeted therapy in liver cancer,
particularly as CALCR is a key regulator of extracellular matrix
remodeling, a process that is critical for liver disease and
carcinogenesis.
The present study aimed to elucidate the
relationship between CALCR expression and the immune response in
LIHC via comprehensive bioinformatics analyses. By integrating data
from The Cancer Genome Atlas (TCGA; http://www.cancer.gov/) (19), the Molecular Signatures Database
(MSigDB, http://www.gsea-msigdb.org/) and
single-cell RNA sequencing data from the Tumor Immune Single Cell
Hub 2 (TISCH2) database (http://tisch.comp-genomics.org/home/), it aimed to
elucidate the molecular mechanisms and clinical implications of
CALCR in LIHC. The flowchart of the study design is shown in
Fig. S1. The findings provided
insights into the role of CALCR in LIHC progression and its
potential as a biomarker for patient stratification and therapeutic
targeting.
Materials and methods
Data collection and fibrosis-related
clustering analysis
Data for the LIHC samples were obtained from TCGA
and the Genotype-Tissue Expression (GTEx, http://www.gtexportal.org/) (20) projects and the fibrosis gene set
was obtained from the MSigDB (21). The gene expression matrix was
filtered to exclude genes with >50% zero expression values
across all samples to ensure data quality and relevance.
Additionally, samples were selected from patients with survival
times >0 days to focus on clinically meaningful outcomes. The
present study employed ConsensusClusterPlus in R (version 4.2.2; R
Core Team; http://www.R-project.org/) to
classify LIHC patients based on hepatic fibrosis-related gene
expression and identified two distinct clusters: Cluster A and
Cluster B. The optimal number of clusters was determined using the
consensus cumulative distribution function and delta area plot. An
unsupervised hierarchical clustering analysis was then conducted to
identify genes positively and negatively associated with the
clusters, which were visualized through comprehensive heatmaps that
incorporated various clinical features. Dimensionality reduction
techniques, including uniform manifold approximation and projection
(UMAP) and t-distributed stochastic neighbor embedding, were used
to visualize the distribution of gene expression between the two
clusters. A differential expression analysis between Cluster A and
Cluster B was performed using DESeq2 (https://bioconductor.org/packages/release/bioc/html/DESeq2.html),
where differentially expressed genes were defined as those with an
adjusted P-value <0.05 and an absolute log2-fold change >1.
The results are illustrated in a volcano plot.
Pathway enrichment and correlation
analyses of fibrosis-related clusters
The present study performed Gene Ontology (GO)
enrichment analysis using the ClusterProfiler package in R
(https://www.bioconductor.org/packages/release/bioc/html/clusterProfiler.html)
to explore the functional differences between Cluster A and Cluster
B. This analysis identified enriched biological processes and
molecular functions for each cluster. Additionally, Kyoto
Encyclopedia of Genes and Genomes (KEGG; http://www.genome.jp/kegg/) pathway analysis was
performed to identify significantly enriched pathways in both
clusters. The single-sample gene set enrichment analysis (ssGSEA)
algorithm was employed to quantify hallmark pathways in each
patient and a differential analysis was conducted to compare these
pathways between Cluster A and Cluster B. In addition, ssGSEA was
applied to quantify fibrosis and ferroptosis levels in patients and
a correlation analysis was performed to explore the relationships
between these scores. A differential analysis of the high- and
low-fibrosis and ferroptosis groups was performed and Venn diagrams
were constructed to identify intersecting genes between these
groups.
Prognostic analysis of CALCR
The present study performed a univariate Cox
regression analysis for all intersecting genes to evaluate their
prognostic significance. A forest plot was generated to display the
top five significant genes, with CALCR showing the smallest
P-value. The prognostic role of CALCR was further evaluated across
various types of cancer in TCGA dataset, with a focus on overall
survival (OS), the disease-free interval (DFI), disease-specific
survival (DSS) and the progression-free interval (PFI).
Additionally, another forest plot was created to depict the
prognostic significance of CALCR based on OS across different types
of cancer. In the context of LIHC, a Kaplan-Meier (KM) survival
analysis was conducted to evaluate the effects of CALCR on OS, DSS
and the PFI. A prognostic calibration curve was plotted to assess
the accuracy of the CALCR predictions against the actual outcomes.
Finally, a nomogram incorporating CALCR expression and clinical
features (T, N and M stages) was constructed to predict patient
outcomes.
Single-cell analysis of CALCR using
the TISCH2 database
The present study used the TISCH2 single-cell RNA
sequencing database to investigate the single-cell expression
profile of CALCR in LIHC. A Pearson's correlation analysis was
performed to identify genes that were highly associated with CALCR
across different LIHC datasets. Additionally, the correlation of
CALCR expression with various cell lines was analyzed within these
datasets. The distribution of cell types in each LIHC dataset and
the expression pattern of CALCR across these cell types were also
examined.
Pan-cancer differential expression and
pathway correlation analyses of CALCR
A comprehensive analysis of CALCR expression was
conducted across various types of cancer using TCGA data to
identify differential expression patterns. The ssGSEA algorithm was
employed to quantify hallmark pathway scores for patients across
these cancer types, followed by a correlation analysis using
Pearson's method to explore the correlation between CALCR
expression and these pathways. For LIHC patients, GO and KEGG
pathway analyses were conducted to identify significant pathways
and biological processes that were differentially enriched between
the high- and low-CALCR expression groups. This analysis allowed
the further investigation of the functional implications of CALCR
expression in various types of cancer and its specific role in
LIHC.
Correlation and genomic heterogeneity
analyses of CALCR
The present study performed Pearson's correlation
analyses between CALCR expression and RNA modification-related
genes in LIHC, focusing on three types of RNA modifications: m1A
(10 genes), m5C (13 genes) and m6A (21 genes). Additionally, the
associations between CALCR expression and genomic heterogeneity
features, including the tumor mutational burden (TMB),
microsatellite instability (MSI), neoantigen load (NEO) and
homologous recombination deficiency (HRD) were investigated across
multiple types of cancer, with a particular focus on LIHC. In LIHC,
the correlation between CALCR expression and these genomic features
was specifically analyzed. A mutation analysis was conducted to
compare CALCR expression in the copy number variation (CNV) loss
and CNV gain groups across different cancers, including LIHC. the
mutation landscape of CALCR in a pan-cancer context was also
examined and differentially mutated genes between the high- and
low-CALCR expression groups in LIHC assessed.
Analyses of immune cell infiltration
and the immunotherapy response related to CALCR expression in
LIHC
The ESTIMATE algorithm (https://bioinformatics.mdanderson.org/estimate/) was
applied to calculate stromal, immune and ESTIMATE scores for LIHC
patients. Correlation analyses were performed using Pearson's
method to investigate the relationships between these scores and
CALCR expression, providing insights into the interaction of the
tumor microenvironment with CALCR. Additionally, a differential
expression analysis of immune checkpoint genes between the high-
and low-CALCR expression groups was conducted, with a focus on both
inhibitory and stimulatory checkpoint genes. The Tumor Immune
Dysfunction and Exclusion (TIDE) algorithm was used and a SubMap
analysis performed to compare the potential responses of the high
and low CALCR expression groups to immune checkpoint blockade
therapy (22,23). These findings provided a
comprehensive view of the role of CALCR in modulating the immune
response and its potential as a predictor of immunotherapy
efficacy.
Experimental validation of CALCR
Expression Using the GEO and HPA Databases
The present study conducted a differential
expression analysis of CALCR using data from the Gene Expression
Omnibus (GEO, http://www.ncbi.nlm.nih.gov/geo/) and Human Protein
Atlas (HPA, http://www.proteinatlas.org/) databases to validate
the bioinformatics findings. Data for CALCR expression were
retrieved from the GEO database (GSE142987; public on September 30,
2020) to assess its differential expression in LIHC and normal
tissues. The analysis was conducted using a predefined dataset and
statistical significance was determined using a t-test and
P<0.05 was considered to indicate a statistically significant
difference. The expression levels of CALCR were further analyzed
across different tumor stages. Immunohistochemical data from the
HPA were analyzed to assess CALCR expression in both normal and
LIHC tissues. Tissue sections from a normal liver (female, age 73)
and a liver with LIHC (male, age 73) were examined for CALCR
staining intensity. The presence and localization of CALCR
expression were evaluated in both the cytoplasmic and membranous
regions, with the staining intensity categorized as negative, low,
moderate, or high. These analyses provide a comprehensive
evaluation of CALCR expression across normal and cancerous tissues,
reinforcing its potential role in tumorigenesis.
Cell culture and cell
transfection
Dulbecco's modified Eagle's medium (Gibco; Thermo
Fisher Scientific, Inc.) supplemented with 10% fetal bovine serum
(FBS; Gibco; Thermo Fisher Scientific, Inc.) was used to culture
the liver cancer cells in a moist environment at 37°C and 5%
CO2, including HepG-2 and HuH-7 cell lines, which were
obtained from the American Type Culture Collection.
Lipofectamine® 3000 (Invitrogen; Thermo Fisher
Scientific, Inc.) was used to transfect synthesized small
interfering (si)RNA (Guangzhou RiboBio Co., Ltd.). The siRNA was
dissolved in a solution with a concentration of 20 µM, and the
transfection efficiency was detected after transfection for 24 h at
37°C. The cells were successfully transfected and continued to be
cultured for 24 h before other experiments were performed. The
effectiveness of silencing was evaluated via reverse
transcription-quantitative (RT-q) PCR, with the reference gene
indicated as GAPDH. The CALCR siRNA sequences are shown in Table SI.
RNA extraction and RT-qPCR
Total RNA was extracted from liver cancer cells
(1×10⁷ cells) using TRIzol® reagent (Thermo
Fisher Scientific, Inc.) according to the manufacturer's protocols.
The purity and concentration of total RNA were determined by
measuring the absorbance values at 260 and 280 nm. Then, cDNA was
synthesized using high-capacity cDNA reverse transcription kits
(Vazyme Biotech Co., Ltd.) following the manufacturer's
instructions. Finally, SYBR Green PCR Master Mix (Vazyme Biotech
Co., Ltd.) was used to perform RT-qPCR according to the
manufacturer's protocols, with the reference gene indicated as
GAPDH. The CALCR primers used are listed in Table SII. The thermocycling conditions
were: Initial denaturation at 95°C for 10 min, followed by 40
cycles of 95°C for 15 seconds and 60°C for 1 min. The method of
quantification was based on the comparative Cq method (24). The experiments were conducted with
four biological replicates and three technical replicates.
Cell proliferation and migration
assays
After culture for 24, 48, or 72 h, 10 µl of the Cell
Counting Kit-8 (CCK-8) reagent was added to cells in the 96-well
plates and incubated for an additional 4 h in the dark. The
absorbance values were measured using an automated microplate
reader (Synergy4; BioTek, USA) at 450 nm.
For the migration assay, 5×10⁵ cells
suspended in serum-free medium were seeded in the upper chamber and
medium containing 20% FBS was added to the lower chamber. The
membranes in the chambers were fixed with 4% paraformaldehyde at
37°C for 30 min and stained with 0.1% crystal violet at 37°C after
a 24 h incubation.
For the wound healing assay, cells were seeded into
a 6-well plate and scratched with a 1 ml pipette tip after the
confluence reached 90%. The diameter of the wounds was assessed
after 24 h of treatment with 1 µg/ml mitomycin C at 37°C in
serum-free media using an inverted microscope (ICX41; SDPTOP).
ImageJ software (Version 1.54f 29 June 2023; National Institutes of
Health) was used to measure the wound widths and wound closure
rates, with images of the wounds captured at 0 and 24 h after
scratching.
Cell apoptosis assay
An Annexin V-fluorescein isothiocyanate
(FITC)/propidium iodide (PI) apoptosis kit (Multi Sciences) was
used to detect cell apoptosis. The cells were collected and rinsed
twice with cold phosphate-buffered saline, followed by staining
with 5 µl of Annexin V-FITC for 15 min and 5 µl of PI for 5 min at
37°C. Cell apoptosis was identified using a CytoFLEX-3 flow
cytometer (Beckman Coulter, USA) and the collected data were
analyzed via FlowJo software (v10.8.1; FlowJo LLC). The apoptotic
rate was calculated as the percentage of early + late apoptotic
cells.
Statistical analysis
All statistical analyses were conducted using R
software (version 4.2.2). The data from the TCGA database were
analyzed using the Mann-Whitney U test, while the data from the GEO
database were analyzed using Student's t-test. For comparisons
involving more than two groups, one-way ANOVA was applied, followed
by the Bonferroni's post hoc test to correct for multiple testing.
All P-values were adjusted using the FDR correction to account for
multiple comparisons. P<0.05 was considered to indicate a
statistically significant difference. The Kruskal-Wallis test
followed by Dunn's test was employed to evaluate the association
between clinical parameters and CALCR expression. Survival
analyses, including OS, DSS, DFI and PFI, were conducted using
Kaplan-Meier curves and significance was determined using the
log-rank test. The prognostic value of CALCR in patients with LIHC
was evaluated via univariate Cox regression analyses. The patients
were split into high and low expression groups by the median.
Finally, the correlation between CALCR expression and clinical
characteristics was evaluated using Pearson's correlation
coefficient. In cell experiments, the two-group analysis was
conducted via the one-way analysis of variance with the Student's
t-test. All experiments were independently repeated at least three
times and data are presented as the mean ± standard deviation.
Results
Identification of fibrosis-related
clusters and differentially expressed genes in LIHC
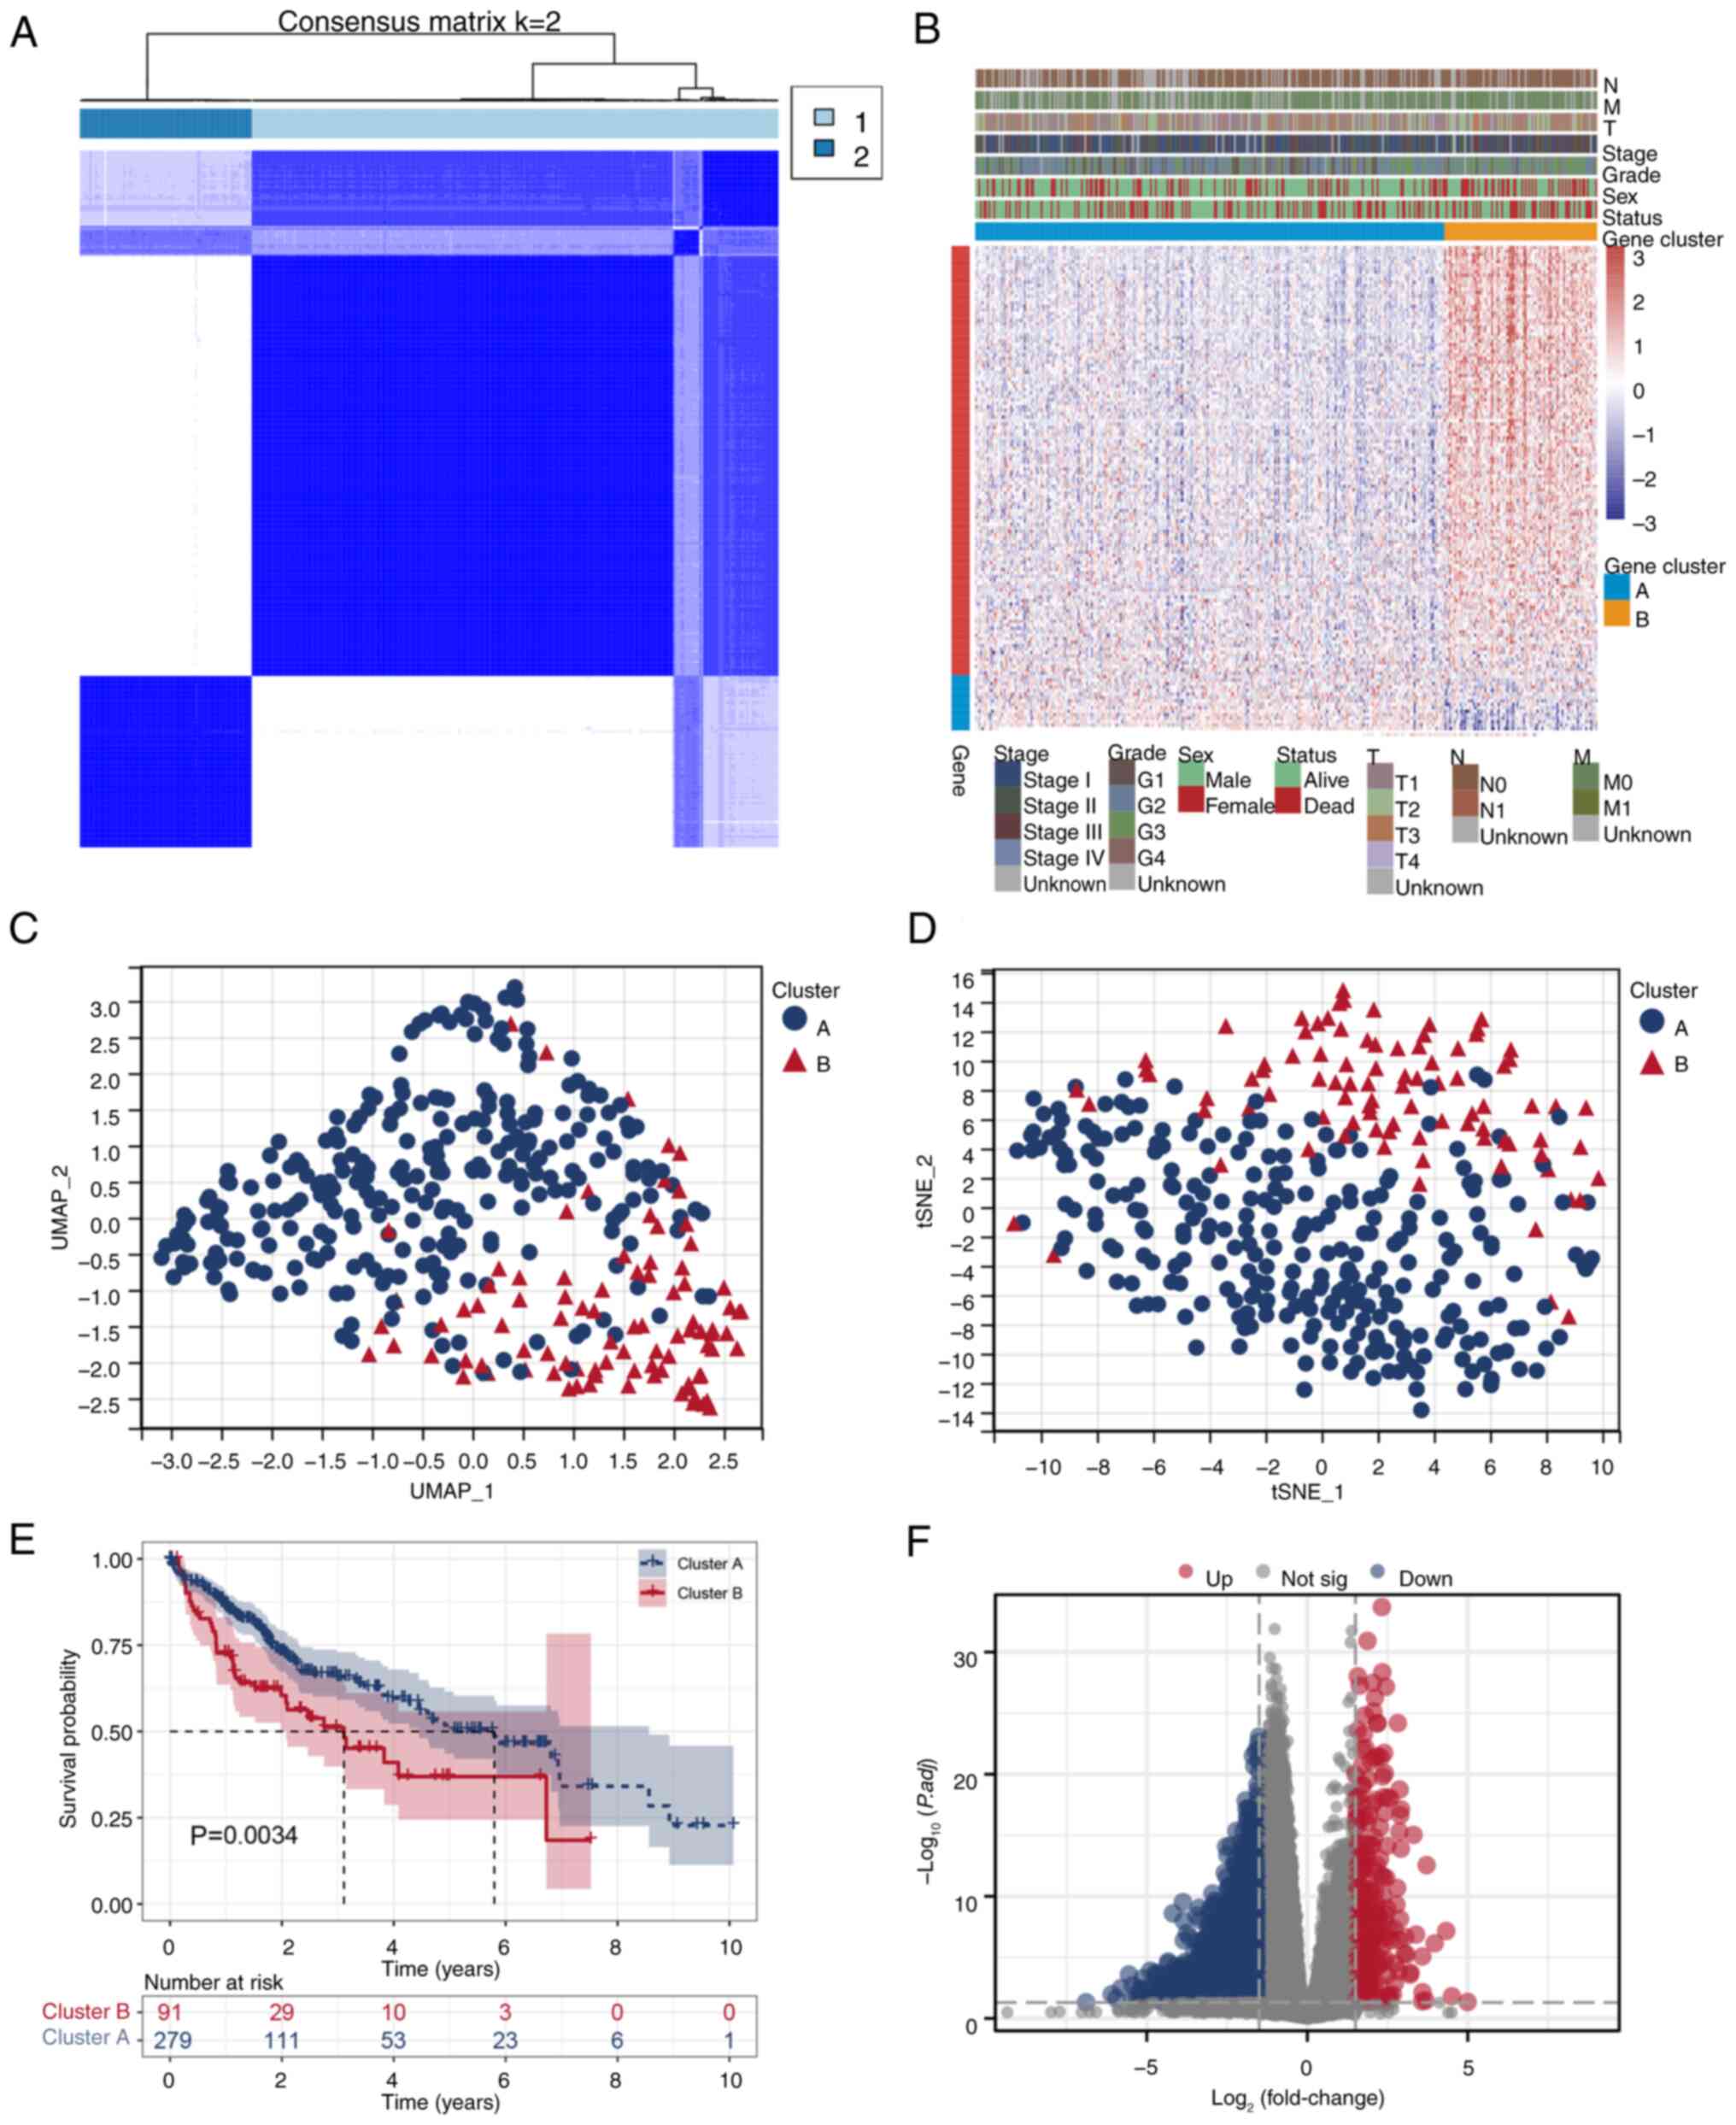
The consensus clustering analysis effectively
stratified the LIHC patients into two distinct clusters: Cluster 1
and Cluster 2 (Fig. 1A).
Unsupervised clustering and Pearson's correlation analyses revealed
a clear segregation of genes, with the results supported by the
integration of various clinical features (Fig. 1B). Visualization in UMAP and tSNE
plots revealed a pronounced separation between the clusters,
indicating significant differences in gene expression profiles
(Fig. 1C and D). The Kaplan-Meier
survival analysis indicated that patients in Cluster A had an
improved overall survival prognosis compared with those in Cluster
B (P=0.0034; Fig. 1E). A
differential expression analysis using DESeq2 identified
differentially expressed genes (DEGs) between Cluster A and Cluster
B. These DEGs were defined as those with an adjusted P-value
<0.05 and an absolute log2 fold change >1. The volcano plot
illustrates the molecular heterogeneity between the two clusters
(Fig. 1F). These findings
underscore the distinct molecular landscapes of the identified
clusters, providing a foundation for further exploration of the
biological and clinical implications of hepatic fibrosis in LIHC
patients.
Functional and pathway enrichment
analyses of fibrosis-related clusters
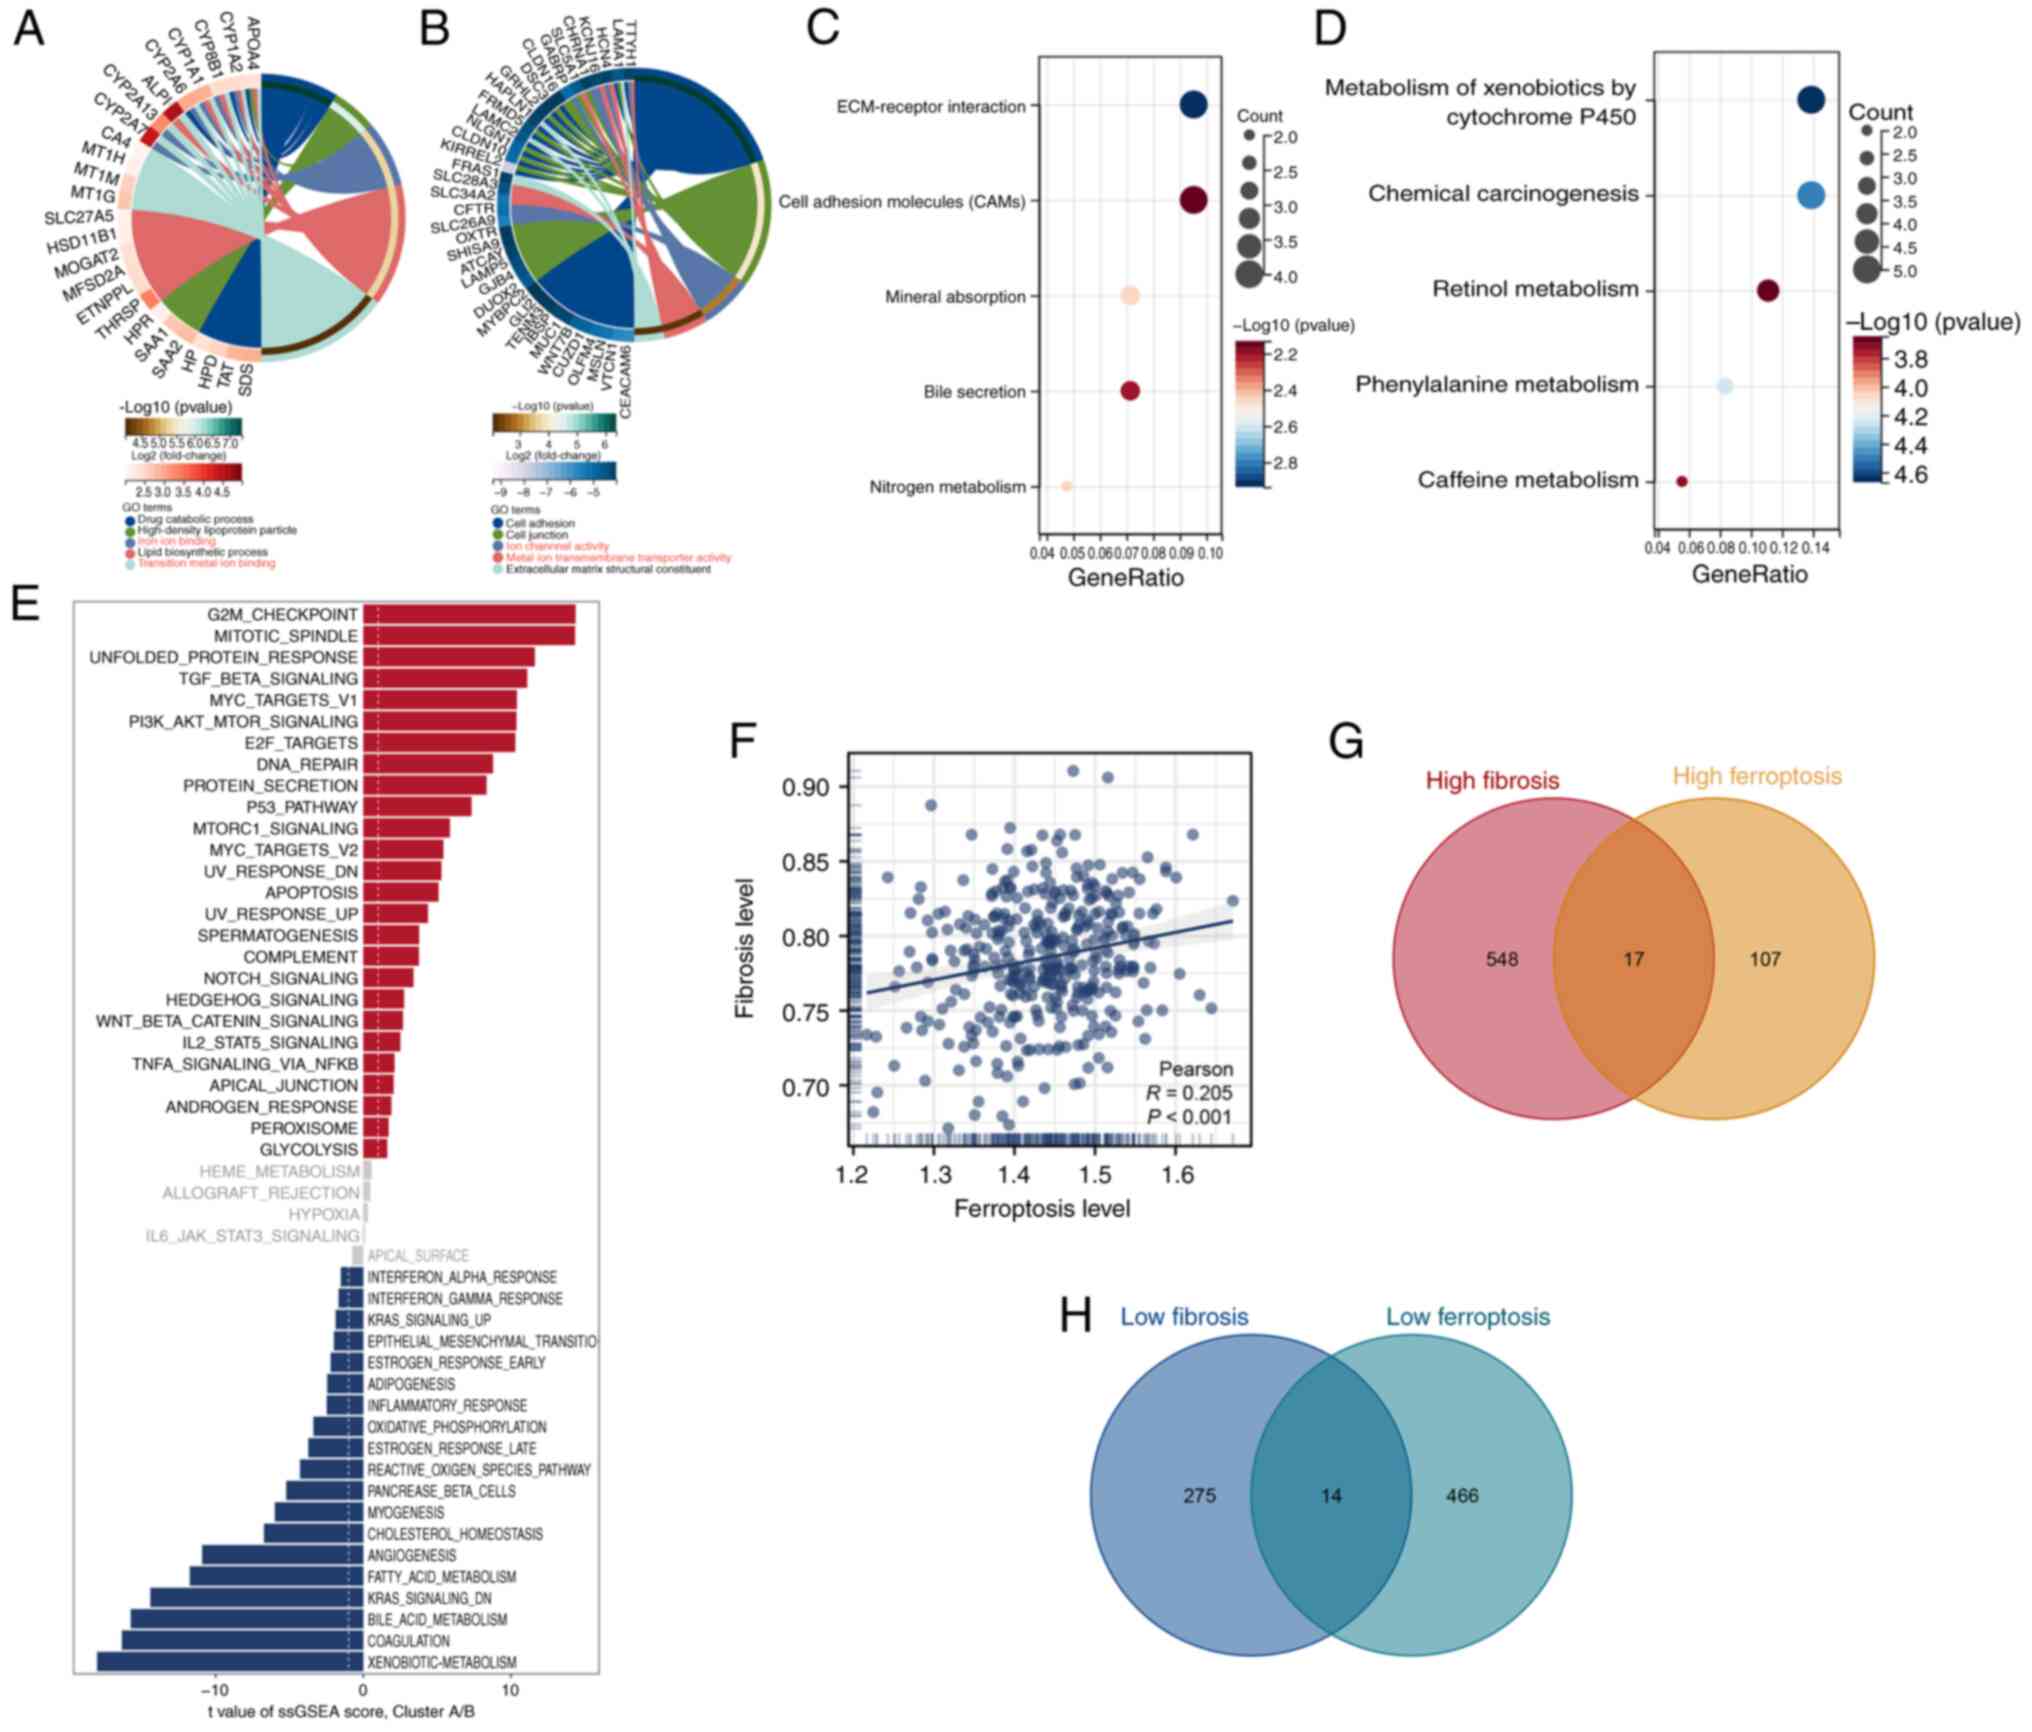
GO enrichment analysis revealed that Cluster A was
significantly enriched in pathways related to iron ion binding and
transition metal ion binding (Fig.
2A), whereas Cluster B was enriched in pathways associated with
ion channel activity and metal ion transmembrane transporter
activity (Fig. 2B). KEGG pathway
analysis identified distinct enriched pathways in both clusters
(Fig. 2C and D). The hallmark
pathway analysis using ssGSEA quantified pathway scores for each
patient and the differential analysis highlighted significant
differences between Cluster A and Cluster B (Fig. 2E). The correlation analysis of the
ssGSEA scores revealed a positive correlation between fibrosis
levels and ferroptosis levels in patients (P<0.001; Fig. 2F). Furthermore, the differential
expression analysis of the high- and low-fibrosis groups and the
high- and low-ferroptosis groups revealed intersecting genes, which
were visualized in Venn diagrams for both the
high-fibrosis/high-ferroptosis (Fig.
2G) and low-fibrosis/low-ferroptosis groups (Fig. 2H). These comprehensive analyses
underscored the intricate functional differences and correlations
within fibrosis-related clusters in LIHC patients, providing
valuable insights into the molecular foundations of these
conditions.
Prognostic significance of CALCR in
pan-cancer and LIHC samples
The univariate Cox regression analysis identified
five significant genes from the intersecting gene set, with CALCR
showing the most significant prognostic value (P=0.002; Fig. 3A). The prognostic role of CALCR was
evaluated in TCGA pan-cancer dataset, indicating its effects on OS,
DFI, DSS and PFI across multiple types of cancer (Fig. 3B). The forest plot for OS across
different cancers highlighted the significant prognostic role of
CALCR (P<0.001; Fig. 3C). The
KM survival analysis showed that high CALCR expression was
associated with shortened OS (P=0.002) and DSS (P=0.013) in LIHC
patients but not with the PFI (P=0.457; Fig. 3D). The prognostic calibration curve
for CALCR showed good alignment with the ideal curve, indicating
reliable predictive performance (Fig.
3E). A nomogram incorporating CALCR expression and clinical
features (T, N and M stages) was constructed to predict patient
outcomes, providing a practical tool for clinical prognostication
(Fig. 3F). These findings
underscored the significant prognostic value of CALCR in both
pan-cancer and LIHC contexts, highlighting its potential as a
biomarker for patient stratification and outcome predictions.
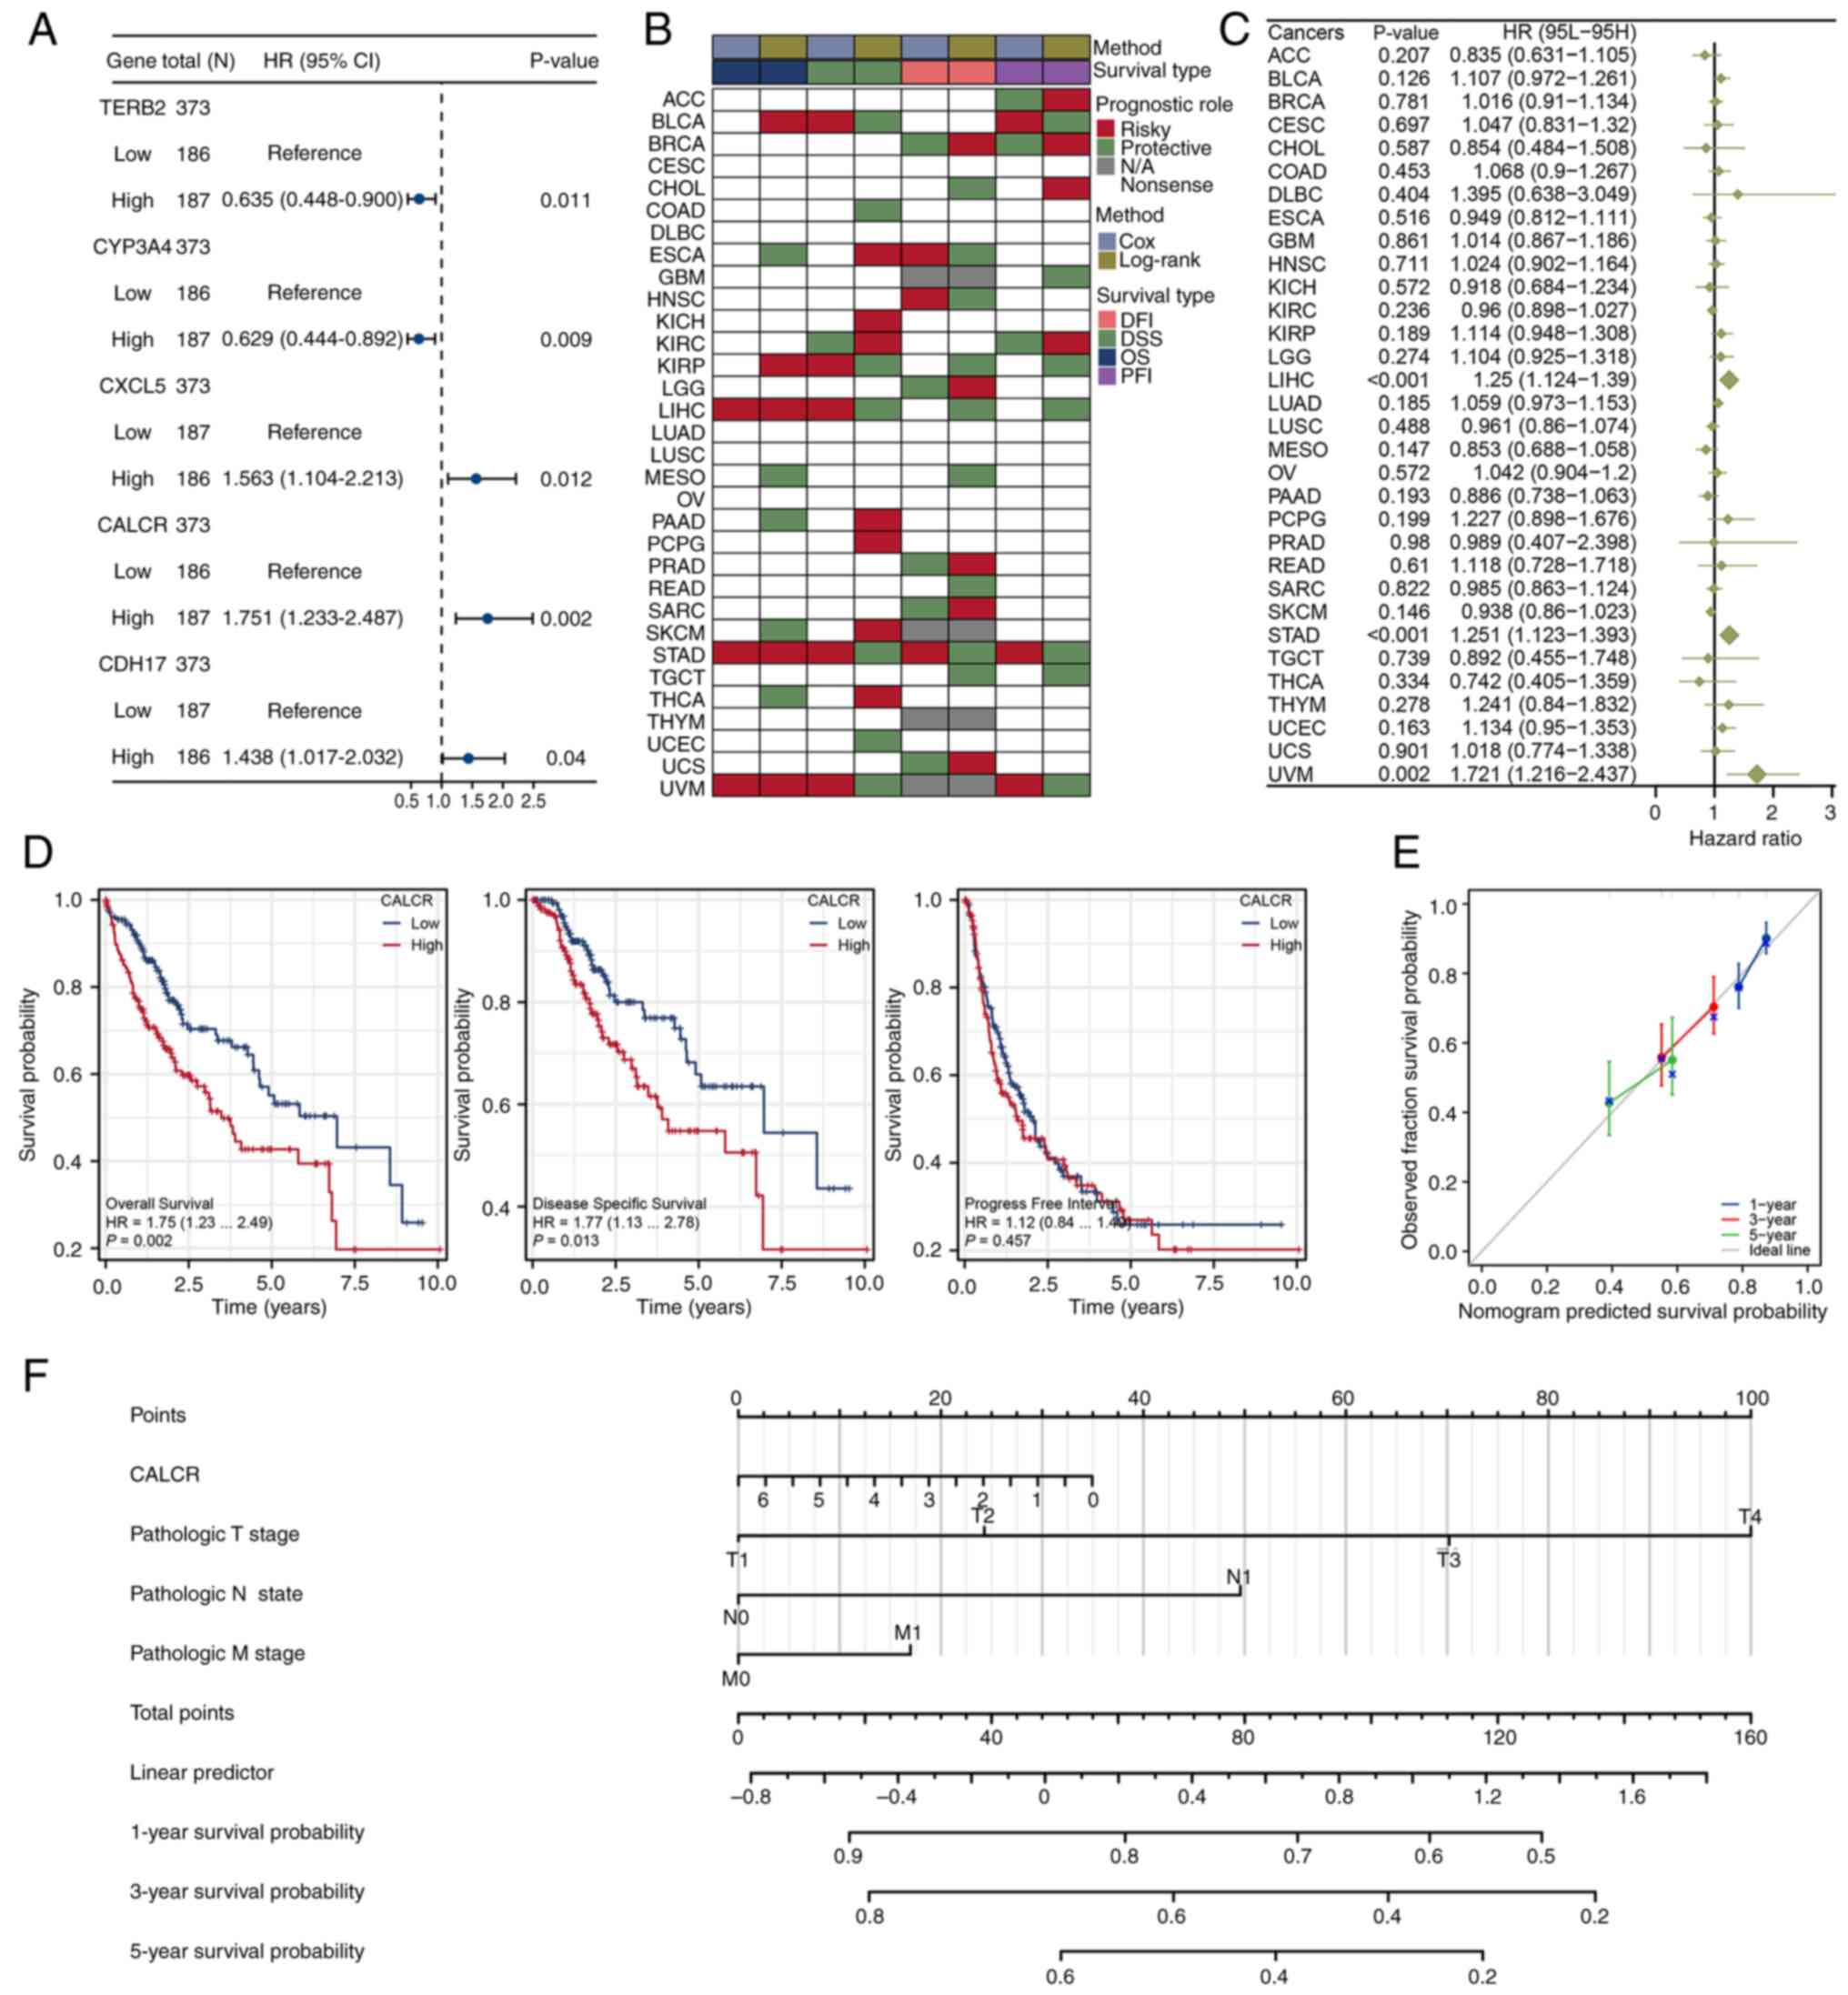 | Figure 3.Prognostic evaluation of CALCR in
pan-cancer and LIHC. (A) Forest plot from univariate Cox regression
analysis showing five significant genes, with CALCR having the
smallest P-value. (B) Prognostic eddect of CALCR in the TCGA
pan-cancer dataset, including OS, DFI, DSS and PFI. (C) Forest plot
illustrating the prognostic significance of CALCR based on OS
across different types of cancer. (D) Kaplan-Meier survival
analysis of CALCR in LIHC for OS, DSS and PFI, showing significant
associations with OS and DSS. (E) Prognostic calibration curve for
CALCR, indicating good consistency with the ideal curve. (F)
Nomogram constructed using CALCR expression and clinical features
(T, N, M stages) to predict patient outcomes. Data for the LIHC
samples were obtained from The Cancer Genome Atlas (https://www.cancer.gov/) and Genotype-Tissue
Expression (https://www.gtexportal.org/) projects and the
fibrosis gene set was obtained from Molecular Signatures Database
(https://www.gsea-msigdb.org/). CALCR,
calcitonin receptor; LIHC, liver hepatocellular carcinoma; TCGA,
The Cancer Genome Atlas; OS, overall survival; DFI, disease-free
interval; DSS, disease-specific survival; PFI, progression-free
interval; HR, hazard ratio. |
Single-cell expression profile and
correlation analysis of CALCR in LIHC
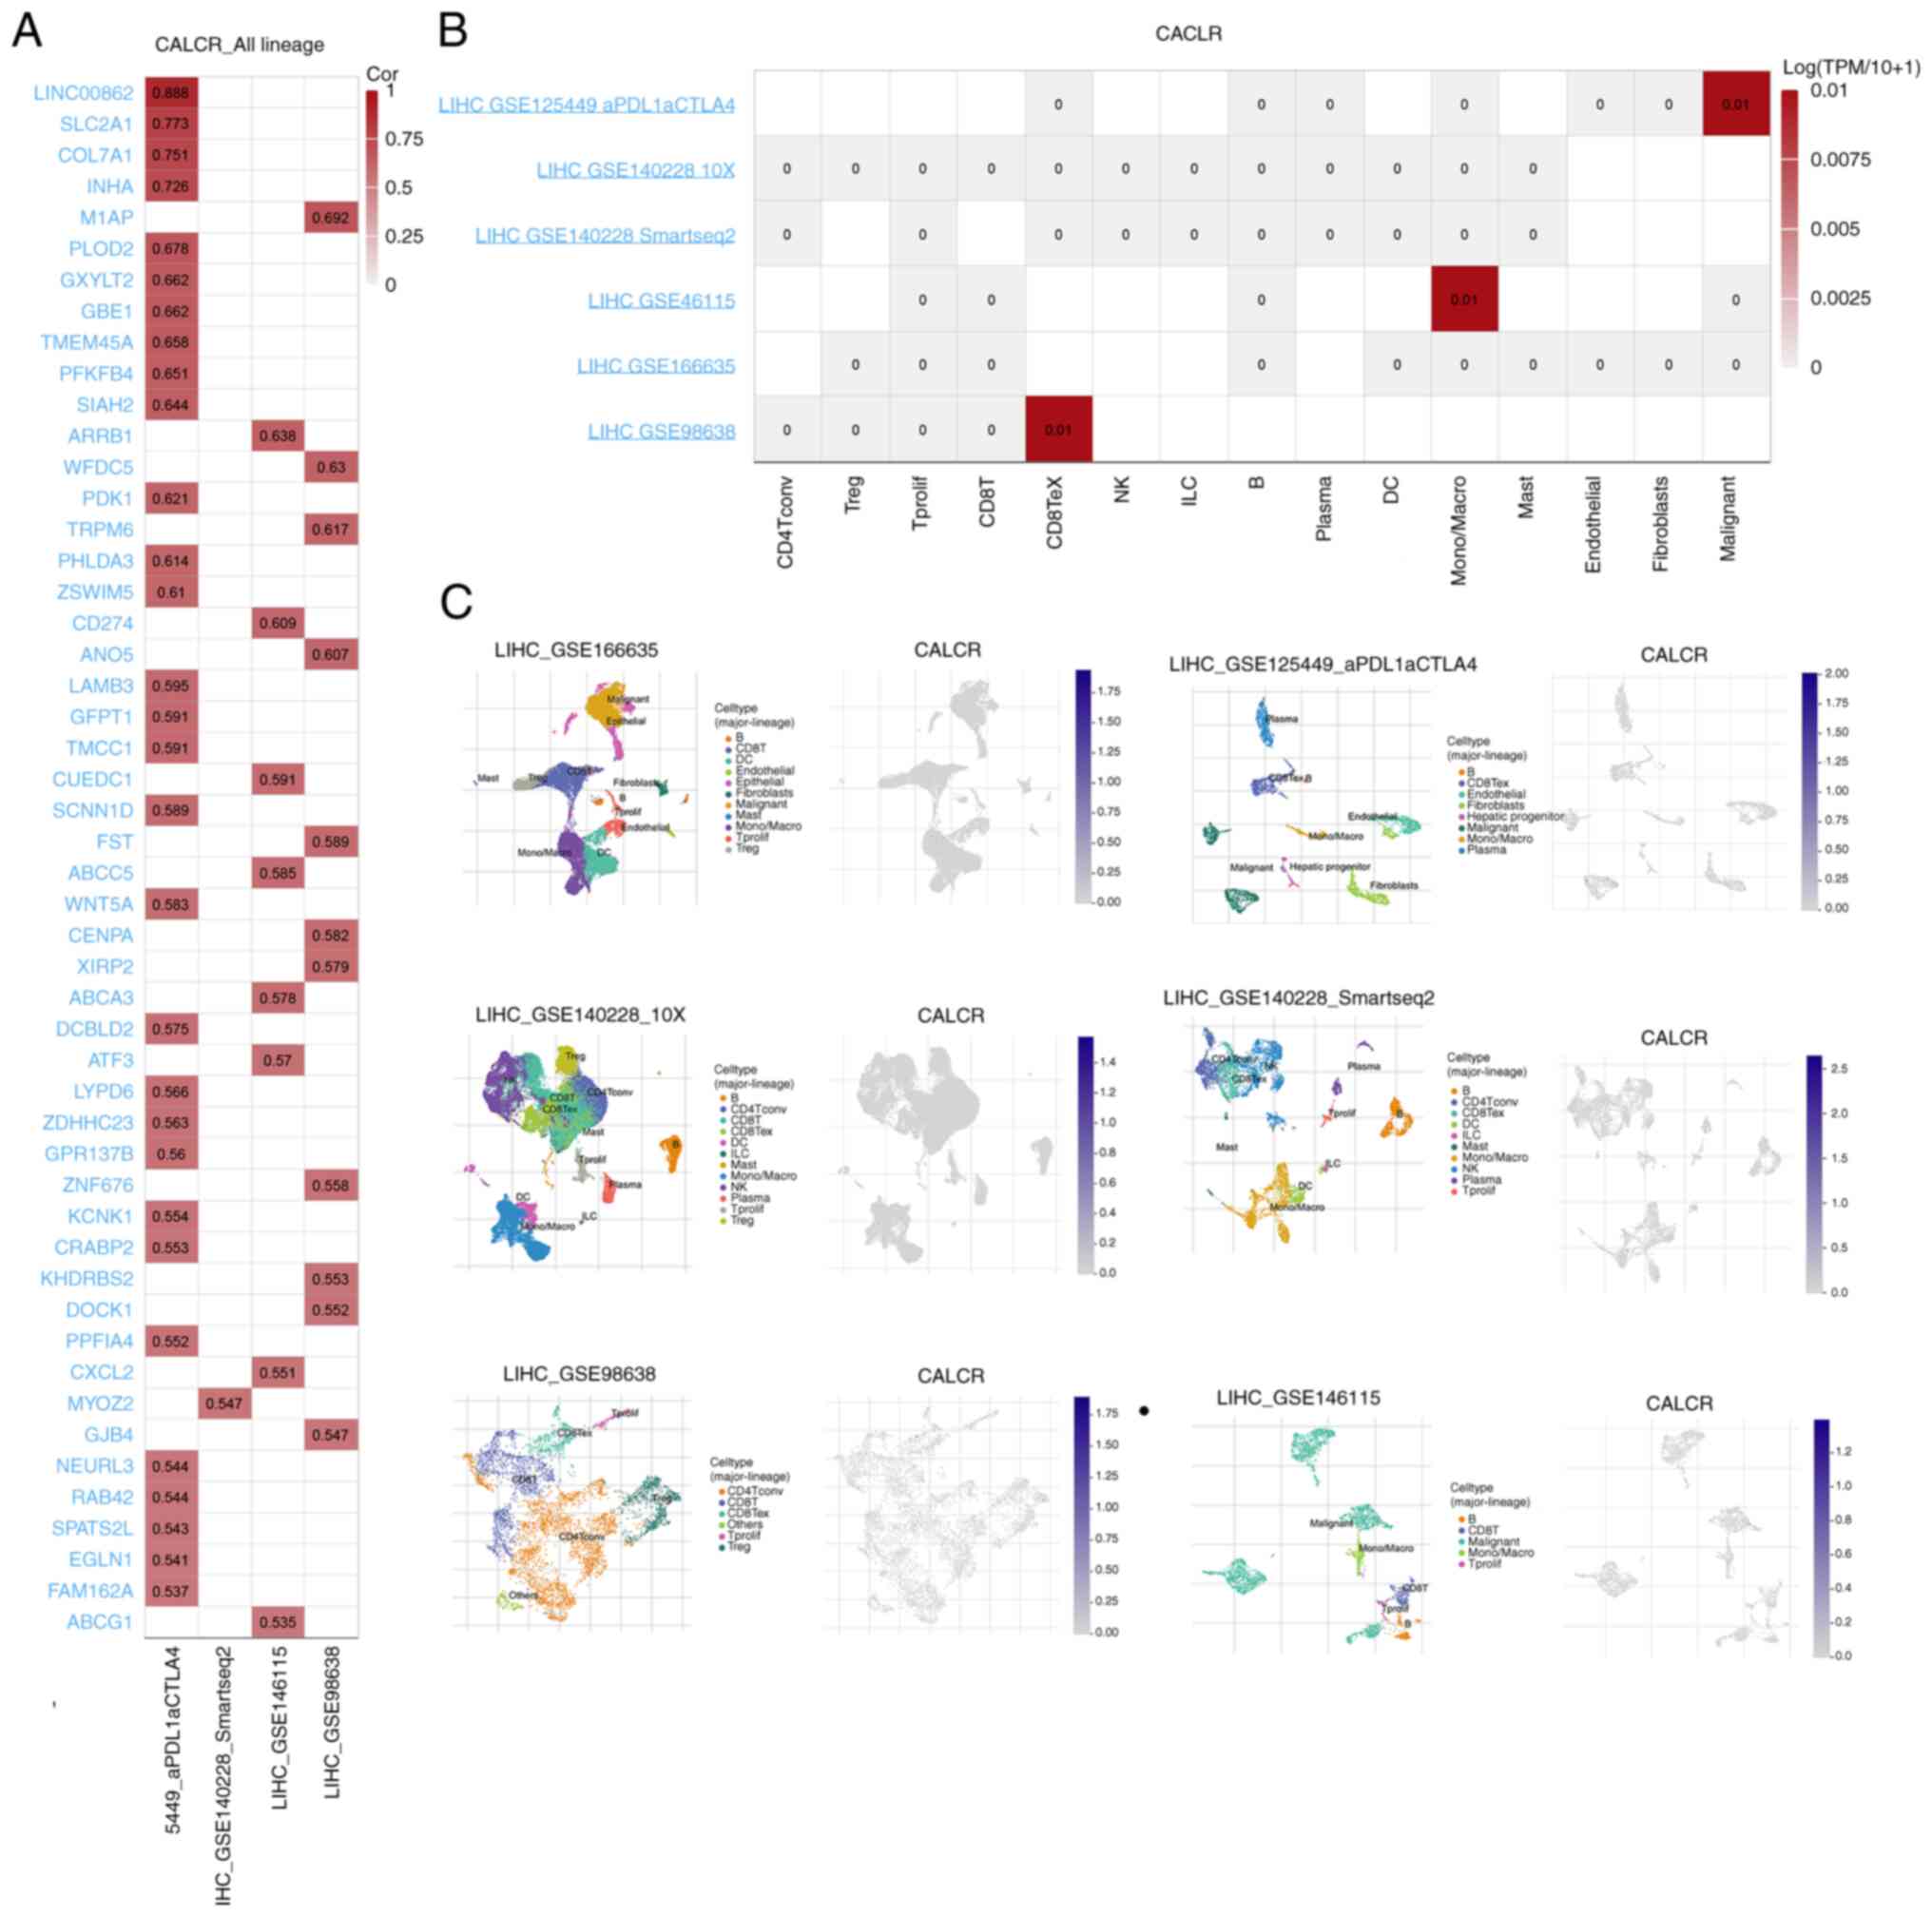
The single-cell analysis of the TISCH2 database
revealed that multiple genes were strongly associated with CALCR
across different LIHC datasets (Fig.
4A). While the correlation analysis using Pearson's method did
not reveal significant associations between CALCR expression and
various cell lines in these datasets (Fig. 4B), the distribution of cell types
in the LIHC datasets and the expression pattern of CALCR within
these cell types were visualized. This visualization revealed
distinct expression profiles across different cell populations
(Fig. 4C). These findings provided
insights into the single-cell expression landscape of CALCR in LIHC
and its potential interactions with other genes and cell types.
Differential expression and pathway
correlation analyses of CALCR in pan-cancer and LIHC Samples
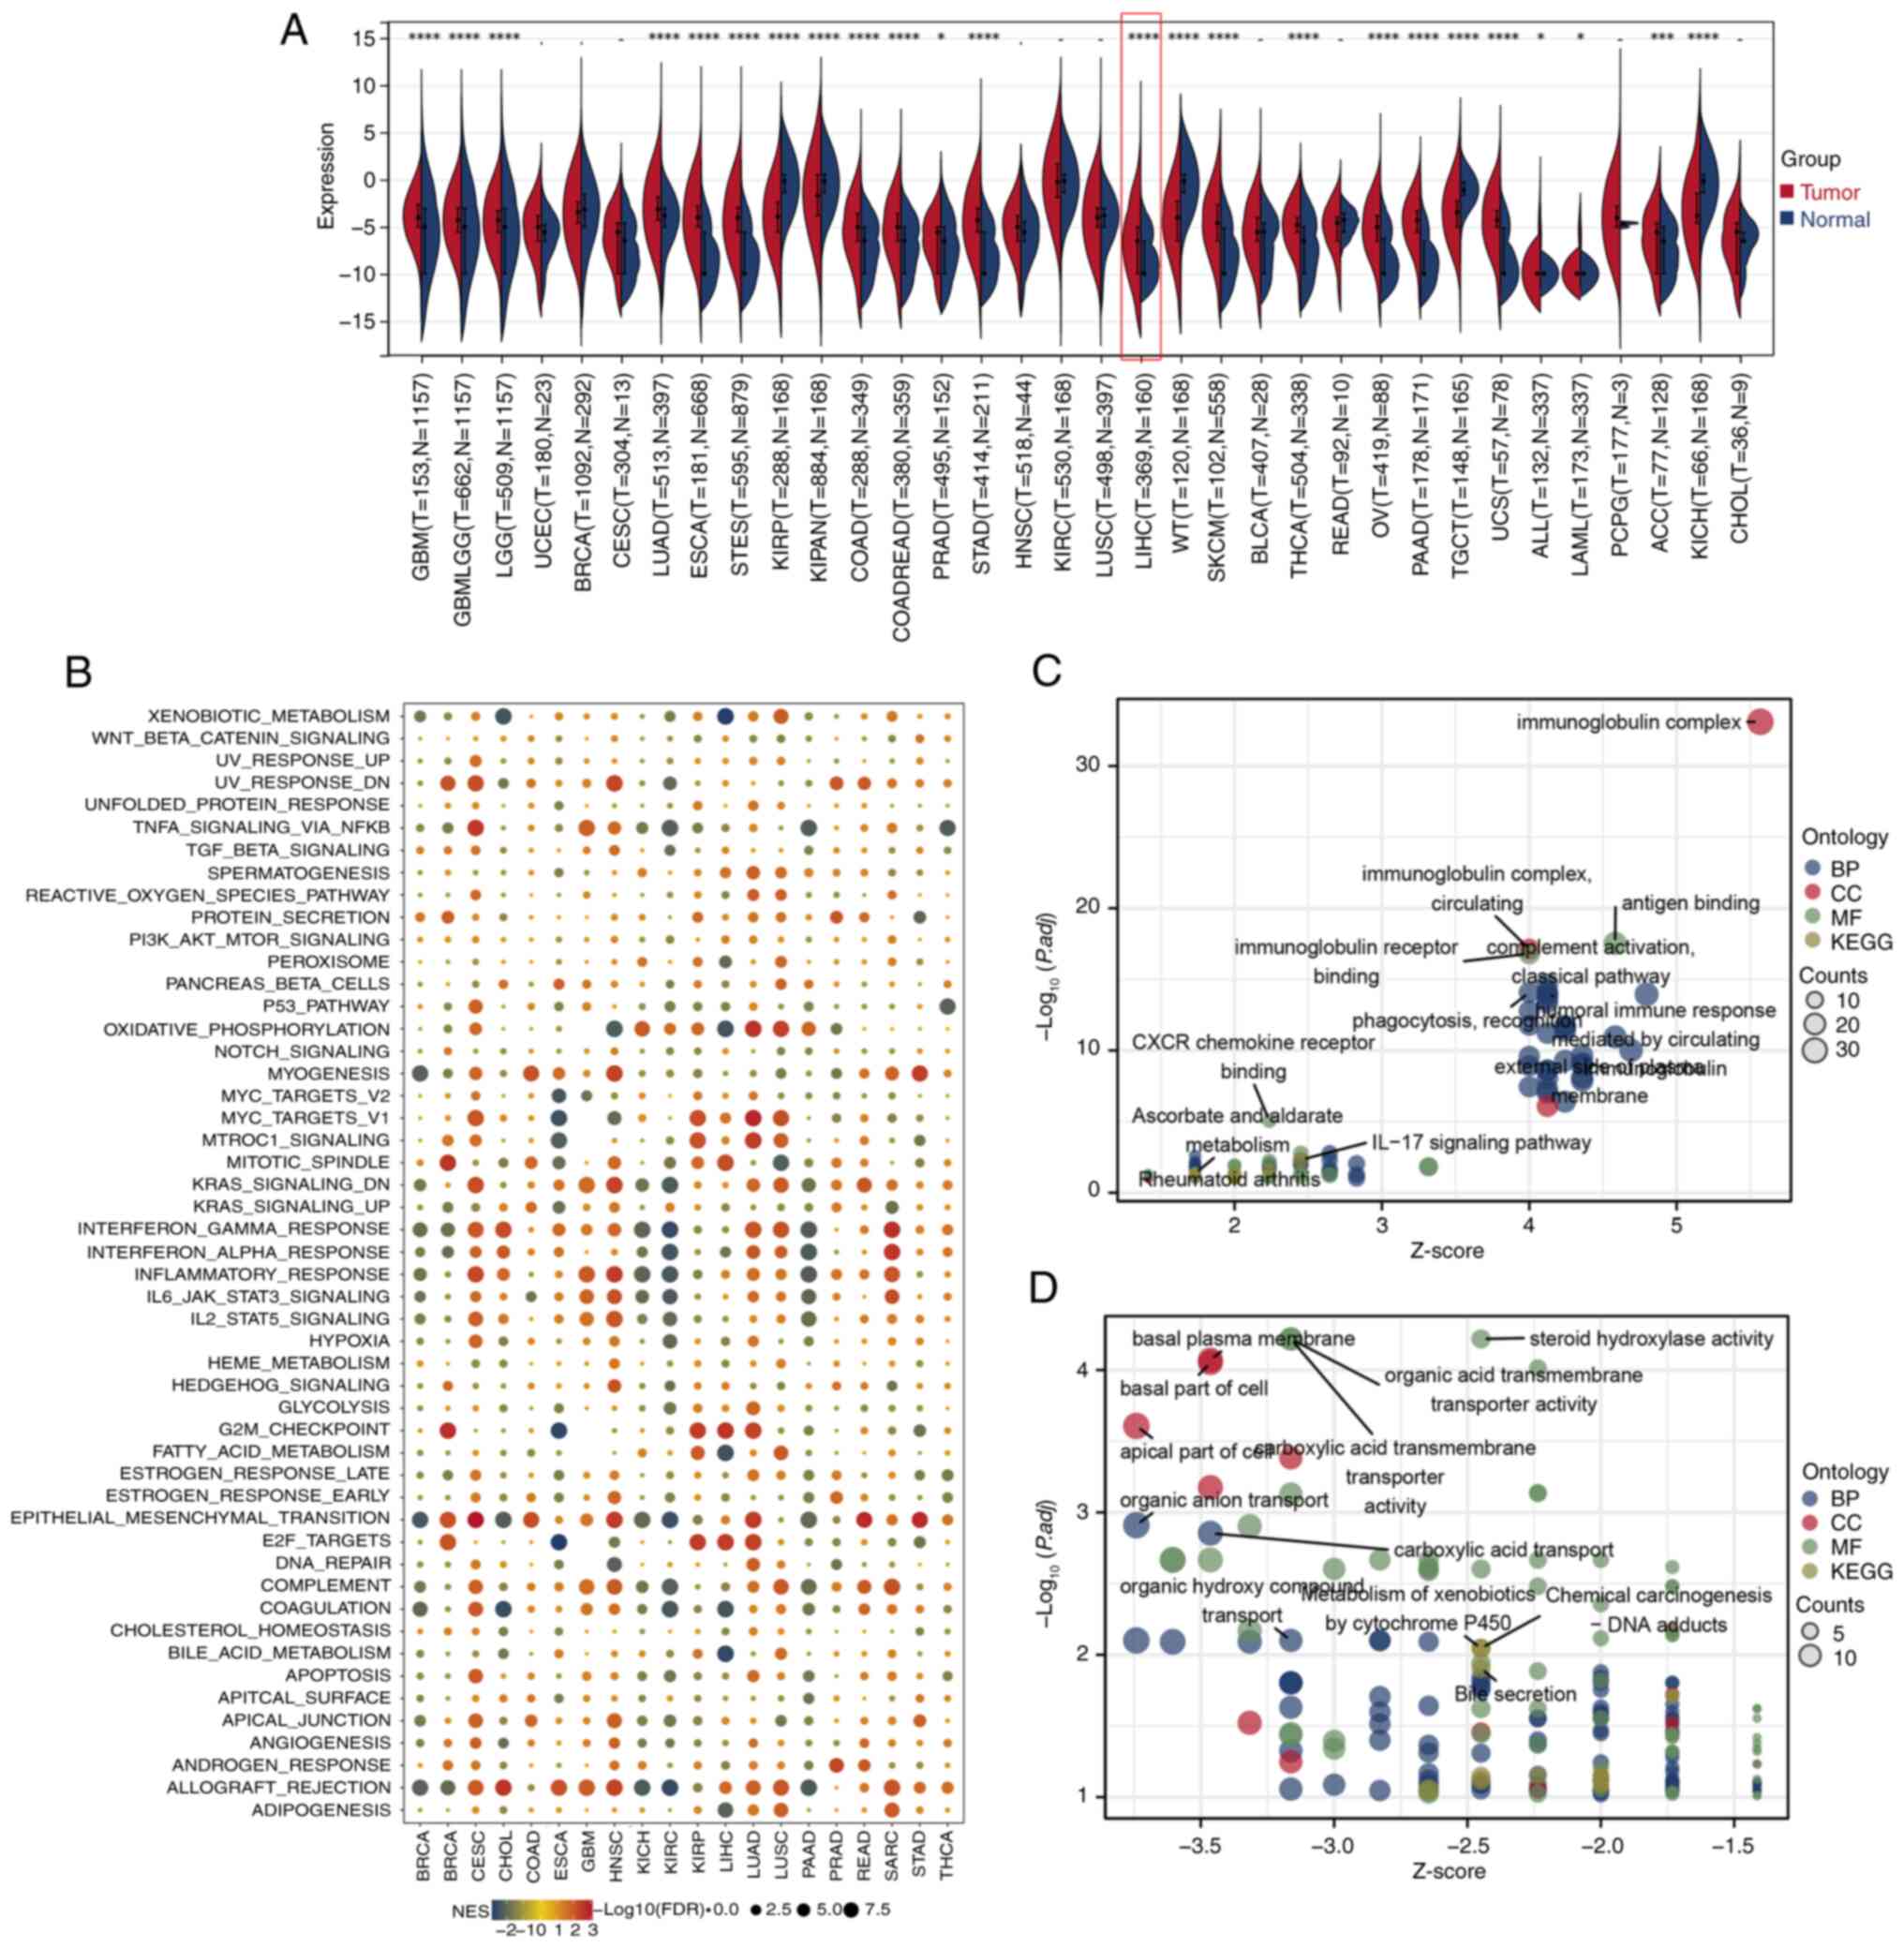
The pan-cancer differential expression analysis
revealed that CALCR was significantly differentially expressed
across a variety of cancer types, including LIHC (P<0.001;
Fig. 5A). In LIHC, a correlation
analysis based on ssGSEA pathway scores revealed that CALCR
expression was positively associated with pathways such as the G2/M
checkpoint and E2F targets, which are involved in cell cycle
regulation. By contrast, CALCR expression was negatively associated
with pathways involved in bile acid metabolism, fatty acid
metabolism and xenobiotic metabolism, which are essential for
metabolic processes (Fig. 5B).
Furthermore, GO and KEGG pathway analyses of LIHC patients revealed
significant differences in pathways and biological processes
between the high- and low-CALCR expression groups, emphasizing the
multifaceted roles of CALCR in different cellular contexts
(Fig. 5C and D). These results
provided a comprehensive overview of the involvement of CALCR in
various types of cancer, with specific functional implications in
LIHC.
Correlation and genomic heterogeneity
analyses of CALCR in pan-cancer and LIHC samples
The Pearson's correlation analysis in LIHC revealed
significant associations between CALCR expression and 44 marker
genes involved in RNA modifications, including m1A, m5C and m6A
modifications (Fig. 6A). The
genomic heterogeneity analysis demonstrated that CALCR expression
was positively associated with the TMB, MSI, NEO and HRD across
various types of cancer, with particularly strong correlations
observed in LIHC (Fig. 6B). The
mutation analysis revealed similar CALCR expression levels between
the CNV loss and CNV gain groups of LIHC patients, although
differences were noted in patients with other cancers (Fig. 6C). The mutation landscape analysis
of CALCR across various types of cancer identified specific
mutations associated with CALCR expression (Fig. 6D). In LIHC, differentially mutated
genes between the high- and low-CALCR expression groups were
visualized in a waterfall plot, highlighting distinct mutation
profiles (Fig. 6E). These analyses
reveal complex interactions between CALCR expression and various
genomic features, providing insights into its role in cancer
biology.
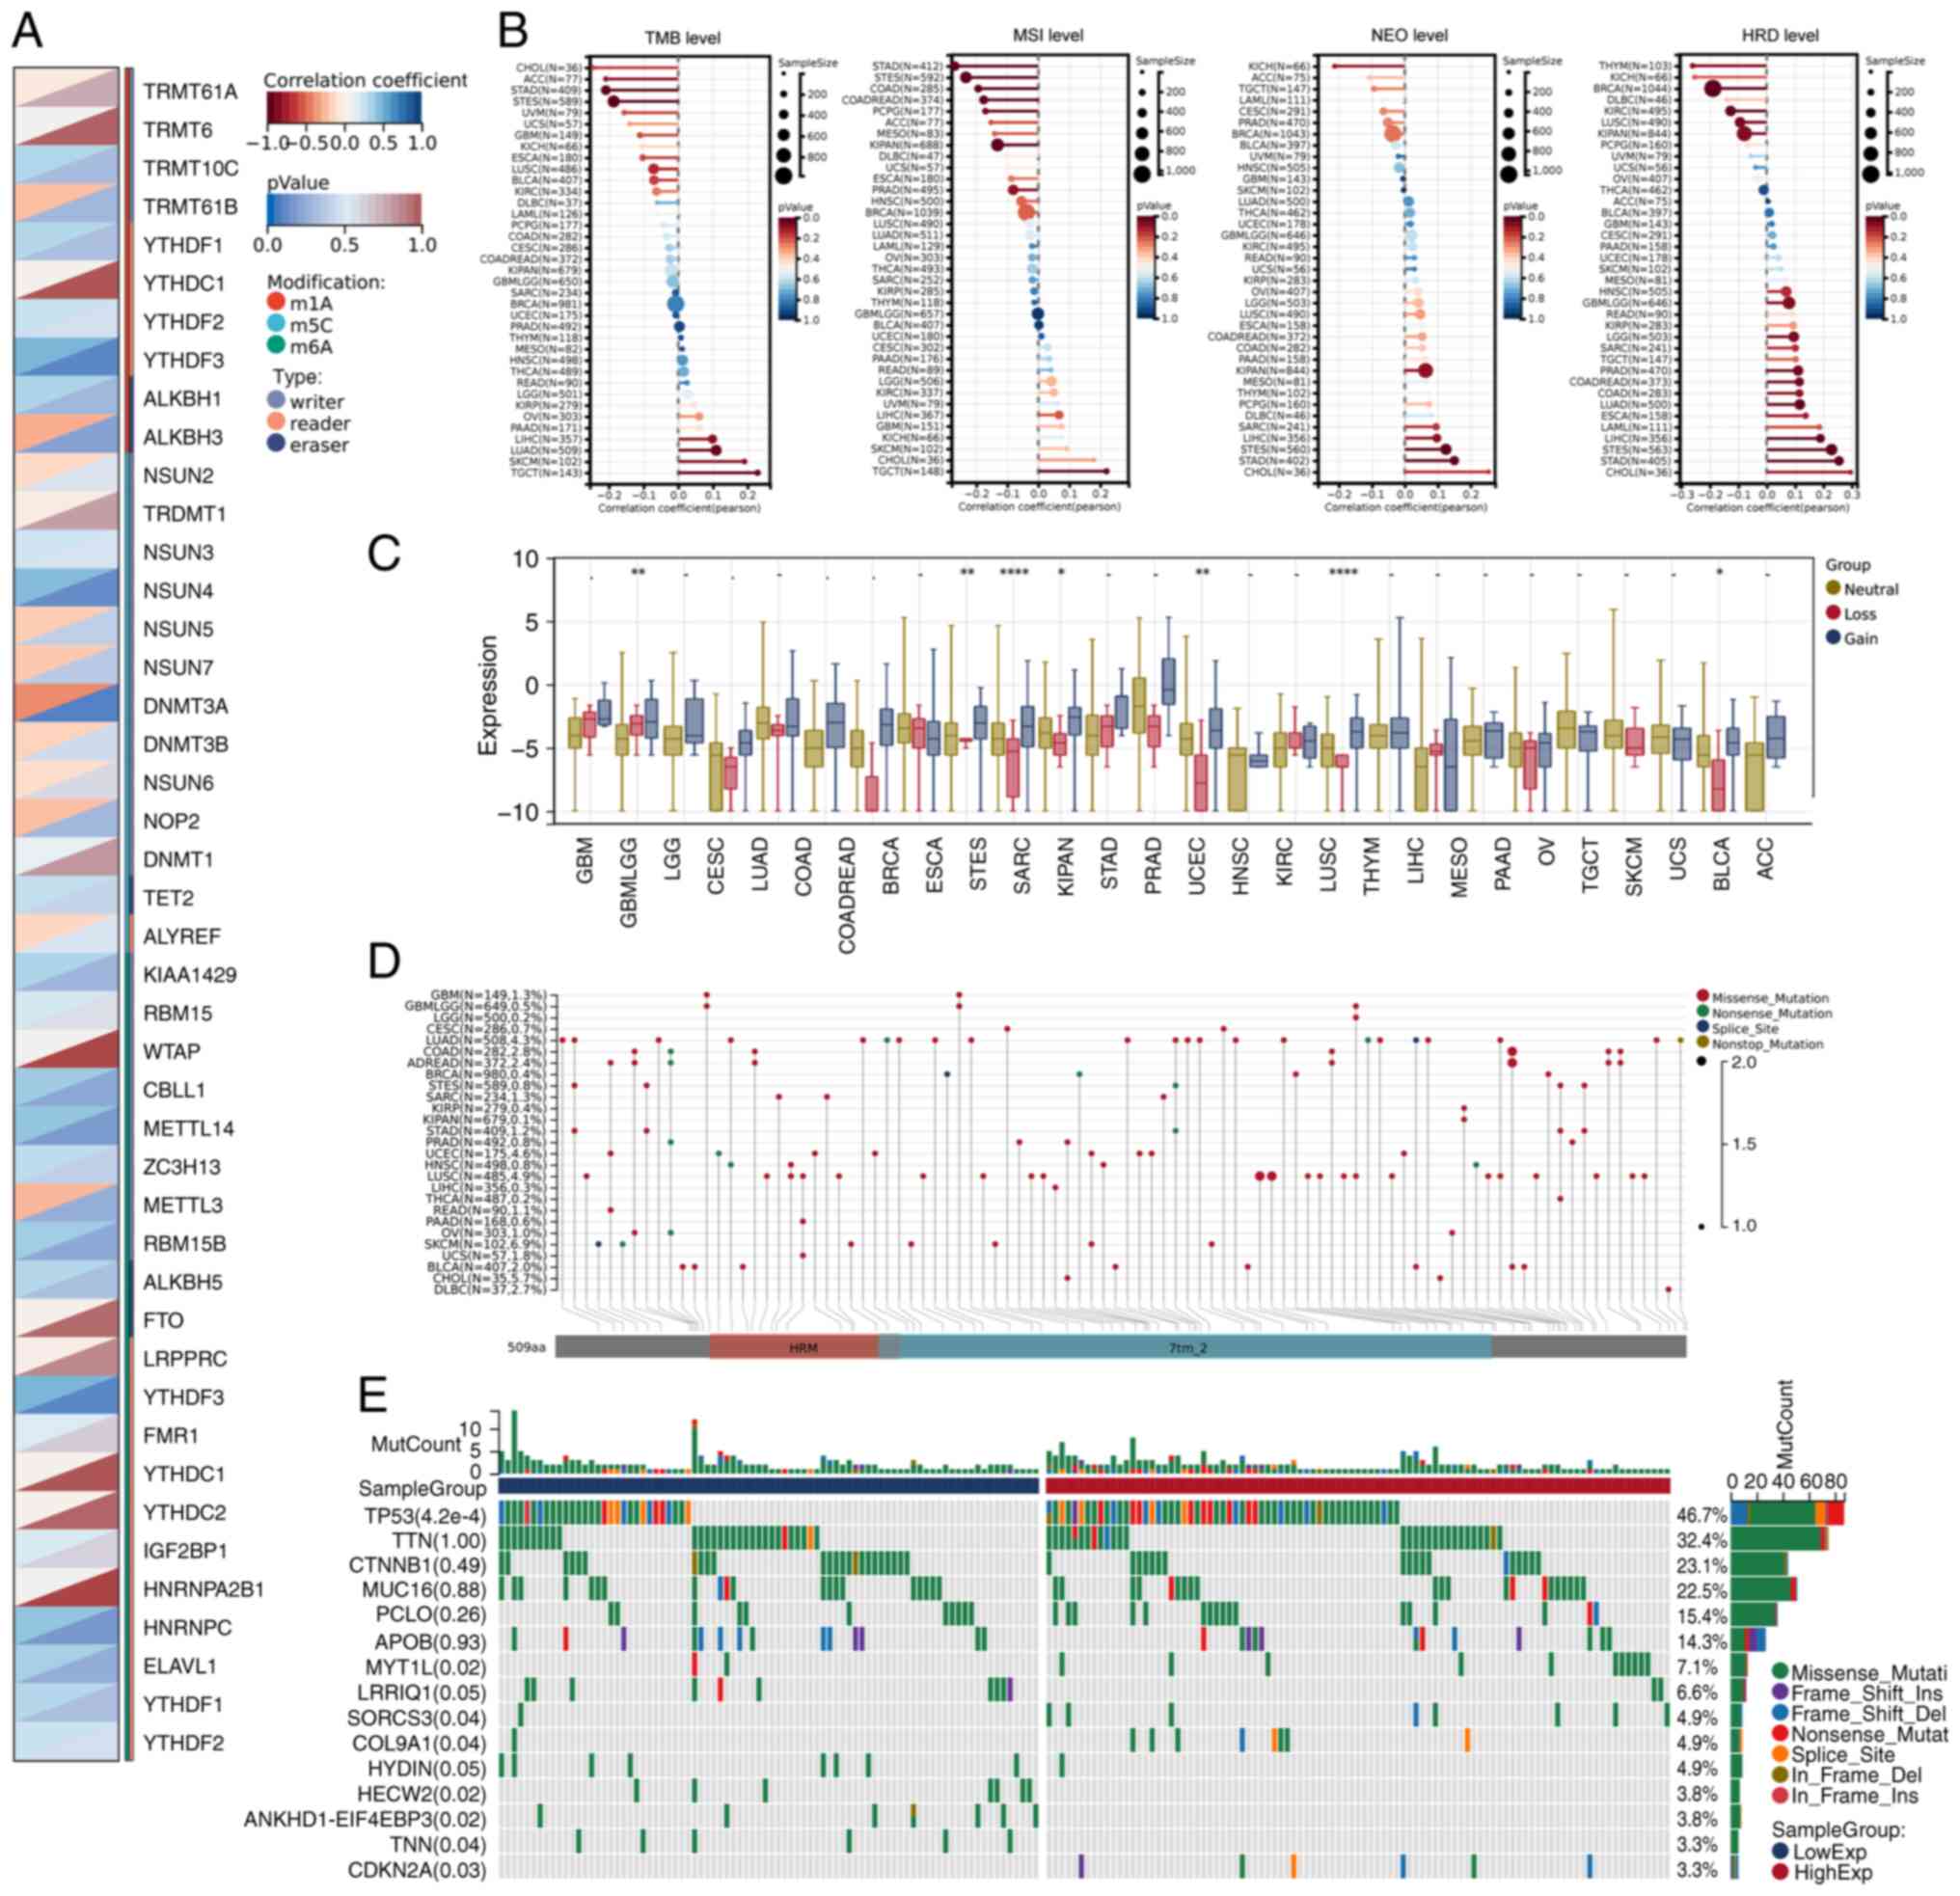 | Figure 6.Correlation and genomic heterogeneity
analyses of CALCR. (A) Correlation analysis between CALCR
expression and 44 RNA modification marker genes (m1A, m5C, m6A) in
LIHC. (B) Analysis of the correlation between CALCR expression and
genomic heterogeneity features (TMB, MSI, NEO, HRD) across various
types of cancer, with positive correlations observed in LIHC. (C)
Differential expression analysis of CALCR in CNV loss and CNV gain
clusters across various types of cancer, showing no significant
difference in LIHC. (D) Mutation landscape of CALCR in a pan-cancer
context. (E) Waterfall plot of differentially mutated genes between
high and low CALCR expression clusters in LIHC. Data for the LIHC
samples were obtained from The Cancer Genome Atlas (https://www.cancer.gov/) and Genotype-Tissue
Expression (https://www.gtexportal.org/) projects and the
fibrosis gene set was obtained from Molecular Signatures Database
(https://www.gsea-msigdb.org/).
*P<0.05, **P<0.01, ****P<0.0001. CALCR, calcitonin
receptor; LIHC, liver hepatocellular carcinoma; TMB, tumor
mutational burden; MSI, microsatellite instability; NEO, neoantigen
load; HRD, homologous recombination deficiency; CNV, copy number
variation. |
Immune cell infiltration and the
immunotherapy response linked to CALCR expression in LIHC
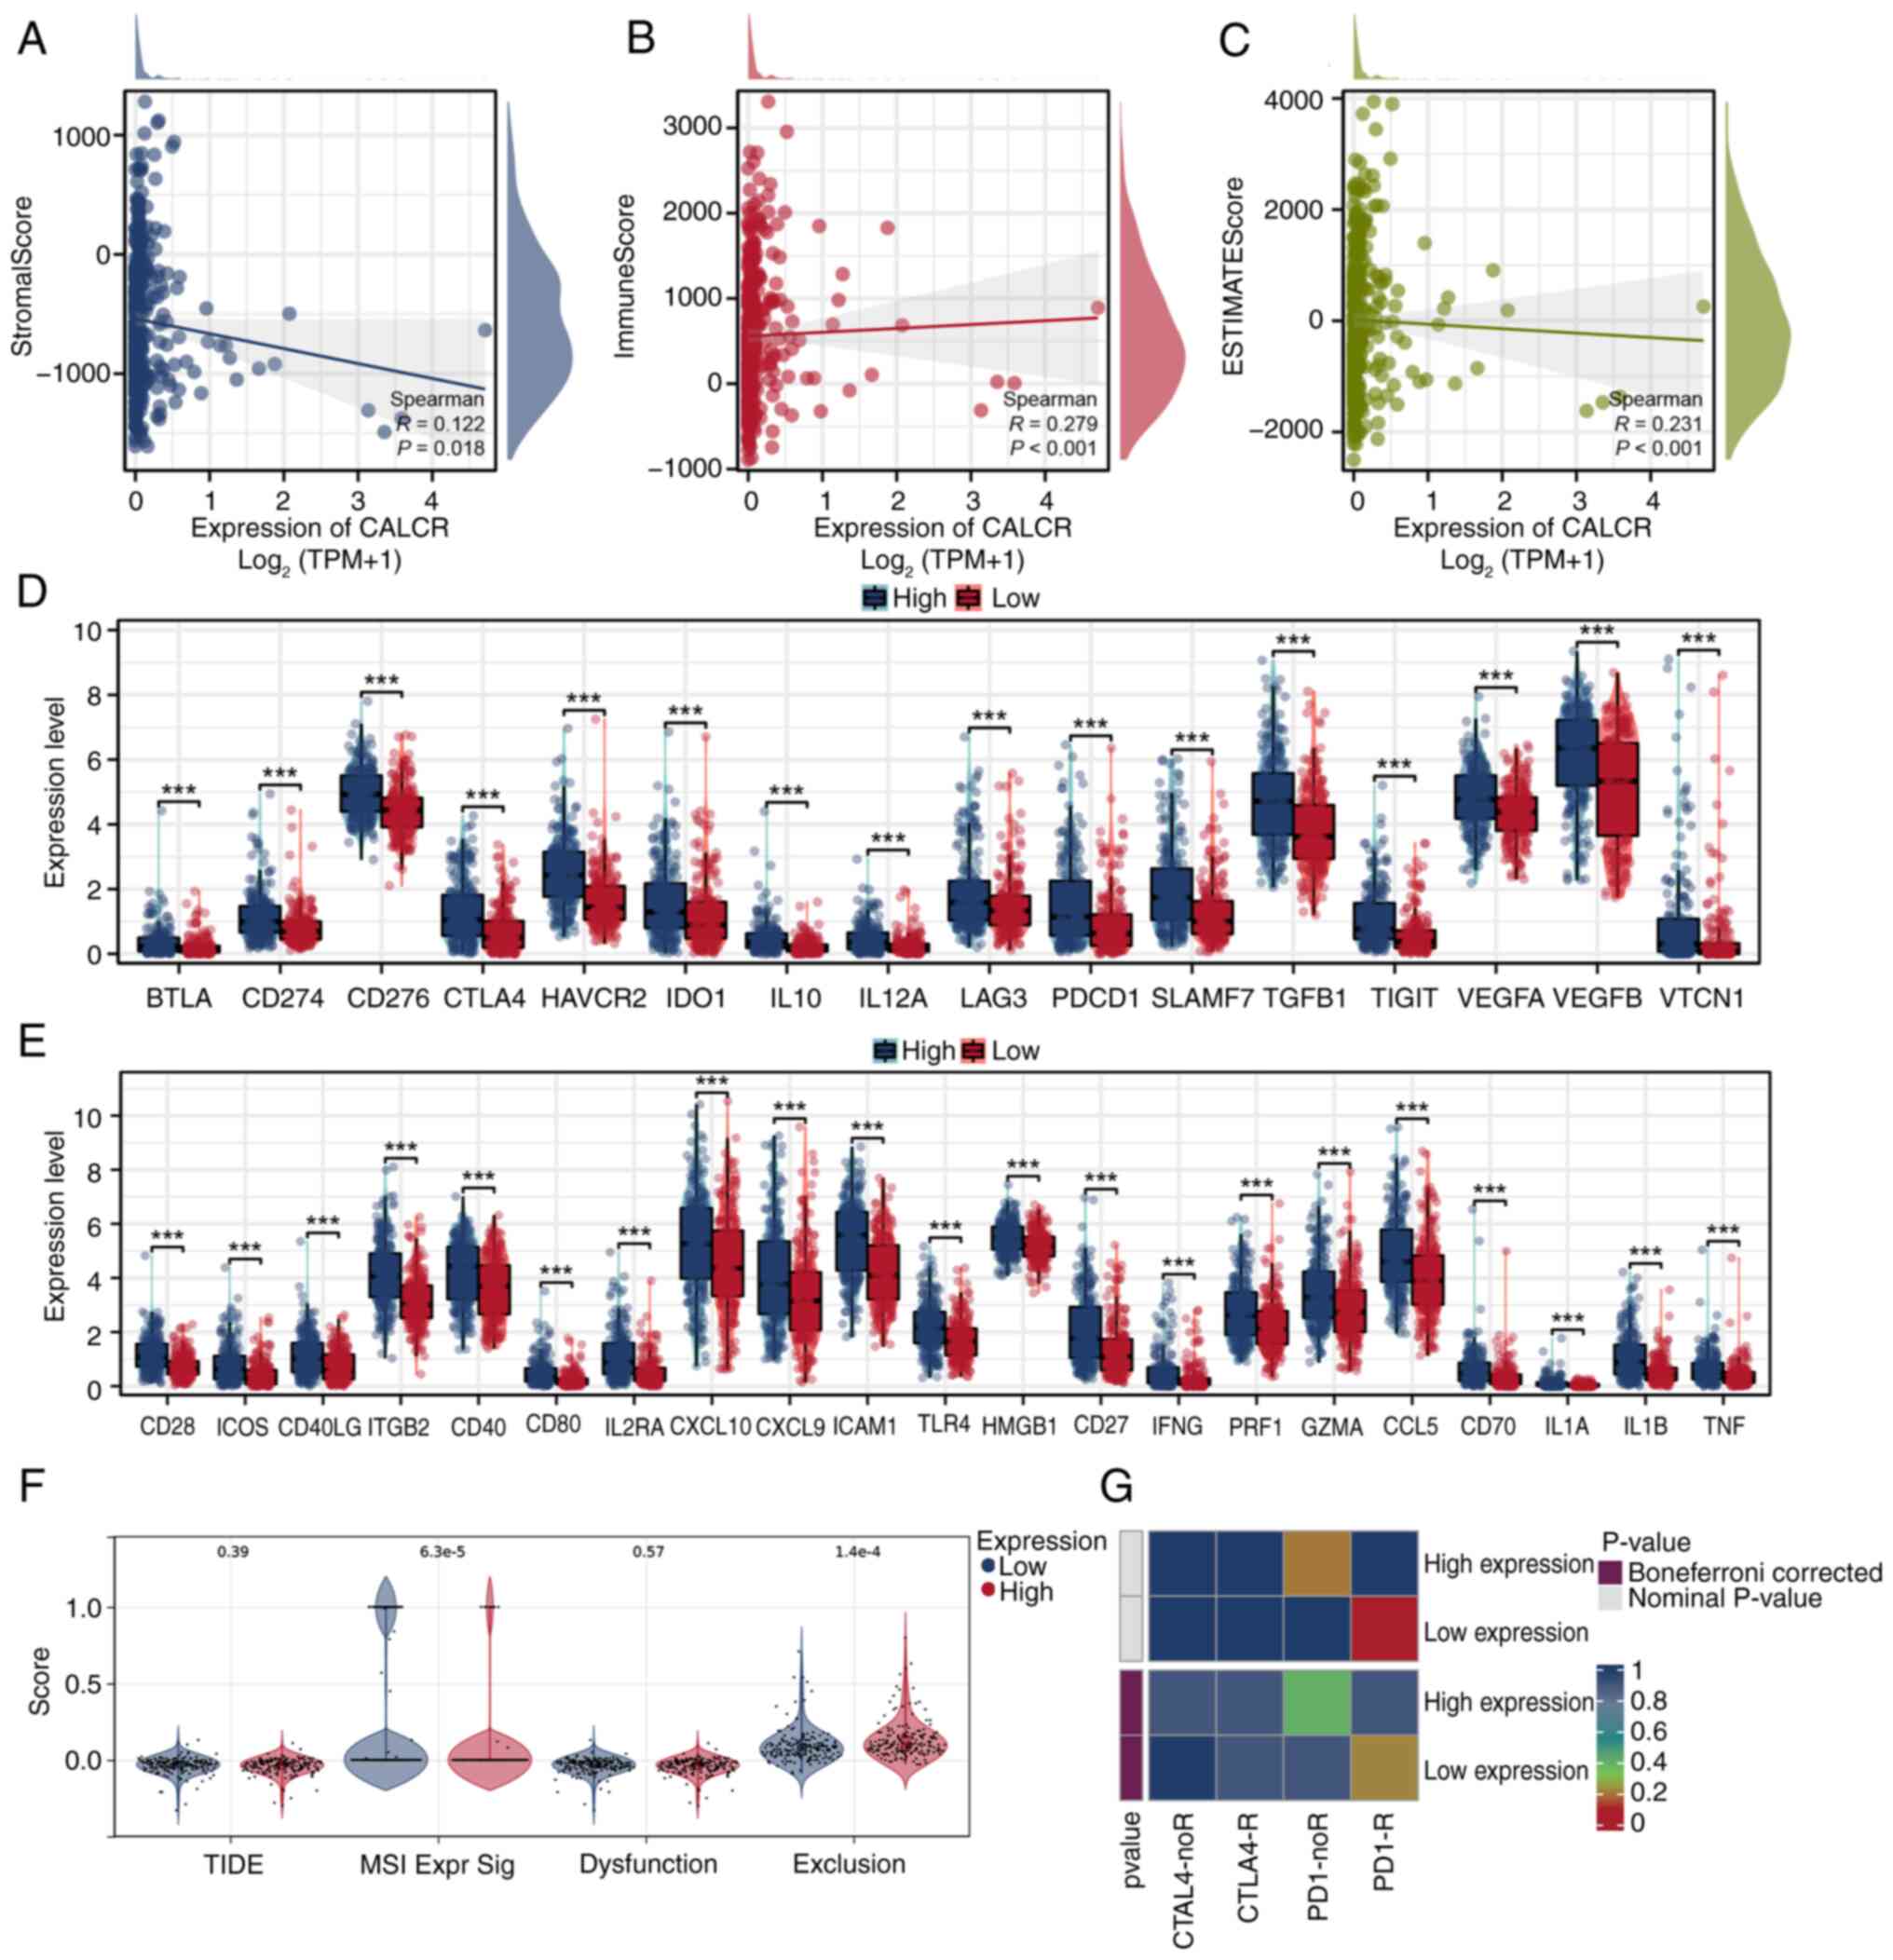
The correlation analysis using the ESTIMATE
algorithm revealed a negative correlation between ESTIMATE scores
and CALCR expression, suggesting a more complex immune cell
infiltration environment in patients with low CALCR expression
Specifically, the correlation analysis showed significant
associations, with StromalScore (P=0.018), ImmuneScore (P<0.001)
and ESTIMATEScore (P<0.001) all demonstrating negative
correlations with CALCR expression (Fig. 7A-C). The differential expression
analysis of immune checkpoint genes showed significant differences
between the high and low CALCR expression groups, with notable
variations in both inhibitory (Fig.
7D) and stimulatory (Fig. 7E)
checkpoint genes. The TIDE analysis revealed no significant
difference in overall TIDE scores between the high- and low-CALCR
expression groups; however, exclusion levels were significantly
lower in the low-CALCR expression group (Fig. 7F). The SubMap analysis indicated
that patients with low CALCR expression might exhibit an improved
response to immunotherapy (Fig.
7G). These results elucidate the complex interplay between
CALCR expression and the immune microenvironment in LIHC,
highlighting potential implications for immunotherapy efficacy.
Experimental validation of CALCR
expression in cancer and normal tissues
The present study conducted an experimental
validation of CALCR expression using data from the GEO and HPA
databases to further corroborate the bioinformatics findings. These
analyses were designed to assess the differential expression of
CALCR in cancerous and normal tissues, thereby reinforcing the role
of this gene in tumorigenesis.
First, an analysis of the GSE142987 dataset, which
included 35 liver cancer patients and 30 healthy controls, revealed
a statistically significant difference in CALCR expression between
tumor and normal tissues. Specifically, CALCR expression was
markedly elevated in tumor samples compared with normal controls
(P=0.033). These findings suggested the potential upregulation of
CALCR expression under cancerous conditions, reinforcing its
possible involvement in cancer development and progression. In the
analysis of CALCR expression across different tumor stages using
the GSE142987 dataset, significant differences were observed
between specific stages. Stage: n/a showed a statistically
significant difference in CALCR expression compared with Stage: A
(P<0.01), as did Stage: A when compared with Stage: B/C
(P<0.001). However, CALCR expression in Stage: 0 did not exhibit
a significant difference compared with other stages, with all
comparisons yielding P-values >0.05. These results highlighted
the differential expression of CALCR in later tumor stages while
suggesting minimal variation in early-stage tumors (Fig. S2A and B).
Further validation was conducted using the HPA
database, which focuses on the immunohistochemical staining of
CALCR in both normal and LIHC tissues. In normal liver tissue
(female, age 73), CALCR expression was not detected and staining
with the antibody was not observed. By contrast, in LIHC tissue
(male, age 73), CALCR expression was detected at low levels, with a
moderate staining intensity observed in <25% of the tissue that
was localized primarily in the cytoplasmic and membranous regions
(Fig. S2C-D). These results,
despite the low expression in cancerous tissues, further supported
the differential expression of CALCR between normal and cancerous
tissues, highlighting its potential relevance in the oncogenic
context.
The combined findings from the GEO and HPA analyses
provide strong evidence for the differential expression of CALCR
between normal and cancerous tissues, underscoring its importance
in liver cancer and possibly other cancer types.
CALCR increases LIHC cell
viability
In HepG-2 and HuH-7 cells, si-CALCR-2 effectively
reduced CALCR expression (Fig. 8A and
B). Compared with the si-NC group, the CCK-8 analysis revealed
that CALCR knockdown significantly affected the proliferation of
both HepG-2 and HuH-7 cells (Fig. 8C
and D). Additionally, CALCR depletion substantially inhibited
the migration of HepG-2 and HuH-7 cells, as demonstrated by
Transwell migration (magnification, ×200; scale bar, 100 µm) and
wound healing (magnification, ×100; scale bar, 120 µm) assays
(Fig. 8E-H). According to the flow
cytometry findings, CALCR markedly reduced apoptosis in LIHC cells
(Fig. 8I).
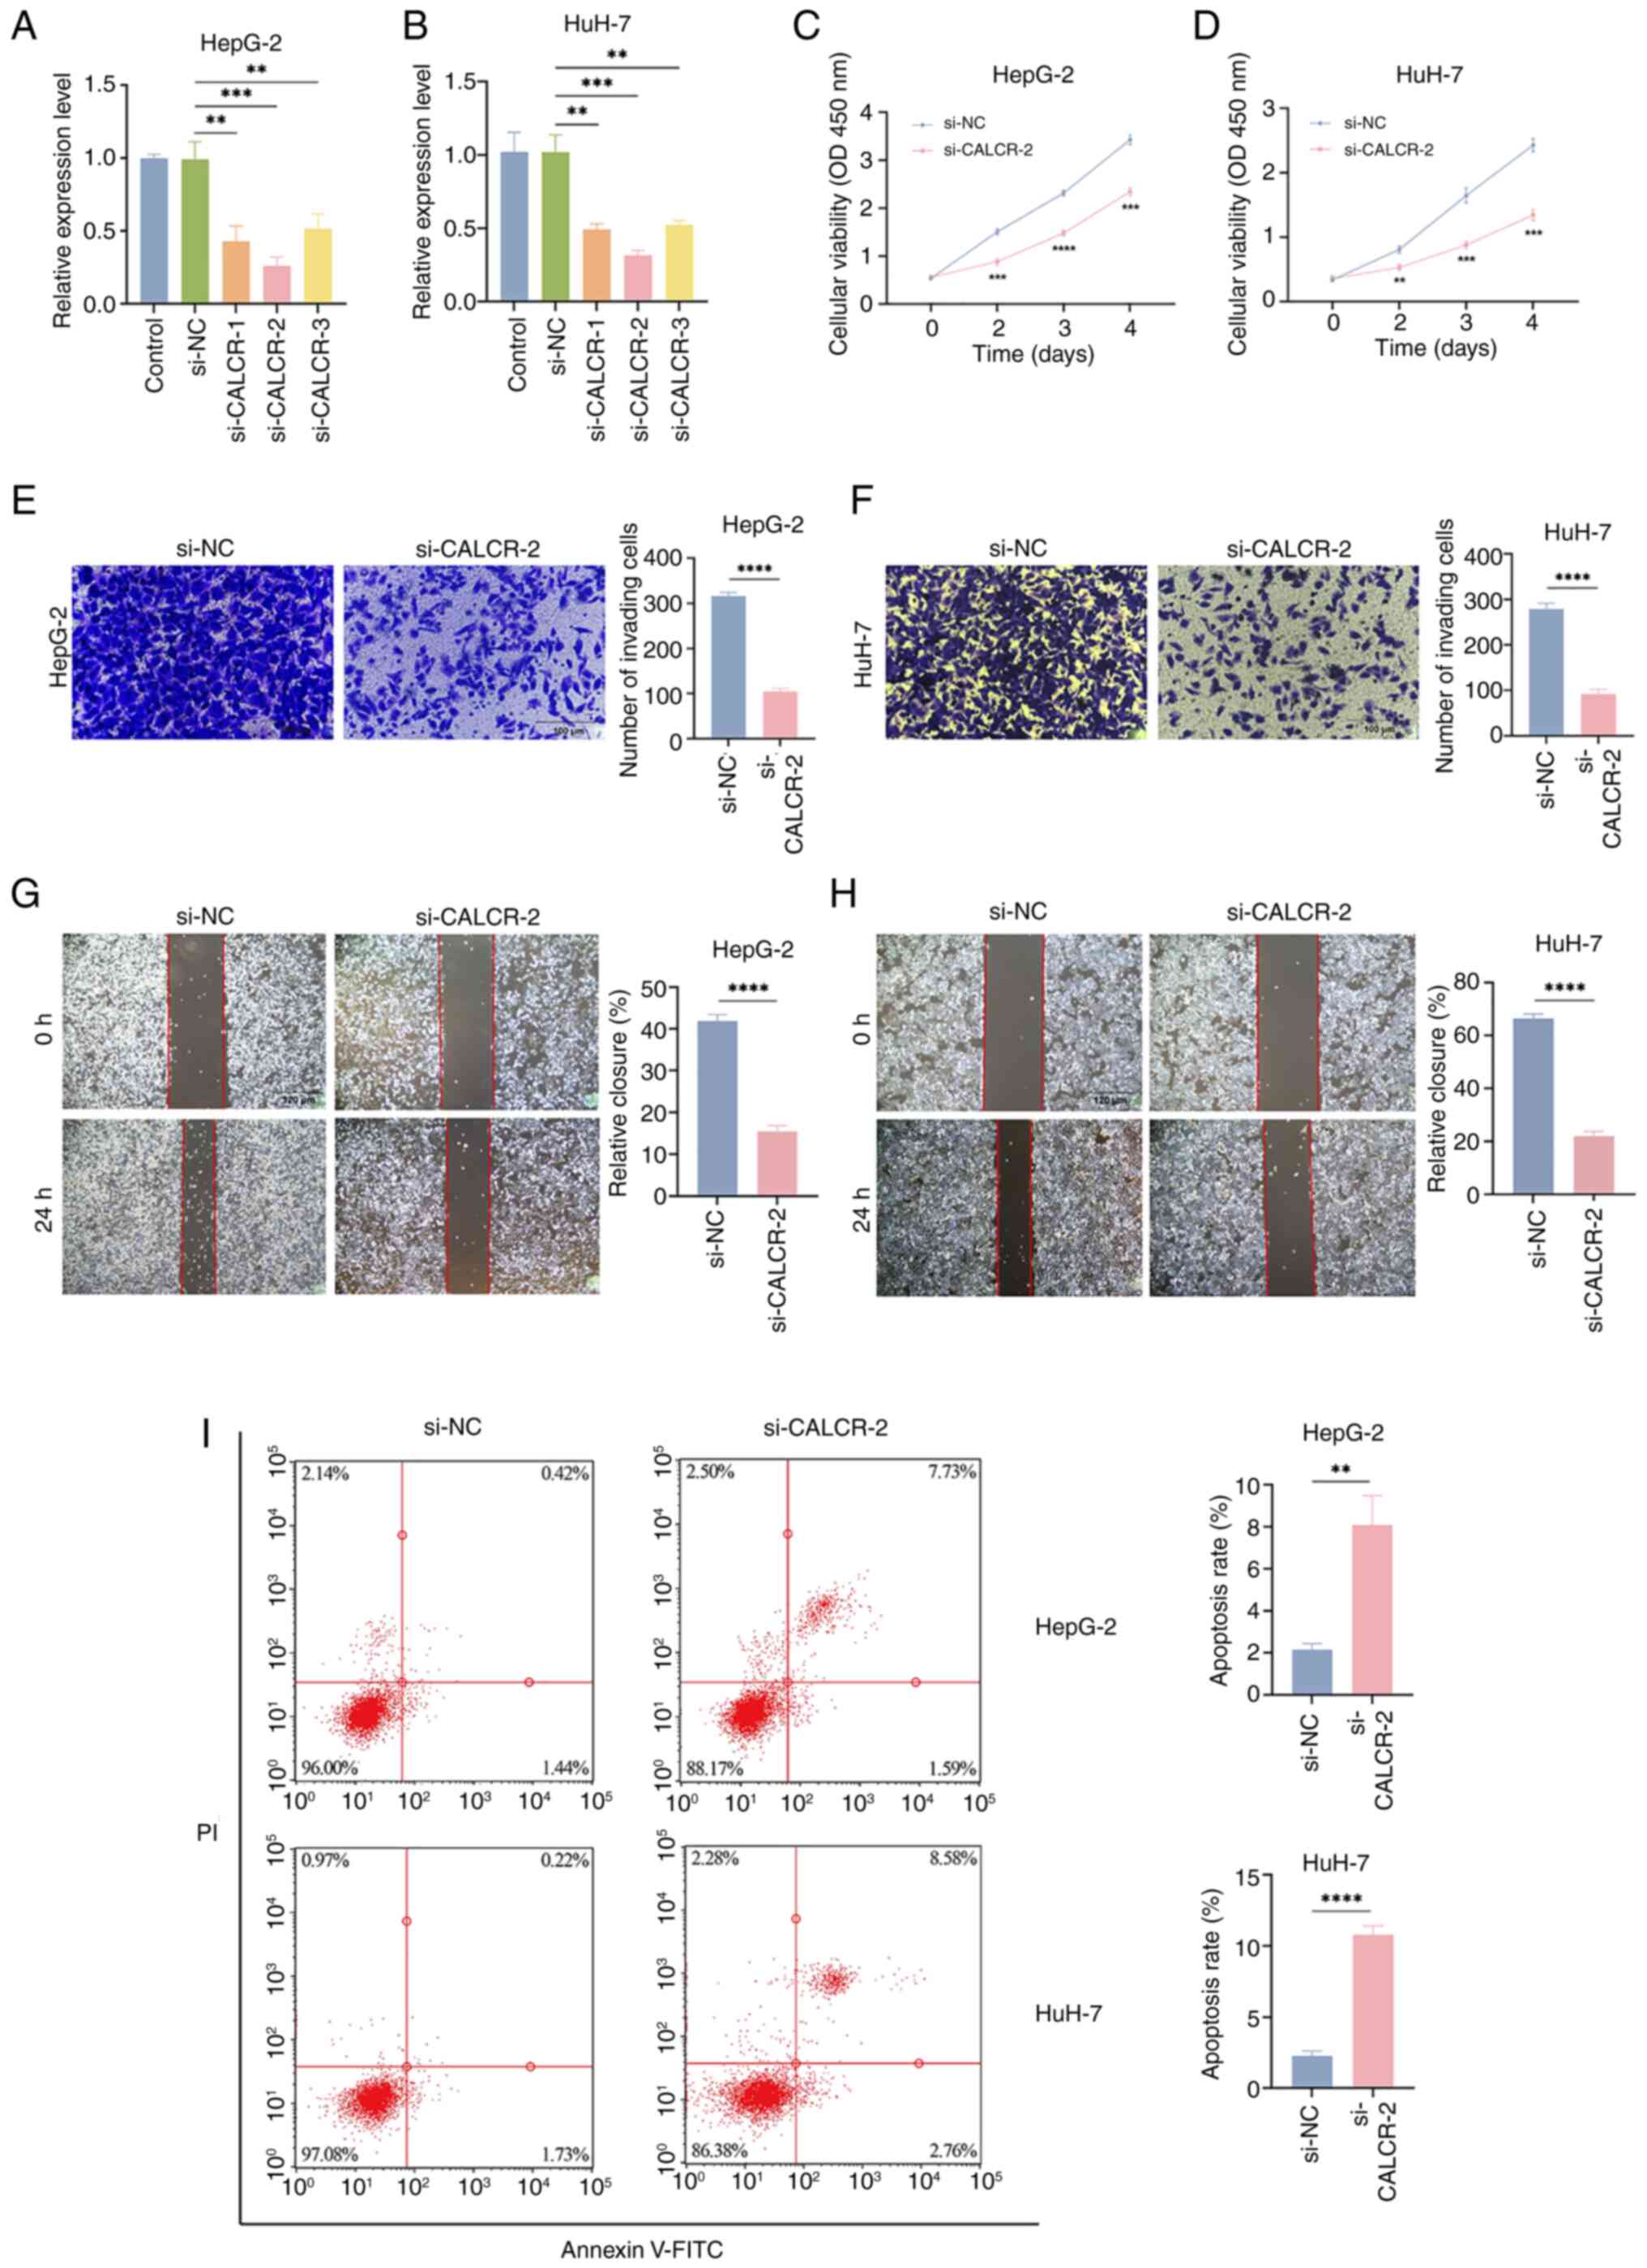 | Figure 8.The role of CALCR in LIHC cell
proliferation, migration and apoptosis. According to reverse
transcription-quantitative PCR, si-CALCR-2 effectively reduced
CALCR expression in HepG-2 (A) and HuH-7 (B) cells. In comparison
to the si-NC cluster, the knockdown of CALCR decreased the capacity
of both (C) HepG-2 and (D) HuH-7 cells to proliferate. (E and G)
HepG-2 and (F and H) HuH-7 cell migration was markedly inhibited by
CALCR elimination (E and F magnification, ×200; scale bar, 100 µm;
G and H magnification, ×100; scale bar, 120 µm). (I) CALCR
knockdown was shown to be able to accelerate apoptosis in HepG-2
and HuH-7 cells using flow cytometry. **P<0.01, ***P<0.001,
****P<0.0001, t-test based P-value. Each experiment was carried
out in duplicate and independently. CALCR, calcitonin receptor;
LIHC, liver hepatocellular carcinoma; si, small interfering; NC,
negative control. |
Discussion
The present study investigated the expression and
prognostic significance of CALCR in LIHC, emphasizing its potential
roles in fibrosis, ferroptosis and the immune microenvironment.
Comprehensive analyses revealed that CALCR is significantly
differentially expressed in LIHC and correlates with various
clinical and molecular features, suggesting its potential as a
biomarker for patient stratification and therapeutic targeting.
Previous studies have established that fibrosis,
characterized by the excessive accumulation of extracellular matrix
components, creates a tumor-promoting microenvironment (25,26).
The intricate relationship between CALCR and fibrosis suggests that
CALCR may exacerbate liver damage, further facilitating cancer
progression (27). This result is
consistent with findings from other studies indicating that
elevated levels of fibrotic markers are associated with a poor
prognosis, reinforcing the notion that targeting fibrotic pathways
may mitigate tumor growth (28).
The present study analyzed TCGA gene expression data using fibrosis
and ferroptosis gene sets from the MSigDB to identify genes linked
to fibrosis and ferroptosis in LIHC. A consensus clustering
analysis and ssGSEA were performed to quantify the expression of
genes related to these pathways. The univariate Cox regression
analysis revealed that CALCR, a key gene associated with both
fibrosis and ferroptosis, has significant prognostic value in
LIHC.
The association between CALCR expression and
fibrosis in LIHC highlights the complex relationship between
chronic liver injury and cancer development (29). Fibrosis, characterized by the
excessive accumulation of extracellular matrix components, creates
a tumor-promoting microenvironment (30). Notably, previous research has shown
that CALCR activation promotes fibrotic changes, further confirming
its role in the transition from chronic injury to malignancy
(31). The present study revealed
that high CALCR expression is associated with shorter overall OS
and DSS of LIHC patients, suggesting that CALCR might play a role
in promoting tumor progression in the fibrotic context. This
deleterious effect may be mediated by the modulation of fibrotic
pathways, which have been shown to influence tumor behavior and
patient outcomes negatively.
Correlation analysis revealed significant
associations between CALCR expression and pathways implicated in
cell cycle regulation and proliferation, such as the G2/M
checkpoint (32,33). This finding is consistent with the
literature that highlights the role of CALCR in regulating cell
cycle dynamics, suggesting that CALCR may increase cell
proliferation in LIHC (34).
Conversely, pathways negatively associated with CALCR expression
included bile acid metabolism, fatty acid metabolism and xenobiotic
metabolism (35,36). These findings suggest that CALCR
may influence LIHC progression through pathways related to cell
cycle regulation and metabolic processes. Targeting these pathways
in cancer cells could increase treatment efficacy, especially in
tumors resistant to conventional therapies.
Furthermore, genomic heterogeneity analysis revealed
significant correlations between CALCR expression and key genomic
features such as the TMB (37),
MSI (38), NEO (39) and HRD (40). These findings are similar to those
of previous studies indicating a relationship between CALCR and
genomic instability, suggesting that CALCR may serve as a nexus for
various genomic alterations in LIHC (27,41).
Understanding these interactions could open avenues for targeted
therapies aimed at addressing genomic vulnerabilities (42). Expanding on the findings of genomic
heterogeneity, the mutation analysis of the present study
identified specific differences in the mutation landscape between
the high and low CALCR expression groups. While CALCR expression
did not differ significantly between the CNV loss and CNV gain
groups of patients with LIHC, notable differences were observed in
patients with other types of cancer. The mutation landscape
analysis across various types of cancer indicated specific
mutations associated with CALCR expression, providing a broader
context for its role in cancer biology. In LIHC, the waterfall plot
of differentially mutated genes highlighted distinct mutation
profiles between the high- and low-CALCR expression groups,
underscoring the genetic complexity associated with CALCR. These
findings suggest that the role of CALCR in cancer may be influenced
by its mutational context, which could have implications for
personalized therapeutic approaches targeting specific genetic
alterations.
Immune cell infiltration is a key factor in cancer
progression and the response to therapy (43,44).
The present study revealed that CALCR expression is negatively
associated with ESTIMATE scores, indicating a more complex immune
cell infiltration environment in patients with low CALCR expression
(45). This complexity may imply
that CALCR is involved in shaping the immune landscape of LIHC,
influencing tumor growth and metastasis. A high level of immune
cell infiltration has been demonstrated to be generally associated
with improved outcomes (46);
thus, understanding the role of CALCR in immune modulation is vital
for therapeutic strategies. The differential expression analysis of
immune checkpoint genes revealed significant differences between
the high and low CALCR expression groups, further illustrating this
complexity. Notably, the TIDE analysis indicated that while no
significant differences in overall TIDE scores were observed
between the high- and low-CALCR expression groups, exclusion levels
were markedly higher in the low-CALCR expression group. These
findings suggested that patients with low CALCR expression may have
a more immunosuppressive tumor microenvironment, potentially
affecting their response to immunotherapy. Additionally, the SubMap
analysis suggested that patients with low CALCR expression might
exhibit an improved response to immunotherapy, indicating that
CALCR expression could serve as a predictor of immunotherapy
efficacy. These combined findings underscored the intricate
relationship between CALCR expression and the immune
microenvironment in LIHC, highlighting its potential role in
guiding immunotherapeutic strategies.
Despite the comprehensive analyses conducted in the
present study, several limitations should be acknowledged. First,
the present study relied heavily on bioinformatics approaches and
publicly available datasets, which may introduce biases related to
data collection and processing methods. These findings require
validation of the observed associations through experimental
studies and clinical trials to elucidate the underlying mechanisms.
Second, the heterogeneity of LIHC and other molecular factors was
not fully considered, which may affect the generalizability of the
results. Finally, the computational tools used, such as ESTIMATE,
TIDE and SubMap, have inherent limitations and assumptions that
could impact the interpretation of the results.
The present study explored the role of CALCR in LIHC
and its relationship with the immune response. The findings
highlighted that CALCR expression was significantly associated with
the progression of LIHC and may serve as a predictive biomarker for
the immunotherapy response. These findings underscored the
importance of CALCR in the tumor microenvironment and its potential
as a therapeutic target. By targeting CALCR, it is possible to
enhance the efficacy of treatment strategies for LIHC, ultimately
improving patient outcomes. Future research should focus on
elucidating the precise mechanisms by which CALCR influences LIHC
progression and its interactions within the immune landscape.
Supplementary Material
Supporting Data
Supporting Data
Acknowledgements
Not applicable.
Funding
Funding: No funding was received.
Availability of data and materials
The data generated in the present study are included
in the figures and/or tables of this article.
Authors' contributions
JZ conceived the project. SW analyzed the data. SW
and WW wrote and revised the article. JZ and SW performed the
literature investigation and revised the article, including figures
and tables. JZ, SW and WW confirm the authenticity of all the raw
data. All authors read and approved the final manuscript.
Ethics approval and consent to
participate
Not applicable.
Patient consent for publication
Not applicable.
Competing interests
The authors declare that they have no competing
interests.
Glossary
Abbreviations
Abbreviations:
|
LIHC
|
liver hepatocellular carcinoma
|
|
TISCH2
|
Tumor Immune Single Cell Hub 2
|
|
TCGA
|
The Cancer Genome Atlas
|
|
MSigDB
|
Molecular Signatures Database
|
|
ssGSEA
|
single-sample gene set enrichment
analysis
|
|
OS
|
overall survival
|
|
DSS
|
disease-specific survival
|
|
CALCR
|
calcitonin receptor
|
|
GTEx
|
Genotype-Tissue Expression
|
|
UMAP
|
uniform manifold approximation and
projection
|
|
tSNE
|
t-distributed stochastic neighbor
embedding
|
|
GO
|
Gene Ontology
|
|
DFI
|
disease-free interval
|
|
PFI
|
progression-free interval
|
|
KM
|
Kaplan-Meier
|
|
TMB
|
tumor mutational burden
|
|
MSI
|
microsatellite instability
|
|
NEO
|
neoantigen load
|
|
HRD
|
homologous recombination
deficiency
|
|
CNV
|
copy number variation
|
|
GEO
|
Gene Expression Omnibus
|
|
HPA
|
Human Protein Atlas
|
|
TIDE
|
tumor immune dysfunction and
exclusion
|
|
FBS
|
fetal bovine serum
|
|
siRNA
|
small interfering RNA
|
|
CCK-8
|
cell counting kit-8
|
|
FITC
|
fluorescein isothiocyanate
|
|
PI
|
propidium iodide
|
References
|
1
|
Siegel RL, Giaquinto AN and Jemal A:
Cancer statistics, 2024. CA Cancer J Clin. 74:12–49. 2024.
View Article : Google Scholar : PubMed/NCBI
|
|
2
|
Dopazo C, Søreide K, Rangelova E, Mieog S,
Carrion-Alvarez L, Diaz-Nieto R, Primavesi F and Stättner S:
Hepatocellular carcinoma. Eur J Surg Oncol. 50:1073132024.
View Article : Google Scholar : PubMed/NCBI
|
|
3
|
O'Rourke JM, Sagar VM, Shah T and Shetty
S: Carcinogenesis on the background of liver fibrosis: Implications
for the management of hepatocellular cancer. World J Gastroenterol.
24:4436–4447. 2018. View Article : Google Scholar : PubMed/NCBI
|
|
4
|
Barry AE, Baldeosingh R, Lamm R, Patel K,
Zhang K, Dominguez DA, Kirton KJ, Shah AP and Dang H: Hepatic
stellate cells and hepatocarcinogenesis. Front Cell Dev Biol.
8:7092020. View Article : Google Scholar : PubMed/NCBI
|
|
5
|
Bataller R and Brenner DA: Liver fibrosis.
J Clin Invest. 115:209–218. 2005. View Article : Google Scholar : PubMed/NCBI
|
|
6
|
Chen SL and Morgan TR: The natural history
of hepatitis C virus (HCV) infection. Int J Med Sci. 3:47–52. 2006.
View Article : Google Scholar : PubMed/NCBI
|
|
7
|
Gupta S, Read SA, Shackel NA, Hebbard L,
George J and Ahlenstiel G: The role of micronutrients in the
infection and subsequent response to hepatitis c virus. Cells.
8:6032019. View Article : Google Scholar : PubMed/NCBI
|
|
8
|
Jiang X, Stockwell BR and Conrad M:
Ferroptosis: Mechanisms, biology and role in disease. Nat Rev Mol
Cell Biol. 22:266–282. 2021. View Article : Google Scholar : PubMed/NCBI
|
|
9
|
Chen X, Kang R, Kroemer G and Tang D:
Broadening horizons: The role of ferroptosis in cancer. Nat Rev
Clin Oncol. 18:280–296. 2021. View Article : Google Scholar : PubMed/NCBI
|
|
10
|
Chen X, Li J, Kang R, Klionsky DJ and Tang
D: Ferroptosis: Machinery and regulation. Autophagy. 17:2054–2081.
2021. View Article : Google Scholar : PubMed/NCBI
|
|
11
|
Dixon SJ and Olzmann JA: The cell biology
of ferroptosis. Nat Rev Mol Cell Biol. 25:424–42. 2024. View Article : Google Scholar : PubMed/NCBI
|
|
12
|
Zeng F, Nijiati S, Tang L, Ye J, Zhou Z
and Chen X: Ferroptosis detection: From approaches to applications.
Angew Chem Int Ed Engl. 62:e2023003792023. View Article : Google Scholar : PubMed/NCBI
|
|
13
|
He T and Ling F: CALCR knockdown inhibits
the development and progression of non-small-cell lung cancer.
Carcinogenesis. 42:1390–1398. 2021. View Article : Google Scholar : PubMed/NCBI
|
|
14
|
Xue C, Gu X and Li L: Immune
classifier-based signatures provide good prognostic stratification
and predict the clinical benefits of immune-based therapies for
hepatocellular carcinoma. Cancer Cell Int. 21:4712021. View Article : Google Scholar : PubMed/NCBI
|
|
15
|
Masi L and Brandi ML: Calcitonin and
calcitonin receptors. Clin Cases Miner Bone Metab. 4:117–122.
2007.PubMed/NCBI
|
|
16
|
Mitra P, Guha M, Ghosh S, Mukherjee S,
Bankura B, Pal DK, Maity B and Das M: Association of calcitonin
receptor gene (CALCR) polymorphism with kidney stone disease in the
population of West Bengal, India. Gene. 622:23–28. 2017. View Article : Google Scholar : PubMed/NCBI
|
|
17
|
Nugent A and Proia RL: The role of G
protein-coupled receptors in lymphoid malignancies. Cell Signal.
39:95–107. 2017. View Article : Google Scholar : PubMed/NCBI
|
|
18
|
Yan H, Xing Z, Liu S, Gao P, Wang Q and
Guo G: CALCR exacerbates renal cell carcinoma progression via
stabilizing CD44. Aging (Albany NY). 16:10765–10783. 2024.
View Article : Google Scholar : PubMed/NCBI
|
|
19
|
Tomczak K, Czerwińska P and Wiznerowicz M:
The cancer genome atlas (TCGA): An immeasurable source of
knowledge. Contemp Oncol (Pozn). 19:A68–A77. 2015.PubMed/NCBI
|
|
20
|
GTEx Consortium: The genotype-tissue
expression (GTEx) project. Nat Genet. 45:580–585. 2013. View Article : Google Scholar : PubMed/NCBI
|
|
21
|
Liberzon A, Birger C, Thorvaldsdóttir H,
Ghandi M, Mesirov JP and Tamayo P: The molecular signatures
database (MSigDB) hallmark gene set collection. Cell Syst.
1:417–425. 2015. View Article : Google Scholar : PubMed/NCBI
|
|
22
|
Jiang P, Gu S, Pan D, Fu J, Sahu A, Hu X,
Li Z, Traugh N, Bu X, Li B, et al: Signatures of T cell dysfunction
and exclusion predict cancer immunotherapy response. Nat Med.
24:1550–1558. 2018. View Article : Google Scholar : PubMed/NCBI
|
|
23
|
Hoshida Y, Brunet JP, Tamayo P, Golub TR
and Mesirov JP: Subclass mapping: Identifying common subtypes in
independent disease data sets. PLoS One. 2:e11952007. View Article : Google Scholar : PubMed/NCBI
|
|
24
|
Livak KJ and Schmittgen TD: Analysis of
relative gene expression data using real-time quantitative PCR and
the 2(−Delta Delta C(T)) method. Methods. 25:402–428. 2001.
View Article : Google Scholar : PubMed/NCBI
|
|
25
|
Herzog BH, Baer JM, Borcherding N,
Kingston NL, Belle JI, Knolhoff BL, Hogg GD, Ahmad F, Kang V,
Petrone J, et al: Tumor-associated fibrosis impairs immune
surveillance and response to immune checkpoint blockade in
non-small cell lung cancer. Sci Transl Med. 15:eadh80052023.
View Article : Google Scholar : PubMed/NCBI
|
|
26
|
Liu X, Zhou J, Wu H, Chen S, Zhang L, Tang
W, Duan L, Wang Y, McCabe E, Hu M, et al: Fibrotic immune
microenvironment remodeling mediates superior anti-tumor efficacy
of a nano-PD-L1 trap in hepatocellular carcinoma. Mol Ther.
31:119–133. 2023. View Article : Google Scholar : PubMed/NCBI
|
|
27
|
Mancinelli R, Ceci L, Kennedy L, Francis
H, Meadows V, Chen L, Carpino G, Kyritsi K, Wu K, Zhou T, et al:
The effects of taurocholic acid on biliary damage and liver
fibrosis are mediated by calcitonin-gene-related peptide signaling.
Cells. 11:15912022. View Article : Google Scholar : PubMed/NCBI
|
|
28
|
Röhrich M, Leitz D, Glatting FM, Wefers
AK, Weinheimer O, Flechsig P, Kahn N, Mall MA, Giesel FL,
Kratochwil C, et al: Fibroblast activation protein-specific PET/CT
imaging in fibrotic interstitial lung diseases and lung cancer: A
translational exploratory study. J Nucl Med. 63:127–133. 2022.
View Article : Google Scholar : PubMed/NCBI
|
|
29
|
Castellani C, Malerba G, Sangalli A,
Delmarco A, Petrelli E, Rossini M, Assael BM and Mottes M: The
genetic background of osteoporosis in cystic fibrosis: Association
analysis with polymorphic markers in four candidate genes. J Cyst
Fibros. 5:229–235. 2006. View Article : Google Scholar : PubMed/NCBI
|
|
30
|
Bhattacharjee S, Hamberger F, Ravichandra
A, Miller M, Nair A, Affo S, Filliol A, Chin L, Savage V, Yin D, et
al: Tumor restriction by type I collagen opposes tumor-promoting
effects of cancer-associated fibroblasts. J Clin Invest.
131:e1469872021. View Article : Google Scholar : PubMed/NCBI
|
|
31
|
Moreira LM, Takawale A, Hulsurkar M,
Menassa DA, Antanaviciute A, Lahiri SK, Mehta N, Evans N, Psarros
C, Robinson P, et al: Paracrine signaling by cardiac calcitonin
controls atrial fibrogenesis and arrhythmia. Nature. 587:460–465.
2020. View Article : Google Scholar : PubMed/NCBI
|
|
32
|
Chida K, Oshi M, Roy AM, Yachi T, Nara M,
Yamada K, Matsuura O, Hashizume O, Endo I and Takabe K: E2F target
score is associated with cell proliferation and survival of
patients with hepatocellular carcinoma. Surgery. 174:307–314. 2023.
View Article : Google Scholar : PubMed/NCBI
|
|
33
|
Oshi M, Patel A, Le L, Tokumaru Y, Yan L,
Matsuyama R, Endo I and Takabe K: G2M checkpoint pathway alone is
associated with drug response and survival among cell
proliferation-related pathways in pancreatic cancer. Am J Cancer
Res. 11:3070–3084. 2021.PubMed/NCBI
|
|
34
|
Xu G and Jiang D: The role and mechanism
of exogenous calcitonin gene-related peptide on mesenchymal stem
cell proliferation and osteogenetic formation. Cell Biochem
Biophys. 69:369–378. 2014. View Article : Google Scholar : PubMed/NCBI
|
|
35
|
Chiang JYL and Ferrell JM: Bile acid
metabolism in liver pathobiology. Gene Expr. 18:71–87. 2018.
View Article : Google Scholar : PubMed/NCBI
|
|
36
|
Currie E, Schulze A, Zechner R, Walther TC
and Farese RV Jr: Cellular fatty acid metabolism and cancer. Cell
Metab. 18:153–161. 2013. View Article : Google Scholar : PubMed/NCBI
|
|
37
|
Bin X, Luo Z, Wang J and Zhou S:
Identification of a five immune term signature for prognosis and
therapy options (immunotherapy versus targeted therapy) for
patients with hepatocellular carcinoma. Comput Math Methods Med.
2:89589622023. View Article : Google Scholar : PubMed/NCBI
|
|
38
|
Addeo A, Friedlaender A, Banna GL and
Weiss GJ: TMB or not TMB as a biomarker: That is the question. Crit
Rev Oncol Hematol. 163:1033742021. View Article : Google Scholar : PubMed/NCBI
|
|
39
|
Halford SE, Sawyer EJ, Lambros MB, Gorman
P, Macdonald ND, Talbot IC, Foulkes WD, Gillett CE, Barnes DM,
Akslen LA, et al: MSI-low, a real phenomenon which varies in
frequency among cancer types. J Pathol. 201:389–394. 2003.
View Article : Google Scholar : PubMed/NCBI
|
|
40
|
Jardim DL, Goodman A, de Melo Gagliato D
and Kurzrock R: The challenges of tumor mutational burden as an
immunotherapy biomarker. Cancer Cell. 39:154–173. 2021. View Article : Google Scholar : PubMed/NCBI
|
|
41
|
Akinjiyan FA, Morecroft R, Phillipps J,
Adeyelu T, Elliott A, Park SJ, Butt OH, Zhou AY and Ansstas G:
Homologous recombination deficiency (HRD) in cutaneous oncology.
Int J Mol Sci. 24:107712023. View Article : Google Scholar : PubMed/NCBI
|
|
42
|
García-Solano J, Turpin-Sevilla MDC,
García-García F, Carbonell-Muñoz R, Torres-Moreno D, Conesa A and
Conesa-Zamora P: Differences in gene expression profiling and
biomarkers between histological colorectal carcinoma subsets from
the serrated pathway. Histopathology. 75:496–507. 2019. View Article : Google Scholar : PubMed/NCBI
|
|
43
|
Rui R, Zhou L and He S: Cancer
immunotherapies: Advances and bottlenecks. Front Immunol.
14:12124762023. View Article : Google Scholar : PubMed/NCBI
|
|
44
|
Zhang D, Zhang X, Liu Z, Han T, Zhao K, Xu
X, Zhang X, Ren X and Qin C: An integrative multi-omics analysis
based on disulfidptosis-related prognostic signature and distinct
subtypes of clear cell renal cell carcinoma. Front Oncol.
13:12070682023. View Article : Google Scholar : PubMed/NCBI
|
|
45
|
Yoshihara K, Shahmoradgoli M, Martínez E,
Vegesna R, Kim H, Torres-Garcia W, Treviño V, Shen H, Laird PW,
Levine DA, et al: Inferring tumor purity and stromal and immune
cell admixture from expression data. Nat Commun. 4:26122013.
View Article : Google Scholar : PubMed/NCBI
|
|
46
|
Ricciuti B, Wang X, Alessi JV, Rizvi H,
Mahadevan NR, Li YY, Polio YY, Lindsay J, Umeton R, Sinha R, et al:
Association of high tumor mutation burden in non-small cell lung
cancers with increased immune infiltration and improved clinical
outcomes of PD-L1 blockade across PD-L1 expression levels. JAMA
Oncol. 8:1160–1168. 2022. View Article : Google Scholar : PubMed/NCBI
|