Introduction
Tic disorder (TD) is a childhood-onset developmental
neuropsychiatric disorder (1,2). TD
is characterized by motor and/or vocal tics (1,3) that
typically appear between the ages of 5 and 6 years, reaching a peak
in severity between the ages of 10 and 12 years, and gradually
declining in severity during early adulthood (4). Most patients exhibit resolution of
symptoms in adulthood (4). Of
note, 50–90% of patients with TD also exhibit one or more mental or
behavioral disorders of varying severity (5). The most common psychiatric
comorbidities are attention deficit hyperactivity disorder,
obsessive-compulsive disorder, anxiety and depression (5). Furthermore, TD is associated with an
increased risk of autoimmune diseases (6), allergic diseases (7) and sleep disturbances (8). TD and these accompanying diseases
reduce the quality of life of patients and their families (9,10),
and impact the psychosocial function of patients (11).
The pathogenesis of TD is complex and not yet fully
understood. The cortico-striato-thalamo-cortical (CSTC) circuit is
a neuronal circuit that regulates motor executive, cognitive and
emotional processing functions (12). Dysfunction of the CSTC circuit is
related to TD (13). Previous
studies using neuroimaging studies and animal model experiments
support the hypothesis of dysfunction of the dopamine (14), glutamate (Glu) (15–17)
and γ-aminobutyric acid (GABA) (15,18,19)
system in the CSTC circuit. In a previous study, the release of
striatal dopamine and the activation of D2 receptors improved tic
behavior, with dysfunction of striatal dopamine as the driving
factor of motor tics (14). Using
an animal model, it was revealed that rats with TD, with abnormal
metabolism in the ‘Glu-GABA’ loop, had higher Glu levels and lower
GABA levels (15). Inhibition of
Glu could eliminate tic behavior, indicating that Glu is critical
for the generations of tics (16,17).
Cortical GABA has a negative association with premonitory urges,
and lower cortical GABA is related to more severe and frequent
premonitory urges (18,19). In the CSTC circuit, the major
dysregulated neurotransmitters appear to differ between the
different brain regions, suggesting that each brain region may
serve a different role in the pathogenesis of TD via different
pathways (14,18,19).
In addition to these neurotransmitters, studies have also focused
on metabolites in the pathogenesis of TD (15,20–22).
Previous studies have found that certain metabolites were involved
in TD, such as tryptophan and amines (20,21).
A case-controlled study found that tryptophan hydroxylase 2 gene
polymorphisms were related to susceptibility to developing TD in
the Chinese Han population (22).
Our previous study using widely targeted metabolomic analysis in
the thalamus in patients with TD (15) identified 34 differentially present
substances between the TD group and control (CK) group (9
upregulated and 25 downregulated). Among them, neurosteroids
(progesterone and corticosterone) exhibited distinct differences.
However, the levels of metabolites in other brain regions in the
CSTC circuit have not been thoroughly studied.
Metabolomics is a broad-spectrum technique used to
detect metabolite levels (23).
Previously, metabolomic methods have been widely used to analyze
metabolites comprehensively (24,25).
Widely targeted metabolomics integrates the advantages of
non-targeted and targeted metabolite detection technologies, is a
high throughput technique, and exhibits high sensitivity, precision
and comprehensive coverage (24).
3,3′-iminodipropionitrile (IDPN) is a neurotoxic compound that
exhibits toxic effects on various mammals, including mice and
subhuman primates (26). IDPN is
metabolized into cyanoacetic acid, lathyrogen-B-aminopropionitrile
and β-alanine, all of which can cross the blood-brain barrier (BBB)
and are thus detectable in the brain tissue (27,28).
Diamond et al (29)
injected IDPN intraperitoneally into rats and revealed that the
dopamine system in their extrapyramidal system was disrupted, with
dopamine levels continuously decreasing, leading to dopamine
receptor supersensitivity and the emergence of stereotypical
behavior (29). The effective dose
of IDPN was 150 mg/kg/day (29),
and continuous injections over 7 days induced pronounced behavioral
symptoms that persisted for an extended period, typically lasting
2–3 months (30). Additionally,
the IDPN-induced TD rat model was irreversible and rats induced
using this model exhibited whole-body motor disturbances, such as
head bobbing, rotational movement and chorea-like activity
(30). Together, these previous
studies show that the IDPN-induced rat model is commonly used in TD
research and can effectively replicate the behavioral
characteristics of TD.
At present, the majority of studies have primarily
focused on the metabolic differences of one certain brain region at
a time and there are few studies that pay attention to the
metabolic characteristics of the CSTC circuit (31). The aim of the present study was to
analyze the commonality and differences of metabolic abnormalities
in the CSTC circuit, addressing the hypothesis that the different
brain regions in the CSTC circuit may serve different roles in the
pathogenesis of TD via different pathways. Widely targeted
metabolomics technology was used to comprehensively detect and
analyze differences in the presence of metabolites in the cortex
and striatum in a rat model of TD. Combined with our previous study
data, common differentially present metabolites and pathways in the
CSTC circuit were analyzed. The differences in the metabolic
abnormalities among the cortex, striatum and thalamus were then
assessed to provide reference values for studying the pathogenesis
of TD.
Materials and methods
Animals
The selection of animal age affects neurotransmitter
metabolism and cellular metabolism. For example, Glu and GABA
neurons undergo large and approximately proportional increases in
neurotransmitter cycling and oxidative energy metabolism during the
major postnatal growth spurt at postnatal day 10–30 (32). In the present study, tic modeling
was performed as described previously (30). TDs are more frequently observed in
males than females (33). Thus, 10
male Wistar rats (Charles River Laboratories, Inc.) weighing 45 g
at 4 weeks of age were used. At the beginning of the experiment,
rats were housed at room temperature and 20–30% humidity with a
12-h light/dark cycle with lights on at 6 am and ad libitum
access to water and food for 7 days of adaptive rearing.
Subsequently, the rats were randomly divided into the CK group
(n=5) and the TD group (n=5). The CK group received intraperitoneal
injections of 0.9% saline (15 ml/kg) once daily for 7 days, while
the TD group received IDPN (250 mg/kg; 98%; CAS no. 111-94-4;
Shanghai Aladdin Biochemical Technology Co., Ltd.) once daily for 7
days. Finally, stereotype assessment was used to verify the TD
model. All IDPN-treated rats showed typical symptoms of TD,
including noticeable head twitching, continuous hovering behavior
and licking paws, indicating successful establishment of the model
(34). Stereotypy recording was
used to measure the severity of symptoms. In a quiet and dark
environment, rats were placed in the open field test box and
allowed to adapt for 5 min. An open field autonomous movement
behavior tracking system (XR-XZ301; 100×100×50 cm; Shanghai Xinruan
Information Technology Co., Ltd.) was used to record the behavior
of rats. Two experimenters observed each rat for 1 h (every 5 min
for 1 min each time, a total of 12 times, with the total score
being recorded) after IDPN injection. Stereotyped behavior score
was rated as follows. No stereotyped behavior, 0; rotation
behavior, 1; excessive up and down movement of the head and neck,
2; excessive up and down movement of the head and neck plus
rotational behavior, 3; lateral head swing and excessive up and
down movement of the head and neck, 4.
All animal experimental procedures were approved by
the Xin Hua Hospital Ethics Committee Affiliated to Shanghai Jiao
Tong University School of Medicine (approval no. XHEC-F-2023-005;
Shanghai, China). All attempts were made to ensure minimal animal
suffering during the experiment.
Chemicals and reagents
High-performance liquid chromatography (HPLC)-grade
acetonitrile (ACN) was purchased from ANPEL Laboratory Technologies
(Shanghai), Inc. (cat. no. CAEQ-4-000308-4000). Methanol (MeOH) was
purchased from Merck KGaA (cat. no. 1.06007.4008). Formic acid was
purchased from RHAWN (cat. no. R050228-50g). The stock solutions of
standards (1 mg/ml) were prepared in MeOH and other solutions.
Generally, MeOH could be used to dissolve most of the standards, if
MeOH could not dissolve the standards, 70% MeOH/H2O was
used for strong polar standards and 50%
CH2Cl2/MeOH (CH2Cl2;
cat. no. D143-4; Thermo Fisher Scientific, Inc.) was used for weak
polar standards. All stock solutions were stored at −20°C. The
stock solutions were diluted with MeOH to obtain working solutions
before use.
Widely targeted metabolomic analysis
of the metabolites
Sample preparation and extraction
All rats were placed in a small animal anesthesia
machine (RWD Life Science Co., Ltd.) and euthanized using 10%
isoflurane for 30 min at the end of the experiment. Death was
confirmed by a lack of heartbeat, after which the brain tissue
samples of striatum and cortex were quickly dissected and
collected. The symptoms that could have occurred during the
experimental process were weight loss, loss of appetite, weakness,
infection of body organs, tumor development, death or a near-fatal
event, organ system failure and failure of the circulatory system,
among others, at which point the affected animal would have been
humanely terminated. No animal reached the humane endpoints. The
brain tissue samples of striatum and cortex were frozen with liquid
nitrogen and stored at −80°C.
After the brain tissue samples of striatum and
cortex were thawed and crushed, 0.05 g was mixed with 500 µl 70%
MeOH/water. The sample was vortexed for 3 min at 2,500 r/min and
centrifuged at 11,304 × g for 10 min at 4°C. Subsequently, 300 µl
supernatant was placed in a clean centrifuge tube and stored at
−20°C for 30 min. The supernatant was recentrifuged at 11,304 × g
for 10 min at 4°C. After centrifugation, 200 µl supernatant was
transferred to a protein precipitation plate (no. MPPT9601A;
Shenzhen Biocomma Technology Co,. Ltd.) for further analysis using
liquid chromatography (LC) and mass spectrometry.
Ultra-performance LC (UPLC)
The sample extracts were analyzed using an
LC-electrospray ionization (ESI)-tandem mass spectrometry (MS/MS)
system (UPLC, ExionLCTM AD, SCIEX; MS, QTRAP®
6,500+ System, SCIEX). According to polarity, different substances
were analyzed using different analysis methods: The T3 method was
selected for weak polarity and the amide method was used for strong
polarity. The amide method was used after the T3 method. The
analytical conditions were as follows: T3 method, HPLC column (cat.
no. 186003538; Waters Corporation), Waters ACQUITY UPLC HSS T3 C18
(1.8 µm; 100×2.1 mm i.d.); solvent system, water with 0.05% formic
acid (solution A) and ACN with 0.05% formic acid (solution B). The
gradient was initiated using 5% solution B (0 min), increased to
95% solution B (8–9 .5 min) and finally ramped back to 5% solution
B (9.6–12 min), with a flow rate of 0.35 ml/min, temperature of
40°C and injection volume of 2 µl. Amide method: HPLC column (cat.
no. 186004801; Waters Corporation), ACQUITY UPLC BEH Amide (1.7 µm;
100×2.1 mm i.d.); solvent system, water with 10 mM ammonium acetate
(cat. no. 10001228; Shanghai Bide Pharmaceutical Technology Co.,
Ltd.) and 0.3% ammonium hydroxide (500 ml; cat. no. A112080;
Shanghai Aladdin Biochemical Technology Co., Ltd.) (solution C) and
90% ACN/water (V/V; solution D). The gradient was initiated with
95% solution D (0–1 .2 min), decreased to 70% solution D (8 min)
and 50% solution D (9–11 min), and finally ramped back to 95%
solution D (11.1–15 min). The flow rate was 0.4 ml/min, with a
temperature of 40°C and an injection volume of 2 µl.
ESI-MS/MS
Linear ion trap and triple quadrupole scans were
acquired using a triple quadrupole-linear ion trap mass
spectrometer (QTRAP® 6,500+ LC-MS/MS System; SCIEX),
equipped with an ESI Turbo IonSpray interface, operating in both
positive and negative ion modes and controlled using Analyst
version 1.6.3 software (SCIEX). The ESI source operation parameters
were as follows: Ion source, ESI+/-; source temperature, 550°C; ion
spray voltage, 5,500 V (positive) and −4,500 V (negative); curtain
gas was set at 35 psi; flow rate, 22 l/min. Metabolites were
analyzed using scheduled multiple reaction monitoring (MRM). Data
were acquired using Analyst software. MultiQuant version 3.0.3
(SCIEX) was used to quantify all metabolites. Mass spectrometry
parameters, including the declustering potentials (DP) and
collision energies (CE) for individual MRM transitions, were
determined using further DP and CE optimization. A specific set of
MRM transitions was monitored for each period according to the
metabolites eluted within the corresponding period.
Detection of targeted metabolites
All targeted metabolites were detected using MetWare
(Metware Biotechnology Inc.) based on the AB Sciex
QTRAP® 6500+ LC-MS/MS platform.
Statistical analysis
There were 5 samples of striatum and 5 samples of
cortex in the CK group and TD group (total, 20 samples).
Unsupervised principal component analysis (PCA) was performed using
the statistics function prcomp within R (v4.3.2; www.r-project.org). The data was unit variance scaled
before unsupervised PCA. The hierarchical cluster analysis (HCA)
results of samples and metabolites were presented as heatmaps with
dendrograms, while the Pearson correlation coefficients (PCCs)
between samples were calculated using the cor function in R and
presented as only heatmaps. Both HCA and PCC analysis were carried
out using the R (v.3.5.1; www.r-project.org) package pheatmap (v1.20.0;
http://cran.r-project.org/web/packages/pheatmap/index.html).
For HCA, normalized signal intensities of metabolites (unit
variance scaling) were visualized as a color spectrum.
Significantly regulated metabolites between groups were determined
by variable importance in projection (VIP) and absolute
log2fold change (FC). VIP values were extracted from
partial least squares-discriminant analysis (OPLS-DA) results,
which also contain score plots and permutation plots, generated
using the R (v.3.5.1; www.r-project.org) package MetaboAnalystR (v1.0.1;
http://github.com/xia-lab/MetaboAnalystR). The data
were log transformed (log2) and mean-centered before
OPLS-DA. In order to avoid overfitting, a permutation test (200
permutations) was performed. Identified metabolites were annotated
using the Kyoto Encyclopedia of Genes and Genomes compound database
(http://www.kegg.jp/kegg/compound/),
and annotated metabolites were then mapped to the KEGG Pathway
database (http://www.kegg.jp/kegg/pathway.html). Pathways with
significantly regulated metabolites mapped to were then fed into
metabolite sets enrichment analysis, and their significance was
determined by hypergeometric test's P-values. P<0.05 was
considered to indicate a statistically significant difference.
Results
Full-scale mass spectrometry analysis
of metabolites
The specificity of full-scale mass spectrometry
analysis has been previously demonstrated (15). A total of 242 metabolites were
detected, including 47 nucleotides and their metabolomics, 45 amino
acids and their derivatives, 23 organic acids and their
derivatives, 23 small peptides, 12 hormones and hormone-related
compounds, 11 acylcarnitines (CARs), 11 bile acids, 10 coenzymes
and vitamins, six amines, six polyamines, five phosphate sugars,
four phosphoric acids, three free fatty acids, three heterocyclic
compounds, three lysophosphatidylcholines, three
lysophosphatidylethanolamines, three phenolic acids, three sulfonic
acids, two fatty acyls, two indoles and their derivatives, two
pterdines and their derivatives, two sugars, one alcohol, one
carboximidic acid, one choline, one dinucleotide, one nucleotide
metabolomic, one oxidized lipid, one sugar alcohol, one sugar acid,
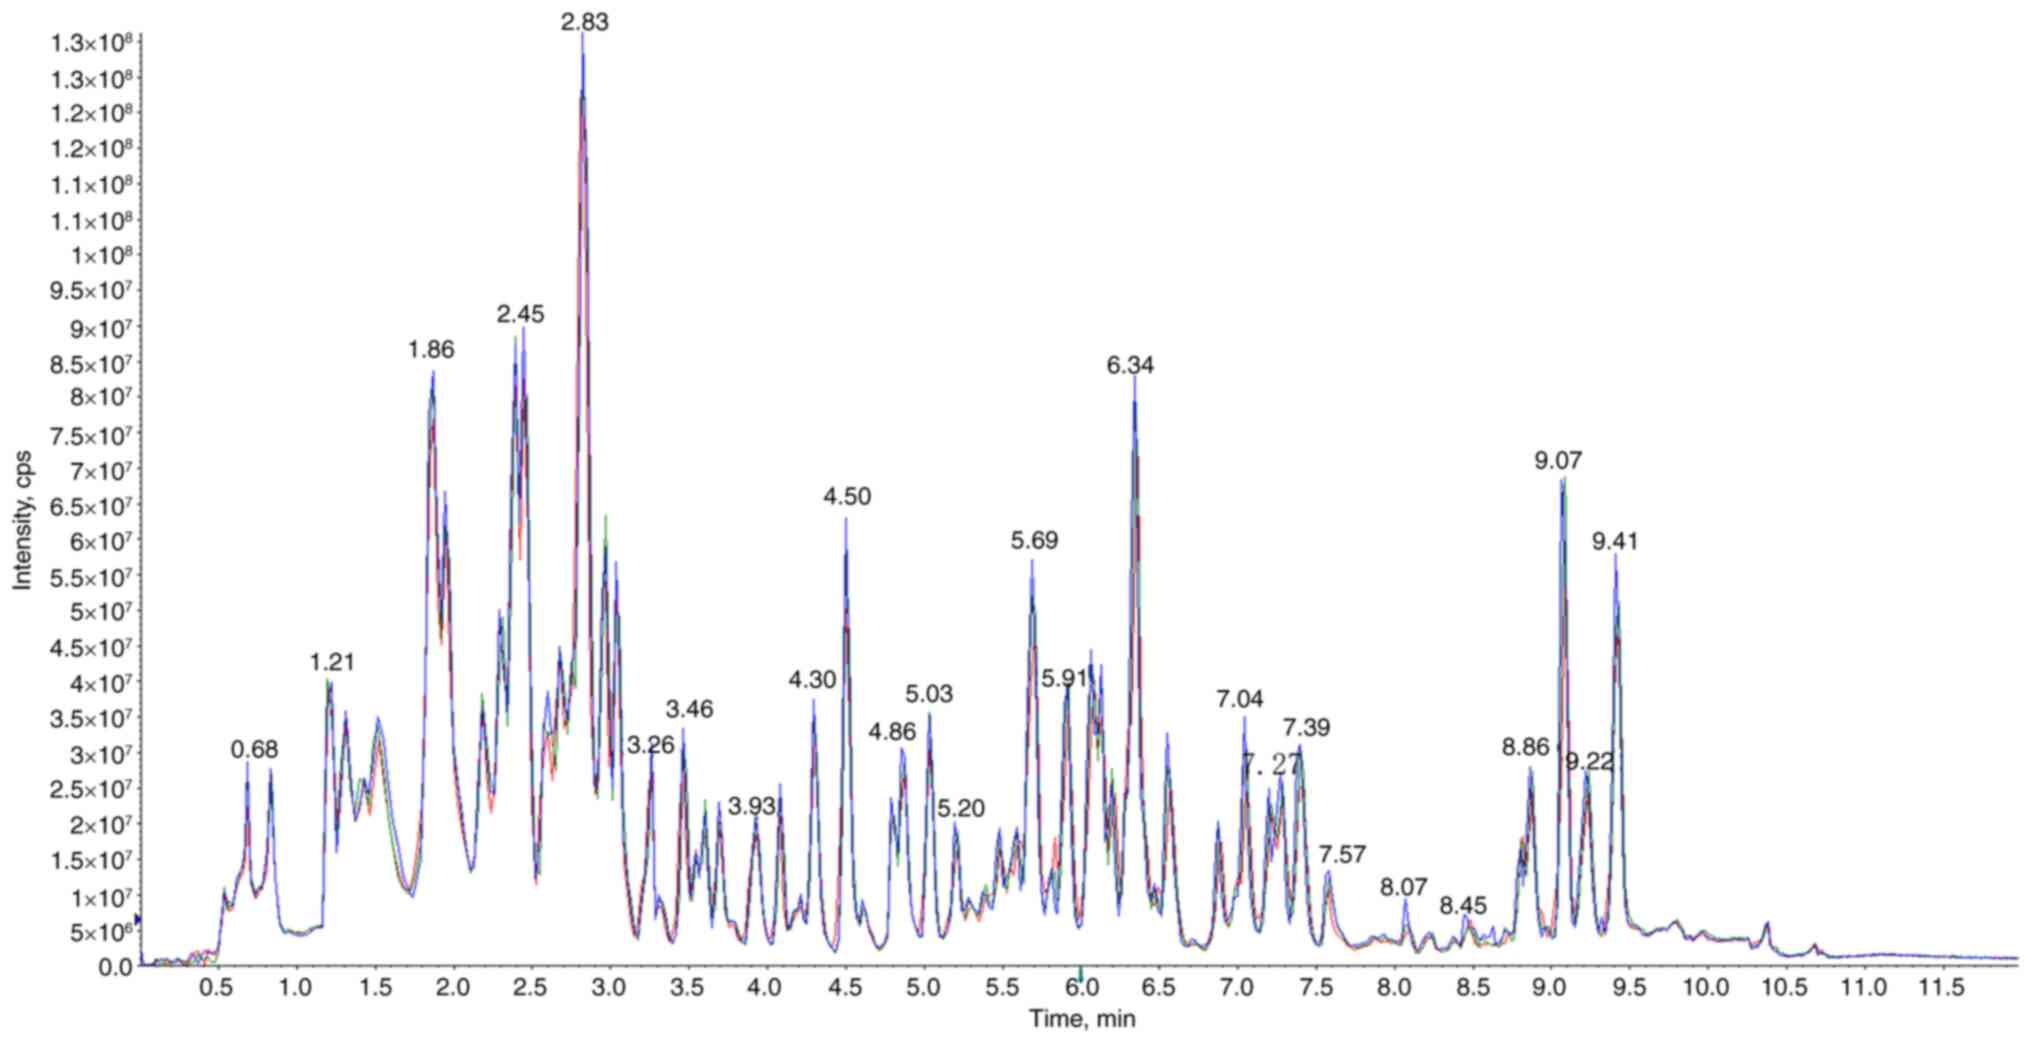
one fatty acid and others. The similarity between the total ion
currents for metabolite detection demonstrated that the mass
spectrometry exhibited great signal stability in detecting the
identical sample at varying times (Fig. 1). The high stability of the
instruments offered a crucial assurance for the repeatability and
reliability of data.
Metabolism in the striatum
Screening for differentially present
metabolites
There were 13 differentially present metabolites
between the CK and TD groups in the striatum (9 upregulated and 4
downregulated; Fig. 2A). After
conducting qualitative and quantitative analysis of the detected
metabolites, the FC of differences was calculated. The 13
differentially present metabolites based on the FC are shown in
Fig. 2B. Several metabolites were
significantly upregulated, including progesterone,
deoxycorticosterone, chenodeoxycholic acid, corticosterone,
hyodeoxycholic acid, 11-dehydrocorticosterone, inosine
monophosphate (IMP), 3β-cholic acid and H-Phe-Trp-OH.
Argininosuccinic acid, N2-methylguanosine, 1,4-dihydro nicotinamide
adenine dinucleotide (NADH) and γ-Glu-Met were significantly
downregulated. The heatmap of differential metabolites is shown in
Fig. 2C. Upregulation of hormones
and hormone-related compounds, and bile acids, and downregulation
of dinucleotides, and organic acid and its derivatives were
observed. Correlation analysis was performed using Pearson's
correlation analysis, which revealed a high degree of correlation
between the significantly differentially present metabolites
(Fig. 2D).
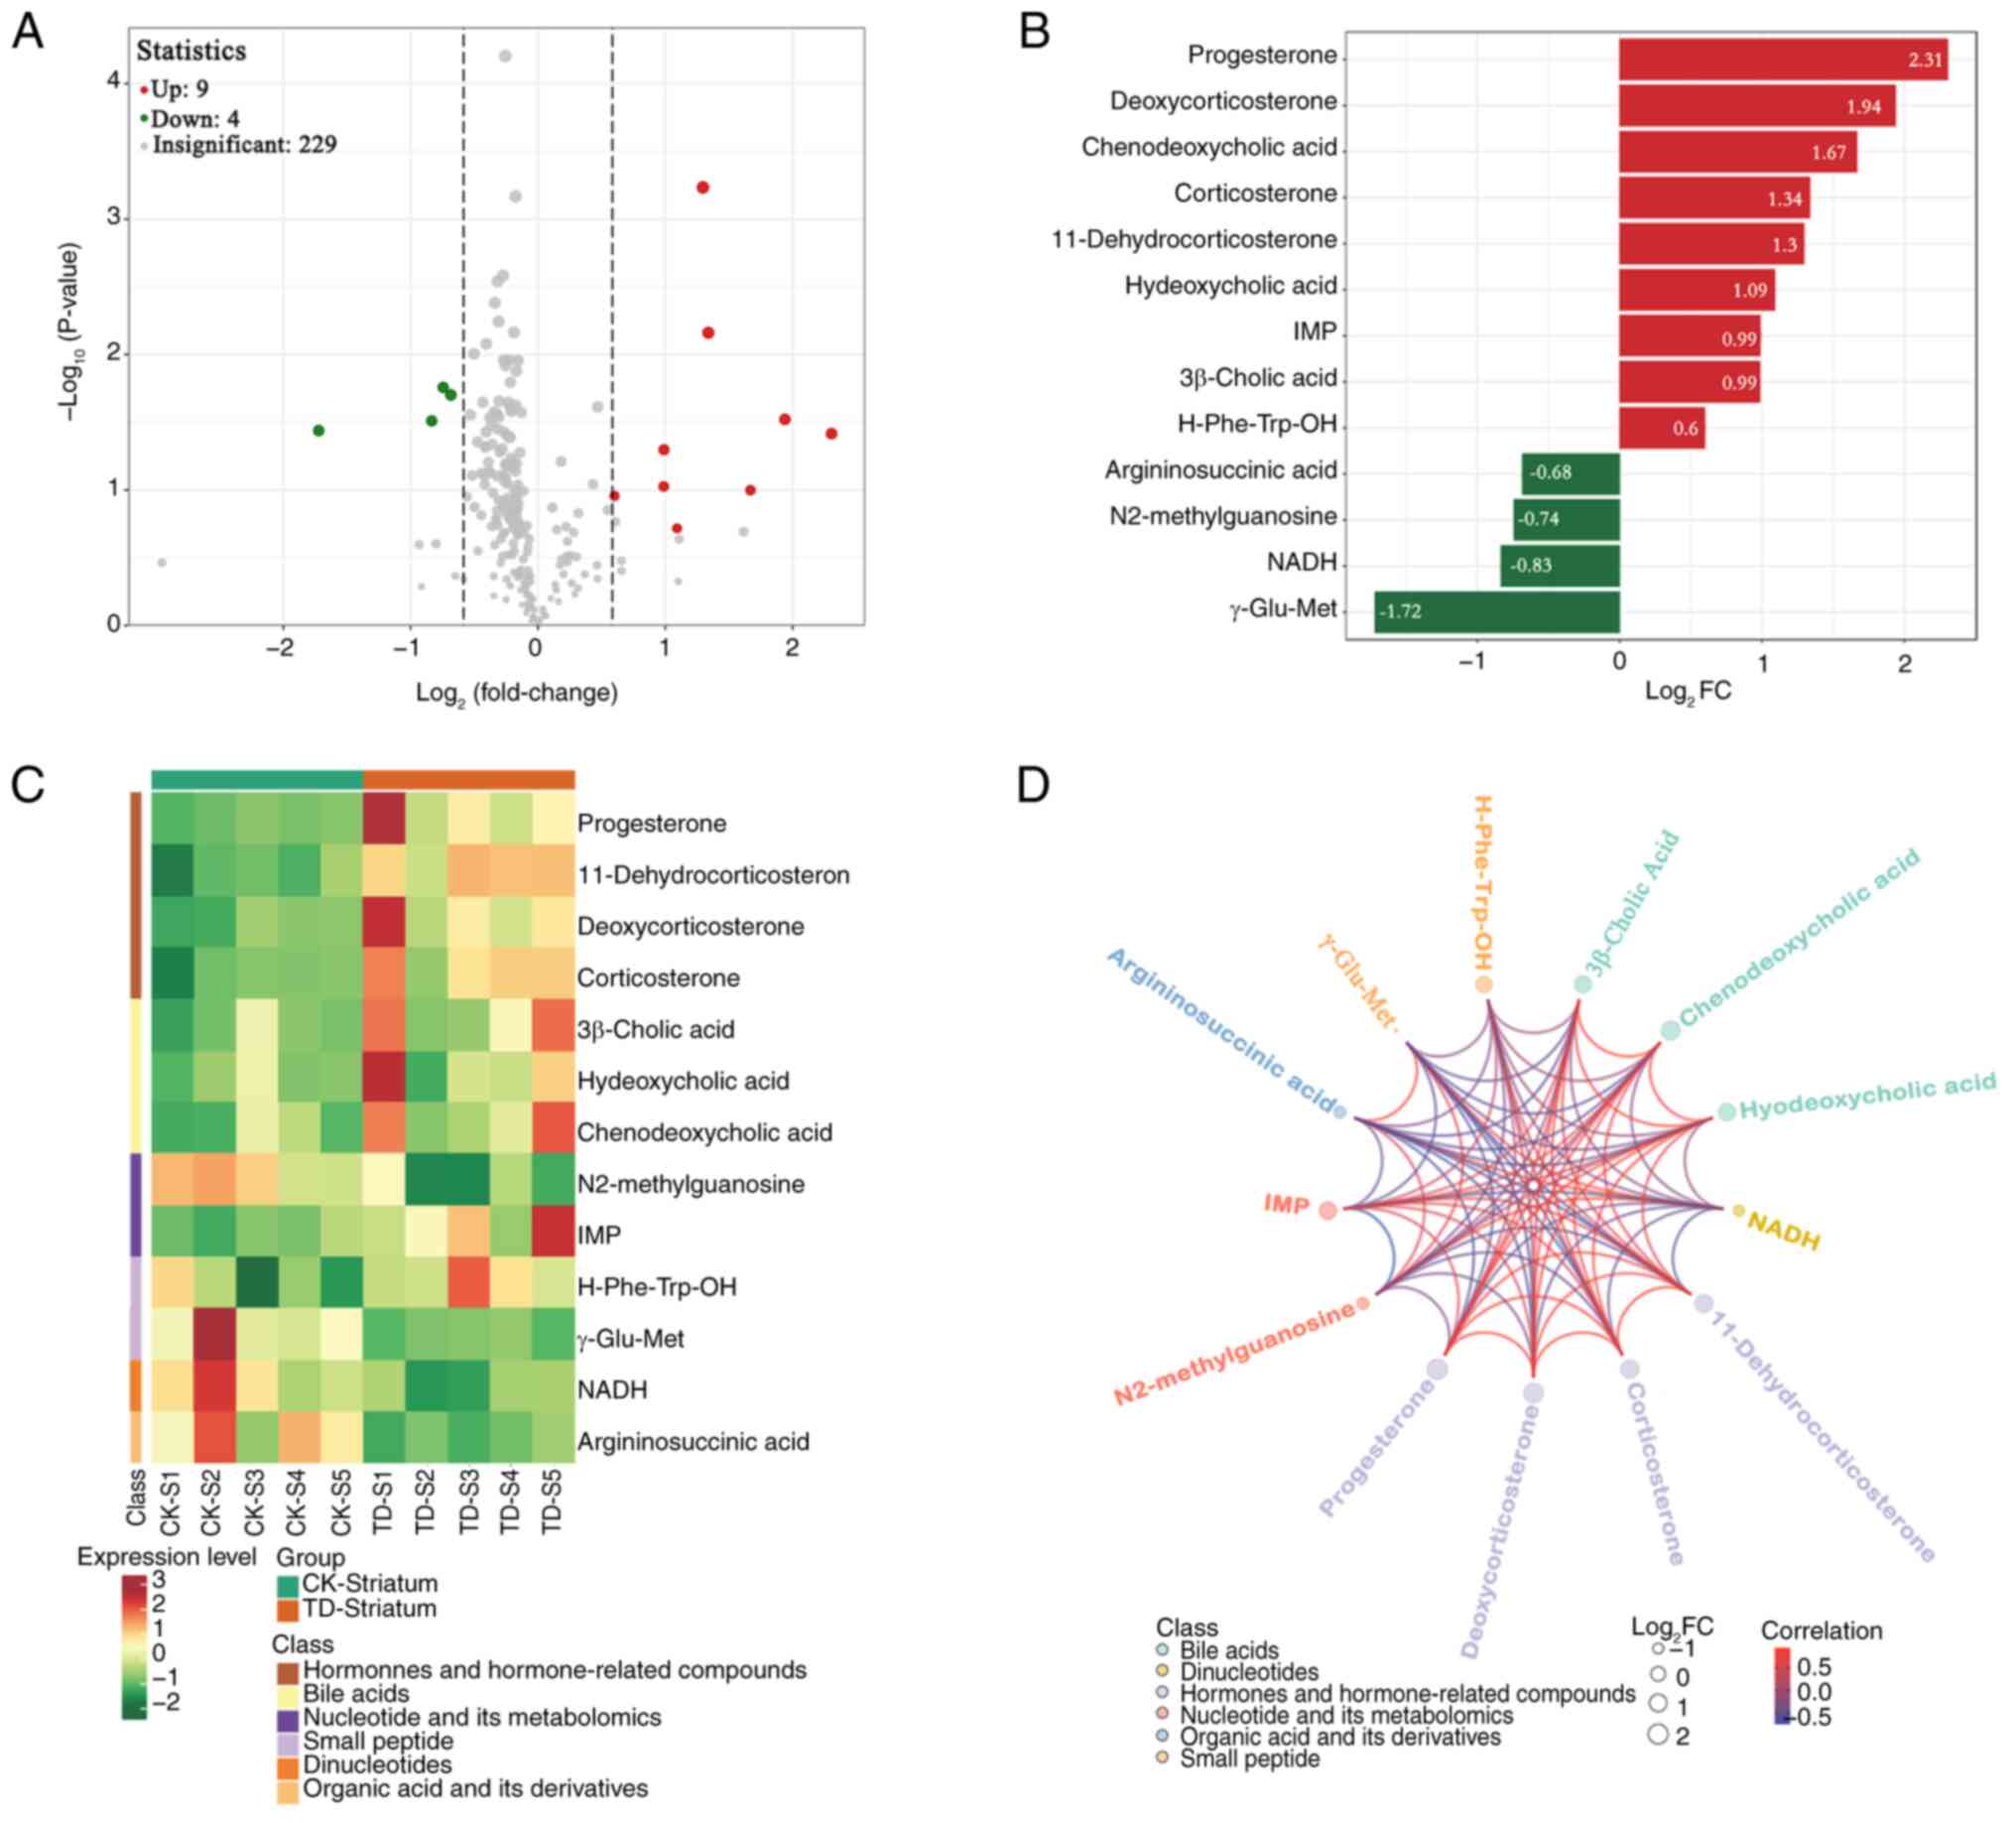 | Figure 2.Differentially present metabolites in
the striatum. (A) Volcano plot of metabolites. Each point
represents a metabolite. Red represents upregulated differentially
present metabolites, green represents downregulated differentially
present metabolites and grey represents metabolites not
differentially present. The abscissa represents the
log2FC of metabolites, the ordinate represents
the-log10(P-value). The size of each point corresponds
to the VIP value (from small to large, VIP of 0.4, 0.8, 1.2 and
1.6). (B) The 13 metabolites based on the FC. The abscissa is the
log2FC of the differentially present metabolites and the
ordinate shows the differential metabolites. Red represents
upregulated differentially present metabolites and green represents
downregulated differentially present metabolites. (C)
Differentially present metabolite heatmap. The cluster line at the
top of the figure is the sample cluster line and the cluster line
on the left is the metabolite cluster line. Different colors depict
different values obtained following standardization. Red represents
high expression levels and green represents low expression levels.
1–5, numbers of rats in the CK and TD groups. (D) Differentially
present metabolite chord diagram. The size of each point represents
the log2FC of the differentially present metabolites,
the color of each point indicates the metabolite classification as
per the key and the color of the lines represents the correlation
coefficient value of the differentially present metabolites in the
corresponding position. IMP, inosine monophosphate; NADH,
1,4-dihydro nicotinamide adenine dinucleotide; FC, fold change; CK,
control; S, striatum; TD, tic disorder; VIP, variable importance in
projection. |
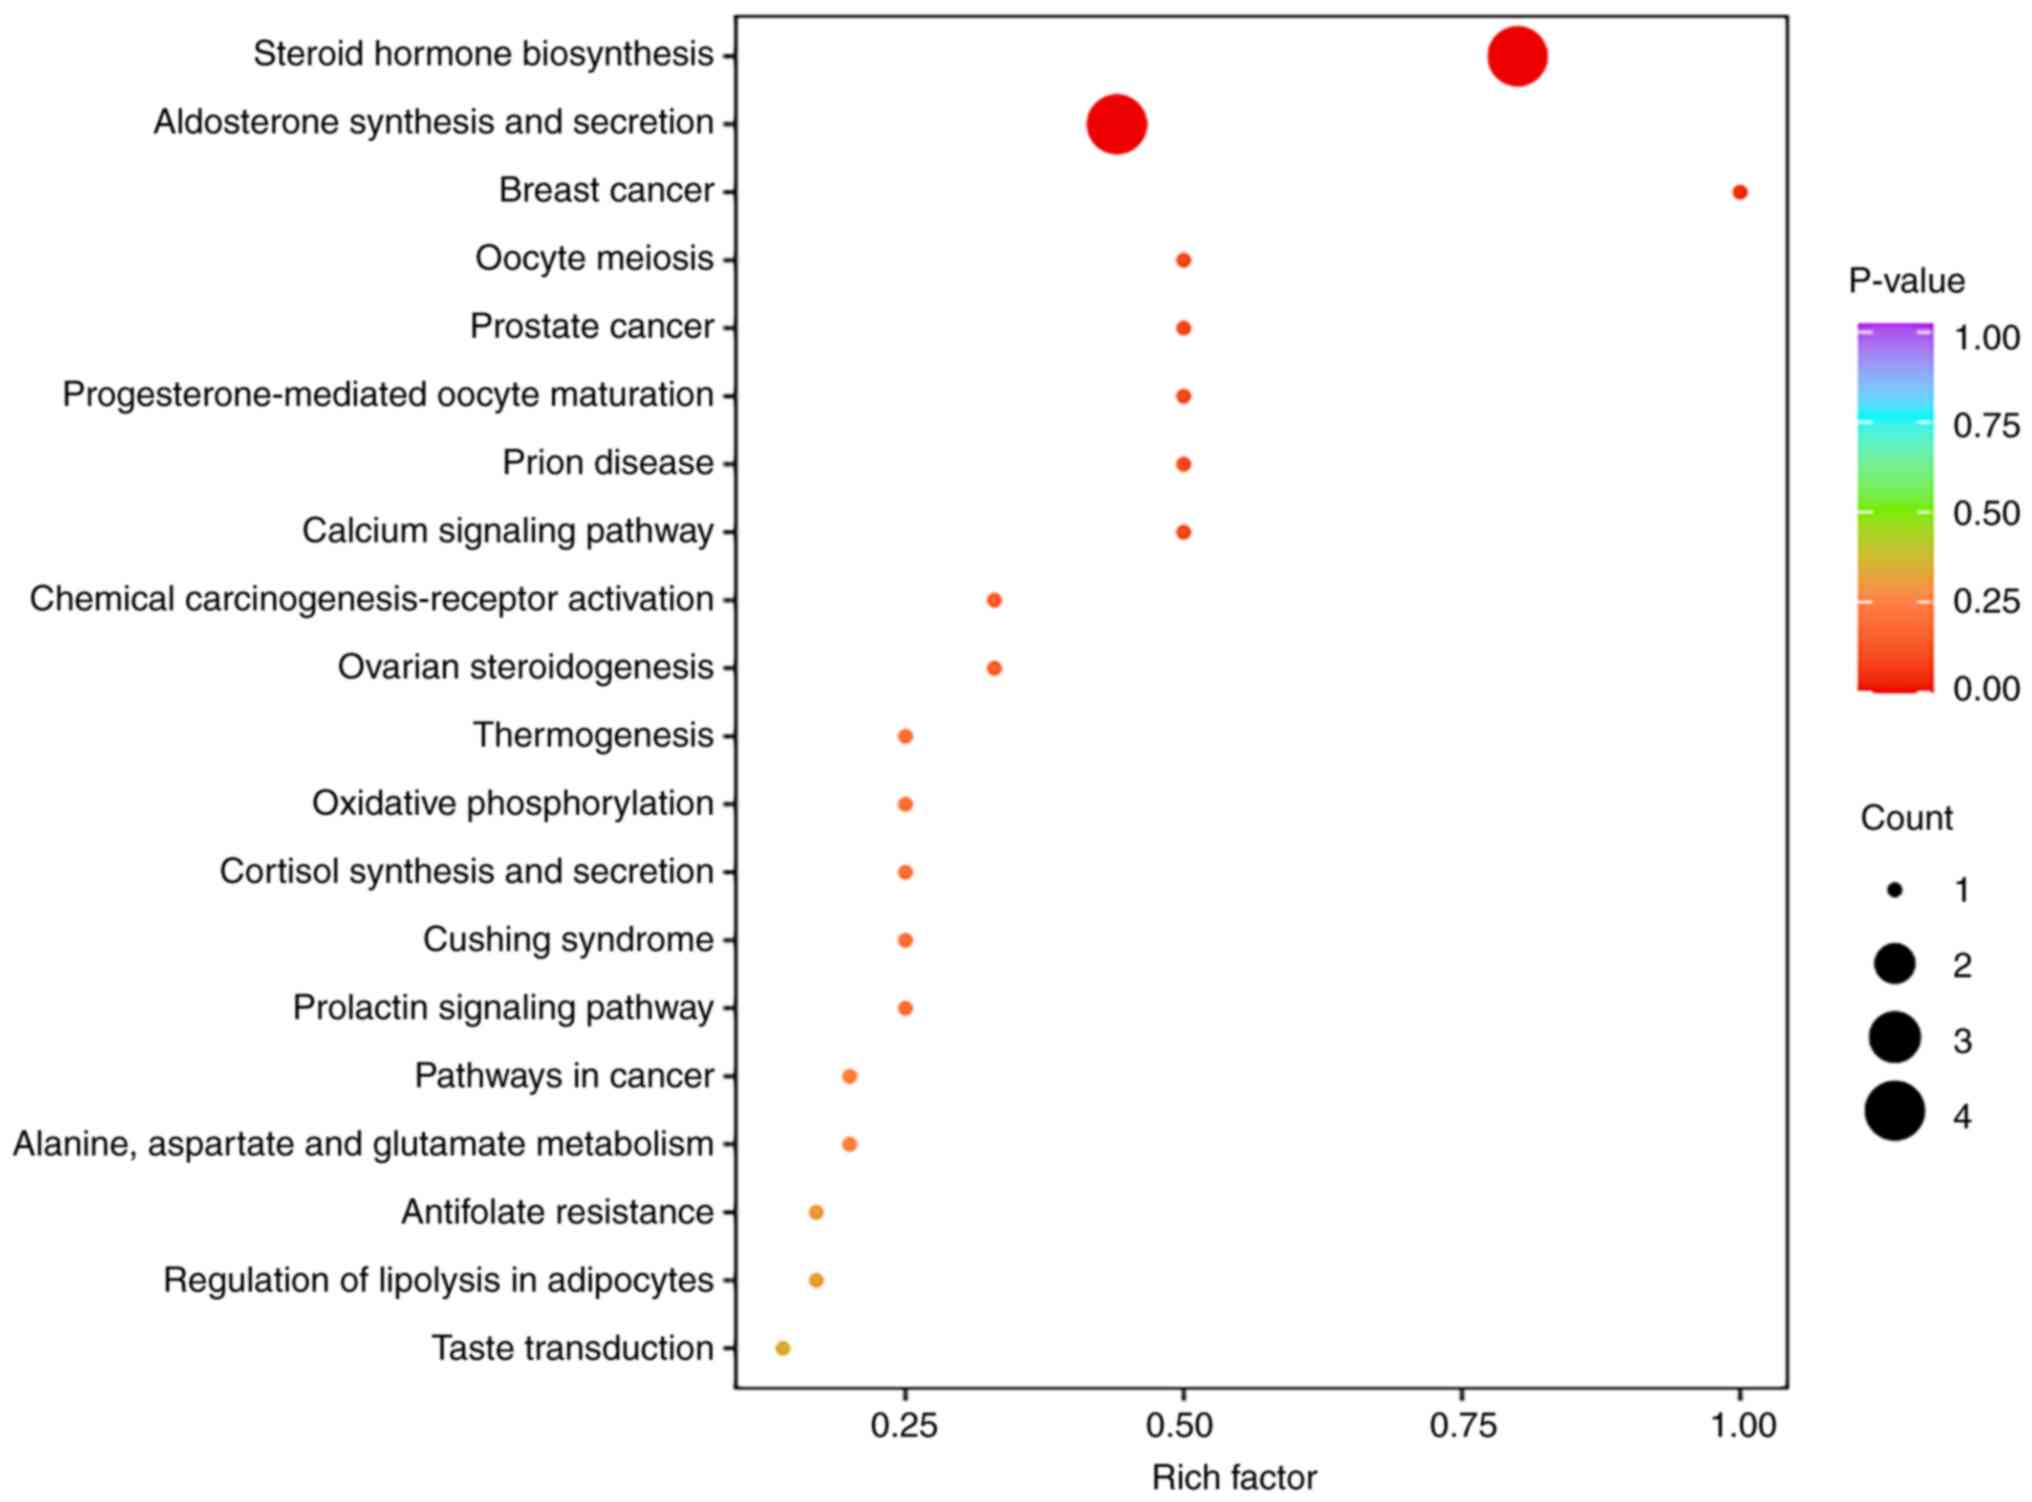
Differentially expressed metabolic pathways
KEGG pathway enrichment analysis was performed using
the differentially present metabolites (Fig. 3). Among the enriched pathways, the
‘steroid hormone biosynthesis’ pathway contained the most
significantly differentially present metabolites and exhibited a
high enrichment degree. Additionally, the ‘aldosterone synthesis
and secretion’ pathway was prominently enriched.
Metabolism in the cortex
Screening for differentially present
metabolites
There were 21 differentially present metabolites
between the CK and TD groups in the cortex (12 upregulated and 9
downregulated; Fig. 4A). After
conducting qualitative and quantitative analysis of the detected
metabolites, the FC of differences was calculated. The top 20
differentially present metabolites based on the FC are shown in
Fig. 4B. The upregulated
metabolites included progesterone, chenodeoxycholic acid,
deoxycorticosterone, octadecanedioate (C18),
11-dehydrocorticosterone, corticosterone, disodium
D-fructose-6-phosphate, hyodeoxycholic acid, 3β-cholic acid,
5-hydroxymethylcytidine, IMP and glycodeoxycholic acid. Adenine,
L-leucine-L-alanine, isobutyryl-L-CAR, isoleucyl-isoleucine, NADH,
kynurenine, γ-Glu-Met and 3-phenyllactic acid were significantly
downregulated. The heatmap of differential metabolites is shown in
Fig. 4C. Upregulated of bile
acids, and hormones and hormone-related compounds was observed.
Correlation analysis was performed using Pearson's correlation
analysis, which revealed a high degree of correlation between the
significantly differentially present metabolites (Fig. 4D).
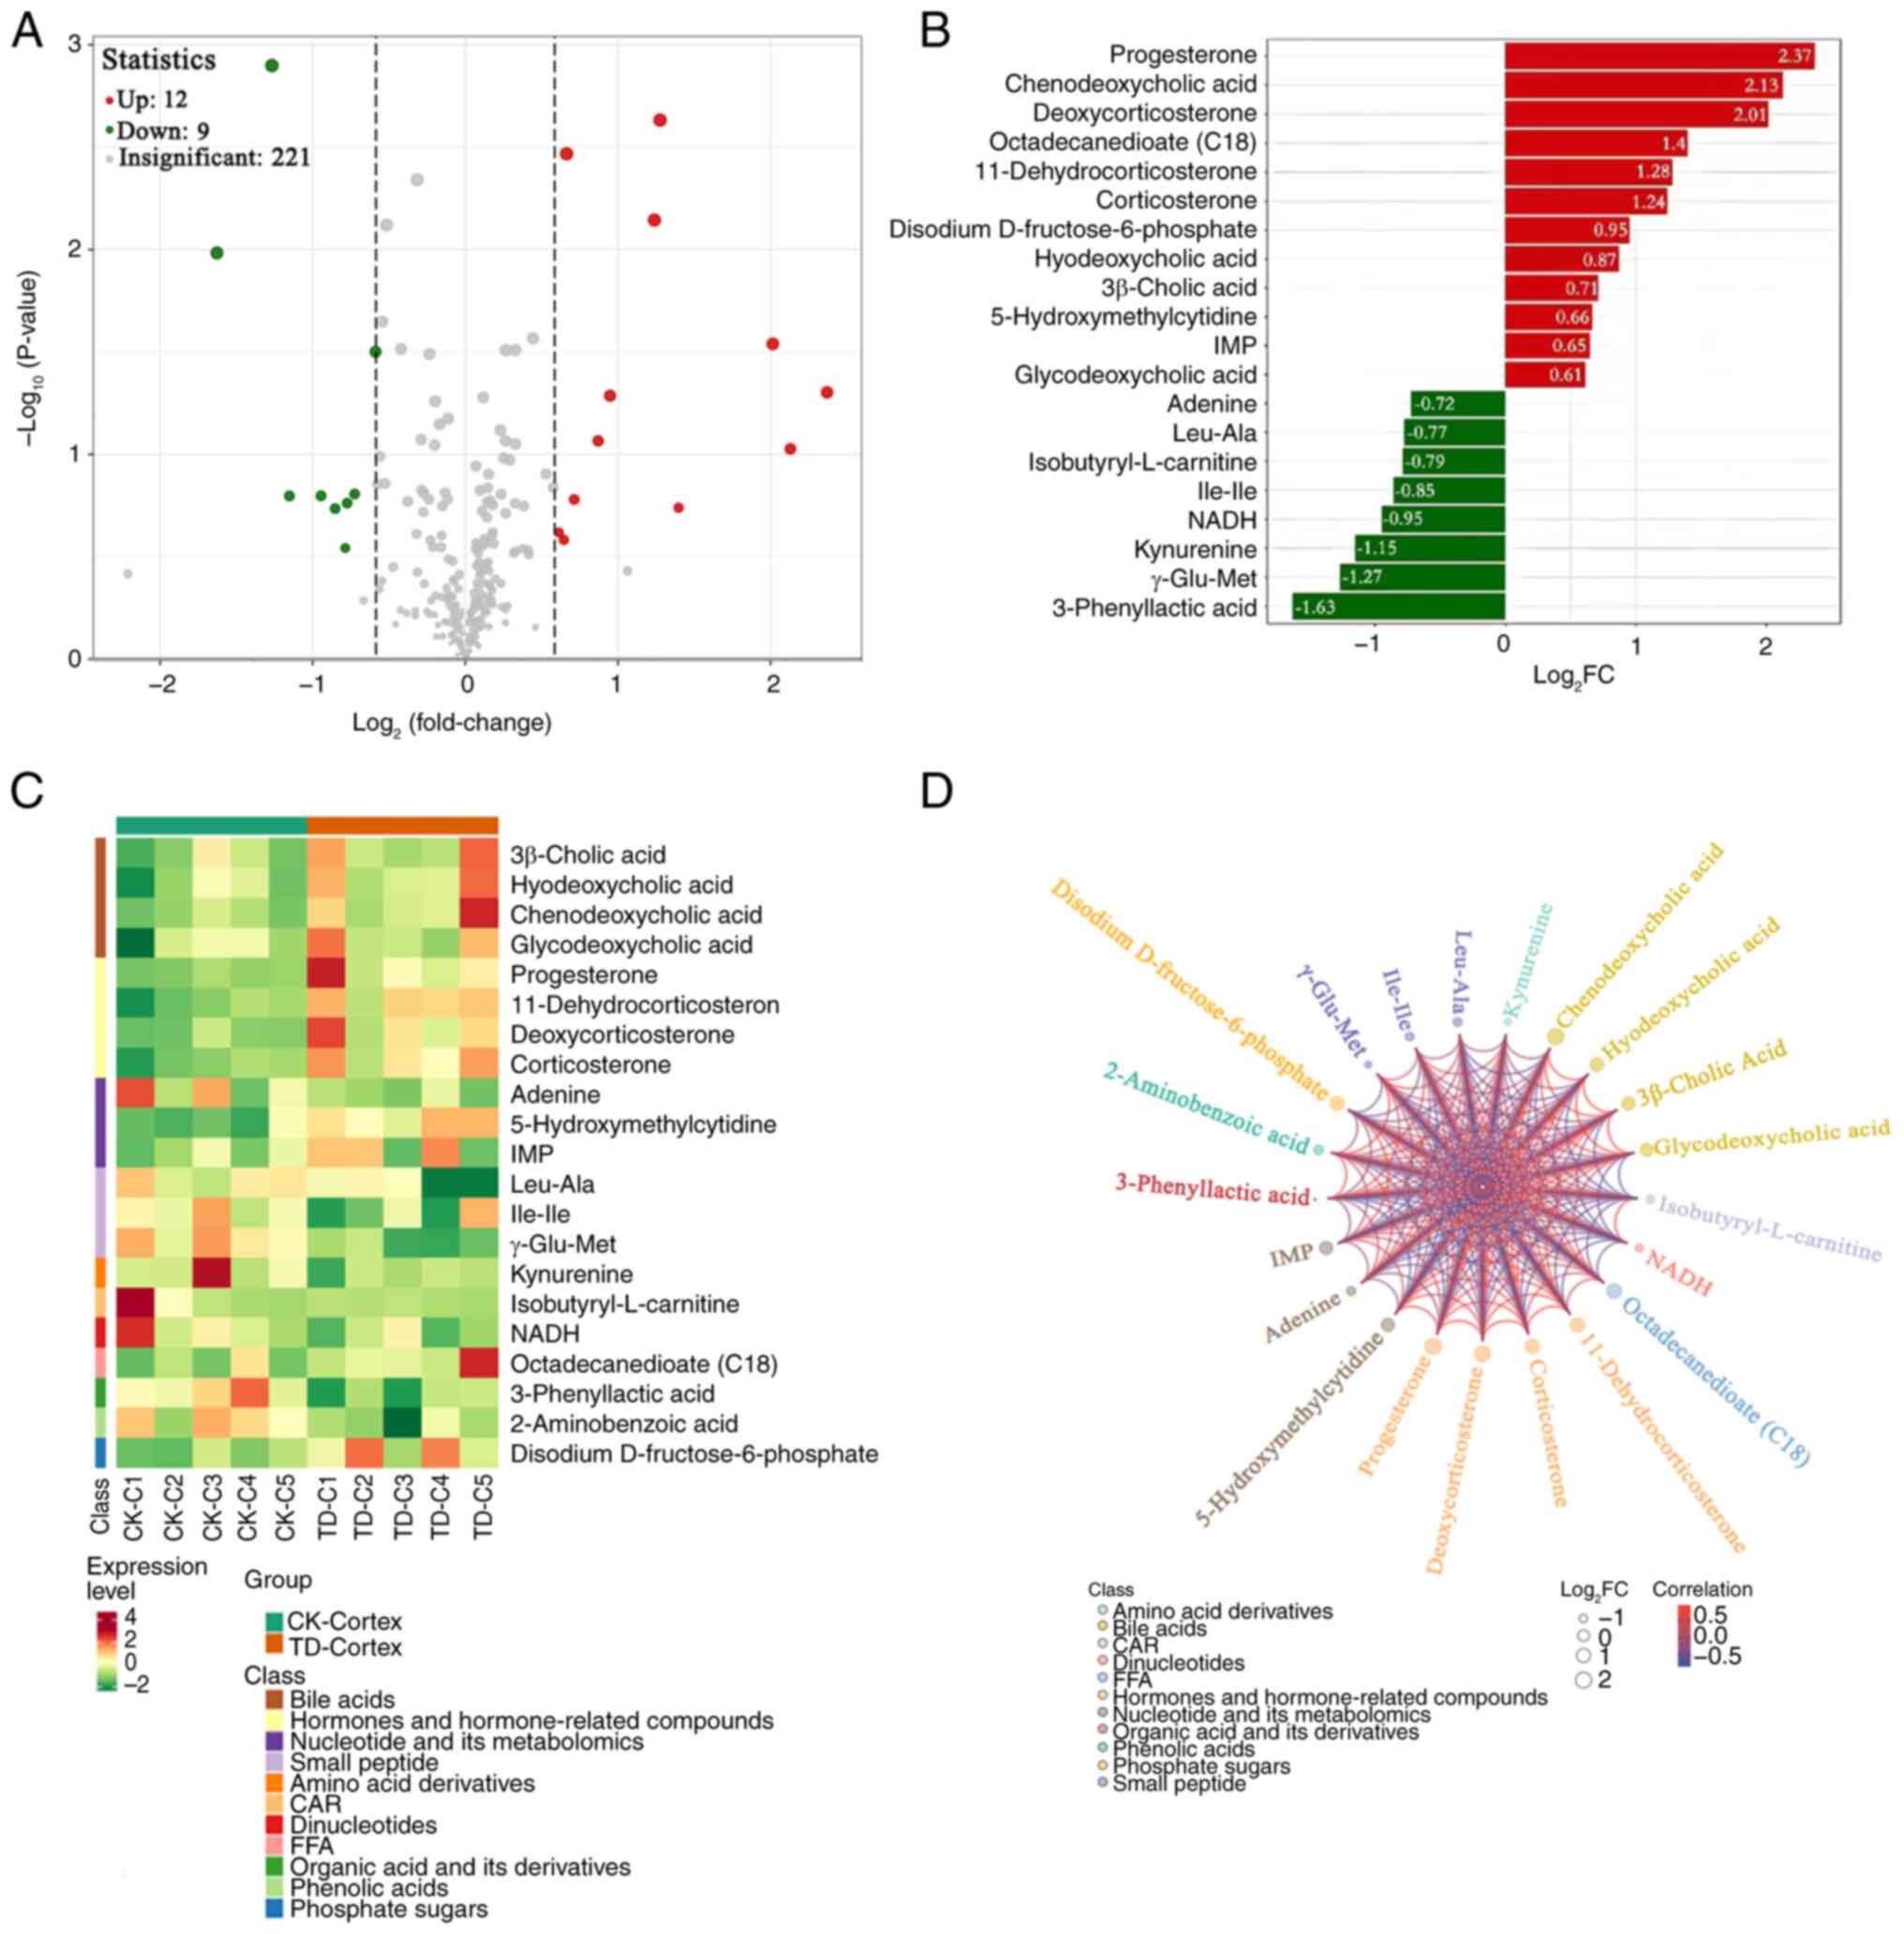 | Figure 4.Differentially present metabolites in
the cortex. (A) Volcano plot of metabolites. Each point represents
a metabolite. Red represents upregulated differentially present
metabolites, green represents downregulated differentially present
metabolites and grey represents metabolites not differentially
present. The abscissa represents the log2FC of
metabolites, the ordinate represents the-log10(P-value).
The size of each point corresponds to the VIP value (from small to
large, VIP of 0.4, 0.8, 1.2 and 1.6). (B) Top 20 metabolites based
on the FC. The abscissa is the log2FC of the
differentially present metabolites and the ordinate shows the
differential metabolites. Red represents upregulated differentially
present metabolites and green represents downregulated
differentially present metabolites. (C) Differentially present
metabolite heatmap. The cluster line at the top of the figure is
the sample cluster line and the cluster line on the left is the
metabolite cluster line. Different colors depict different values
obtained following standardization. Red represents high expression
levels and green represents low expression levels. 1–5, numbers of
rats in the CK and TD groups. (D) Differentially present metabolite
chord diagram. The size of each point represents the
log2FC of the differentially present metabolites, the
color of each point indicates the metabolite classification as per
the key and the color of the lines represents the correlation
coefficient value of the differentially present metabolites in the
corresponding position. C, cortex; IMP, inosine monophosphate;
NADH, 1,4-dihydro nicotinamide adenine dinucleotide; FC, fold
change; FFA, free fatty acid; CAR, acylcarnitine; CK, control; TD,
tic disorder; VIP, variable importance in projection. |
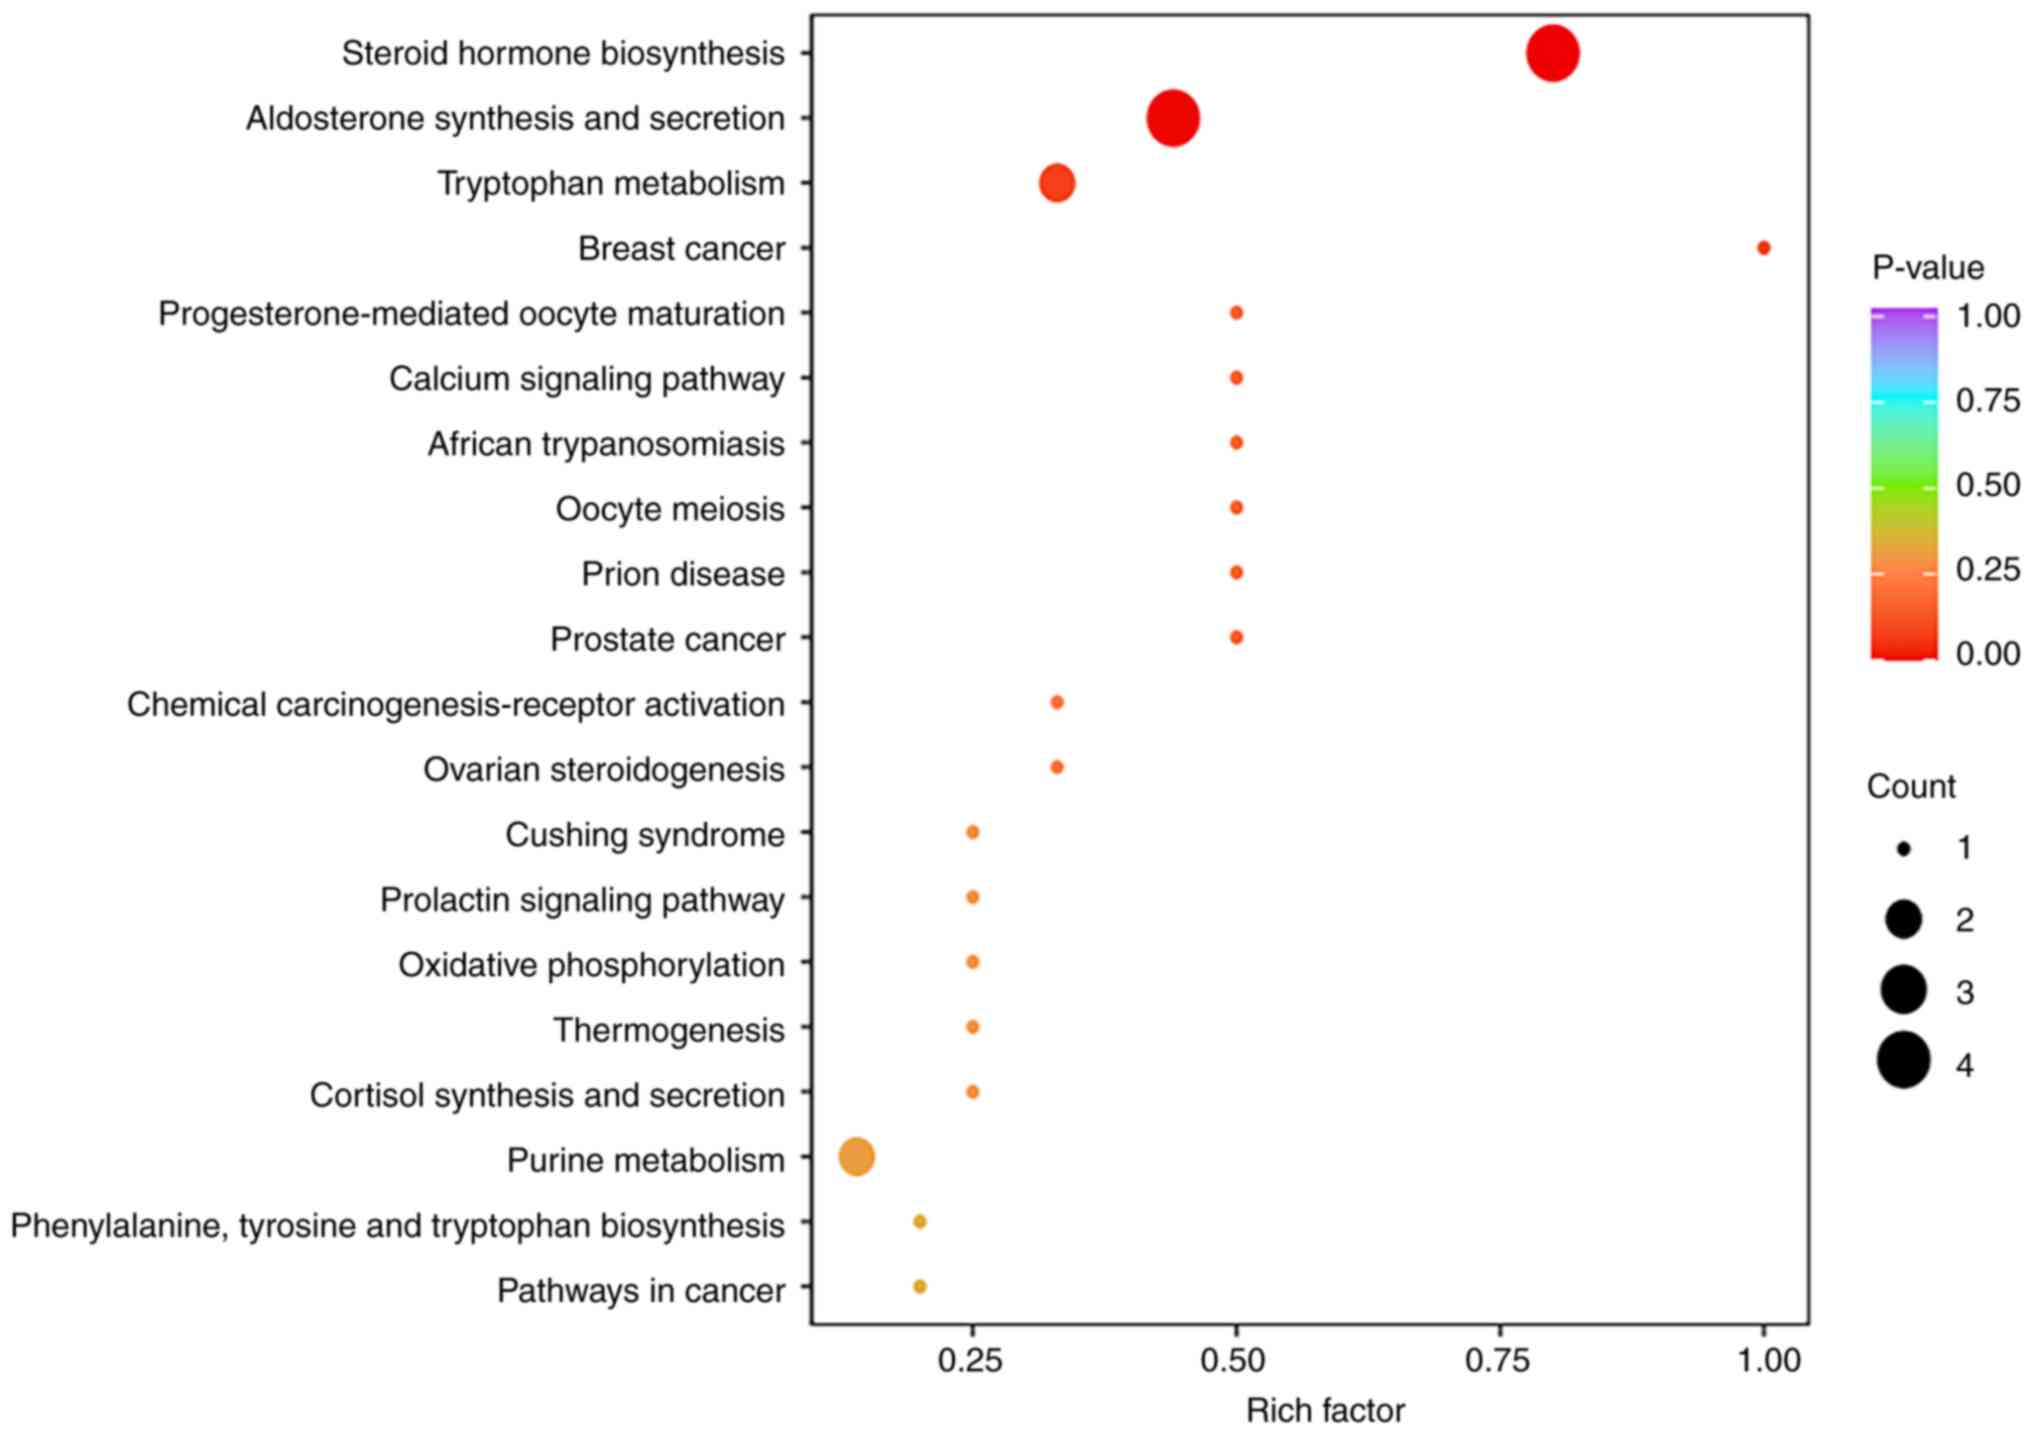
Differentially expressed metabolic pathways
The results of KEGG pathway enrichment analysis are
shown in Fig. 5. Notably, ‘steroid
hormone biosynthesis’, ‘aldosterone synthesis and secretion’ and
‘tryptophan metabolism’ contained more significantly differentially
present metabolites, and thus, had a higher degree of
enrichment.
Metabolism across the CSTC
circuit
Commonality in the CSTC circuit
In our previous study, the differentially present
metabolites and metabolic pathways in the thalamus were identified
(15). In the present study, by
analyzing the data, the common significantly differentially present
metabolites and metabolic pathways in the striatum, cortex and
thalamus were identified using a similar approach.
Common differentially present metabolites
Compared with the CK group, progesterone,
corticosterone, deoxycorticosterone, 11-dehydrocorticosterone,
chenodeoxycholic acid and hyodeoxycholic acid were commonly
upregulated in the striatum, cortex and thalamus in the TD group
(Fig. 6). Among these metabolites,
progesterone had the highest FC (Fig.
2B and Fig. 4B). Hormones and
hormone-related compounds, bile acids, nucleotides and their
metabolomics, small peptides, and organic acid and its derivatives
exhibited significant changes.
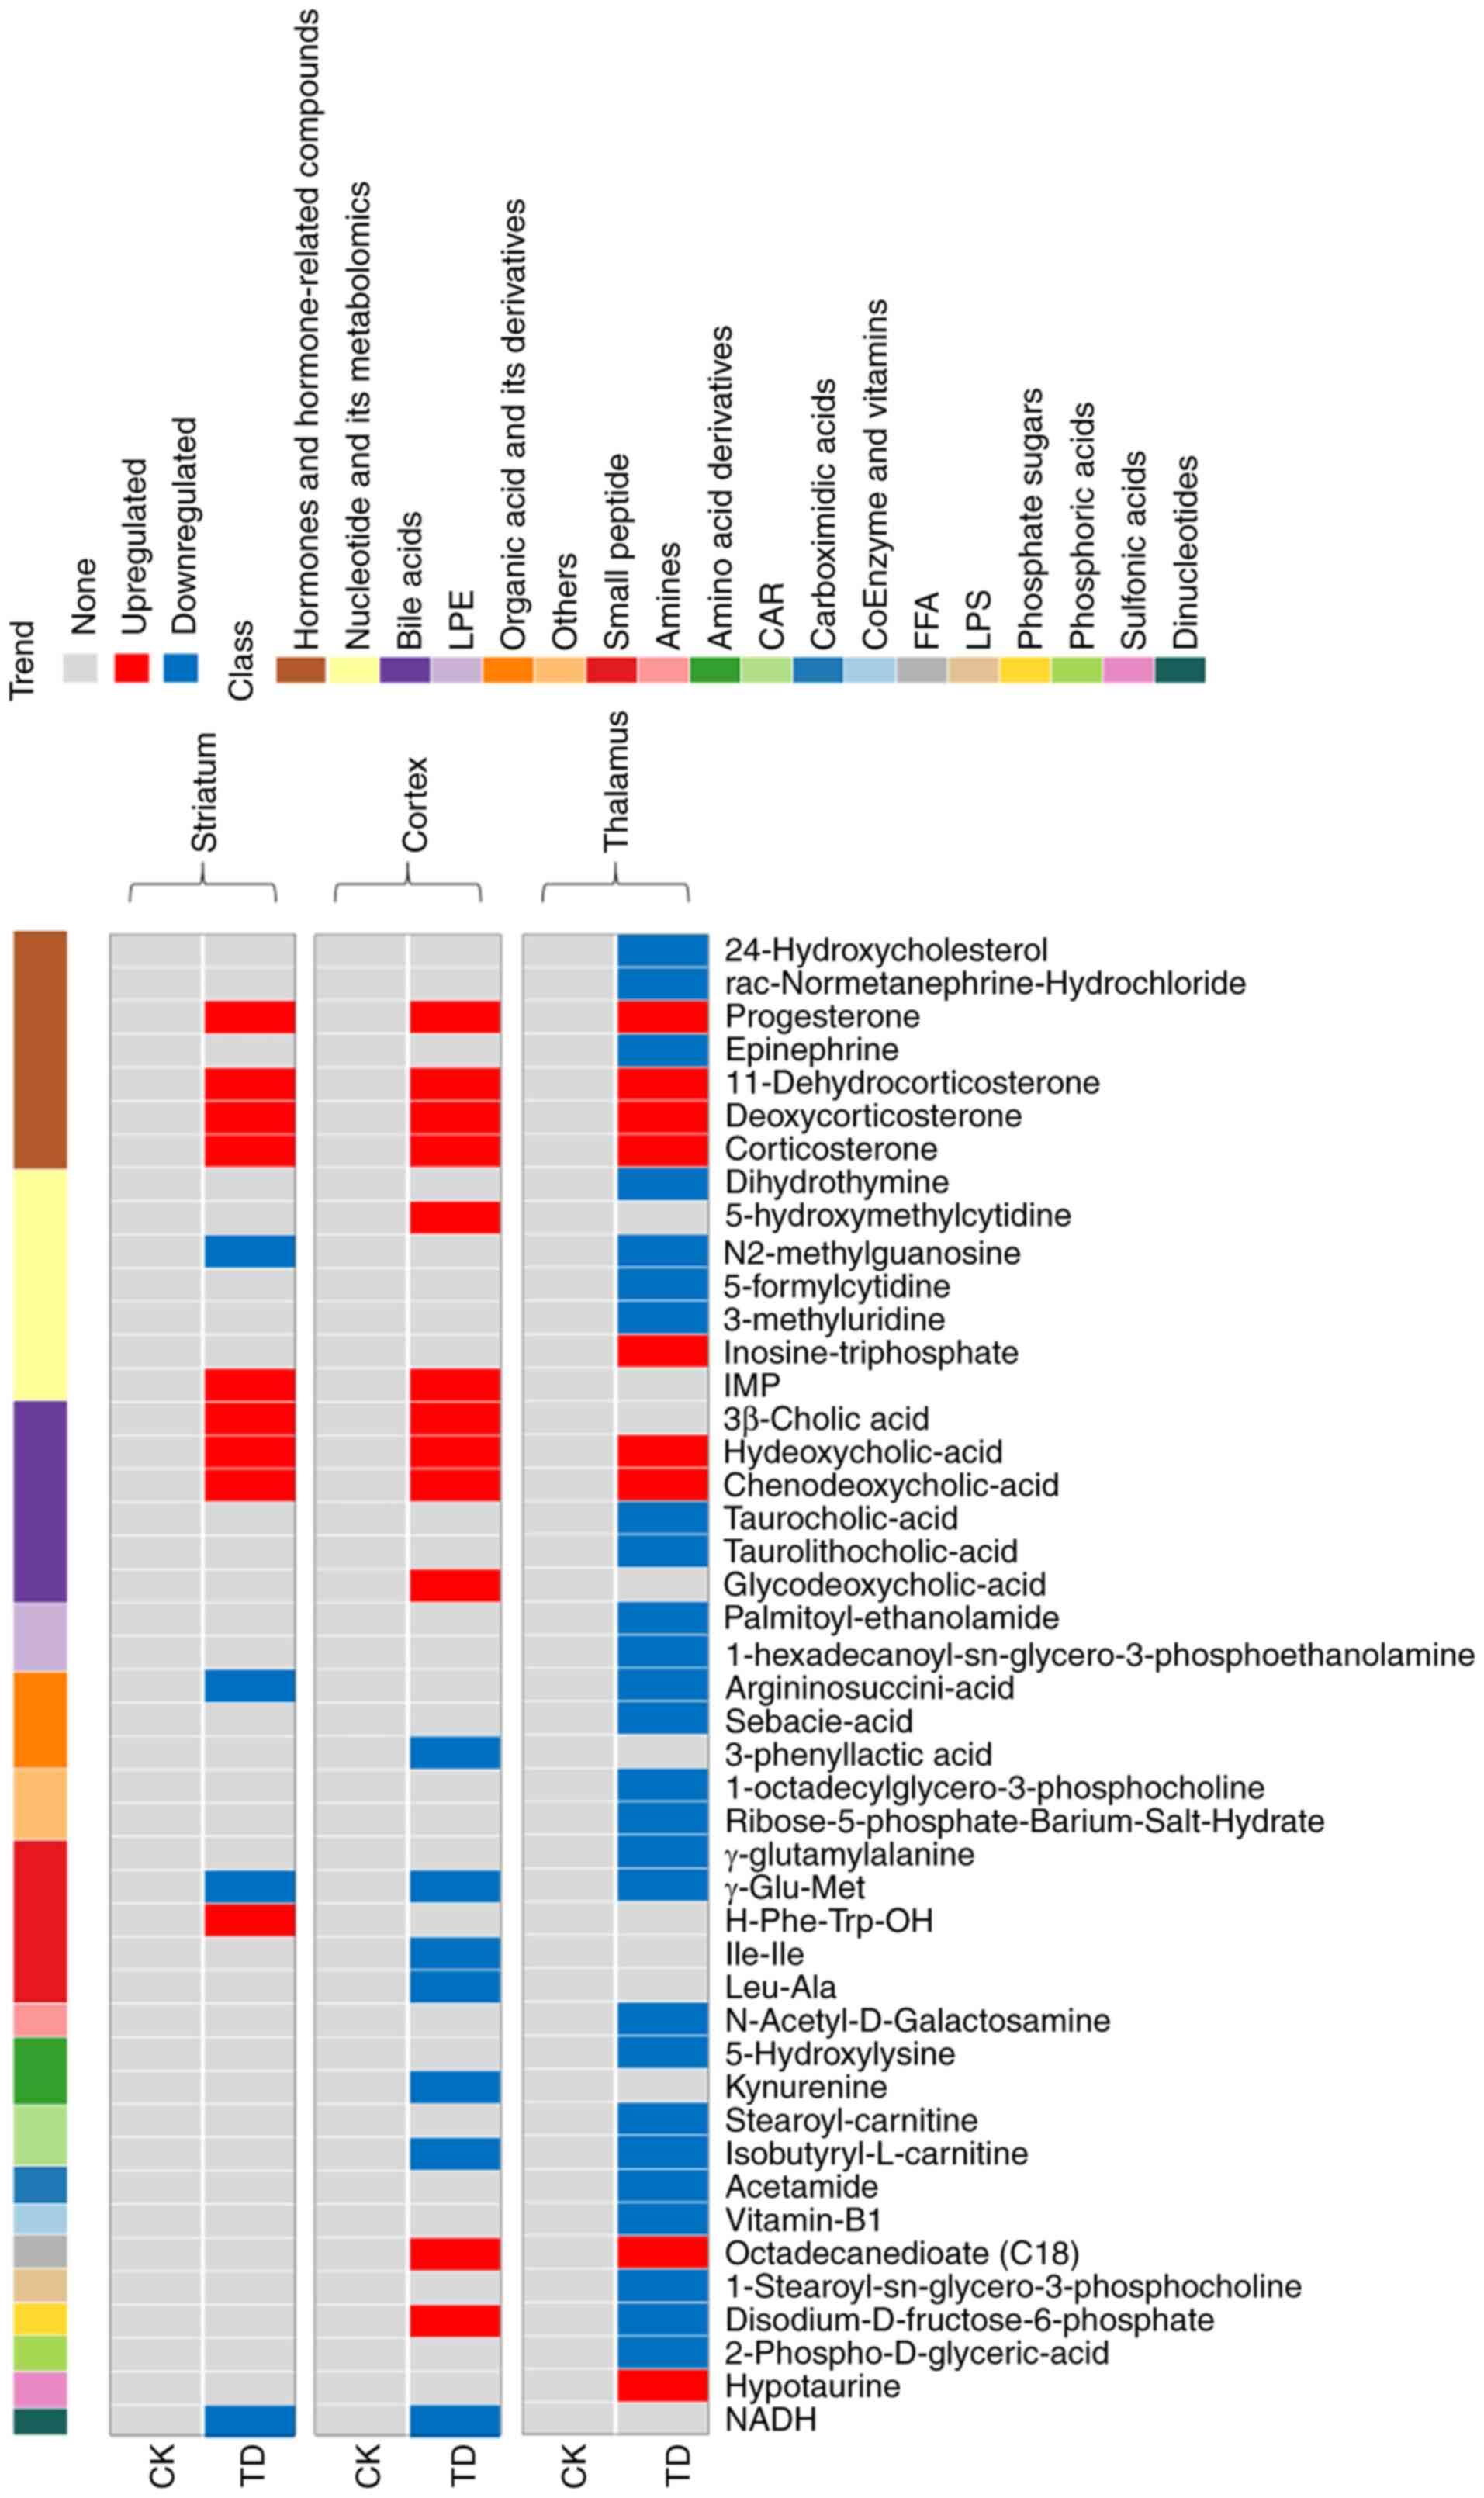 | Figure 6.Differentially present metabolites in
the three brain regions. The abscissa represents the differentially
present metabolites, the ordinate represents the sample group on
the left and the brain region on the right, and the cluster line at
the top is the metabolite cluster line. Red represents upregulated
differentially present metabolites and blue represents
downregulated differentially present metabolites. The data for the
thalamus were from our previous study (15). LPE, lysophosphatidylethanolamine;
CAR, acylcarnitine; FFA, free fatty acid; LPC,
lysophosphatidylcholine; CK, control; TD, tic disorder; IMP,
inosine monophosphate; NADH, 1,4-dihydro nicotinamide adenine
dinucleotide. |
Common differentially expressed metabolic
pathways
In the CSTC circuit, ‘steroid hormone biosynthesis’
and ‘aldosterone synthesis and secretion’ were common
differentially expressed metabolic pathways (Fig. 3 and Fig. 5).
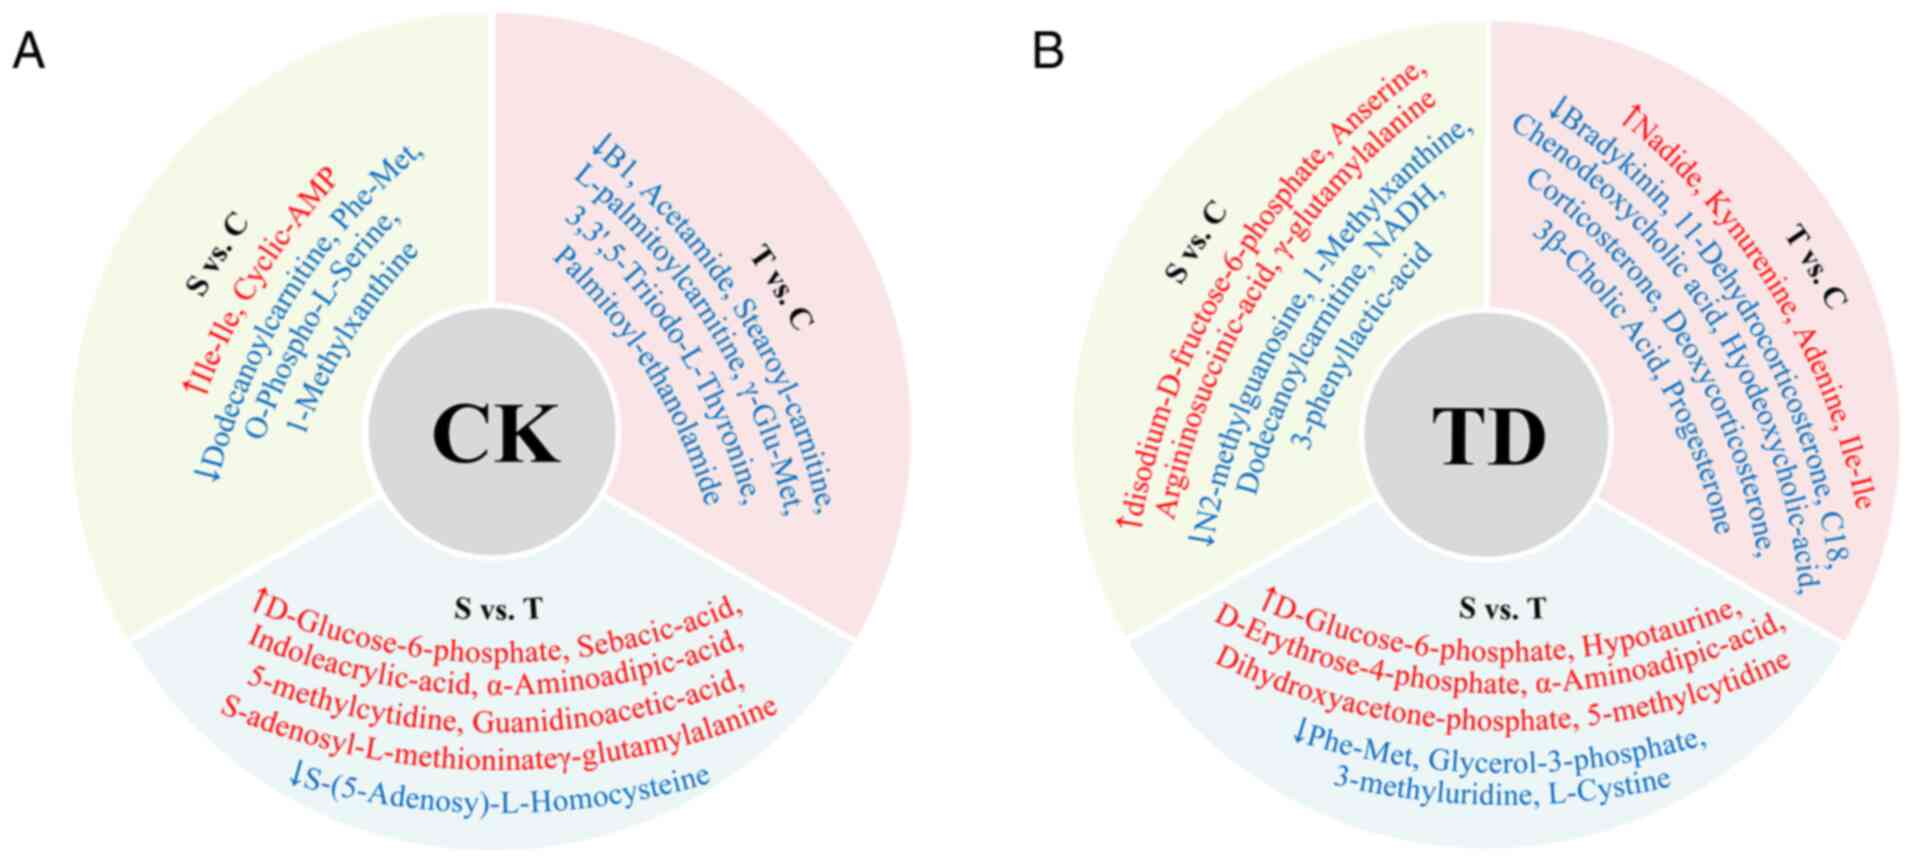
Differences in the CSTC circuit
Differentially present metabolites in the CK
group
In the CK group, there were 43 differentially
present metabolites between the cortex and striatum, 43
differentially present metabolites between the cortex and thalamus,
and 44 differentially present metabolites between the thalamus and
striatum (Fig. S1). The specific
differentially present metabolites among the different areas of the
brain are shown in Fig. 7A.
Differentially present metabolites in the TD
group
In the TD group, there were 33 differentially
present metabolites between the cortex and striatum, 24
differentially present metabolites between the cortex and thalamus,
and 24 differentially present metabolites between the thalamus and
striatum (Fig. S2). The specific
differentially present metabolites among the different areas of the
brain are shown in Fig. 7B.
Differences in the metabolic pathways in the CSTC
circuit
The difference in enriched pathways was the
enrichment of the ‘tryptophan metabolism’ pathway, which was only
observed in the cortex (Fig. 3 and
Fig. 5).
Discussion
The present study utilized UPLC-MS/MS technology to
measure the levels of metabolites in the CK and TD groups.
Subsequently, PCA, OPLS-DA, VIP, FC, cluster analysis, K_means,
KEGG and DA score analyses were performed to determine the
differences in the metabolite levels between the groups and the
different regions, and to explore the related metabolic pathways.
In our previous study, compared with the CK group, the steroid
hormone biosynthesis pathway, primary bile acid biosynthesis
pathway, and aldosterone synthesis and secretion pathway contained
more significantly differentially present metabolites in the
thalamus in the TD group (15). In
the CSTC circuit, the common differentially present metabolites
included progesterone, corticosterone, deoxycorticosterone,
11-dehydrocorticosterone, chenodeoxycholic acid and hyodeoxycholic
acid. Among these metabolites, progesterone had the highest FC. The
common differentially present metabolite classes included bile
acids, and hormones and hormone-related compounds. The common
differentially expressed metabolic pathways included ‘steroid
hormone biosynthesis’ and ‘aldosterone synthesis and
secretion’.
Progesterone is a neuroactive steroid that is
synthesized in astrocytes (35),
and can modulate the interaction between Glu and dopamine systems
in the striatum (36), and the
plasticity of neurons and astrocytes (37). TD is associated with neuronal
hyperactivity (38) and
perturbations in astrocytic-neuronal coupling systems (39). Striatal dopamine system dysfunction
is also associated with TD (14).
Consequently, progesterone may be involved in the pathogenesis of
TD via the altered neuronal activity, the astrocytic-neuronal
coupling systems and the dopamine system. Corticosterone can
modulate the GABAergic pathway (40). Dysfunction of cortical GABA is
related to the premonitory urges in TD (18,19).
Progesterone, deoxycorticosterone and 11-dehydrocorticosterone are
related to corticosterone synthesis. Progesterone is converted to
deoxycorticosterone catalyzed by 21-hydroxylase (41), deoxycorticosterone is converted to
corticosterone catalyzed by 11β-hydroxylase (42), and 11β-hydroxysteroid dehydrogenase
catalyzes the interconversion of active corticosterone and inert
11-dehydrocorticosterone (43).
Progesterone, corticosterone, deoxycorticosterone and
11-dehydrocorticosterone are all steroid hormones. In the TD group,
these steroid hormone metabolites were significantly upregulated
and ‘steroid hormone biosynthesis’ was a significantly enriched
metabolic pathway. Therefore, the ‘steroid hormone biosynthesis’
pathway may be implicated in the pathogenesis of TD via the
GABAergic pathway. Stress is related to the expression and severity
of tics in TD (44), and chronic
stress is a triggering factor of TD (45). Corticosterone is the primary stress
response hormone in rats (46),
while cortisol is the primary stress response hormone in humans
(47) and the
hypothalamic-pituitary-adrenal (HPA) axis is the central stress
response system in humans (48). A
clinical trial showed that patients with TD had higher plasma
cortisol levels during stress response (48). A previous study reported that in
children at high risk for developing tics, children who developed
tics had a higher hair cortisol concentration 5 months before the
onset of tics than children without tics (49). Additionally, within 2–5 months
before tic onset, for each 1 pg/mg higher hair cortisol
concentration, the relative probability of the onset of tics
increased by 30% (49). Therefore,
the steroid hormone biosynthesis pathway and the HPA axis may be
critical in the pathogenesis of TD via the induction of chronic
stress.
The ‘aldosterone synthesis and secretion’ pathway
was identified as a significant metabolic pathway in the TD group.
Corticosterone can also be converted to aldosterone, which is
catalyzed by aldosterone synthase (50). Increased corticosterone levels may
affect the aldosterone synthesis and secretion pathway. Aldosterone
is a corticosteroid involved in salt and ionic homeostasis that
serves an essential role in maintaining water and salt balance and
regulating vasoconstriction (51).
Aldosterone can be detected in physiological fluids such as blood
and saliva (51,52). A study reported that aldosterone
levels in the saliva were increased under conditions of
psychological stress in children aged 8–11 years following soccer
matches when playing against unknown competitors (52). In TD, the aldosterone synthesis and
secretion pathway may be associated with the increased
corticosterone levels due to the high physical stress of tics and
co-morbidities. Thus, the aldosterone synthesis and secretion
pathway may serve important roles in the pathogenesis of TD.
Chenodeoxycholic acid and hyodeoxycholic acid are
bile acids that can pass through the BBB (53) and can be detected in the brain
(54). In the TD group,
chenodeoxycholic acid and hyodeoxycholic acid were significantly
upregulated. A persistent increase in glucocorticoid levels
increases the absorption of bile acid by increasing the expression
of apical sodium-dependent bile acid transporter in the ileum, to
raise the plasma levels and reduce fecal loss of bile acids
(55), which may lead to an
increase in the intracerebral level of bile acids. Corticosterone,
deoxycorticosterone and 11-dehydrocorticosterone are all
glucocorticoids, which were upregulated in the TD group. The
increased levels of these glucocorticoids may be the reason for the
increased chenodeoxycholic acid and hyodeoxycholic acid levels.
Finally, a notable result was the abnormality of the
‘tryptophan metabolism’ pathway, which was only observed in the
cortex of the TD group. A key pathway of tryptophan metabolism is
the kynurenine pathway (56). The
kynurenine pathway produces a series of metabolites that impact
human inflammation, immune response and the central nervous system
(57). In the present study,
kynurenine levels in the cortex were lower in the TD group compared
with the CK group. Kynurenine is an intermediate during the
synthesis of NAD+ from tryptophan, which is neuroactive
and may affect Glu N-Methyl-D-aspartate (NMDA) receptor signaling
and glutamatergic neurotransmission (58). The abnormality of the tryptophan
metabolism pathway can influence the Glu NMDA receptor by affecting
the levels of kynurenine, inducing abnormal glutamatergic
neurotransmission (58). A
previous study used α-[11C]methyl-L-tryptophan (AMT) positron
emission tomography to assess tryptophan metabolism in the brain,
and the results revealed that AMT uptake was decreased in the
bilateral dorsolateral prefrontal cortex and increased in the
thalamus, demonstrating the abnormality in tryptophan metabolism in
the cortex and subcortex (21).
Therefore, the tryptophan metabolism pathway may be involved in the
pathogenesis of TD in the cortex by affecting Glu NMDA receptor
signaling and glutamatergic neurotransmission.
The present study considered the commonalities and
differences of metabolic abnormalities in the different regions of
the brain in the CSTC circuit, revealing the general regularity in
the CSTC circuit and unique cortical changes. In the CSTC circuit,
the upregulation of progesterone, corticosterone,
deoxycorticosterone and 11-dehydrocorticosterone was a common
regularity. ‘Steroid hormone biosynthesis’ and ‘aldosterone
synthesis and secretion’ were commonly dysregulated pathways in the
CSTC circuit. These common changes may be involved in the
pathogenesis of TD by altering neuronal activity, neurotransmitter
activity and chronic stress. In the cortex, the tryptophan
metabolism pathway may be involved in the pathogenesis of TD by
affecting the transmission of neurotransmitter activity.
The present study has some limitations. First, the
analysis of metabolites focused on the CSTC circuit only and did
not examine the distinction between intracellular and extracellular
metabolites in the local brain parenchyma. In the future,
experiments will be performed at the cellular level, focusing on
the distinction between intracellular and extracellular metabolites
in local brain parenchyma. Secondly, metabolite levels in the CSTC
circuit were investigated using metabolomics. However, the enzymes,
receptors and transporters in the metabolic circuit and the
morphologic changes in the circuitry were not further investigated.
A more comprehensive study is required to understand the potential
network-level mechanism in TD. Finally, there is bidirectional
communication between the gut flora and the central nervous system.
Metabolites such as bile acids and 5-hydroxytryptophan can pass
through the BBB, serving a role in regulating brain function,
neurodevelopment and aging (59–61).
In the future, experiments should focus on the gut flora and the
gut-brain axis to gain an improved understanding of the
pathogenesis of TD.
Supplementary Material
Supporting Data
Acknowledgements
Not applicable.
Funding
The present study was supported by grants from the National
Natural Science Foundation of China (grant nos. 82205192 and
82004418), Zhejiang Medical Health Science and Technology Program
(grant no. 2022RC280) and Shaoxing University College-Level
Research Projects (grant nos. 20205038 and 2020LG1007).
Availability of data and materials
The data generated in the present study may be found
in the European Molecular Biology Laboratory-European
Bioinformatics Institute MetaboLights database under accession
number MTBLS11764 or at the following URL: https://www.ebi.ac.uk/metabolights/MTBLS11764.
Authors' contributions
JH and JY designed the study and wrote the
manuscript. JH, JY, GY and GX performed the experiments. JS, ZZ, YW
and XZ analyzed the data. JH and JY confirmed the authenticity of
all the raw data. All authors have read and approved the final
manuscript.
Ethics approval and consent to
participate
The present study was approved by the Xin Hua
Hospital Ethics Committee Affiliated to Shanghai Jiao Tong
University School of Medicine (approval no. XHEC-F-2023-005;
Shanghai, China). All applicable international, national and
institutional guidelines for the care and use of animals were
followed.
Patient consent for publication
Not applicable.
Competing interests
The authors declare that they have no competing
interests.
References
|
1
|
Greene DJ, Koller JM, Robichaux-Viehoever
A, Bihun EC, Schlaggar BL and Black KJ: Reward enhances tic
suppression in children within months of tic disorder onset. Dev
Cogn Neurosci. 11:65–74. 2015. View Article : Google Scholar : PubMed/NCBI
|
|
2
|
Liu S, Tian M, He F, Li J, Xie H, Liu W,
Zhang Y, Zhang R, Yi M, Che F, et al: Mutations in ASH1L confer
susceptibility to Tourette syndrome. Mol Psychiatry. 25:476–490.
2020. View Article : Google Scholar : PubMed/NCBI
|
|
3
|
Atkinson-Clement C, Porte CA, de Liege A,
Delorme C, Beranger B, Valabregue R, Gallea C, Robbins TW, Hartmann
A and Worbe Y: Impulsive prepotent actions and tics in Tourette
disorder underpinned by a common neural network. Mol Psychiatry.
26:3548–3557. 2021. View Article : Google Scholar : PubMed/NCBI
|
|
4
|
Ricketts EJ, Woods DW, Espil FM, McGuire
JF, Stiede JT, Schild J, Yadegar M, Bennett SM, Specht MW, Chang S,
et al: Childhood predictors of long-term tic severity and tic
impairment in Tourette's disorder. Behav Ther. 53:1250–1264. 2022.
View Article : Google Scholar : PubMed/NCBI
|
|
5
|
Hirschtritt ME, Lee PC, Pauls DL, Dion Y,
Grados MA, Illmann C, King RA, Sandor P, McMahon WM, Lyon GJ, et
al: Lifetime prevalence, age of risk, and genetic relationships of
comorbid psychiatric disorders in Tourette syndrome. JAMA
Psychiatry. 72:325–333. 2015. View Article : Google Scholar : PubMed/NCBI
|
|
6
|
Mataix-Cols D, Frans E, Pérez-Vigil A,
Kuja-Halkola R, Gromark C, Isomura K, Fernández de la Cruz L,
Serlachius E, Leckman JF, Crowley JJ, et al: A total-population
multigenerational family clustering study of autoimmune diseases in
obsessive-compulsive disorder and Tourette's/chronic tic disorders.
Mol Psychiatry. 23:1652–1658. 2018. View Article : Google Scholar : PubMed/NCBI
|
|
7
|
Huang J, Li R, Li L, Song Y and Jin L: The
relationship between allergic diseases and tic disorders: A
systematic review and meta-analysis. Neurosci Biobehav Rev.
132:362–377. 2022. View Article : Google Scholar : PubMed/NCBI
|
|
8
|
Keenan L, Sherlock C, Bramham J and Downes
M: Overlapping sleep disturbances in persistent tic disorders and
attention-deficit hyperactivity disorder: A systematic review and
meta-analysis of polysomnographic findings. Neurosci Biobehav Rev.
126:194–212. 2021. View Article : Google Scholar : PubMed/NCBI
|
|
9
|
Cavanna AE, Schrag A, Morley D, Orth M,
Robertson MM, Joyce E, Critchley HD and Selai C: The Gilles de la
Tourette syndrome-quality of life scale (GTS-QOL): Development and
validation. Neurology. 71:1410–1416. 2008. View Article : Google Scholar : PubMed/NCBI
|
|
10
|
Vermilion J, Augustine E, Adams HR,
Vierhile A, Lewin AB, Thatcher A, McDermott MP, O'Connor T, Kurlan
R, van Wijngaarden E, et al: Tic disorders are associated with
lower child and parent quality of life and worse family
functioning. Pediatr Neurol. 105:48–54. 2020. View Article : Google Scholar : PubMed/NCBI
|
|
11
|
Gorman DA, Thompson N, Plessen KJ,
Robertson MM, Leckman JF and Peterson BS: Psychosocial outcome and
psychiatric comorbidity in older adolescents with Tourette
syndrome: Controlled study. Br J Psychiatry. 197:36–44. 2010.
View Article : Google Scholar : PubMed/NCBI
|
|
12
|
van den Heuvel OA, van Wingen G,
Soriano-Mas C, Alonso P, Chamberlain SR, Nakamae T, Denys D,
Goudriaan AE and Veltman DJ: Brain circuitry of compulsivity. Eur
Neuropsychopharmacol. 26:810–827. 2016. View Article : Google Scholar : PubMed/NCBI
|
|
13
|
Naro A, Billeri L, Colucci VP, Le Cause M,
De Domenico C, Ciatto L, Bramanti P, Bramanti A and Calabrò RS:
Brain functional connectivity in chronic tic disorders and Gilles
de la Tourette syndrome. Prog Neurobiol. 194:1018842020. View Article : Google Scholar : PubMed/NCBI
|
|
14
|
Rusheen AE, Rojas-Cabrera J, Goyal A, Shin
H, Yuen J, Jang DP, Bennet KE, Blaha CD, Lee KH and Oh Y: Deep
brain stimulation alleviates tics in Tourette syndrome via striatal
dopamine transmission. Brain. 146:4174–4190. 2023. View Article : Google Scholar : PubMed/NCBI
|
|
15
|
Yu J, Yao X, Zhang X and Hao J: New
insights of metabolite abnormalities in the thalamus of rats with
iminodiproprionitrile-induced tic disorders. Front Neurosci.
17:12012942023. View Article : Google Scholar : PubMed/NCBI
|
|
16
|
Nordstrom EJ, Bittner KC, McGrath MJ,
Parks CR III and Burton FH: ‘Hyperglutamatergic
cortico-striato-thalamo-cortical circuit’ breaker drugs alleviate
tics in a transgenic circuit model of Tourette's syndrome. Brain
Res. 1629:38–53. 2015. View Article : Google Scholar : PubMed/NCBI
|
|
17
|
Pogorelov V, Xu M, Smith HR, Buchanan GF
and Pittenger C: Corticostriatal interactions in the generation of
tic-like behaviors after local striatal disinhibition. Exp Neurol.
265:122–128. 2015. View Article : Google Scholar : PubMed/NCBI
|
|
18
|
He JL, Mikkelsen M, Huddleston DA,
Crocetti D, Cecil KM, Singer HS, Edden RAE, Gilbert DL, Mostofsky
SH and Puts NAJ: Frequency and intensity of premonitory
Urges-to-Tic in Tourette syndrome is associated with supplementary
motor area GABA+ levels. Mov Disord. 37:563–573. 2022. View Article : Google Scholar : PubMed/NCBI
|
|
19
|
Larsh TR, Huddleston DA, Horn PS, Wu SW,
Cecil KM, Jackson HS, Edden RAE, Mostofsky SH and Gilbert DL: From
urges to tics in children with Tourette syndrome: Associations with
supplementary motor area GABA and right motor cortex physiology.
Cereb Cortex. 33:3922–3933. 2023. View Article : Google Scholar : PubMed/NCBI
|
|
20
|
Butler IJ, Koslow SH, Seifert WE Jr,
Caprioli RM and Singer HS: Biogenic amine metabolism in Tourette
syndrome. Ann Neurol. 6:37–39. 1979. View Article : Google Scholar : PubMed/NCBI
|
|
21
|
Behen M, Chugani HT, Juhász C, Helder E,
Ho A, Maqbool M, Rothermel RD, Perry J and Muzik O: Abnormal brain
tryptophan metabolism and clinical correlates in Tourette syndrome.
Mov Disord. 22:2256–2262. 2007. View Article : Google Scholar : PubMed/NCBI
|
|
22
|
Zheng P, Li E, Wang J, Cui X and Wang L:
Involvement of tryptophan hydroxylase 2 gene polymorphisms in
susceptibility to tic disorder in Chinese Han population. Behav
Brain Funct. 9:62013. View Article : Google Scholar : PubMed/NCBI
|
|
23
|
Johnson CH, Ivanisevic J and Siuzdak G:
Metabolomics: Beyond biomarkers and towards mechanisms. Nat Rev Mol
Cell Biol. 17:451–459. 2016. View Article : Google Scholar : PubMed/NCBI
|
|
24
|
Chen Q, Shi J, Mu B, Chen Z, Dai W and Lin
Z: Metabolomics combined with proteomics provides a novel
interpretation of the changes in nonvolatile compounds during white
tea processing. Food Chem. 332:1274122020. View Article : Google Scholar : PubMed/NCBI
|
|
25
|
Sun R, Fei F, Jin D, Yang H, Xu Z, Cao B
and Li J: The integrated analysis of gut microbiota and metabolome
revealed steroid hormone biosynthesis is a critical pathway in
liver regeneration after 2/3 partial hepatectomy. Front Pharmacol.
15:14074012024. View Article : Google Scholar : PubMed/NCBI
|
|
26
|
Cadet JL: The iminodipropionitrile
(IDPN)-induced dyskinetic syndrome: Behavioral and biochemical
pharmacology. Neurosci Biobehav Rev. 13:39–45. 1989. View Article : Google Scholar : PubMed/NCBI
|
|
27
|
Brownlow EK and Heath H: Biochemical
changes in beta, beta'-iminodipropionitrile-treated rat brain and
prevention of toxicity by ethionine. J Neurochem. 16:567–575. 1969.
View Article : Google Scholar : PubMed/NCBI
|
|
28
|
Williams S, Brownlow EK and Heath H:
Studies on the metabolism of, ‘-iminodipropionitrile in the rat.
Biochem Pharmacol. 19:2277–2287. 1970. View Article : Google Scholar : PubMed/NCBI
|
|
29
|
Diamond BI, Reyes MG and Borison R: A new
animal model for Tourette syndrome. Adv Neurol. 35:221–225.
1982.PubMed/NCBI
|
|
30
|
Zhang F and Li A: Dual ameliorative
effects of Ningdong granule on dopamine in rat models of Tourette's
syndrome. Sci Rep. 5:77312015. View Article : Google Scholar : PubMed/NCBI
|
|
31
|
Fan S, Cath DC, van den Heuvel OA, van der
Werf YD, Schöls C, Veltman DJ and Pouwels P: Abnormalities in
metabolite concentrations in tourette's disorder and
obsessive-compulsive disorder-A proton magnetic resonance
spectroscopy study. Psychoneuroendocrinology. 77:211–217. 2017.
View Article : Google Scholar : PubMed/NCBI
|
|
32
|
Chowdhury GM, Patel AB, Mason GF, Rothman
DL and Behar KL: Glutamatergic and GABAergic neurotransmitter
cycling and energy metabolism in rat cerebral cortex during
postnatal development. J Cereb Blood Flow Metab. 27:1895–1907.
2007. View Article : Google Scholar : PubMed/NCBI
|
|
33
|
Garcia-Delgar B, Servera M, Coffey BJ,
Lázaro L, Openneer T, Benaroya-Milshtein N, Steinberg T, Hoekstra
PJ, Dietrich A and Morer A; EMTICS collaborative group, : Tic
disorders in children and adolescents: Does the clinical
presentation differ in males and females? A report by the EMTICS
group. Eur Child Adolesc Psychiatry. 31:1539–1548. 2022. View Article : Google Scholar : PubMed/NCBI
|
|
34
|
Caruso D, Pesaresi M, Abbiati F, Calabrese
D, Giatti S, Garcia-Segura LM and Melcangi RC: Comparison of plasma
and cerebrospinal fluid levels of neuroactive steroids with their
brain, spinal cord and peripheral nerve levels in male and female
rats. Psychoneuroendocrinology. 38:2278–2290. 2013. View Article : Google Scholar : PubMed/NCBI
|
|
35
|
Mohr MA, Wong AM, Tomm RJ, Soma KK and
Micevych PE: Pubertal development of estradiol-induced hypothalamic
progesterone synthesis. Horm Behav. 111:110–113. 2019. View Article : Google Scholar : PubMed/NCBI
|
|
36
|
Cabrera RJ and Navarro CE: Progesterone in
vitro increases NMDA-evoked [3H] dopamine release from striatal
slices in proestrus rats. Neuropharmacology. 35:175–178. 1996.
View Article : Google Scholar : PubMed/NCBI
|
|
37
|
Bali N, Arimoto JM, Morgan TE and Finch
CE: Progesterone antagonism of neurite outgrowth depends on
microglial activation via Pgrmc1/S2R. Endocrinology. 154:2468–2480.
2013. View Article : Google Scholar : PubMed/NCBI
|
|
38
|
Israelashvili M, Yael D, Vinner E,
Belelovsky K and Bar-Gad I: Common neuronal mechanisms underlying
tics and hyperactivity. Cortex. 127:231–247. 2020. View Article : Google Scholar : PubMed/NCBI
|
|
39
|
Kanaan AS, Gerasch S, García-García I,
Lampe L, Pampel A, Anwander A, Near J, Möller HE and Müller-Vahl K:
Pathological glutamatergic neurotransmission in Gilles de la
Tourette syndrome. Brain. 140:218–234. 2017. View Article : Google Scholar : PubMed/NCBI
|
|
40
|
Wotton CA, Quon EF, Palmer AC and Bekar
LK: Corticosterone and serotonin similarly influence GABAergic and
purinergic pathways to affect cortical inhibitory networks. J
Neuroendocrinol. 30:e125922018. View Article : Google Scholar : PubMed/NCBI
|
|
41
|
Travers S, Bouvattier C, Fagart J,
Martinerie L, Viengchareun S, Pussard E and Lombès M: Interaction
between accumulated 21-deoxysteroids and mineralocorticoid
signaling in 21-hydroxylase deficiency. Am J Physiol Endocrinol
Metab. 318:E102–E110. 2020. View Article : Google Scholar : PubMed/NCBI
|
|
42
|
Sato M, Sugiyama K, Maeda N, Fujiki J,
Ieko T, Kawamura Y, Iwano H, Mukai K and Yokota H: Local
biosynthesis of corticosterone in rat skeletal muscle. J Steroid
Biochem Mol Biol. 201:1056932020. View Article : Google Scholar : PubMed/NCBI
|
|
43
|
Verma M, Sooy K, Just G, Nixon M, Morgan
R, Andrew R, Chapman KE and Homer NZM: Quantitative analysis of
11-dehydrocorticosterone and corticosterone for preclinical studies
by liquid chromatography/triple quadrupole mass spectrometry. Rapid
Commun Mass Spectrom. 34 (Suppl 4):e86102020. View Article : Google Scholar : PubMed/NCBI
|
|
44
|
Ruhrman D, Mikulincer M, Apter A,
Benaroya-Milshtein N and Steinberg T: Emotion regulation and tic
disorders in children. Eur Child Adolesc Psychiatry. 32:893–902.
2023. View Article : Google Scholar : PubMed/NCBI
|
|
45
|
Rodrigues D and Monteiro P: Chronic stress
promotes basal ganglia disinhibition by increasing the excitatory
drive of direct-pathway neurons. Neurobiol Stress. 27:1005712023.
View Article : Google Scholar : PubMed/NCBI
|
|
46
|
Gong S, Miao YL, Jiao GZ, Sun MJ, Li H,
Lin J, Luo MJ and Tan JH: Dynamics and correlation of serum
cortisol and corticosterone under different physiological or
stressful conditions in mice. PLoS One. 10:e01175032015. View Article : Google Scholar : PubMed/NCBI
|
|
47
|
Rajcani J, Vytykacova S, Solarikova P and
Brezina I: Stress and hair cortisol concentrations in nurses during
the first wave of the COVID-19 pandemic. Psychoneuroendocrinology.
129:1052452021. View Article : Google Scholar : PubMed/NCBI
|
|
48
|
Corbett BA, Mendoza SP, Baym CL, Bunge SA
and Levine S: Examining cortisol rhythmicity and responsivity to
stress in children with Tourette syndrome.
Psychoneuroendocrinology. 33:810–820. 2008. View Article : Google Scholar : PubMed/NCBI
|
|
49
|
Rothe J, Buse J, Uhlmann A, Bodmer B,
Kirschbaum C, Hoekstra PJ, Dietrich A and Roessner V; EMTICS
Collaborative Group, : Hair cortisol and perceived
Stress-predictors for the onset of tics? A european longitudinal
study on High-Risk children. Biomedicines. 11:15612023. View Article : Google Scholar : PubMed/NCBI
|
|
50
|
Chong C, Hamid A, Yao T, Garza AE, Pojoga
LH, Adler GK, Romero JR and Williams GH: Regulation of aldosterone
secretion by mineralocorticoid receptor-mediated signaling. J
Endocrinol. 232:525–534. 2017. View Article : Google Scholar : PubMed/NCBI
|
|
51
|
Dolman D and Edmonds CJ: The effect of
aldosterone and the renin-angiotensin system on sodium, potassium
and chloride transport by proximal and distal rat colon in vivo. J
Physiol. 250:597–611. 1975. View Article : Google Scholar : PubMed/NCBI
|
|
52
|
McHale TS, Chee WC, Hodges-Simeon CR, Zava
DT, Albert G, Chan KC and Gray PB: Salivary aldosterone and
cortisone respond differently to high- and low-psychologically
stressful soccer competitions. J Sports Sci. 38:2688–2697. 2020.
View Article : Google Scholar : PubMed/NCBI
|
|
53
|
Quinn M, McMillin M, Galindo C, Frampton
G, Pae HY and DeMorrow S: Bile acids permeabilize the blood brain
barrier after bile duct ligation in rats via Rac1-dependent
mechanisms. Dig Liver Dis. 46:527–534. 2014. View Article : Google Scholar : PubMed/NCBI
|
|
54
|
Pan X, Elliott CT, McGuinness B, Passmore
P, Kehoe PG, Hölscher C, McClean PL, Graham SF and Green BD:
Metabolomic profiling of bile acids in clinical and experimental
samples of Alzheimer's disease. Metabolites. 7:282017. View Article : Google Scholar : PubMed/NCBI
|
|
55
|
Xiao Y, Yan W, Zhou K, Cao Y and Cai W:
Glucocorticoid treatment alters systemic bile acid homeostasis by
regulating the biosynthesis and transport of bile salts. Dig Liver
Dis. 48:771–779. 2016. View Article : Google Scholar : PubMed/NCBI
|
|
56
|
Chojnacki C, Błońska A, Konrad P,
Chojnacki M, Podogrocki M and Poplawski T: Changes in tryptophan
metabolism on serotonin and kynurenine pathways in patients with
irritable bowel syndrome. Nutrients. 15:12622023. View Article : Google Scholar : PubMed/NCBI
|
|
57
|
Badawy AA: Kynurenine pathway of
tryptophan metabolism: Regulatory and functional aspects. Int J
Tryptophan Res. 10:11786469176919382017. View Article : Google Scholar : PubMed/NCBI
|
|
58
|
Walczak K, Deneka-Hannemann S, Jarosz B,
Zgrajka W, Stoma F, Trojanowski T, Turski WA and Rzeski W:
Kynurenic acid inhibits proliferation and migration of human
glioblastoma T98G cells. Pharmacol Rep. 66:130–136. 2014.
View Article : Google Scholar : PubMed/NCBI
|
|
59
|
Gheorghe CE, Martin JA, Manriquez FV,
Dinan TG, Cryan JF and Clarke G: Focus on the essentials:
Tryptophan metabolism and the Microbiome-gut-brain axis. Curr Opin
Pharmacol. 48:137–145. 2019. View Article : Google Scholar : PubMed/NCBI
|
|
60
|
Cryan JF, O'Riordan KJ, Sandhu K, Peterson
V and Dinan TG: The gut microbiome in neurological disorders.
Lancet Neurol. 19:179–194. 2020. View Article : Google Scholar : PubMed/NCBI
|
|
61
|
Needham BD, Kaddurah-Daouk R and Mazmanian
SK: Gut microbial molecules in behavioural and neurodegenerative
conditions. Nat Rev Neurosci. 21:717–731. 2020. View Article : Google Scholar : PubMed/NCBI
|