Introduction
As average life expectancy increases and the
population ages, the global disease spectrum shifts (1). Chronic disease multimorbidity has
become common (2), with
multimorbidity rates as high as 55–98% in the elderly population
(3). Notably, patients with
multimorbidities tend to be in poorer health, with higher rates of
mortality and disability, leading to an increased consumption of
healthcare resources (4).
Osteoarthritis (OA) and cardiovascular diseases (CVDs) are common
chronic degenerative diseases and their combination is a frequent
type of multimorbidity (5). The
two diseases are the leading causes of disability and death in
individuals aged >65 years, respectively (6–8) and
their progressively higher incidence and increasingly younger onset
cause a heavy burden of disease (9–11),
posing a notable threat to health.
Knee OA (KOA) is the most common type of OA and
>50% of patients with symptomatic KOA experience severe
disability with limited activities of daily living (12). Atherosclerosis (AS), as the most
important etiological and pathological basis of CVDs (13), contributes to ~45% of
CVD-associated mortalities and >20 million individuals worldwide
succumb to AS each year (14). A
large number of existing epidemiological studies have confirmed the
association between OA and CVDs (15). Individuals with OA have a higher
risk of developing and dying from CVDs (16–19)
and the severity of OA is associated with CVD mortality.
Furthermore, individuals at high risk of CVDs have a higher
probability of developing OA (20)
and high levels of AS markers are associated with a high prevalence
of imaging KOA (21,22). Previous studies have also shown
that popliteal artery wall thickness is positively associated with
tibial cartilage loss (23,24).
This evidence indicates that OA and CVDs may be caused by common
risk factors, or that other complex and as yet unappreciated
associations between them exist.
Using KOA and AS as an entry point, the present
study aimed to explore the link between KOA and AS to enrich the
research base of OA-CVD multimorbidities. For the two main disease
subtypes under consideration, KOA and AS share common risk factors,
such as age, obesity, hypertension, diabetes mellitus and abnormal
lipid metabolism (25). A previous
study suggested that metabolic syndrome mediates the development of
KOA-AS multimorbidity (16), but
confirmatory studies are lacking. Multi-omics technology is a
research method that can be used to carry out a more comprehensive
exploration by integrating data from different histological levels,
thus fully revealing the characteristics of disease. In order to
determine whether metabolic abnormalities serve a key role in
KOA-AS multimorbidity and to identify which key biomolecules are
associated with KOA-AS multimorbidity, differences in
metabolism-related clinical indices among different diseased
populations were analyzed. In addition, possible evidence was
explored at the molecular level through multi-omics analysis, which
may improve the understanding of the relationship between KOA and
AS, further promote the prevention and treatment of KOA-AS and
improve future multimorbidity prevention and disease
management.
Materials and methods
Study population
After excluding individuals unable to undergo
radiological examination or those with severe underlying diseases,
172 subjects from Peking University Shougang Hospital (age, 20–60
years, mean age: 40 years, 71.5% male) undergoing physical
examinations volunteered for additional KOA and AS screening, were
recruited to the present study from July to August 2024. The
subjects were offered additional screening after signing an
informed consent form. Based on the examination results, the
subjects were divided into the following four groups: The healthy
control group (HC), the KOA group, the AS group and the KOA-AS
multimorbidity group (MM). The HC group consisted of healthy
individuals without KOA and AS; KOA group consisted of patients
with KOA without AS; the AS group consisted of patients with AS
without KOA; and the MM group consisted of patients with both KOA
and AS.
Disease screening methods
KOA was diagnosed using American College of
Rheumatology criteria (26). AS
was diagnosed using brachial-ankle pulse wave velocity (baPWV),
with patients considered to have AS when baPWV was ≥2 times SD.
Patient information
The clinical data of the subjects were derived from
the laboratory information system and mainly included: i) Basic
information, such as sex and age; ii) general examination of
height, weight and body mass index (BMI); iii) laboratory
indicators, including lipids (triglycerides, total cholesterol),
fasting blood glucose and blood pressure (systolic, diastolic); and
iv) a history of previous diseases.
Metabolomics assays
The test samples were derived from residual serum
samples obtained from the aforementioned patient population. The
serum samples were extracted with 80% methanol in water, vortexed
and shaken and then maintained in an ice bath for 5 min. The
samples were then centrifuged at 15,000 × g for 20 min at 4°C and a
certain amount of supernatant was diluted with mass spectrometry
(MS)-grade water until the methanol content was 53%. The samples
were again centrifuged at 15,000 × g for 20 min at 4°C, the
supernatant was collected and the samples underwent liquid
chromatography (LC)-MS for analysis.
Chromatographic separation was performed using a
Hypersil GOLD column (C18) and an ACQUITY UPLC BEH Amide Column
(100×2.1 mm, 1.9 µm; Thermo Fisher Scientific, Inc.). Metabolites
eluted from the column were detected using a Q Exactive HF/Q
Exactive HF-X super-resolution liquid-mass spectrometer (Thermo
Fisher Scientific, Inc.). MS often uses two scanning modes,
positive ion scanning and negative ion scanning, for data
acquisition during the detection process. In addition, to assess
the stability of the LC-MS throughout the acquisition process,
eight quality control samples were randomly distributed in a pool
of all samples.
Metabolomics analysis
The downstream data files were converted to mzXML
format using ProteoWizard software (version 3.0) (27) and then XCMS software (version 2006)
(28) was used for peak extraction
and peak quantification. Peak alignment was performed and peak area
correction was performed with the first quality control (QC)
sample. Metabolite identification was then performed based on
setting 10 ppm mass deviation and information such as addition ions
against a high-quality secondary spectral database (novogene.cn/).
Subsequently, the background ions were removed with blank sample
measurements and the raw quantitative results of each sample to be
tested were normalized. Finally, compounds with a coefficient of
variation (CV) of the relative peak area of >30% in the QC
samples were deleted (29) and the
number of metabolites identified and relative quantitative value
results were obtained. The data processing was partially performed
based on a Linux operating system (CentOS Version 6.6; linux.org/)
and R package (version 3.4.3, rstudio.com/) and Python software
(version 3.5.0, http://www.python.org/).
The metabolomics data processing software metaX
(version 2017) (30) was used to
transform the data and partial least squares discriminant analysis
(PLS-DA) was performed to obtain the variable importance in
projection (VIP) values of the metabolites. Univariate analysis was
based on paired t-test to calculate the P-value between the groups
for each metabolite and the multiplicity of difference [fold change
(FC) value] between groups for metabolites. The screening criteria
for differential metabolites were VIP>1, P<0.05 and FC≥2 or
FC≤0.5. Volcano plots were plotted using the R package ggplot2
(R-3.4.3) and clustered heat maps (P<0.05 being statistically
significant; t-test) and the Pearson correlation coefficients heat
maps (r-values≥0.6 indicating moderate strength correlation) were
generated using the pheatmap package (R-3.4.3). In addition,
correlation maps were plotted using the corrplot package
(R-3.4.3)in R.
The Kyoto Encyclopedia of Genes and Genomes (KEGG)
database (https://www.genome.jp/kegg/pathway.html) was used to
analyze the function of metabolites and the associated pathways,
which were considered to be enriched when x/n>y/N; the pathways
were considered to be markedly enriched when the P-value of the
pathway was <0.05 and the bubble plots were visualized using the
R package ggplot2.
Transcriptomics data source
The Gene Expression Omnibus (GEO) database
(ncbi.nlm.nih.gov/geo) is a gene expression database created by the
NCBI that contains microarray datasets and high-throughput
sequencing data. To understand the changes in gene expression that
may be caused by metabolism, transcriptomics datasets with ~60
years (average age) were searched for. The key words
‘Osteoarthritis’ and ‘Atherosclerosis’ were used to search and
screen the gene expression datasets at the mRNA level for analyzing
the hub genes of KOA-AS multimorbidity. The inclusion and exclusion
criteria for dataset selection were as follows: i) Test specimens
should be Homo sapiens with consistent specimen types; ii)
gene expression profiles should include both case and control
groups; iii) experimental data expression types (sequencing
platforms) should be consistent; iv) preference should be given to
datasets with large sample sizes; and v) patients receiving
clinical interventions should be excluded.
Transcriptomics analysis
Differentially expressed genes (DEGs) were
identified using the Limma package of the online analysis platform
GEO2R (https://www.ncbi.nlm.nih.gov/geo/geo2r/). Based on the
Bayesian test, the criteria for determining the DEGs of the two
profiles were set as adjusted P-value <0.05 (Benjamini-Hochberg
method) (31) and |logFC|>0.
The common DEGs were obtained from the Venn diagrams drawn by the
online mapping tool ImageGP (bic.ac.cn/BIC/#/).
The KEGG database was used to analyze the function
of the hub genes and the related biological processes. When
x/n>y/N, the process was considered enriched; when the P-value
of the biological process was <0.05, it was considered markedly
enriched and the bubble plots were visualized with the R package
ggplot2.
The DEGs common to OA and AS were imported into the
STRING (http://www.string-db.org/) database
and a composite score of ≥0.4 was selected for protein-protein
interaction (PPI) network construction, excluding proteins with no
interactions and retaining only proteins in the interaction network
and the results were exported in ‘tsv’ format. The results were
then imported into Cytoscape (32)
and the cytoHubba (https://cytoscape.org/) plug-in was used to assign a
value to each protein according to the topological network
algorithm and the hub genes corresponding to the key proteins were
sorted and screened (33).
Metabolite-gene network analysis
MetaboAnalystR 6.0 (34) was used to analyze the interactions
between core metabolites and hub genes. The ‘Network Analysis’
module was selected online and the ‘Official gene symbol’ of the
hub gene to be analyzed was imported into the database together
with the ‘Compound Name’ of the core metabolite. Subsequently, the
metabolite-gene interaction network was constructed by selecting
the species to identify possible interactions.
Mice and disease models
Disease modeling was performed using 6–8-week-old
male mice (weight, 20–22 g). Wild-type C57BL/6 mice and
APOE−/−mice were purchased from SPF (Beijing)
Biotechnology Co., Ltd. A total of six C57 mice were used as
healthy controls and 18 APOE−/−mice were used to
construct the disease model. Mice were individually housed under
standard lighting conditions (12-h dark/light cycle) and constant
temperature (22±2°C) with free access to standard food and water.
The animal experiments was approved by the Ethics Committee for
Experimental Animals of Beijing JinglaiHuake Biotechnology Co
(approval no. JLHK-20241110-02, approved date November 13, 2024).
During the surgery, experimental animals were anesthetized via
inhalation of isoflurane (5% induction and 2% maintenance) and the
mice were euthanized by cervical dislocation at the time of tissue
sampling. APOE−/− mice were randomly grouped to
construct AS, KOA and KOA-AS multimorbidity models. The AS disease
model was constructed using the high-fat chow-feeding method with
high-fat feeding for 12 weeks; the KOA disease model was surgically
constructed using the modified Hulth method (35); and the KOA-AS multimorbidity model
was constructed using the two techniques. C57 mice used as healthy
controls were fed normal feed without treatment.
X-ray examination
To assess the effects of KOA disease modeling,
radiography was used to assess joint degeneration. To validate the
construction of the KOA disease model, changes such as narrowing of
the joint space and the presence of osteophytes should be
observed.
Oil Red O staining
The aortic Oil Red O staining method was used to
determine the status of the AS disease model. The intact aortic
tissues were fixed overnight in 4% paraformaldehyde at 4°C. All
subsequent steps were performed at room temperature. The fixed
tissues were rinsed with PBS and then immersed in 60% isopropanol
for 30 sec. Next, the tissues were stained with Oil Red O working
solution for 30 min, followed by differentiation in 60% isopropanol
for 30 sec. Finally, the tissues were rinsed again with PBS and
imaged on a white background. If notable red atherosclerotic
plaques were detected after staining, the AS disease model was
considered successfully constructed.
ELISA
Concentrations of Egr1 and GSK3β in patient serum
were determined using the Human Egr1 (cat. no. EH0892; Wuhan Fine
Biotech Co., Ltd.) and the Human GSK3β ELISA Kit (cat. no. EH0630;
Wuhan Fine Biotech Co., Ltd.), respectively, according to the
manufacturer's instructions.
The concentrations of Egr1 and GSK3β in mouse serum
were determined using the Mouse Egr1 ELISA Kit (cat. no. EM0998;
Wuhan Fine Biotech Co., Ltd.) and the Mouse GSK3β ELISA Kit (cat.
no. RXW202270M6; Quanzhou Ruixin Biotechnology Co., Ltd.),
respectively, according to the manufacturer's instructions.
The standard curve was fitted and the relative
concentration of the target protein in the samples was obtained
using CurveExpert 1.4 (curveexpert.net/).
Reverse transcription-quantitative PCR
(RT-qPCR)
RNA was isolated from mouse cartilage tissue using
TRIzol® (Invitrogen; Thermo Fisher Scientific, Inc.).
First-strand cDNA was synthesized using a RT kit (Shanghai Yeasen
Biotechnology Co., Ltd.; cat. no. 11141ES60) according to the
manufacturer's instructions. qPCR was performed on a Molarray
MA-6000 real-time fluorescence qPCR instrument. qPCR was performed
using the Realtime PCR Fluorescence Quantitative kit (Shanghai
Yeasen Biotechnology Co., Ltd.; cat. no. 11201ES08) on a Molarray
MA-6000 real-time fluorescence qPCR system. Thermocycling
conditions were as follows: initial denaturation at 95°C for 5 min;
40 cycles of denaturation at 95°C for 10 sec, annealing at 60°C for
20 sec, and extension at 72°C for 20 sec, followed by a melt curve
stage under instrument default settings. Each sample was run in
three technical replicates. Relative mRNA levels were calculated
with GAPDH as an internal reference, using the
2−ΔΔCq equation (36).
Primer sequences are shown in Table
SI.
Western blotting
Mouse cartilage tissue was lysed with RIPA buffer
(Beyotime Institute of Biotechnology) and total protein was
collected. The protein concentration was determined using a BCA
assay kit. A total of 30 µg protein/lane was separated by SDS-PAGE
on 12% gels and were then electrotransferred to a PVDF membrane
(Merck KGaA). After blocking the membranes with protein blotting
closure buffer (Biosharp Life Sciences) for 2 h at room
temperature, the membranes were incubated with primary antibodies
targeting Egr1 (1:1,000; cat. no. AF0589; Affinity Biosciences),
GSK3β (1:5,000; cat. no. BF0695; Affinity Biosciences) and GAPDH
(1:50,000; cat. no. 10494-1-AP; Proteintech Group, Inc.) at 4°C
overnight. After washing three times with TBS-Tween, the membranes
were incubated with HRP-labeled anti-mouse/rabbit IgG secondary
antibodies (1:10,000; cat. no. bs-0295M-HRP; BIOSS) at room
temperature for 1 h. The blots were then visualized using an
enhanced chemiluminescence reagent (Beijing Fluorescence
Biotechnology Co. Ltd.). Protein band densitometry was analyzed
using ImageJ software (version 1.53e; National Institutes of
Health, USA).
Analysis of receiver operating
characteristic (ROC) curves
To assess the sensitivity and specificity of
metabolites as potential diagnostic markers, a ROC curve analysis
was performed based on the relative quantitative values of
metabolites in the HC and MM groups of the metabolomics assay using
R programming software (version 3.4.3, rstudio.com/). The
confidence interval was set at 95% and metabolites with an area
under the ROC curve (AUC) of >0.7 were considered
significant.
Drug prediction
Small molecule targeted drugs were predicted using
the Drug-Gene Interaction Database (DGidb; http://dgidb.org/), a publicly accessible resource
that aggregates gene or gene product, drug and drug-drug-gene
interaction records, which allows for drug prediction through
genes. In turn, this drives clinical hypothesis generation and
discovery by physicians and researchers (37).
Statistical analysis
Data analysis for the omics portion of the research
methodology was mainly performed using dedicated histological
analysis tools/software or the R software package (version 4.2.2,
rstudio.com/). Data in the epidemiological analysis and validation
experiment were analyzed using SPSS version 25 statistical software
(IBM Corp.), with independent samples t-test used for continuous
variables and χ2 test for categorical variables. For
comparisons across more than two groups, one-way ANOVA followed by
Dunnett's post hoc test was applied. P<0.05 was considered to
indicate a statistically significant difference.
Results
Clinical indicators analysis
To determine whether KOA-AS multimorbidity was
associated with metabolic abnormalities, healthy controls and three
patient groups were screened based on the diagnosis of KOA-AS
(Table SII). The between-group
differences regarding metabolic syndrome-related indices (BMI,
lipids, blood glucose and blood pressure), as well as medical
history, were comparatively analyzed (Table I).
 | Table I.Clinical indicators and KOA-AS
multimorbidity. |
Table I.
Clinical indicators and KOA-AS
multimorbidity.
|
| Clusters |
|---|
|
|
|
|---|
| Clinical
indicators | HC (n=43) | KOA (n=43) | AS (n=43) | MM (n=43) |
|---|
| BMI | 24.15±3.33 |
26.15±2.94a |
25.69±3.53b |
27.13±3.44c |
| Triglycerides | 1.4±0.98 | 1.42±0.8 |
2.24±1.58a | 2.36±3.21 |
| Total
cholesterol | 4.77±1.03 | 4.96±0.76 | 5.03±1 | 5.15±1.48 |
| Fasting
glucose | 5.16±0.41 |
5.48±0.7b |
5.63±1.12b |
6.73±2.09cde |
| Systolic blood
pressure | 113.86±13.25 | 118.51±12.41 |
131.86±13.97c |
135.42±11.29ce |
| Diastolic blood
pressure | 71.09±7.76 | 73.51±9.29 |
83.86±10.14c |
85.44±9.19ce |
| Past medical
history |
|
|
|
|
|
Hypertension | 2/43 | 7/43 | 9/43b | 24/43cef |
|
Hyperlipidemia | 1/43 | 6/43b | 7/43b | 2/43 |
|
Diabetes mellitus | 1/43 | 4/43 | 1/43 | 13/43cfg |
|
Coronary heart disease | 0/43 | 0/43 | 0/43 | 3/43 |
|
Other | 3/43 | 1/43 | 0/43 | 4/43h |
|
Total | 7/43 | 14/43 | 16/43b | 33/43cef |
Among the results, BMI showed differences in the
KOA, AS and MM group compared with that in the HC group.
Triglycerides showed differences only in the comparison between the
AS and the HC group. In general, both triglycerides and total
cholesterol showed an increasing trend in those who had AS (AS and
MM groups) compared with those who did not have AS (HC and KOA
groups). Fasting blood glucose showed differences in all five group
comparisons, suggesting that abnormalities in glucose metabolism
may be associated with both KOA and AS and that this could have a
contributory effect on the development of KOA-AS multimorbidity.
Among all metabolic abnormalities, glucose metabolism was the most
strongly associated with KOA-AS multimorbidity. Systolic blood
pressure (mmHg) and diastolic blood pressure (mmHg) showed
differences in comparisons with the AS, the MM and the HC group and
in comparisons of the MM and the KOA group, indicating that
hypertension may be strongly associated with AS. Notably,
hypertension is a recognized risk factor for AS.
In the analysis of past medical history, a past
history of hypertension and a past history of diabetes mellitus
were associated with KOA-AS multimorbidity. In general, the more
history of past diseases an individual had (all diseases), the
greater the probability of developing KOA-AS multimorbidity,
suggesting that this multimorbidity may be associated with a
variety of adverse health conditions.
Overall, in the analysis of metabolism-related
clinical information, BMI, fasting glucose, a previous history of
hypertension and a previous history of diabetes mellitus were
associated with KOA-AS multimorbidity. By contrast, the laboratory
measures of blood pressure and dyslipidemia were only associated
with AS. Furthermore, at the same age, there was more evidence of
metabolic abnormalities in the AS group compared with in the KOA
group.
Qualitative and quantitative
metabolite analysis
To understand the association between metabolism and
KOA-AS multimorbidity, the study subjects were screened, retaining
redundant serum samples (residual blood from laboratory tests)
among those analyzed in the previous step, the number of sample
cases in the remaining subgroups was adjusted based on the
subgroups with the lowest number of samples according to the ratio
of 1:1 and the ratio of age and sex in each group was balanced as
much as possible (Table SIII).
Non-targeted serum metabolomics based on high-resolution MS was
performed and the molecular peaks were matched and identified using
a high-quality secondary spectral information database to reflect
the differences in the characteristics of serum total metabolites
in different diseased populations.
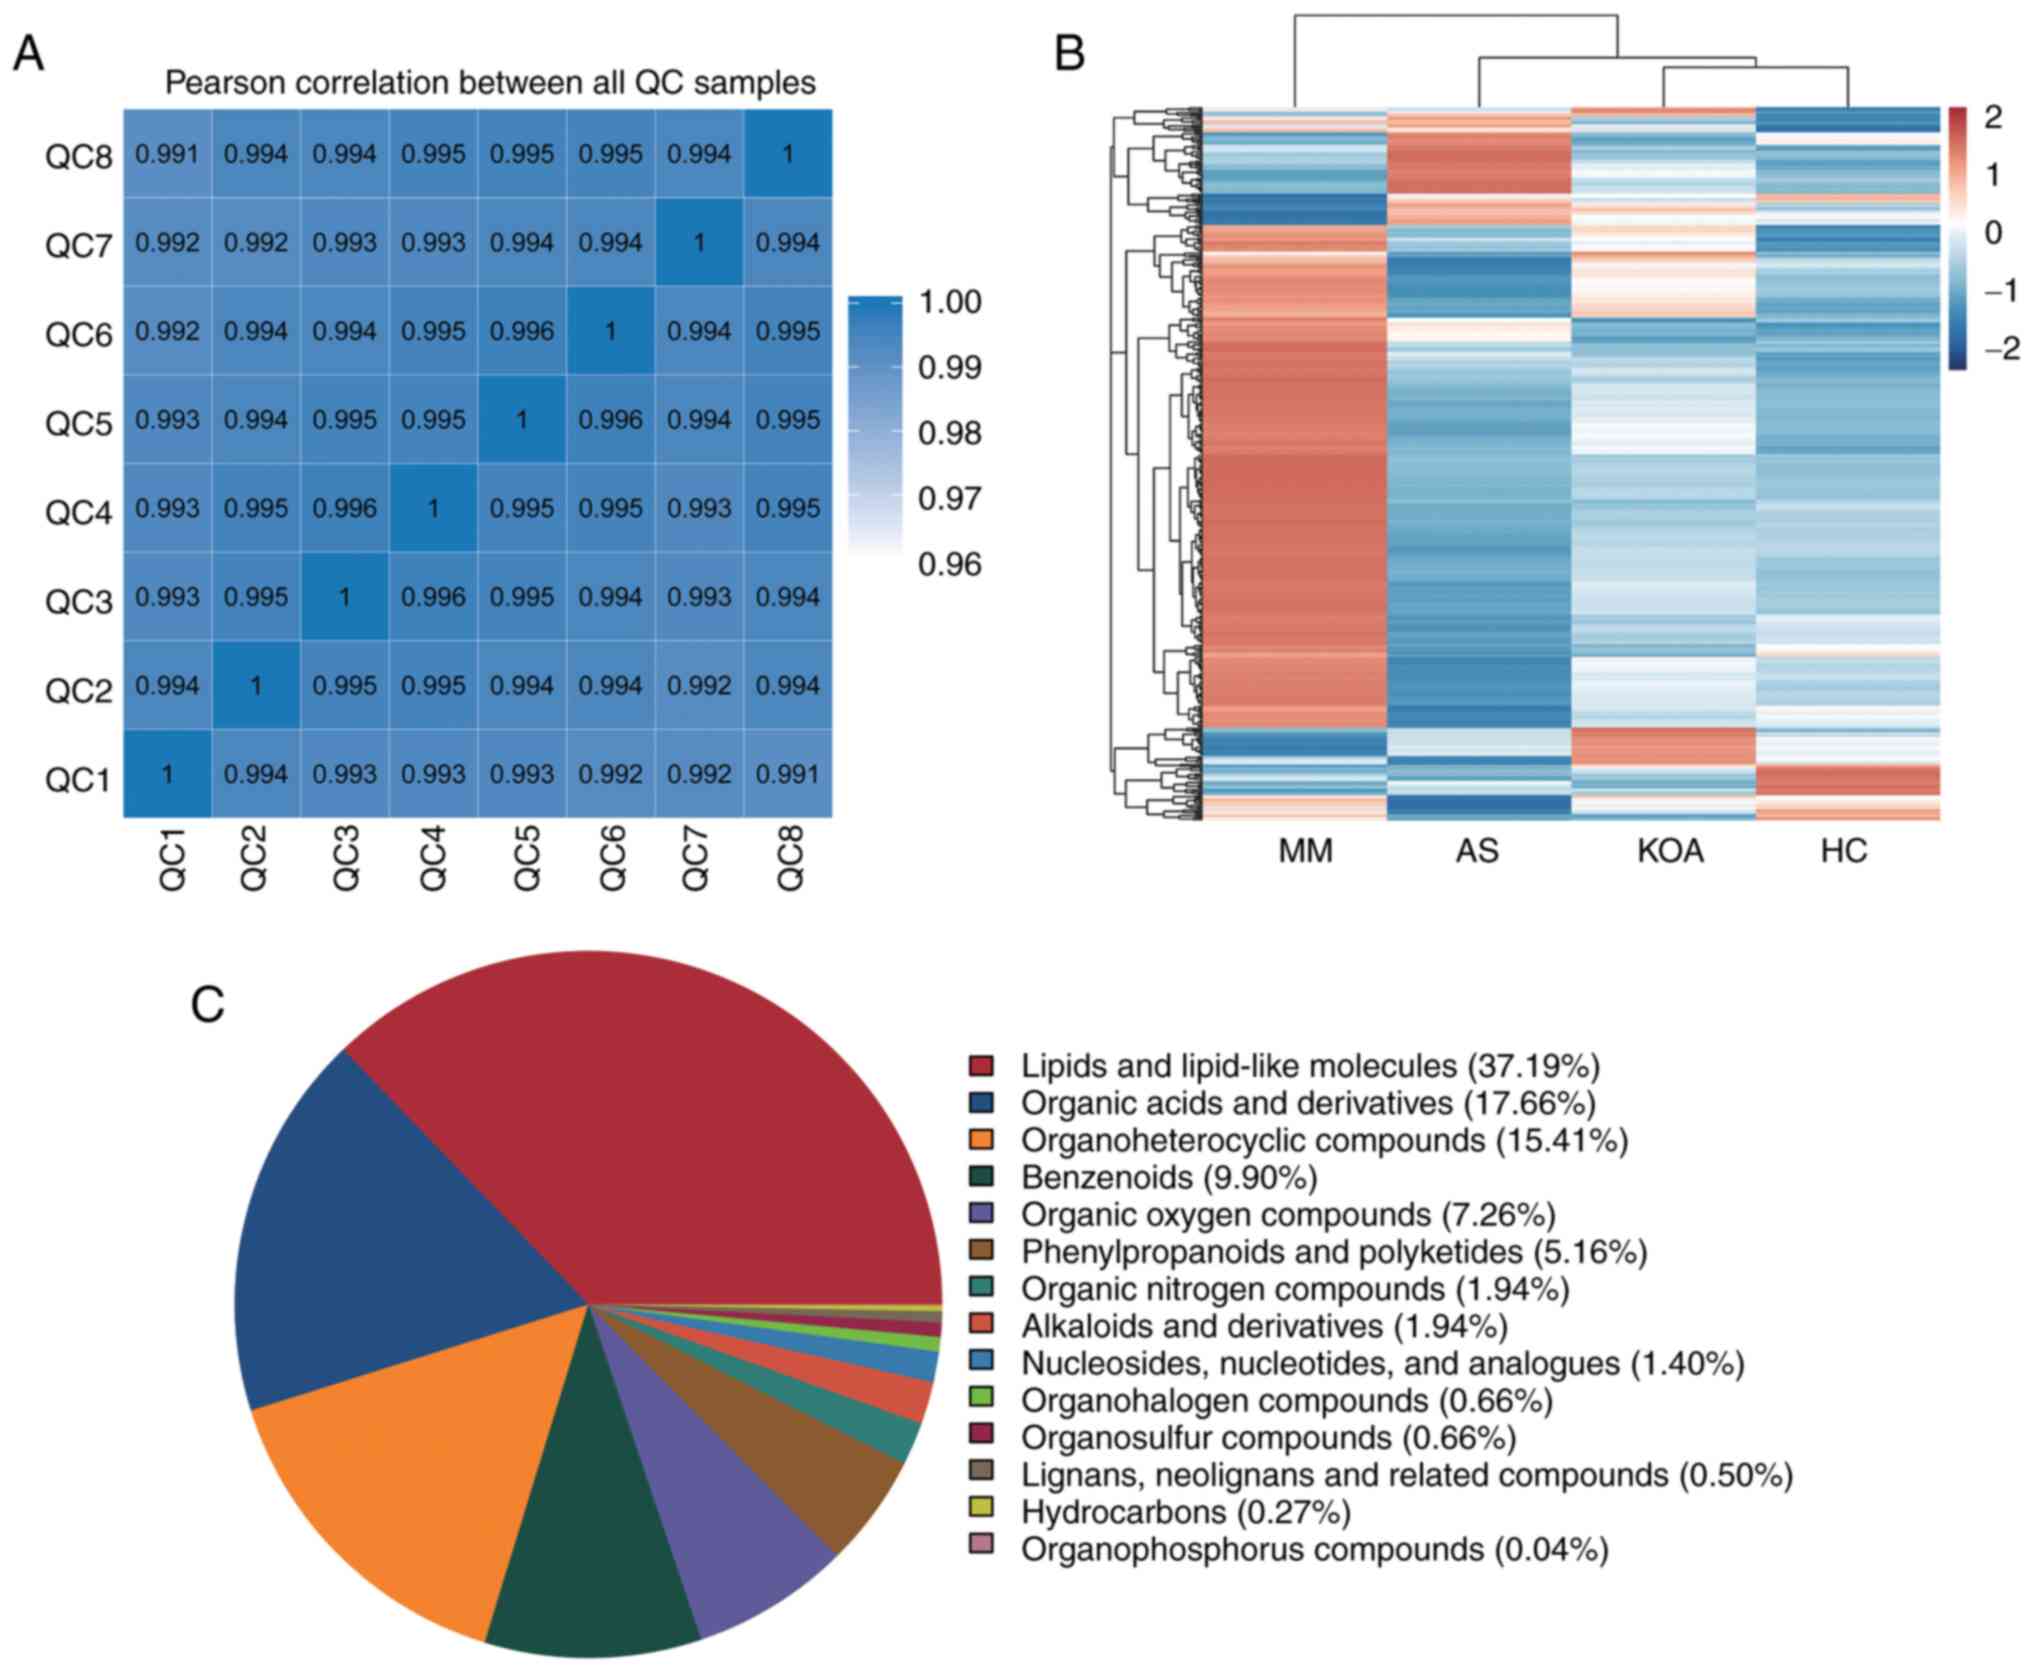
Pearson correlation coefficients were first
calculated between the QC samples based on the relative
quantitative values of the metabolites and it was observed that the
correlation coefficients (r-values) of the different QC samples
were all >0.99, which indicated that the instrument was well
stabilized throughout the entire sample testing period (Fig. 1A). The raw data from the downstream
machine were preprocessed using XCMS software and metabolites with
a CV of <30% in the QC samples were retained, resulting in a
total of 2,595 identified metabolites. The top five metabolite
classes were: Lipid and lipid-like molecules, organic acids and
their derivatives, organic heterocyclic compounds, benzenes and
organic oxygenated compounds (Fig.
1C).
Intergroup cluster analysis of all
differential metabolites
In order to visualize the overall changes in serum
metabolism, hierarchical clustering analysis (38) of all differential metabolites
between the groups was performed. The results showed that the
metabolic profiles of the KOA group were the most similar to those
of the HC group, followed by the AS group and lastly the MM group.
This is consistent with the results of the present analysis of
clinical indicators, the metabolic abnormalities were more
significant in the AS group compared with those in the KOA group
(Fig. 1B).
Differential metabolite analysis
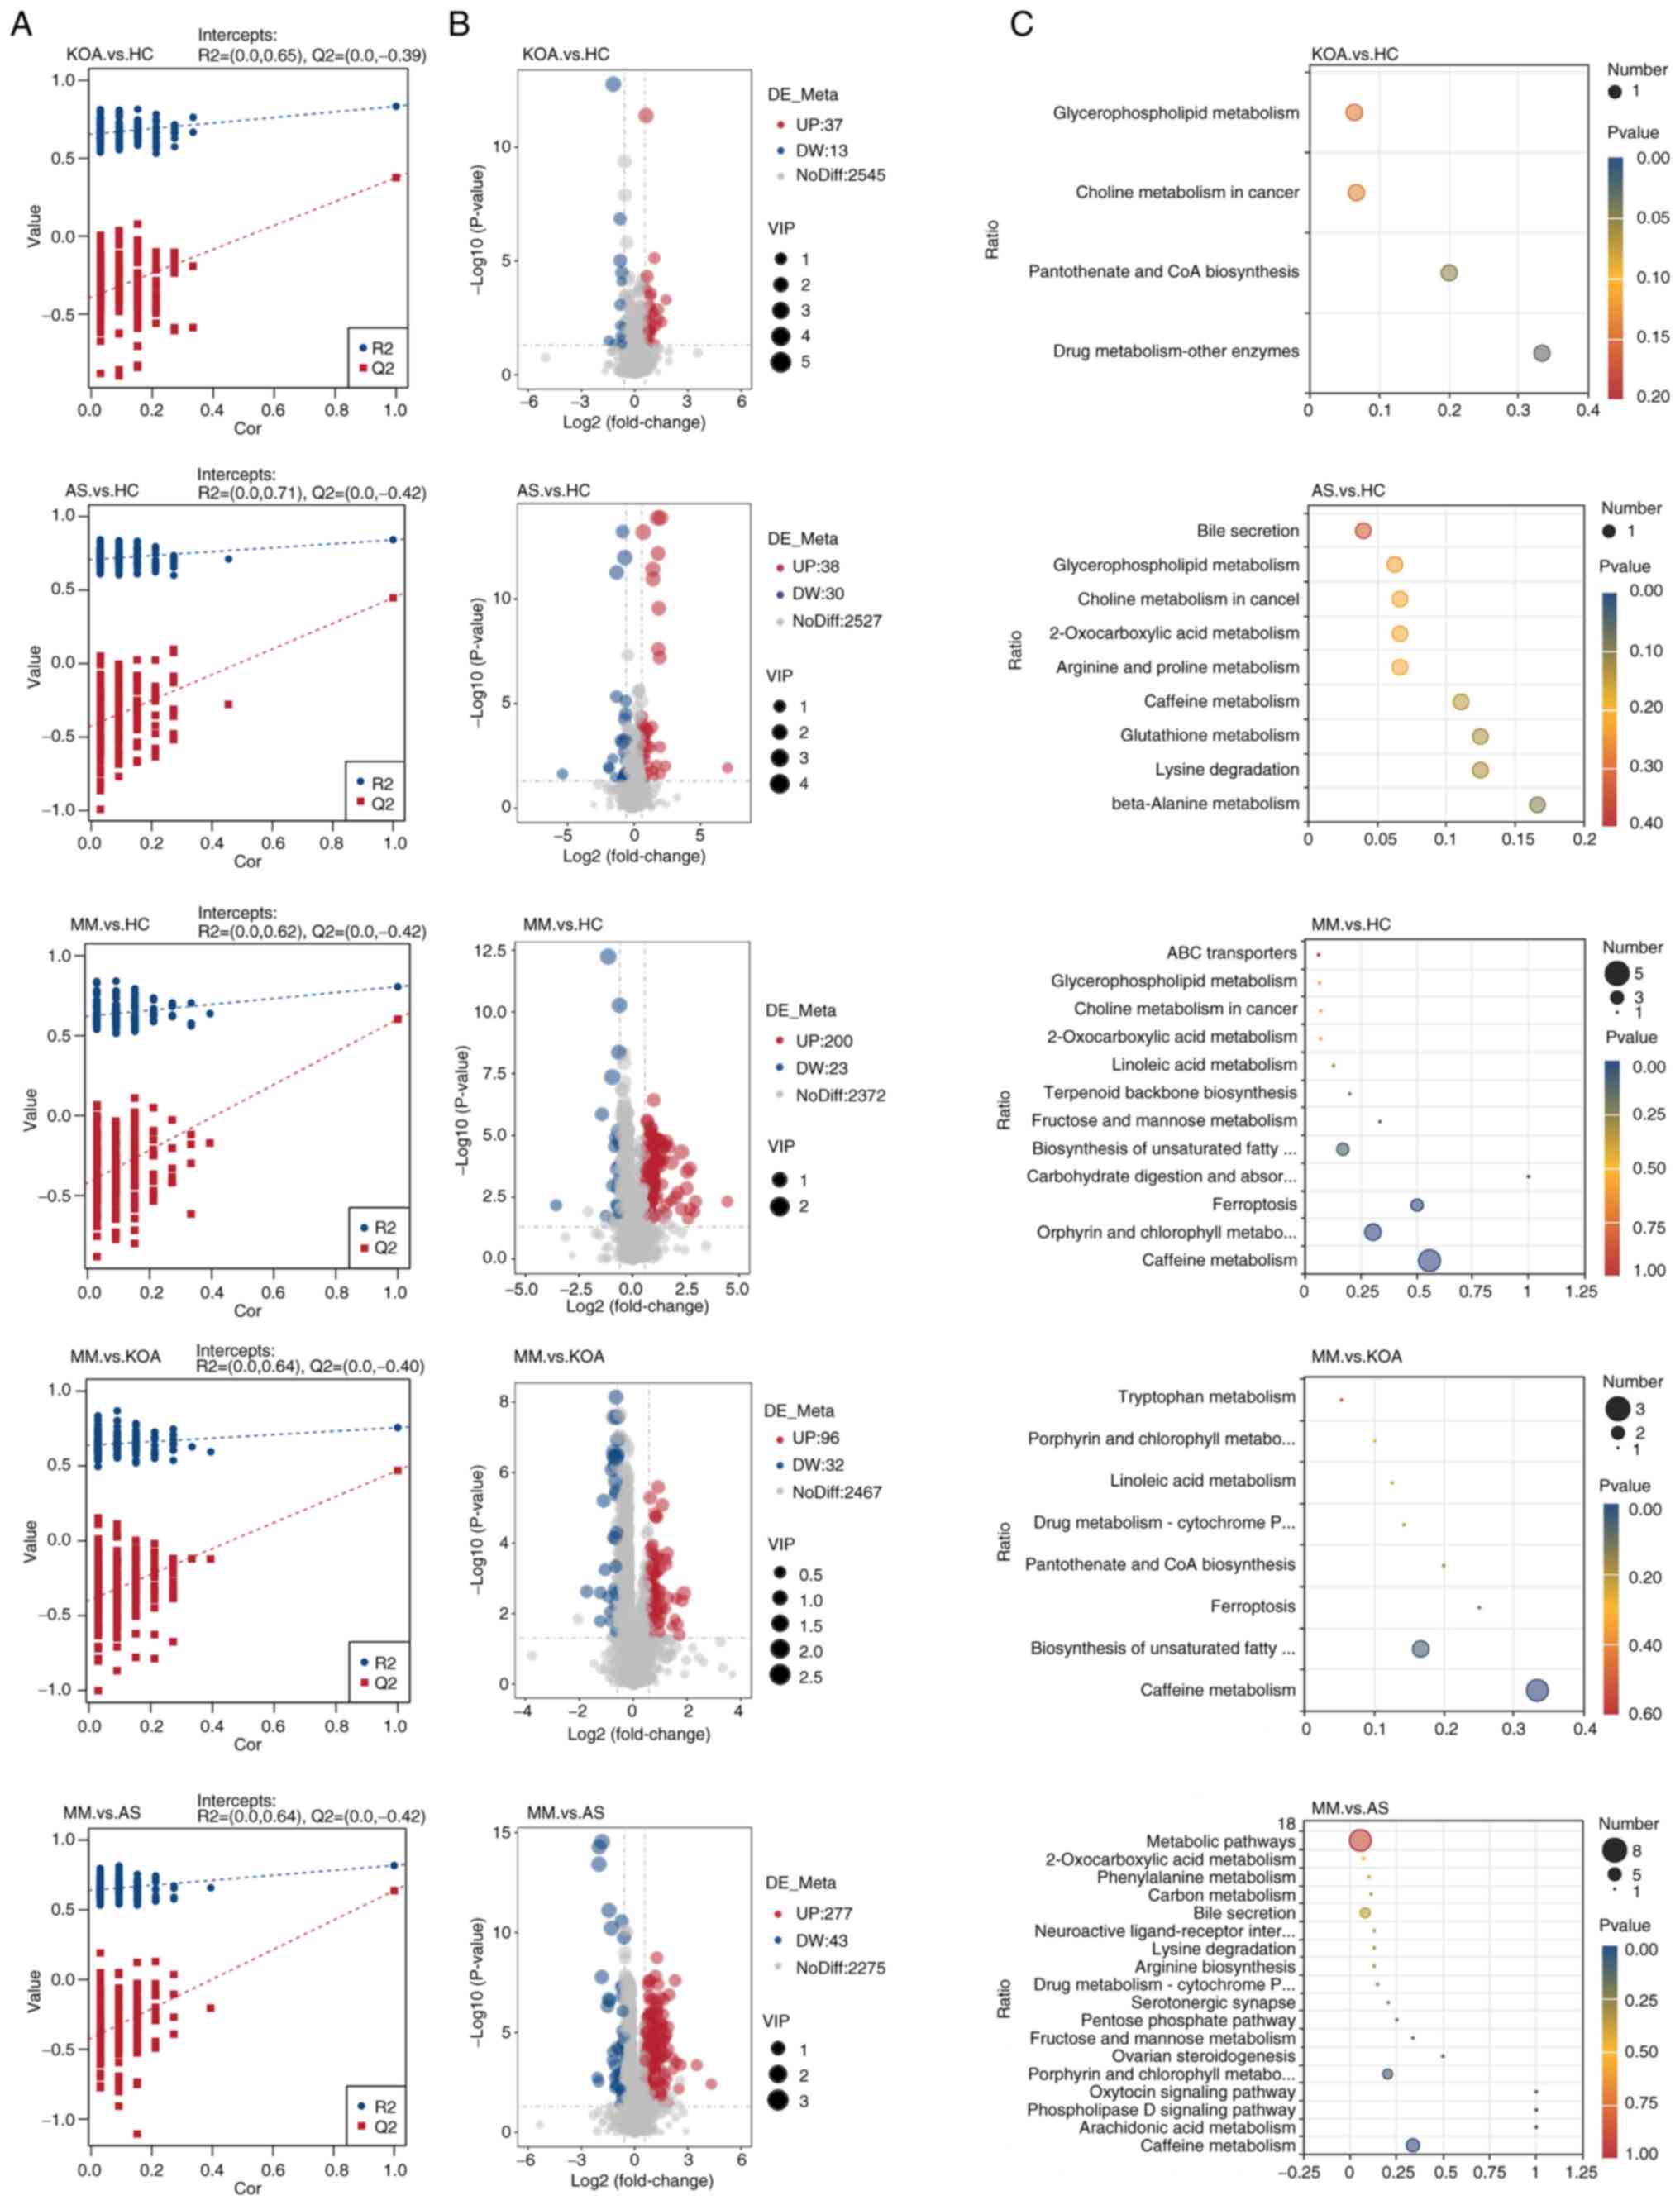
The current study next performed differential
metabolite identification. To ensure the reliability of the
results, a supervised PLS-DA model was first developed for an
improved account for metabolite variation between each comparison
group. The PLS-DA model was validated using a permutation test with
200 random numbers. The results showed that all red predictability
(Q2) values on the left side were lower than the original points on
the right side, R2 and Q2 were close to 1, R2 data were larger than
Q2 data and the Q2 regression line had an intercept with the y-axis
of <0. This demonstrated that the PLS-DA model was valid and
stable (Fig. 2A). Next, volcano
plots were constructed for the identification of differential
metabolites among each of the five comparison groups and the
screening conditions for the identification of differential
metabolites were VIP>1, P<0.05 and FC≥2 or FC≤0.5 (Fig. 2B). After obtaining the
identification results of differential metabolites among the
comparison groups, to determine their functions, KEGG pathway
enrichment analysis was performed using the differential
metabolites identified in each of the five comparison groups
(Fig. 2C). The results showed that
the top five pathways in the AS group vs. the HC group comparison
were: β-alanine metabolism, lysine degradation, glutathione
metabolism, caffeine metabolism and arginine and proline
metabolism, all of which were non-significant. In the KOA group vs.
the HC group comparison, drug metabolism-other enzymes and
pantothenic acid and CoA biosynthesis pathways were markedly
enriched. A total of four pathways, caffeine metabolism, porphyrin
and chlorophyll metabolism, iron oxidation and carbohydrate
digestion and absorption were markedly enriched in the comparison
between the MM group and the HC group. The four pathways markedly
enriched in the comparison between the MM group and the AS group
were caffeine metabolism, arachidonic acid metabolism,
phospholipase D signaling pathway and oxytocin signaling pathway.
The caffeine metabolism pathway was markedly enriched in the
comparison between the MM group and the KOA group.
From the results of the KEGG analysis, it was
observed that significant enrichment in caffeine metabolism
pathways was observed in the comparison of the MM group with the
other three groups (Fig. 2C),
suggesting that abnormal caffeine metabolism may influence or
promote the development of KOA-AS multimorbidity. The present study
further analyzed the caffeine metabolic pathway by comparing its
five related metabolites (caffeine, theophylline, 1-methyluric
acid, 1-methylxanthine and 1,7-dimethyluric acid) among the HC,
KOA, AS and MM groups, to observe the differences between the
groups and the overall trend.
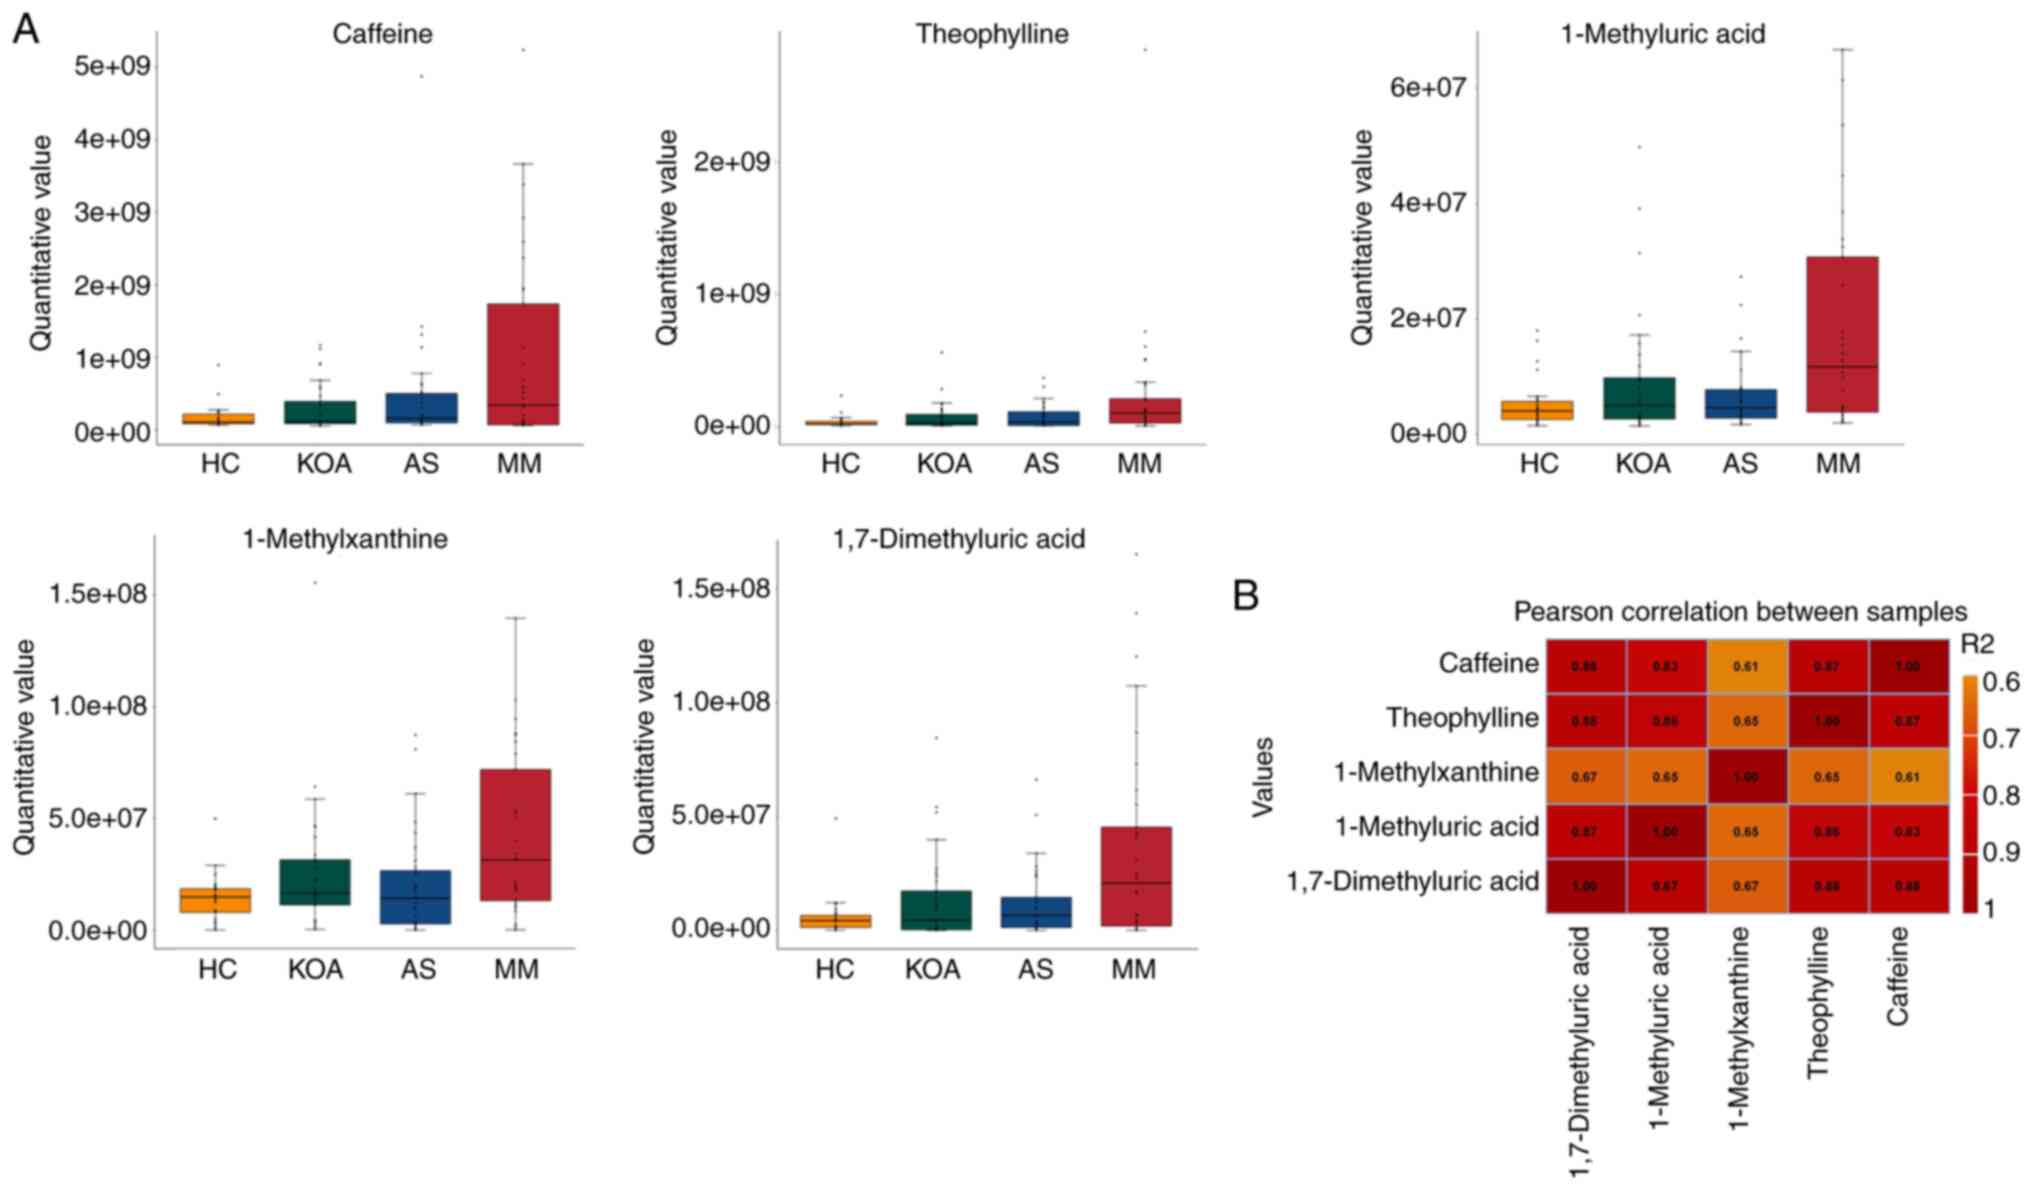
From the results presented in Table SIV and in the box plots (Fig. 3A), it was indicated that the
relative serum levels of the five caffeine metabolism-related
metabolites (caffeine, theophylline, 1-methyluric acid,
1-methylxanthine and 1,7-dimethyluric acid) increased progressively
with the number of individuals suffering from the disease (healthy
control < suffering from mono-disease < suffering from
co-disease). It may be suggested that the higher the relative serum
levels of caffeine and its secondary metabolites, the higher the
risk of developing KOA-AS multimorbidity.
To understand the association between the relative
serum levels of these five metabolites, the Pearson correlation
coefficients between the relative quantitative values of five
metabolites were calculated (Fig.
3B) and it was observed that the correlation coefficients of
all five metabolites (r-values) were all >0.6, suggesting that
the relative levels of these five metabolites were moderately or
highly positively associated with each other.
Transcriptomics analysis data
sources
To further investigate the possible effects of
metabolic abnormalities and caffeine on patients with KOA-AS
multimorbidity, common DEGs in patients with KOA and patients with
AS were assessed using publicly available transcriptomics data to
screen hub genes for KOA-AS multimorbidity.
According to the previously established criteria,
the GSE48556 dataset for OA (139 samples, 33 controls and 106
patients with OA; mean age, ~ 60 years; the case group suffered
from OA in at least two or more sites) and the GSE23746 dataset for
AS (95 samples, 19 controls and 76 patients with AS; the case group
comprised patients with carotid AS) were obtained. The experimental
platform for both datasets was gene expression microarray
technology, the specimen types were human peripheral blood
mononuclear cells (PBMCs) and the sample sizes were relatively
large, which were able to satisfy the analysis needs.
Screening of common DEGs
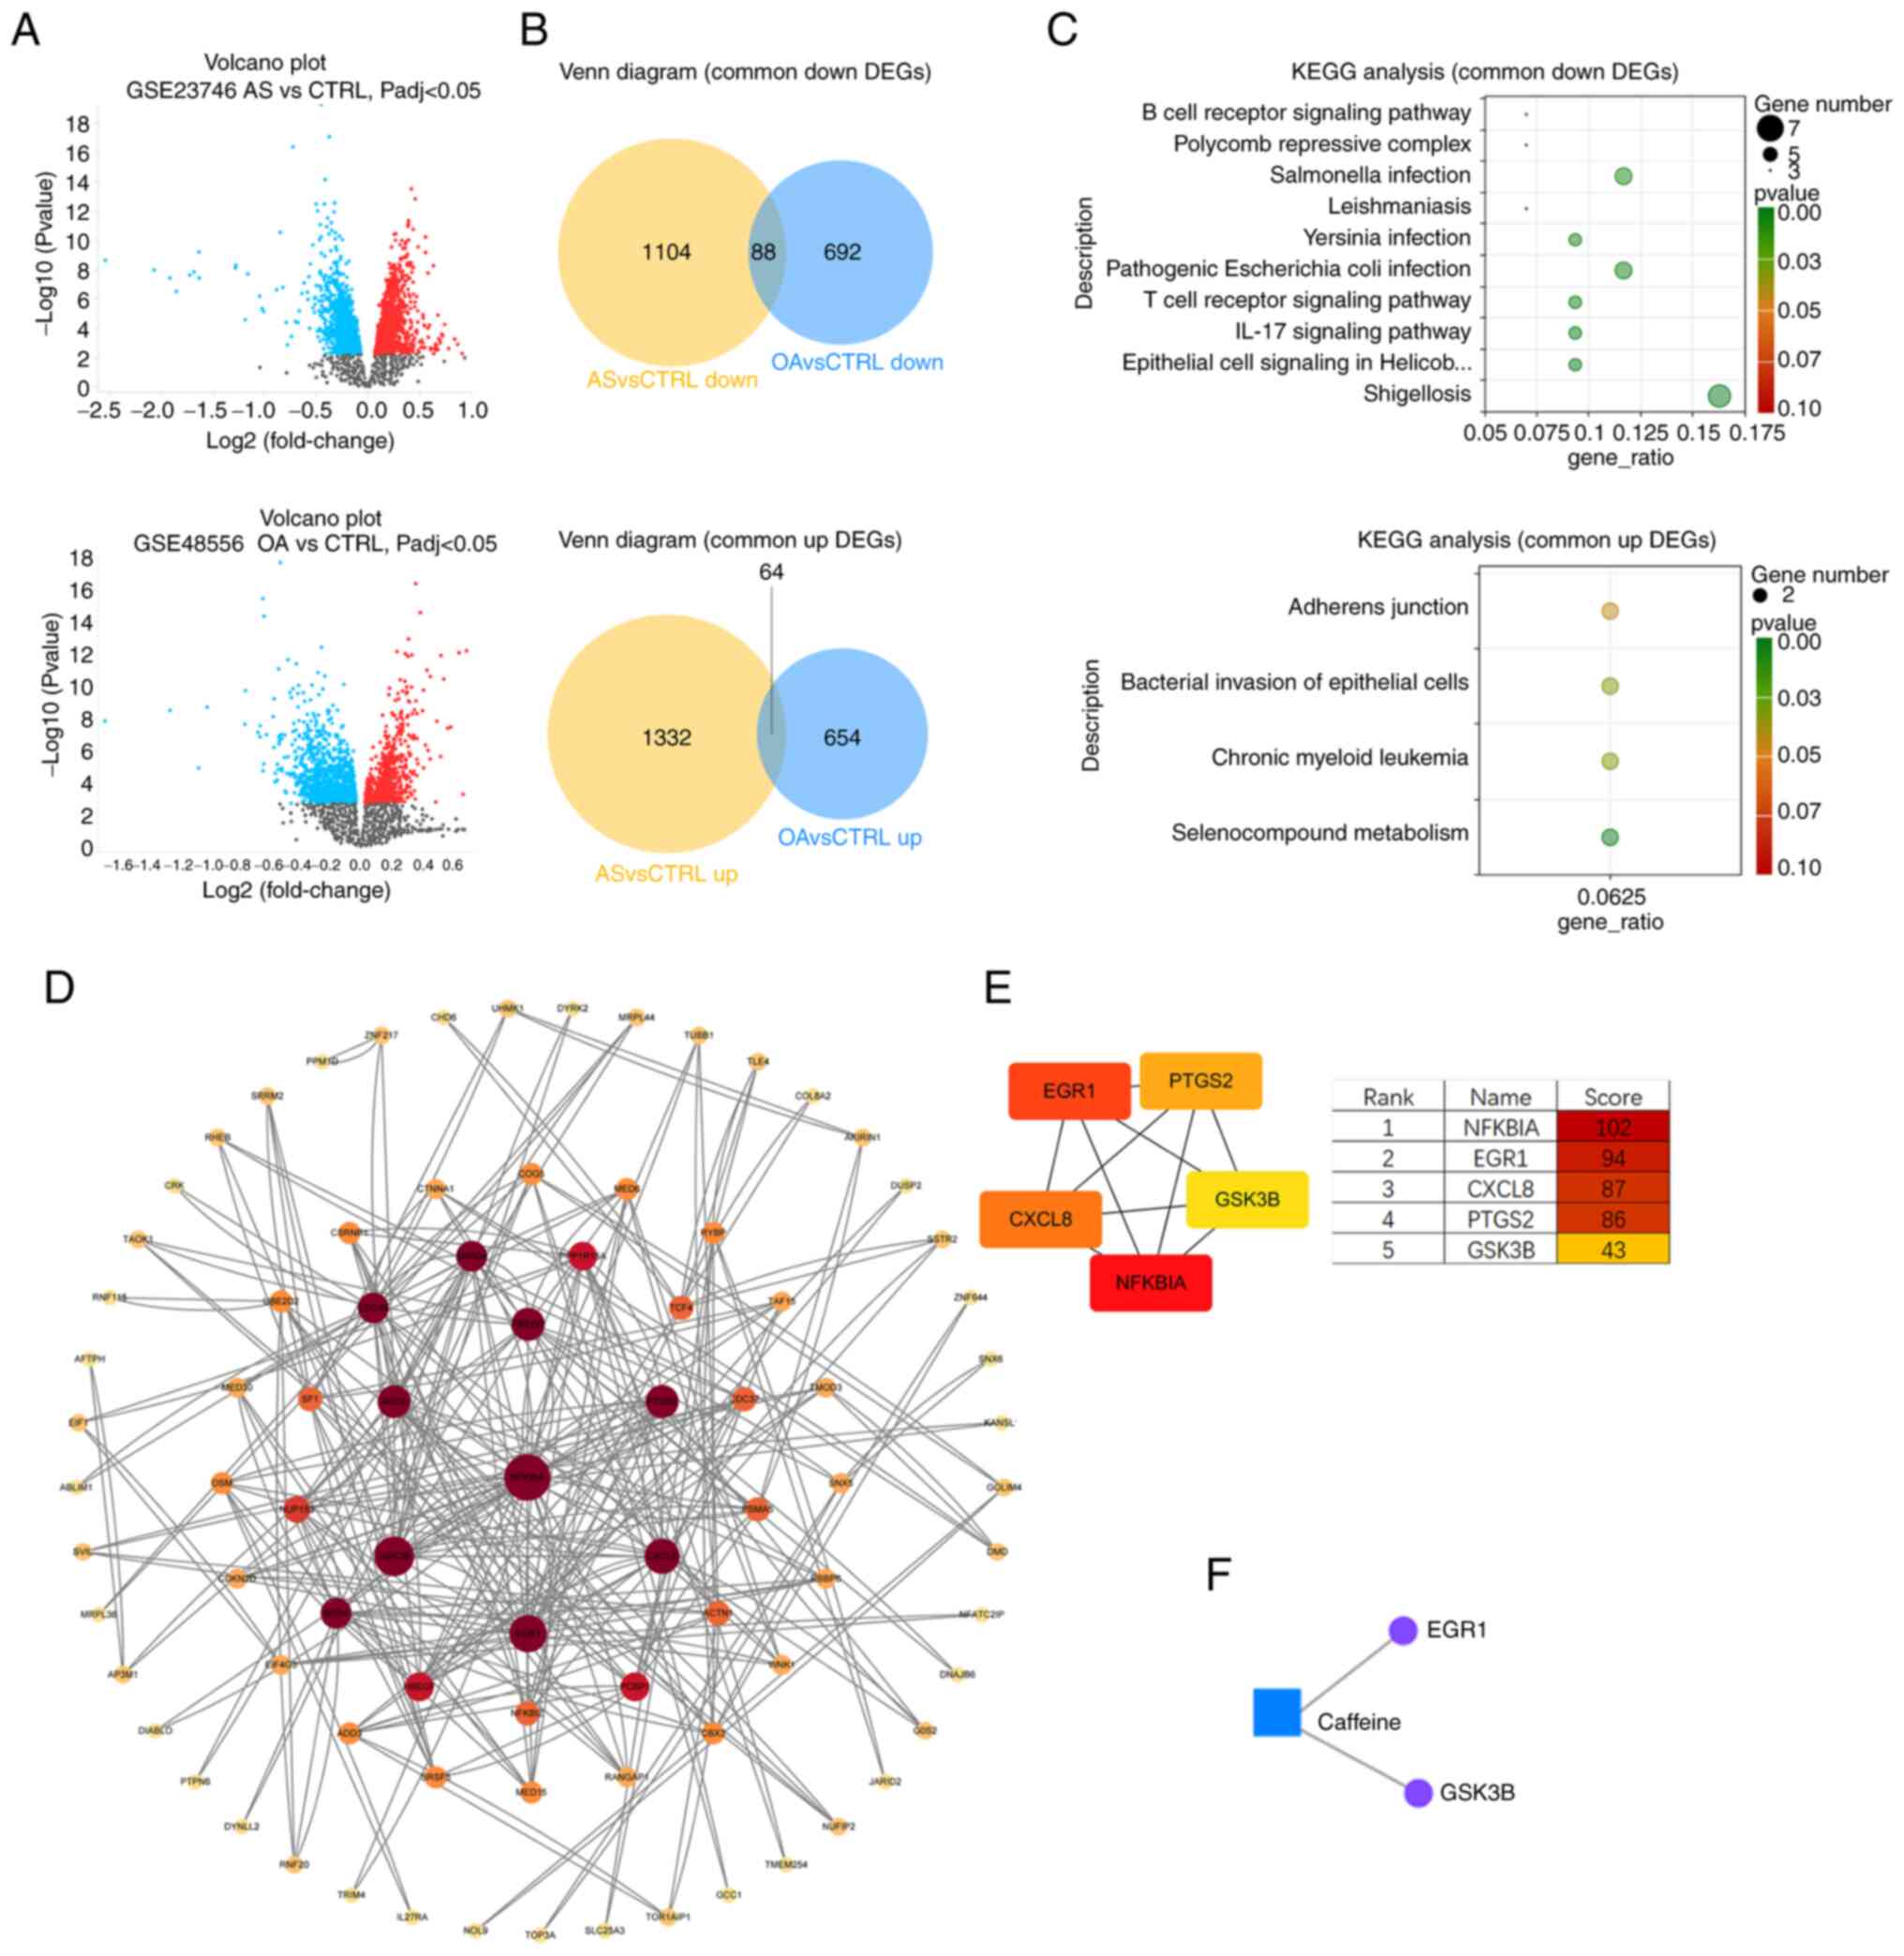
Using GEO2R, an online analysis platform for the GEO
database, 2,082 DEGs (including 814 upregulated genes and 1,268
downregulated genes) were obtained from the GSE48556 OA dataset
(Fig. 4A) and 2,932 DEGs
(including 1,590 upregulated genes and 1,342 downregulated genes)
were obtained from the GSE23746 AS dataset. The Venn diagram
intersections showed 64 shared upregulated DEGs and 88 shared
downregulated DEGs (Fig. 4B).
KEGG analysis of OA and AS common
DEGs
To understand the function of DEGs shared by OA and
AS, KEGG functional enrichment analysis was performed on the 64
upregulated DEGs and 88 downregulated DEGs (Fig. 4C). The results showed that
upregulated DEGs were enriched in the metabolism of selenium
compounds, chronic myeloid leukemia, bacterial invasion of
epithelial cells and adhesion junction processes. Downregulated
DEGs were mainly enriched in shigellosis, epithelial cell signaling
in Helicobacter pylori infection, IL-17 signaling pathway,
T-cell receptor signaling pathway and pathogenic E. coli
infection processes.
The enrichment results showed that the common
transcriptional features of PBMCs in patients with OA and patients
with AS were the disruption (activation or inhibition) of
infectious disease-related processes and the suppression of immune
system-related pathways.
PPI analysis for screening hub
genes
To understand the interrelationships between the
DEGs corresponding to the encoded proteins, all 152 DEGs (64 up-
and 88 downregulated) were uploaded to the STRING database to
construct the PPI network (Fig.
4D). The PPI network contains a total of 85 nodes and 145
edges. In order to screen the hub genes, the PPI network was
imported into Cytoscape software and the cytoHubba plug-in was used
to assign values to each protein according to the topological
network algorithm. The top five scored genes in the Maximal Clique
Centrality mode were analyzed, which were NFKBIA, EGR1, CXCL8,
PTGS2 and GSK3B (Fig.
4E).
Metabolite-gene network analysis
The ‘Network Analysis’ function in Metaboanalyst 6.0
(metaboanalyst.ca/), an online metabolomics analysis platform, was
applied to perform Gene-Metabolite Interaction Network Analysis on
five caffeine-related metabolites (caffeine, theophylline,
1-methyluric acid, 1-methylxanthine and 1,7-dimethyluric acid) and
the top five scoring hub genes (NFKBIA, EGR1, CXCL8, PTGS2
and GSK3B). Caffeine was found to interact with EGR1
and GSK3B (Fig. 4F).
Validation of clinical samples
To verify the effect of caffeine on EGR1 and
GSK3B genes, the same batch of serum samples used for the
metabolomics assay were used and the ELISA method was applied to
measure the concentrations of Egr1 and GSK3β proteins in the serum
of the aforementioned groups. The standard curves were plotted
using CurveExpert 1.4 and the OD450 values were converted to
standard units of ng/ml. The correlation coefficients of the
standard curves of each batch were r>0.999 and the results were
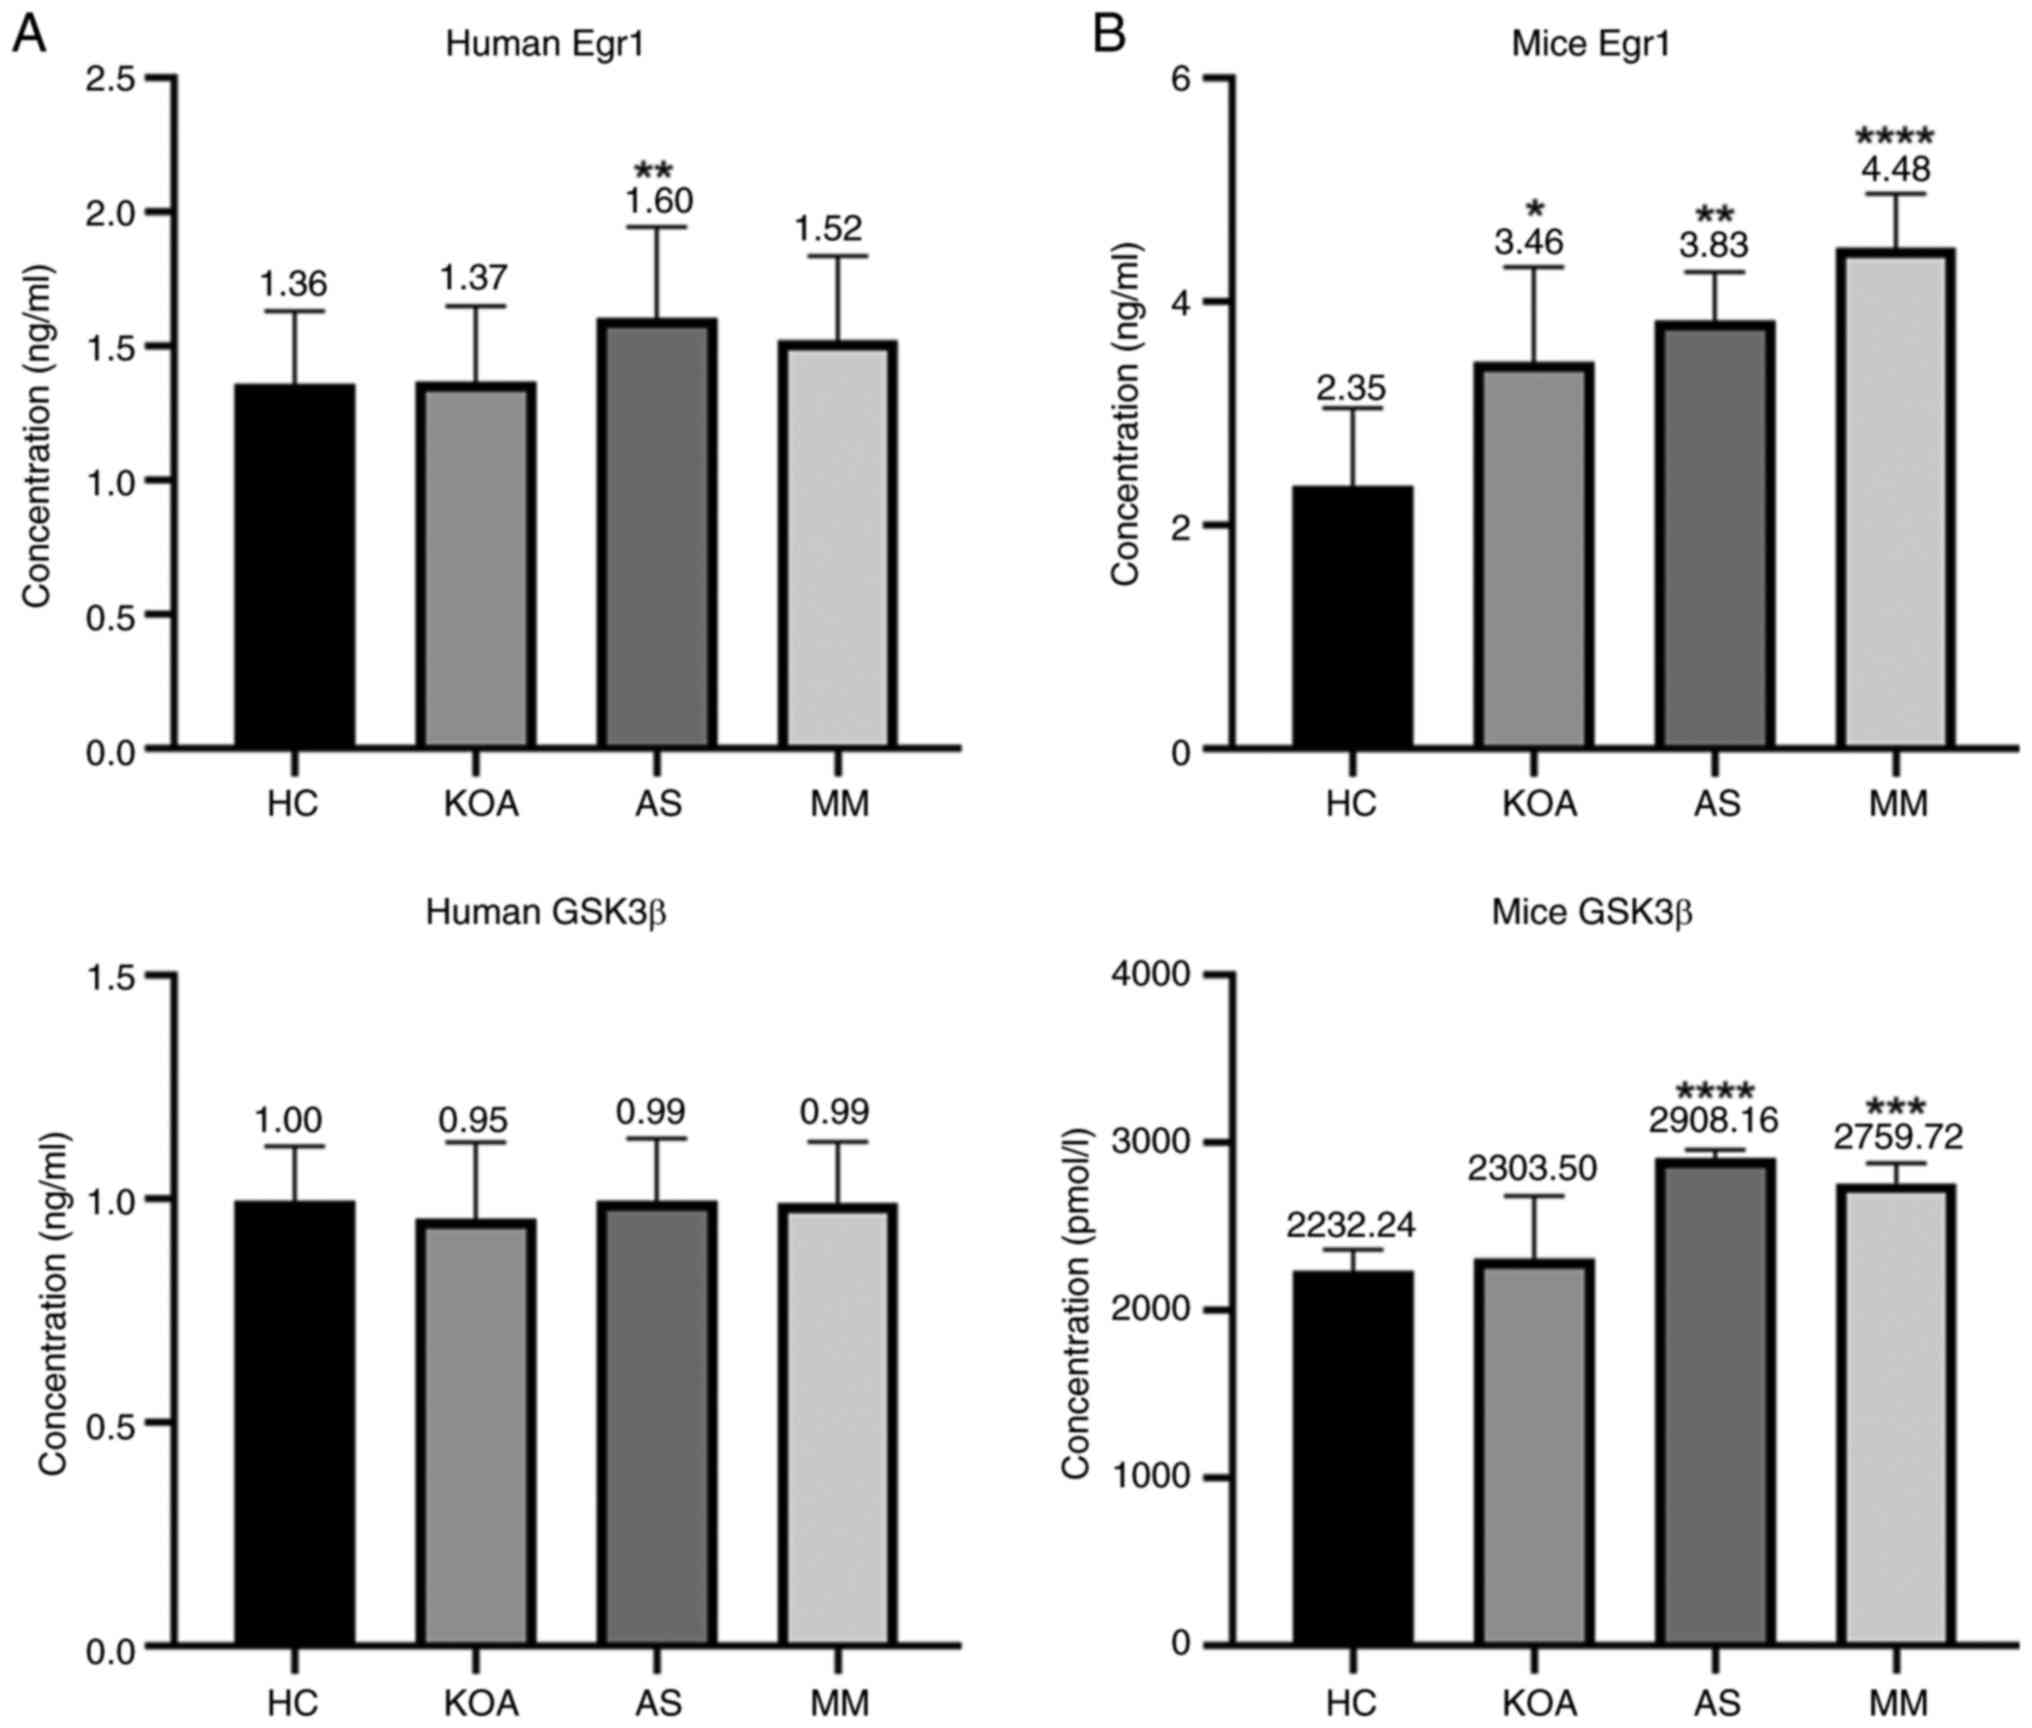
reliable. The bar graph (Fig. 5A)
showed that the human serum GSK3β protein concentrations did not
differ between groups; whereas the human serum Egr1 protein
concentration exhibited an association with AS. Serum Egr1 protein
concentration was markedly higher in the AS compared with that in
the HC group.
Validation of disease modeling
effects
To validate the hub genes for KOA-AS multimorbidity,
a disease model generated in mice corresponding to the clinical
study groups was used. After the experimental animals were randomly
grouped, they were pre-housed for 1 week and were fed normal chow
to acclimate them to the environment before modeling. A total of 1
week after the mice were acclimated to the environment, the mice in
the AS and MM groups were fed high-fat chow, whereas the KOA model
was surgically constructed by applying the modified Hulth method to
the mice in the KOA and MM groups from week 3.
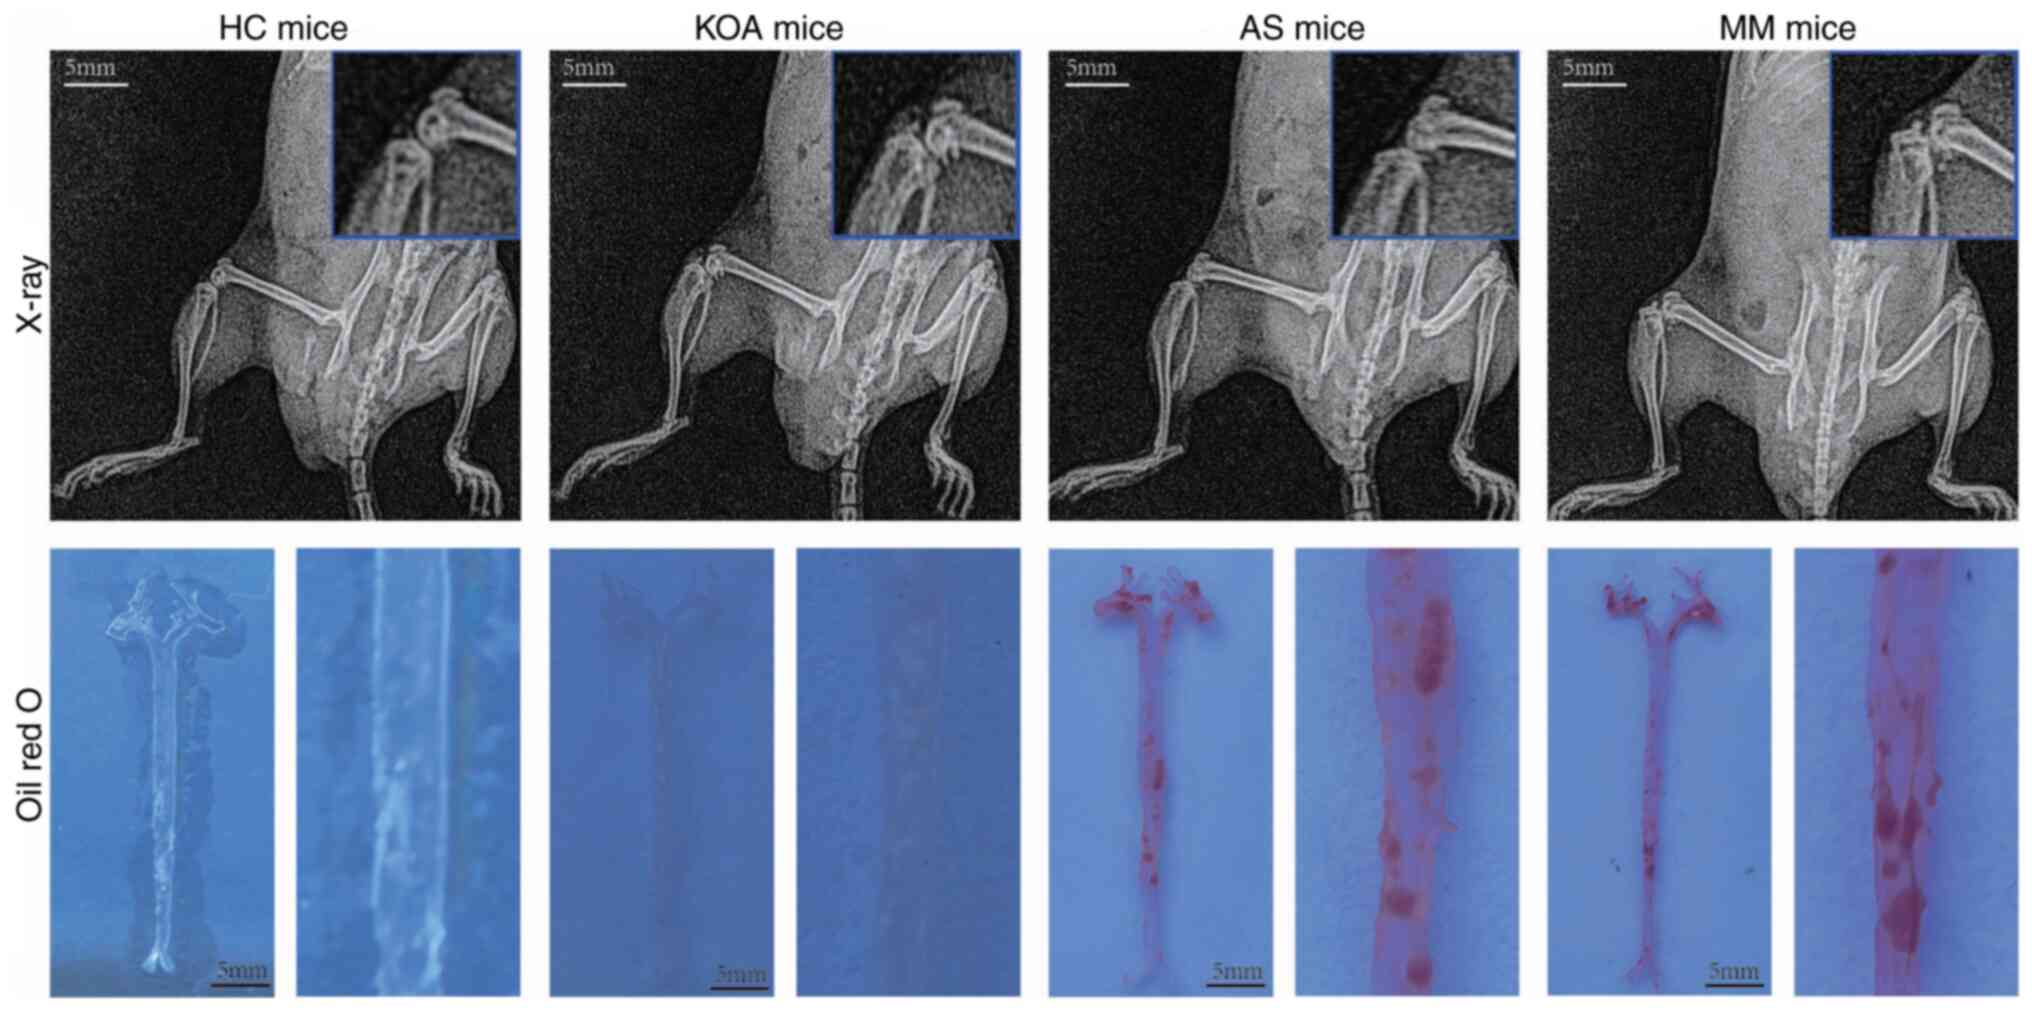
The modeling effect of the mice in each group was
verified after 12 weeks of high-fat chow feeding and the materials
(Aorta, cartilage, blood) were taken at the same time (Fig. 6). X-ray examination showed that the
knee joints of mice in the KOA and MM groups had obvious
osteoclasts, whereas the knee joints of mice in the other two
groups were smooth and free of osteoclasts. The results of Oil Red
O staining showed that lipid plaques had formed in the aorta of
mice in the AS and MM groups, whereas no lipid plaques were
observed in the other two groups. Based on these results, it was
determined that the animal disease models were successfully
constructed.
Differential expression of the hub
genes in the serum of animal disease models
The concentrations of two proteins, Egr1 and GSK3β,
in the serum of each group of mice were determined by ELISA. The
standard curve was plotted using CurveExpert 1.4 and the OD450
values were converted to ng/ml or pmol/l. The standard curves for
each batch showed correlation coefficients r>0.999, confirming
reliability (Fig. 5B).
The serum Egr1 protein concentration of mice was
associated with both KOA and AS and there were significant
differences in the levels in the KOA, AS and MM group compared with
those in the HC group. In addition, there was a rising trend with
the increase in the number of diseased mice (healthy control <
suffering from a single disease < suffering from a co-morbid
disease). The results were in agreement with the metabolite-gene
network analysis, thus indicating that EGR1 may be the key
gene for KOA-AS multimorbidity.
Serum GSK3β protein concentration in mice was
associated with AS only, with significant differences in the AS and
the MM group compared with the HC group.
Differential expression of hub genes
in the cartilage tissues of animal disease models
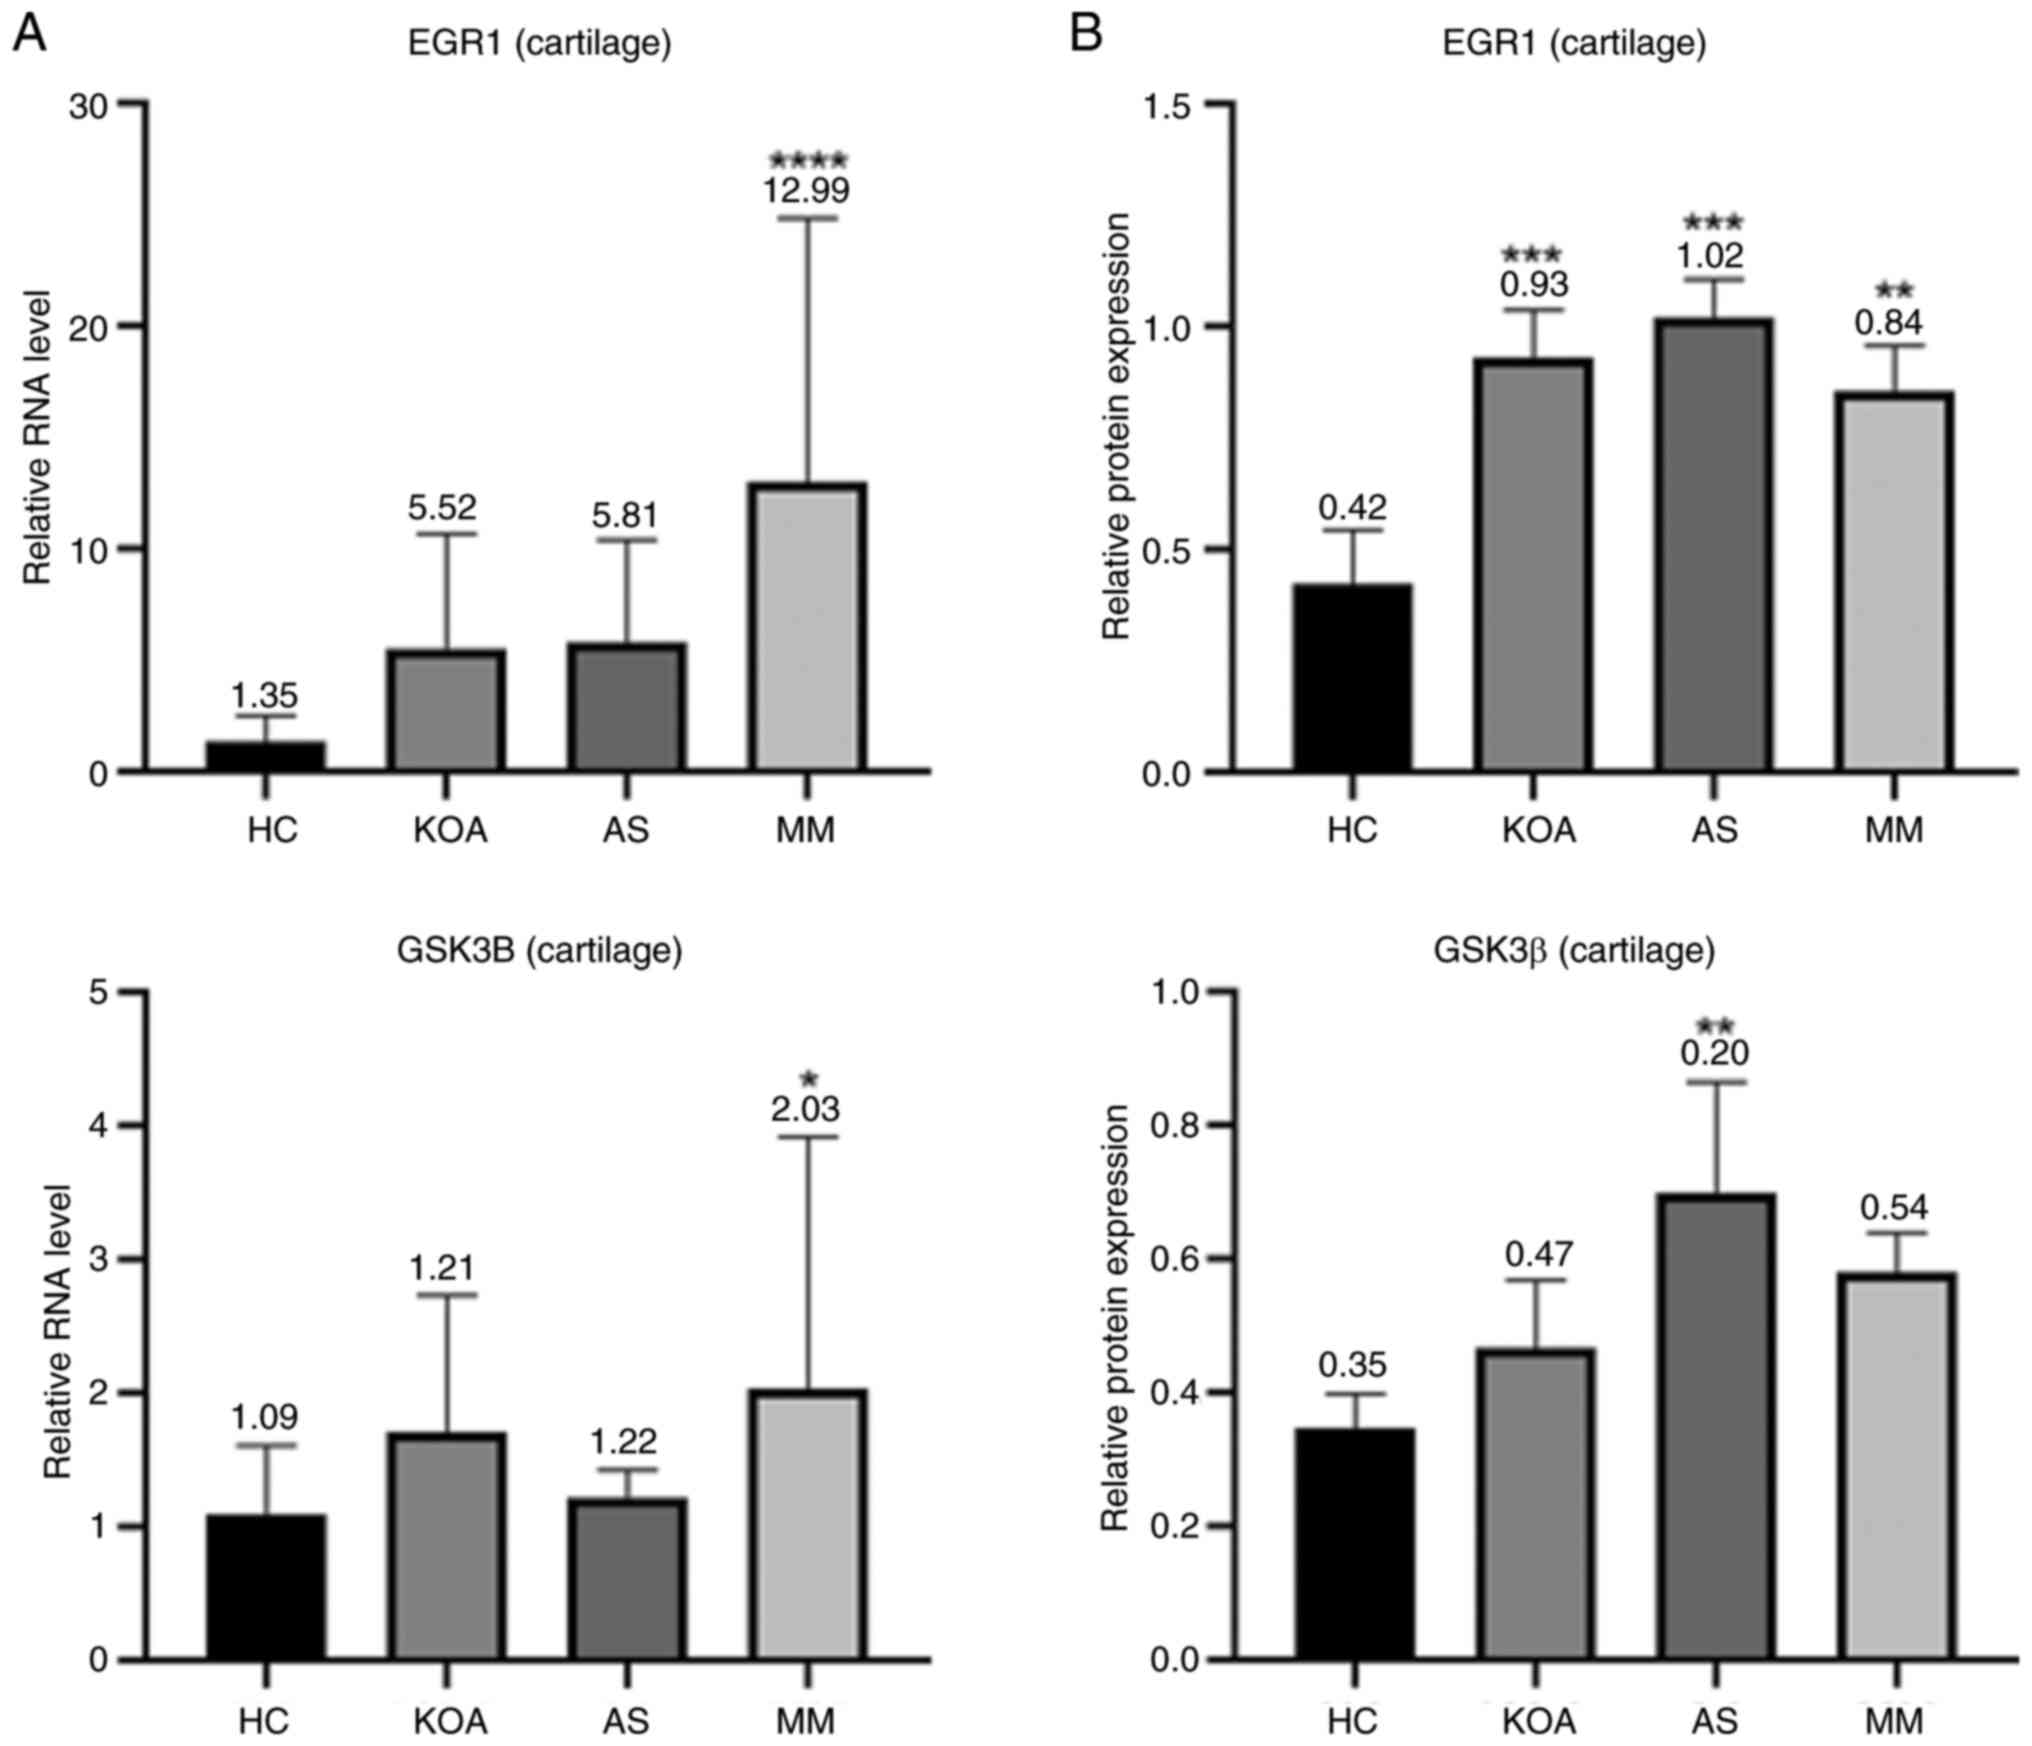
The bar graphs (Fig.
7) showed that in mouse articular cartilage tissues, the RNA
transcript levels of EGR1 and the protein expression levels
of Egr1 were markedly higher in the KOA, AS and MM group than those
in the HC group, which was in line with the results shown in the
mouse serum samples. The results regarding GSK3β did not show a
uniform pattern and the expression levels of GSK3β in mouse
cartilage tissues only showed an association with AS, which was
consistent with the results in the mouse serum; however, the RNA
transcript levels of GSK3B in cartilage tissues were only
associated with KOA. In conclusion, Egr1 exhibited a high
association with KOA-AS multimorbidity in mouse serum, which was
further verified in the assessment of mouse cartilage tissues and
its corresponding gene EGR1 is expected to be a common
therapeutic target for KOA and AS.
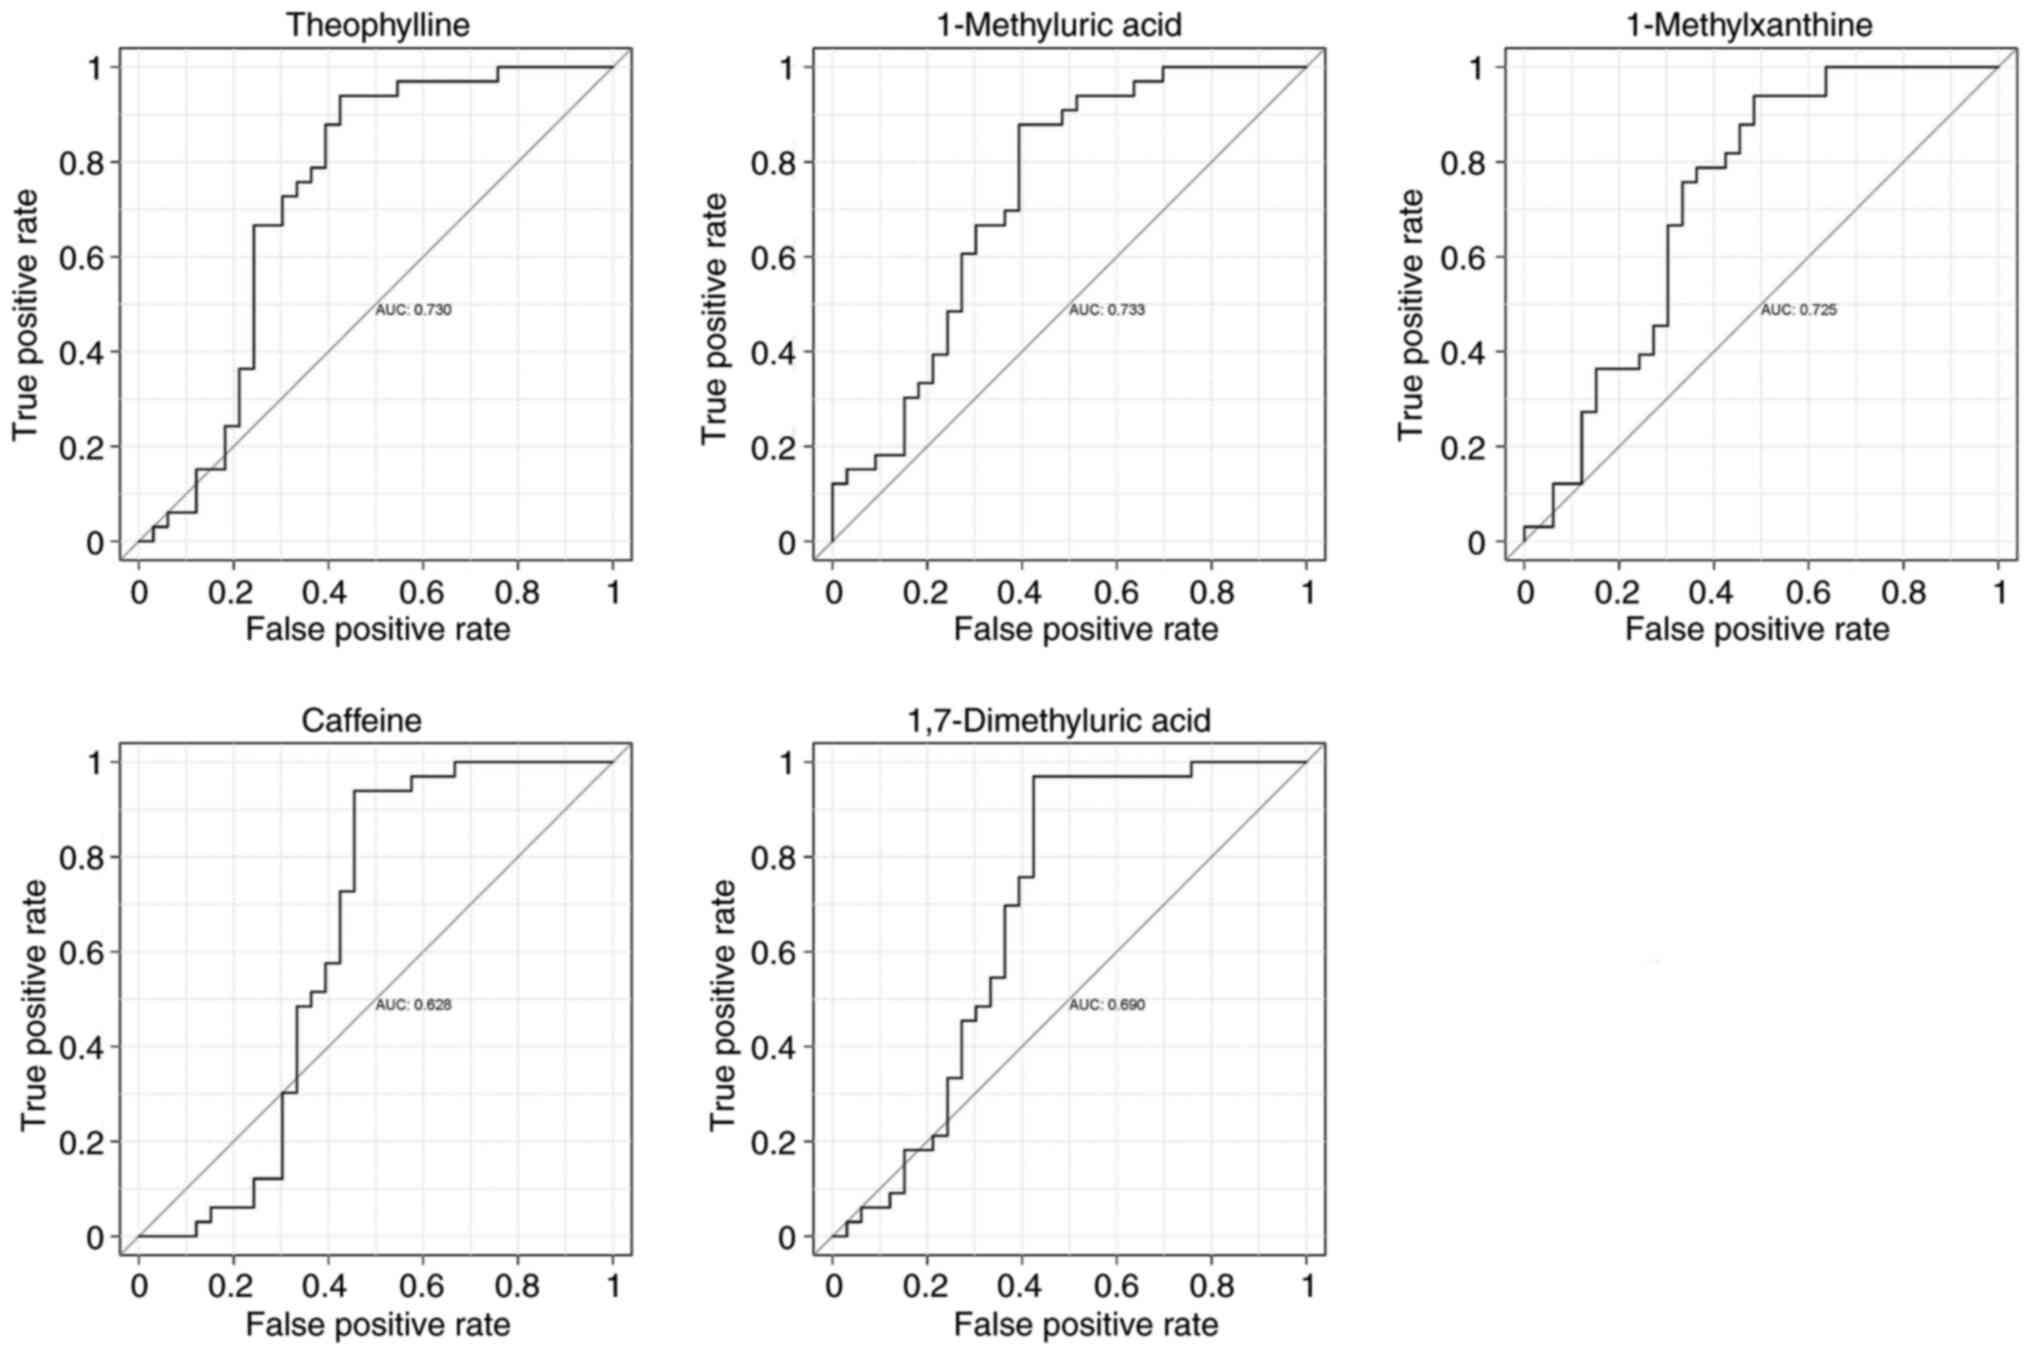
ROC curve analysis of metabolites
To assess the diagnostic value of caffeine and its
secondary metabolites (theophylline, 1-methyluric acid,
1-methylxanthine and 1,7-dimethyluric acid), a subject workup
characterization (ROC curve analysis) was performed using relative
quantitative values of metabolites from metabolomics analysis in
the HC and MM groups (Fig. 8),
which showed that theophylline, 1-methyluric acid and
1-methylxanthine had a better potential to become diagnostic
markers (AUC >0.7), whereas caffeine and 1,7-dimethyluric acid
had a relatively average performance (AUC >0.6).
Predicting KOA-AS multimorbidity
drugs
EGR1 was imported into the DGidb database for
drug prediction and a total of two small-molecule targeted drugs
(GENIPIN, BRIVOLIGIDE) were exported; the DGidb database online
scoring software was used to calculate the interaction scores of
the drugs with the genes (Table
II). The results revealed that the interaction scores of these
two drugs were high and both of them were not approved for the
market, thus indicating that EGR1 may be a potential future
drug target.
| Table II.DGidb Database output. |
Table II.
DGidb Database output.
| Gene | Drug | Regulatory
approval | Interaction
Score |
|---|
| EGR1 | GENIPIN | Not approved | 52.203799 |
| EGR1 | BRIVOLIGIDE | Not approved | 26.101899 |
Discussion
From the point of view of metabolic abnormalities,
in the present study population, obesity (BMI), blood glucose, a
previous history of hypertension and a previous history of diabetes
mellitus were associated with both KOA and AS, whereas systolic
blood pressure, diastolic blood pressure and triglycerides were
mainly associated with AS. These findings suggested that metabolic
abnormalities may be more pronounced in those with AS than those
with KOA in a population with a mean age of 40 years. Consistent
results were also obtained in the intergroup clustering heat map
analysis of serum metabolomics, where the serum metabolic profile
of the KOA group was closer to that of the HC group among the two
mono-disease groups, whereas that of the AS group was closer to
that of the MM group, suggesting that metabolic abnormalities have
a greater effect on AS. In addition, the results of the analysis of
blood pressure (associated only with AS) and previous history of
hypertension (associated with both KOA and AS) were not consistent
in the same population, presumably influenced by the control of
antihypertensive medication.
The present results suggested that OA and AS are
interrelated through the metabolic syndrome, with various
components of the metabolic syndrome (obesity, diabetes mellitus,
dyslipidemia and hypertension) associated with OA (39) and it has been suggested that OA is
a phenotype of the metabolic syndrome (40). In addition, metabolic syndrome is a
risk factor for CVDs, which involves a variety of pathologies such
as dyslipidemia, elevated blood glucose and elevated blood
pressure, all of which increase the risk of AS (41).
The mean age of the present study population was
low, which may explain the lack of abnormalities in metabolic
pathways associated with metabolic syndrome in the results of
metabolomics analysis. On the other hand, however, conducting the
present study in a relatively young population may help to
understand the earliest onset state of the disease. Although not
markedly enriched for abnormalities in pathways associated with
metabolic syndrome, caffeine metabolism was observed to be markedly
enriched in all three comparison groups based on the results of
KEGG enrichment analysis, suggesting that abnormalities in caffeine
metabolism may be associated with KOA-AS multimorbidity. In the
single-indicator analysis for caffeine and its secondary
metabolites (theophylline, 1-methyluric acid, 1-methylxanthine and
1,7-dimethyluric acid), a consistent trend was observed in which
the levels of these metabolites were markedly increased with the
number of diseased individuals in the study population. The higher
the relative serum levels of caffeine and its secondary metabolites
in the current study population, the higher the risk of developing
KOA-AS multimorbidity and it could be hypothesized that caffeine
metabolism capacity varies between individuals and that caffeine
metabolism disorders may exist. It is hypothesized that caffeine
metabolism impairment results in progressive serum caffeine
accumulation. Consequently, elevated caffeine levels drive
inflammatory disease pathogenesis through EGR1 gene
dysregulation and the induction of a pro-inflammatory milieu.
Previous studies have reported that the CYP1A2 gene rs762551
polymorphism is associated with individual caffeine metabolism
capacity (42,43). Individuals with the AA genotype
have been identified as ‘slow metabolizers’ of caffeine, exhibiting
markedly lower caffeine clearance rates compared with AC/CC
genotype ‘fast metabolizers’ (42,43).
The inferred ‘caffeine metabolism disorder’ in our study may be
related to this SNP, indicating that differences in serum caffeine
levels are influenced by both lifestyle habits and genetic factors.
The current study did not include genotyping of this SNP locus nor
collected data on caffeine intake. This will be a key direction for
future research.
Previous studies on the relationship between
caffeine and health are controversial; a previous study suggesting
that caffeine intake is protective against CVDs and that long-term
caffeine intake develops tolerance (44), whereas others have demonstrated
that caffeine intake raises adrenaline levels and blood pressure in
the short term (45), which may
have an acute detrimental effect on aortic stiffness in patients
with hypertension (46). This
suggests that elevated blood pressure may be the earliest in the
spectrum of metabolic abnormalities associated with KOA-AS
multimorbidity.
Bioinformatics analysis using public transcriptomics
datasets showed that the common feature of OA and AS in the high
age group (mean age >60 years) was inflammation, which is
consistent with the expectation of the present study, as evidenced
by the disruption of infectious disease-related pathways and the
suppression of some immune system signaling pathways. The five key
genes screened in the current study (NFKBIA, EGR1, CXCL8,
PTGS2 and GSK3B) are also involved in inflammatory
responses to varying degrees. Combining the present findings with
those of previous studies, it may be extrapolated that the
inflammatory state in the late stage of the disease in patients
with KOA-AS multimorbidity is caused by numerous metabolic
abnormalities in the early stage.
In the metabolite-gene interaction network analysis,
it was revealed that EGR1 and GSK3B interacted with
caffeine and through further review of the literature, it was
demonstrated that caffeine may have inconsistent effects on
EGR1 and GSK3B under different circumstances.
Previous studies suggested that caffeine activates GSK3β by
inhibiting its phosphorylation (47,48);
as for EGR1, some studies have shown that EGR1
expression is downregulated in hepatocytes after treatment with a
certain concentration of caffeine (49); and that caffeine upregulates SIRT3
expression by inhibiting the EGR1 signaling pathway in
astrocytes of the central nervous system in mice (50). Others have shown that caffeine has
a promoting effect on EGR1 expression, such as in mice
treated with caffeine combined with cocaine, where the prefrontal
cortex EGR1 expression was shown to be upregulated (51). This suggests that caffeine has
varying effects on EGR1 in different tissues or
physiological states.
Based on the findings that EGR1/Egr1 was
markedly upregulated in both serum and cartilage tissues
(RNA/protein levels) in the KOA, AS and MM groups in advanced
disease models, whereas in the serum of clinically mildly ill
patients, Egr1 was elevated only in the AS group, its reliability
may be suggested as a KOA-AS multimorbid hub gene with
transformation into a generalized marker in advanced stages. By
contrast, the regulation of GSK3β showed complexity; its protein
levels (serum and cartilage) were elevated in the AS and MM groups,
whereas its RNA levels in cartilage were associated with KOA,
suggesting post-transcriptional regulation or functional
differentiation. Notably, disease stage markedly affected the
results, with widespread abnormalities of Egr1/GSK3β in late models
(compared with early clinical samples) supporting the inference
that late inflammation is triggered by early metabolic
abnormalities. In addition, diseased mice without caffeine intake
still exhibited elevated serum Egr1 and GSK3β, suggesting that
their levels are regulated by factors other than caffeine.
In previous studies, EGR1 has been reported
as a possible hub gene of KOA (52) and AS (53). To the best of the authors'
knowledge, the present study is the first to propose the key role
of EGR1 in KOA-AS multimorbidity and to construct an
innovative disease model of KOA-AS multimorbidity. Notably, the
results of the metabolite-gene network analysis were verified by
mice experiments. EGR1 has also been reported to be
associated with metabolic disorders such as metabolic dysfunctions,
insulin resistance and others (54,55),
which supports the association between metabolic abnormalities and
EGR1. As a transcriptional regulator, EGR1 plays a
key role in the regulation of macrophage inflammatory response and
it may be hypothesized that metabolic abnormalities could promote
inflammation by regulating the expression of EGR1.
In the clinical application analysis, the present
study identified three caffeine secondary metabolites
(theophylline, 1-methyluric acid and 1-methylxanthine) as having
potential to become diagnostic biomarkers and EGR1 was
considered a drug target with some value. Although GENIPIN (a drug
predicted by EGR1), has not been approved for marketing,
experimental studies have suggested that hydrogels linked by
GENIPIN can reduce joint wear and tear in patients with OA
(56) and GENIPIN can be used to
make scaffolds for cardiovascular use (57). In addition, it has been suggested
that GENIPIN may ameliorate the effects of hyperlipidemia and lipid
accumulation in the liver (58).
These findings also corroborate the reliability of the predicted
results.
In conclusion, the present study not only verified
previous studies on KOA-AS multimorbidity, but also explored the
association between KOA and AS and the possible formation
mechanisms of KOA-AS multimorbidity from numerous perspectives.
Abnormal caffeine metabolism was revealed to be an early risk
factor for KOA-AS multimorbidity and potential hub genes for KOA-AS
multimorbidity were identified. Preliminary predictions on the
clinical value of these key molecules for KOA-AS multimorbidity
were conducted, which are expected to provide new directions for
diagnostic and therapeutic studies of KOA-AS multimorbidity.
Finally, the present study has the following shortcomings: i) The
available information could not determine the reasons for the
differences in serum caffeine levels between the groups and
caffeine intake needs to be assessed to confirm this; ii) the
current findings do not clarify the specific effects of caffeine
and the location of its effects on KOA-AS multimorbidity and
interventional experiments need to be performed to further
demonstrate this; and iii) predictions about the value of clinical
applications need to be verified by further experiments.
Supplementary Material
Supporting Data
Acknowledgements
Not applicable.
Funding
The present study was funded by the National Key Research and
Development Program of China (grant no. 2023YFC3604900); National
Natural Science Foundation of China (grant no. 82172410); Capital
Foundation of Medical Development and Research (grant nos.
2024-2G-6043 and 2024-4-6045).
Availability of data and materials
The data generated in the present study may be
requested from the corresponding author.
Authors' contributions
QK, KZ and PY conceived the study and designed the
methodology. QK, PX and WX performed experiments. ZG, QK and LD
analyzed data. QK wrote the original draft. KZ, PY and ZG reviewed
and edited the manuscript. All authors have read and approved the
final manuscript. QK and KZ confirm the authenticity of all the raw
data.
Ethics approval and consent to
participate
The present study was performed in accordance with
the guidelines of the Declaration of Helsinki and the clinical part
of the study was approved by the Medical Ethics Committee of
Shougang Hospital of Peking University (approval no.
IRBK-2024-012-01, approval date March 27, 2024); the animal
experiments was approved by the Ethics Committee for Experimental
Animals of Beijing JinglaiHuake Biotechnology Co (approval no.
JLHK-20241110-02, approved date November 13, 2024). All clinical
cases recruited for this study have signed an informed consent
form; data collected from previous studies or samples from biobanks
used in this study have been exempted from informed consent.
Patient consent for publication
Not applicable.
Competing interests
The authors declare that they have no competing
interests.
Authors' information
Dr Zhang Keshi ORCID: 0000-0003-3547-1964. Dr
Zhenpeng Guan ORCID: 0000-0002-4487-7918.
References
|
1
|
Wang XQ and Chen PJ: Population ageing
challenges health care in China. Lancet. 383:8702014. View Article : Google Scholar : PubMed/NCBI
|
|
2
|
Barnett K, Mercer SW, Norbury M, Watt G,
Wyke S and Guthrie B: Epidemiology of multimorbidity and
implications for health care, research and medical education: A
cross-sectional study. Lancet. 380:37–43. 2012. View Article : Google Scholar : PubMed/NCBI
|
|
3
|
Marengoni A, Angleman S, Melis R,
Mangialasche F, Karp A, Garmen A, Meinow B and Fratiglioni L: Aging
with multimorbidity: A systematic review of the literature. Ageing
Res Rev. 10:430–439. 2011. View Article : Google Scholar : PubMed/NCBI
|
|
4
|
Sav A, Kendall E, McMillan SS, Kelly F,
Whitty JA, King MA and Wheeler AJ: ‘You say treatment, I say hard
work’: Treatment burden among people with chronic illness and their
carers in Australia. Health Soc Care Community. 21:665–674.
2013.PubMed/NCBI
|
|
5
|
Banjare P and Pradhan J: Socio-economic
inequalities in the prevalence of multi-morbidity among the rural
elderly in Bargarh District of Odisha (India). PLoS One.
9:e978322014. View Article : Google Scholar : PubMed/NCBI
|
|
6
|
Lawrence RC, Helmick CG, Arnett FC, Deyo
RA, Felson DT, Giannini EH, Heyse SP, Hirsch R, Hochberg MC, Hunder
GG, et al: Estimates of the prevalence of arthritis and selected
musculoskeletal disorders in the United States. Arthritis Rheum.
41:778–799. 1998. View Article : Google Scholar : PubMed/NCBI
|
|
7
|
Lawrence RC, Felson DT, Helmick CG, Arnold
LM, Choi H, Deyo RA, Gabriel S, Hirsch R, Hochberg MC, Hunder GG,
et al: Estimates of the prevalence of arthritis and other rheumatic
conditions in the United States. Part II. Arthritis Rheum.
58:26–35. 2008. View Article : Google Scholar : PubMed/NCBI
|
|
8
|
Wang SY, Olson-Kellogg B, Shamliyan TA,
Choi JY, Ramakrishnan R and Kane RL: Physical therapy interventions
for knee pain secondary to osteoarthritis: A systematic review. Ann
Intern Med. 157:632–644. 2012. View Article : Google Scholar : PubMed/NCBI
|
|
9
|
Bijlsma JW, Berenbaum F and Lafeber FP:
Osteoarthritis: An update with relevance for clinical practice.
Lancet. 377:2115–2126. 2011. View Article : Google Scholar : PubMed/NCBI
|
|
10
|
He Y, Jiang W and Wang W: Global burden of
osteoarthritis in adults aged 30 to 44 years, 1990 to 2019: Results
from the Global Burden of Disease Study 2019. BMC Musculoskelet
Disord. 25:3032024. View Article : Google Scholar : PubMed/NCBI
|
|
11
|
Wu H, Yao R, Wu J, Wen G and Wang Y: Does
kinesio taping plus exercise improve pain and function in patients
with knee osteoarthritis?: A systematic review and meta-analysis of
randomized controlled trials. Front Physiol. 13:9612642022.
View Article : Google Scholar : PubMed/NCBI
|
|
12
|
Brosseau L, Taki J, Desjardins B, Thevenot
O, Fransen M, Wells GA, Imoto AM, Toupin-April K, Westby M,
Gallardo ICÁ, et al: The Ottawa panel clinical practice guidelines
for the management of knee osteoarthritis. Part one: Introduction
and mind-body exercise programs. Clin Rehabil. 31:582–595. 2017.
View Article : Google Scholar : PubMed/NCBI
|
|
13
|
Bauersachs R, Zeymer U, Brière JB, Marre
C, Bowrin K and Huelsebeck M: Burden of coronary artery disease and
peripheral artery disease: A literature review. Cardiovasc Ther.
2019:82950542019. View Article : Google Scholar : PubMed/NCBI
|
|
14
|
Benjamin EJ, Virani SS, Callaway CW,
Chamberlain AM, Chang AR, Cheng S, Chiuve SE, Cushman M, Delling
FN, Deo R, et al: Heart disease and stroke Statistics-2018 Update:
A report from the american heart association. Circulation.
137:e67–e492. 2018. View Article : Google Scholar : PubMed/NCBI
|
|
15
|
Conaghan PG, Vanharanta H and Dieppe PA:
Is progressive osteoarthritis an atheromatous vascular disease? Ann
Rheum Dis. 64:1539–1541. 2005. View Article : Google Scholar : PubMed/NCBI
|
|
16
|
Mathieu S, Couderc M, Tournadre A and
Soubrier M: Cardiovascular profile in osteoarthritis: A
meta-analysis of cardiovascular events and risk factors. Joint Bone
Spine. 86:679–684. 2019. View Article : Google Scholar : PubMed/NCBI
|
|
17
|
Hall AJ, Stubbs B, Mamas MA, Myint PK and
Smith TO: Association between osteoarthritis and cardiovascular
disease: Systematic review and meta-analysis. Eur J Prev Cardiol.
23:938–946. 2016. View Article : Google Scholar : PubMed/NCBI
|
|
18
|
Wang H, Bai J, He B, Hu X and Liu D:
Osteoarthritis and the risk of cardiovascular disease: A
meta-analysis of observational studies. Sci Rep. 6:396722016.
View Article : Google Scholar : PubMed/NCBI
|
|
19
|
Veronese N, Cereda E, Maggi S, Luchini C,
Solmi M, Smith T, Denkinger M, Hurley M, Thompson T, Manzato E, et
al: Osteoarthritis and mortality: A prospective cohort study and
systematic review with meta-analysis. Semin Arthritis Rheum.
46:160–167. 2016. View Article : Google Scholar : PubMed/NCBI
|
|
20
|
Kadam UT, Holmberg A, Blagojevic M,
Nilsson PM and Akesson K: Risk factors for cardiovascular disease
and future osteoarthritis-related arthroplasty: A population-based
cohort study in men and women from Malmö, Sweden. Scand J
Rheumatol. 40:478–485. 2011. View Article : Google Scholar : PubMed/NCBI
|
|
21
|
Hoeven TA, Kavousi M, Ikram MA, van Meurs
JB, Bindels PJ, Hofman A, Franco OH and Bierma-Zeinstra SM: Markers
of atherosclerosis in relation to presence and progression of knee
osteoarthritis: A Population-based cohort study. Rheumatology
(Oxford). 54:1692–1698. 2015. View Article : Google Scholar : PubMed/NCBI
|
|
22
|
Hoeven TA, Kavousi M, Clockaerts S,
Kerkhof HJ, van Meurs JB, Franco O, Hofman A, Bindels P, Witteman J
and Bierma-Zeinstra S: Association of atherosclerosis with presence
and progression of osteoarthritis: The Rotterdam Study. Ann Rheum
Dis. 72:646–651. 2013. View Article : Google Scholar : PubMed/NCBI
|
|
23
|
Wang Y, Novera D, Wluka AE, Fairley J,
Giles GG, O'Sullivan R and Cicuttini FM: Association between
popliteal artery wall thickness and knee structure in adults
without clinical disease of the knee: A prospective cohort study.
Arthritis Rheumatol. 67:414–422. 2015. View Article : Google Scholar : PubMed/NCBI
|
|
24
|
Jonsson H, Fisher DE, Eiriksdottir G,
Aspelund T, Klein R, Gudnason V and Cotch MF: Hand and knee
osteoarthritis are associated with reduced diameters in retinal
vessels: The AGES-Reykjavik study. Rheumatol Int. 39:669–677. 2019.
View Article : Google Scholar : PubMed/NCBI
|
|
25
|
Li W, Guo H, Wang C, Zhang Y and Wang J:
Autologous micro-fragmented adipose tissue in the treatment of
atherosclerosis patients with knee osteoarthritis in geriatric
population: A systematic review and meta-analysis. PLoS One.
18:e02896102023. View Article : Google Scholar : PubMed/NCBI
|
|
26
|
Altman R, Asch E, Bloch D, Bole G,
Borenstein D, Brandt K, Christy W, Cooke TD, Greenwald R, Hochberg
M, et al: Development of criteria for the classification and
reporting of osteoarthritis. Classification of osteoarthritis of
the knee. Diagnostic and Therapeutic Criteria Committee of the
American Rheumatism Association. Arthritis Rheum. 29:1039–1049.
1986. View Article : Google Scholar : PubMed/NCBI
|
|
27
|
Chambers MC, Maclean B, Burke R, Amodei D,
Ruderman DL, Neumann S, Gatto L, Fischer B, Pratt B, Egertson J, et
al: A cross-platform toolkit for mass spectrometry and proteomics.
Nature Biotechnol. 30:918–920. 2012. View Article : Google Scholar : PubMed/NCBI
|
|
28
|
Smith CA, Want EJ, O'Maille G, Abagyan R
and Siuzdak G: XCMS: Processing mass spectrometry data for
metabolite profiling using nonlinear peak alignment, matching and
identification. Anal Chem. 78:779–787. 2006. View Article : Google Scholar : PubMed/NCBI
|
|
29
|
Dai W, Xie D, Lu M, Li P, Lv H, Yang C,
Peng Q, Zhu Y, Guo L, Zhang Y, et al: Characterization of white tea
metabolome: Comparison against green and black tea by a nontargeted
metabolomics approach. Food Res Int. 96:40–45. 2017. View Article : Google Scholar : PubMed/NCBI
|
|
30
|
Wen B, Mei Z, Zeng C and Liu S: metaX: A
flexible and comprehensive software for processing metabolomics
data. BMC Bioinformatics. 18:1832017. View Article : Google Scholar : PubMed/NCBI
|
|
31
|
Ghosh D: Incorporating the empirical null
hypothesis into the Benjamini-Hochberg procedure. Stat Appl Genet
Mol Biol. 112012.doi: 10.1515/1544-6115.1735. PubMed/NCBI
|
|
32
|
Shannon P, Markiel A, Ozier O, Baliga NS,
Wang JT, Ramage D, Amin N, Schwikowski B and Ideker T: Cytoscape: A
software environment for integrated models of biomolecular
interaction networks. Genome Res. 13:2498–2504. 2003. View Article : Google Scholar : PubMed/NCBI
|
|
33
|
Chin CH, Chen SH, Wu HH, Ho CW, Ko MT and
Lin CY: cytoHubba: Identifying hub objects and sub-networks from
complex interactome. BMC Syst Biol. 8 (Suppl 4):S112014. View Article : Google Scholar : PubMed/NCBI
|
|
34
|
Pang Z, Lu Y, Zhou G, Hui F, Xu L, Viau C,
Spigelman AF, MacDonald PE, Wishart DS, Li S and Xia J:
MetaboAnalyst 6.0: Towards a unified platform for metabolomics data
processing, analysis and interpretation. Nucleic Acids Res.
52:W398–W406. 2024. View Article : Google Scholar : PubMed/NCBI
|
|
35
|
Ji X, Du W, Che W, Wang L and Zhao L:
Apigenin inhibits the progression of osteoarthritis by mediating
macrophage polarization. Molecules. 28:29152023. View Article : Google Scholar : PubMed/NCBI
|
|
36
|
Livak KJ and Schmittgen TD: Analysis of
relative gene expression data using real-time quantitative PCR and
the 2(−Delta Delta C(T)) method. Methods. 25:402–408. 2001.
View Article : Google Scholar : PubMed/NCBI
|
|
37
|
Cannon M, Stevenson J, Stahl K, Basu R,
Coffman A, Kiwala S, McMichael JF, Kuzma K, Morrissey D, Cotto K,
et al: DGIdb 5.0: Rebuilding the drug-gene interaction database for
precision medicine and drug discovery platforms. Nucleic Acids Res.
52:D1227–D1235. 2024. View Article : Google Scholar : PubMed/NCBI
|
|
38
|
Chen X, Xie C, Sun L, Ding J and Cai H:
Longitudinal metabolomics profiling of Parkinson's Disease-Related
α-Synuclein A53T transgenic mice. PLoS One. 10:e01366122015.
View Article : Google Scholar : PubMed/NCBI
|
|
39
|
Sampath SJP, Venkatesan V, Ghosh S and
Kotikalapudi N: Obesity, metabolic syndrome and Osteoarthritis-an
updated review. Curr Obes Reps. 12:308–331. 2023. View Article : Google Scholar : PubMed/NCBI
|
|
40
|
Katz JD, Agrawal S and Velasquez M:
Getting to the heart of the matter: Osteoarthritis takes its place
as part of the metabolic syndrome. Curr Opin Rheumatol. 22:512–519.
2010. View Article : Google Scholar : PubMed/NCBI
|
|
41
|
Grundy SM: Metabolic syndrome update.
Trends Cardiovasc Med. 26:364–373. 2016. View Article : Google Scholar : PubMed/NCBI
|
|
42
|
Robertson TM, Clifford MN, Penson S,
Williams P and Robertson MD: Postprandial glycaemic and lipaemic
responses to chronic coffee consumption may be modulated by CYP1A2
polymorphisms. Br J Nutr. 119:792–800. 2018. View Article : Google Scholar : PubMed/NCBI
|
|
43
|
Popa LC, Abu-Awwad A, Farcas SS, Abu-Awwad
SA and Andreescu NI: Genotype-drug-diet interactions in metabolic
regulation: CYP1A2 rs762551 modulates the effect of caffeine on
lipid and glucose profiles in the context of pharmacotherapy.
Nutrients. 17:22882025. View Article : Google Scholar : PubMed/NCBI
|
|
44
|
Islam R, Ahmed M, Ullah W, Tahir YB, Gul
S, Hussain N, Islam H and Anjum MU: Effect of caffeine in
hypertension. Curr Probl Cardiol. 48:1018922023. View Article : Google Scholar : PubMed/NCBI
|
|
45
|
van Dam RM, Hu FB and Willett WC: Coffee,
caffeine and health. N Engl J Med. 383:369–378. 2020. View Article : Google Scholar : PubMed/NCBI
|
|
46
|
Vlachopoulos C, Hirata K, Stefanadis C,
Toutouzas P and O'Rourke MF: Caffeine increases aortic stiffness in
hypertensive patients. Am J Hypertens. 16:63–66. 2003. View Article : Google Scholar : PubMed/NCBI
|
|
47
|
Duda P, Akula SM, Abrams SL, Steelman LS,
Martelli AM, Cocco L, Ratti S, Candido S, Libra M, Montalto G, et
al: Targeting GSK3 and associated signaling pathways involved in
cancer. Cells. 9:1102020. View Article : Google Scholar
|
|
48
|
Ku BM, Lee YK, Jeong JY, Ryu J, Choi J,
Kim JS, Cho YW, Roh GS, Kim HJ, Cho GJ, et al: Caffeine inhibits
cell proliferation and regulates PKA/GSK3β pathways in U87MG human
glioma cells. Mol Cells. 31:275–279. 2011. View Article : Google Scholar : PubMed/NCBI
|
|
49
|
Ma Y, Wang X and Tang N: Downregulation of
mPGES-1 Expression via EGR1 plays an important role in inhibition
of caffeine on PGE2 synthesis of HBx(+) hepatocytes. Mediators
Inflamm. 2015:3727502015. View Article : Google Scholar : PubMed/NCBI
|
|
50
|
Gao L, Sun W, Zhang L, Liang C and Zhang
D: Caffeine upregulates SIRT3 expression to ameliorate
astrocytes-mediated HIV-1 Tat neurotoxicity via suppression of EGR1
signaling pathway. J Neurovirol. 30:286–302. 2024. View Article : Google Scholar : PubMed/NCBI
|
|
51
|
Muñiz JA, Prieto JP, González B, Sosa MH,
Cadet JL, Scorza C, Urbano FJ and Bisagno V: Cocaine and caffeine
effects on the conditioned place preference test: Concomitant
changes on early genes within the mouse prefrontal cortex and
nucleus accumbens. Front Behav Neurosci. 11:2002017. View Article : Google Scholar : PubMed/NCBI
|
|
52
|
Qin Y, Li J, Zhou Y, Yin C, Li Y, Chen M,
Du Y, Li T and Yan J: Apolipoprotein D as a potential biomarker and
construction of a transcriptional regulatory-immune network
associated with osteoarthritis by weighted gene coexpression
network analysis. Cartilage. 13 (Suppl 1):1702S–1717S. 2021.
View Article : Google Scholar : PubMed/NCBI
|
|
53
|
Chhotaray S and Jal S: Identifying
biomarkers for atherosclerosis via gene expression and biological
networking. Curr Cardiol Rev. 21:e1573403X3401182025. View Article : Google Scholar : PubMed/NCBI
|
|
54
|
Wu X, Pan T, Fang Z, Hui T, Yu X and Liu
C, Guo Z and Liu C: Identification of EGR1 as a key diagnostic
biomarker in metabolic Dysfunction-associated steatotic liver
disease (MASLD) through machine learning and immune analysis. J
Inflamm Res. 18:1639–1656. 2025. View Article : Google Scholar : PubMed/NCBI
|
|
55
|
Li Z, Yu P, Wu J, Tao F and Zhou J:
Transcriptional regulation of early growth response Gene-1 (EGR1)
is associated with progression of nonalcoholic fatty liver disease
(NAFLD) in patients with insulin resistance. Med Sci Monit.
25:2293–3004. 2019. View Article : Google Scholar : PubMed/NCBI
|
|
56
|
Zamini N, Mirzadeh H, Solouk A and
Shafipour R: Injectable in situ forming hydrogel based on
carboxymethyl chitosan for sustained release of hyaluronic acid: A
viscosupplement for biomedical applications. Carbohydr Polym.
352:1232272025. View Article : Google Scholar : PubMed/NCBI
|
|
57
|
Putzu M, Causa F, Nele V, de Torre IG,
Rodriguez-Cabello JC and Netti PA: Elastin-like-recombinamers
multilayered nanofibrous scaffolds for cardiovascular applications.
Biofabrication. 8:0450092016. View Article : Google Scholar : PubMed/NCBI
|
|
58
|
Zhong H, Chen K, Feng M, Shao W, Wu J,
Chen K, Liang T and Liu C: Genipin alleviates high-fat diet-induced
hyperlipidemia and hepatic lipid accumulation in mice via
miR-142a-5p/SREBP-1c axis. FEBS J. 285:501–517. 2018. View Article : Google Scholar : PubMed/NCBI
|