Introduction
Breast cancer (BC) is the most prevalent malignancy
and foremost cause of cancer-related mortality among women globally
(1). Clinically, estrogen receptor
positive (ER+) BC is the most common subtype, whereas
triple-negative BC (TNBC) accounts for only 10–20% of cases but is
associated with aggressive behavior (2). The molecular complexity of BC,
characterized by diverse hallmarks and high heterogeneity, has
necessitated the development of combined therapies. However,
challenges persist with respect to overcoming treatment resistance,
including endocrine resistance and chemoresistance (3,4).
These clinical hurdles underscore the need to identify diagnostic
and prognostic biomarkers that can guide precision medicine
approaches.
Chromosomal instability (CIN) is a common form of
genomic instability that leads to aberrations in chromosomal
structures or numbers, such as the loss or gain of large fragments
or entire chromosomes (5–8). Recurrent CIN is observed during BC
development, as well as before and after chemotherapy (9,10).
CIN scores can be used as an important parameter in the diagnosis
and prognosis of different clinical parameters (11). Previous studies have revealed that
higher 70-gene CIN-signature (CIN70) score (6,12)
and ploidy status are associated with poor outcomes, advanced
clinical stages and metastasis (13–15).
Mechanically, CIN predominantly arises from chromosomal segregation
errors, replication stress, DNA damage defects and telomere
dysfunction (16). Specifically,
structural CINs (sCINs) are pre-mitotic defects arising in
interphase, presenting as partial deletions or amplifications,
translocations, rearrangements and other structural chromosomal
abnormalities, such as dicentric or ring chromosomes, whereas
numerical CINs (nCINs) predominantly result from chromosomal
segregation errors during mitosis, and lead to aneuploidy (7).
Long non-coding RNAs (lncRNAs) are a subtype of
non-protein-coding transcript that exhibit lengths of >200
nucleotides. An increasing amount of evidence has demonstrated that
lncRNAs are frequently dysregulated across human malignancies,
where they orchestrate important cancer biomarkers including
proliferation, invasion, metastasis and therapeutic resistance
(17,18). Notably, previous studies have
established a functional connection between lncRNAs and CIN scores,
thus revealing the roles of these transcripts in modulating cell
cycle progression, mitotic fidelity and epigenetic regulation
(19,20). Specific examples have highlighted
that the lncRNA MSC-antisense-transcript 1 (MAT1) is induced by CIN
in uveal melanoma, whereas the lncRNA CCAT2 induces CIN in
colorectal cancer cells and participates in oncogenesis and
chemoresistance (21,22). While these findings underscore the
interdependence between lncRNAs and CINs, the molecular mechanisms
governing CIN-related lncRNAs and their clinical potential have yet
to be fully elucidated.
The present study identified a novel CIN signature
across BC subtypes through integrated analysis of copy number
variations (CNVs) and lncRNA expression. The present study
established a CIN-based prognostic model that effectively
stratified patients with BC, where elevated CIN levels were
correlated with poor survival outcomes. Furthermore, the
CIN-associated lncRNA (CIN-lncRNA) U62317.4 promoted BC progression
by regulating cell proliferation, migration and mitotic processes.
These findings positioned CIN-lncRNAs as promising molecular tools
for BC management, offering potential diagnostic biomarkers and
therapeutic targets.
Materials and methods
Data collection
Transcriptome profiles, CNVs and clinical
information were acquired from The Cancer Genome Atlas (TCGA)
dataset (https://portal.gdc.cancer.gov) (23). The GENCODE V22 GRCh38 (24) human genome annotation file was used
to annotate mRNA and lncRNA transcripts. All gene expression data
were transformed on a log2 scale. The differentially
expressed genes between BC tissue and normal samples were
determined using the ‘limma’ package in R (version 4.2.1; Posit
Software, PBC) (25). P-values
were adjusted using the false discovery rate method, and adjusted
P<0.05 and |log fold-change (FC)|>1 were used as the cut-off
criteria. Heatmaps and volcano maps were visualized using the
‘ggplot2’ package in R (26). In
addition, gene expression profiles from two Gene Expression Omnibus
(https://www.ncbi.nlm.gov/geo/) datasets,
GSE115275 (27) and GSE159490
(28), were collected as the
external validation datasets.
Tissue sample collection
BC tissues and their adjacent normal tissues were
collected from 60 patients during excision surgery in the
Department of Breast Surgery at The Fourth affiliated Hospital of
Jiangsu University (Zhenjiang, China), between January 2022 and
December 2023. The ages of the selected female patients with BC
ranged from 41–80 years (mean age, 55.3 years). All patients had
undergone histopathological confirmation of BC and had negative
histories of exposure to either chemotherapy or radiotherapy before
surgery. Patients with a history of or concurrent other
malignancies were excluded. All pathology reports were reviewed and
confirmed by at least two senior pathologists. Cases with
unresolved pathological discrepancies were not enrolled. All tissue
samples were preserved in liquid nitrogen and stored at −80°C until
further use. Written informed consent was obtained from all
patients in the study. The protocol for the present study was
approved by the Ethics Committee of The Fourth Affiliated Hospital
of Jiangsu University (approval no. 2021018; approved in November
2021).
Estimation of the CIN risk scores of
BC samples
The chromosomal segments including genes with
significant amplification or deletion in the CNV profiles were
determined by analysis using Genomic Identification of Significant
Targets in Cancer 2.0 (29).
Significant copy number alterations were defined as those with a
q-value <0.25. Genes accompanied with significant CNV
amplification, deletion or mutation were considered the main
features of genomic variation. The biological peculiarities of the
CIN signature were identified using CIN70 score (6) and aneuploidy score (AS) (30). The CIN70 score was calculated by
summing the expression levels of identified CIN70 genes, whose
expression levels were associated with the CIN levels in different
cancer types (6). The AS analysis,
which inferred tumor purity and cell ploidy directly from analysis
of segmented copy number data, was performed using the ABSOLUTE
computational method (30). This
analysis was applied to the CNV profiles obtained from 1,077 BC
samples from TCGA. An AS value >2 was considered a ploidy
feature.
Screening lncRNAs associated with CIN
and co-expressed mRNAs
BC samples from TCGA dataset were divided into
CIN70-high/low-risk and AS-high/low-risk groups using the median
scores in the training set as the cut-off values. The lncRNAs of
each group were extracted and analyzed. These differentially
expressed lncRNAs were defined as lncRNAs associated with CIN.
Pearson's correlation analyses were performed to establish the
correlation coefficients between the expression levels of the
identified CIN-lncRNAs and mRNAs, and significantly correlated
pairs were selected based on a correlation coefficient >0.4 and
P<0.05. Functional analysis of mRNAs was performed to explore
the potential function of CIN-lncRNAs. Enrichment and pathway
analysis was performed using Gene Ontology (GO) (http://geneontology.org/), Kyoto Encyclopedia of Genes
and Genomes (KEGG) (http://www.genome.ad.jp/kegg) and the Database for
Annotation, Visualization, and Integrated Discovery (https://davidbioinformatics.nih.gov) (31), using P<0.05 as a threshold. The
results were presented by dot plot using the ‘ggplot2’ package in R
(version 4.2.1, Posit Software, PBC).
Construction and verification of the
CIN-lncRNA prognostic model in BC
Data on 1,093 BC samples from patients with
followed-up information and clinical data, including age, tumor
node metastasis (TNM) stage (32),
survival time, pathology and ER/progesterone receptor (PR)/tyrosine
kinase-type cell surface receptor HER2 (HER2) status, were
extracted from TCGA dataset (33).
These data were defined as the entire TCGA cohort and were also
randomly divided into the training cohort (n=547) and the testing
cohort (n=546). The two groups were displayed with no significance
in age distribution, lymph node status, TNM and tumor stage (I–IV).
The present study performed univariate and multivariate Cox
regression analysis on the data in the two groups to determine
prognostic-related lncRNAs. Subsequently, a prognostic risk model
was constructed based on the following formula:
The term ‘lncRNAi’ represents the candidate lncRNAs.
The risk score of each patient in the training set was calculated
and the median risk score of patients was used as a cut-off to
classify patients into high- and low-risk groups. The testing set
and all patient set were analyzed using the same model formula as
the training group. The testing set, along with TCGA set, was used
to verify the feasibility of the prognostic risk model acquired
from the data of the training set. Kaplan-Meier (KM) curves were
generated to depict the overall survival (OS) rate for patients
stratified into different prognostic risk groups. The log-rank test
was used to assess the different survival rate between the high-
and low-risk groups with a significance level of 5%. Multivariate
Cox regression analysis was conducted to assess the independence of
the CIN-related lncRNA signature (CIN-lncRNASig) from other key
clinical variables. The hazard ratio along with its 95% confidence
interval were derived using Cox regression analysis. The
performance of the CIN-lncRNASig was assessed using time-dependent
receiver operating characteristic (ROC) curve analysis.
Cell culture
Cells from the following human cell lines were
preserved in the Department of Central Laboratory at the Fourth
Affiliated Hospital of Jiangsu University: i) The normal epithelial
cell line MCF-10A; ii) luminal A MCF-7 BC cells; iii) TNBC
MDA-MB-231 cells; and iv) the HER2-positive BC cell line SKBR3
(34,35). The MCF-10A cells were sourced from
our laboratory's cell repository and were authenticated using small
tandem repeat profiling. The MCF-7 (cat. no. TCHu 74), MDA-MB-231
(cat. no. TCHu227) and SKBR3 cells (cat. no. SCSP-5243) were
purchased from the Cell Bank of Type Culture Collection of The
Chinese Academy of Sciences. The cell lines were cultured in
Dulbecco's modified Eagle's medium (HyClone™; Cytiva) or RPMI-1640
medium (HyClone™; Cytiva), supplemented with 10% fetal bovine serum
(FBS; Thermo Fisher Scientific, Inc.) and 100 U/ml
penicillin-streptomycin (Thermo Fisher Scientific, Inc.). For the
culture of MCF-7 cells, 10 µg/ml insulin (MilliporeSigma; Merck
KGaA) was additionally added. All supplements were used according
to the manufacturers' instructions. The cultures were incubated at
37°C in a humidified 5% CO2 atmosphere. All cell lines
were authenticated by short tandem repeat profiling prior to
use.
Cell transfection
The full length of the lncRNA U62317.4, also named
LOC102724608 (predicted non-coding RNA transcript XR:
430484.4), was amplified and cloned into the pcDNA3.1 vector by
GeneAdv (Jian Biotechnology Co., Ltd.), with the empty vector
acting as a negative control (NC). Antisense oligonucleotides
(ASOs) targeting U62317.4 and NC sequences were also designed and
synthesized by GeneAdv (Jian Biotechnology Co., Ltd.). Cells were
transfected with the aforementioned transfection vectors using
Lipofectamine® 2000 (Invitrogen; Thermo Fisher
Scientific, Inc.) according to the manufacturer's protocol at room
temperature. A total of 4×10⁵ target cells were seeded
into each well of a 6-well plate and co-cultured with
overexpression plasmids (1 µg) or ASOs (5 µl) in the presence of 10
µl lipofectamine and medium (total volume, 250 µl) upon reaching
85–90% confluence. Cell status was monitored at 24 and 48 h
post-transfection, and functional experiments were conducted at the
48-h time point. The ASO sequences were as follows: U62317.4,
5′-TTTGATGTGAGAGTGGCTGC-3′; and NC, 5′-GCGTATTATAGCCGATTAAC-3′.
Each experiment was performed in triplicate.
RNA extraction and quantitative PCR
(qPCR) assay
Total RNA was extracted from tissue samples and
cells using RNAiso Plus (Takara Biotechnology Co., Ltd.).
Complementary DNA for reverse transcription (RT) was synthesized
using the HifiScript cDNA Synthesis Kit (Jiangsu Kangwei Century
Biotechnology Co., Ltd.) according to the manufacturer's protocol.
Subsequently, RT-qPCR analysis was performed in a total reaction
volume of 20 µl, comprising 10 µl SYBR Green Mix (2X), 2 µl cDNA
template, 1 µl U62317.4 forward primer (10 µM), 1 µl U62317.4
reverse primer (10 µM) and 6 µl RNA-free water. The RT-qPCR cycle
settings included an initial denaturation step of 5 min at 95°C, 40
cycles of 15 sec at 95°C and 30 sec at 60°C and a final extension
step of 60 sec at 60°C; reactions were performed using a Bio-Rad
CFX96 instrument (Bio-Rad Laboratories, Inc.). qPCR analysis was
then performed according to a prior protocol (36). Results were normalized to the
expression of glyceraldehyde 3-phosphate dehydrogenase (GAPDH). All
specific primers were designed and synthesized by GeneAdv (Jian
Biotechnology Co., Ltd.). These primers were as follows: GAPDH,
forward 5′-GCACCGTCAAGGCTGAGAAC-3′, reverse
5′-TGGTGAAGACGCCAGTGGA-3′; and U62317.4, forward
5′-ATCTTGGCTCCTGGGGATCT-3′, reverse 5′-GTGGCTGCTGGAAAGTGTTG-3′. The
2−ΔΔCq method was applied to determine the differences
between multiple samples (36).
Ethynyldeoxyuridine (EdU)
analysis
MCF-7 and MDA-MB-231 cells were cultured in 24-well
plates at 2–4×10⁴ cells per well and were transfected
with U62317.4 ASOs and overexpression plasmids and cultured for 48
h. Subsequently, 200 µl EdU labeling medium was added to cells 48 h
after transfection using the Cell-Light EdU Apollo488 In
Vitro kit (Guangzhou RiboBio Co., Ltd.), and cells were
incubated for 2 h at 37°C under 5% CO2. Subsequently,
the cultured cells were treated with 4% paraformaldehyde for 30 min
at room temperature followed by incubation with 100 µl 0.5% Triton
X-100 for 10 min at room temperature. Samples were then stained
with Apollo staining solution and subsequently incubated with 100
µl Hoechst 33342 (5 µg/ml) at room temperature. A total of five
fields of view were randomly selected in each well for counting the
percentage of EdU-positive cells. Samples were observed under
fluorescent microscopy (cat. no. IX73; Olympus Corporation) and the
percentage of EdU-positive cells was measured.
Cell migration and invasion
assays
For wound healing assays, MCF-7 and MDA-MB-231 cells
transfected with U62317.4 ASOs and overexpression plasmids were
cultured in 6-well plates. Three parallel scratch wounds were made
across each well. The cells were continuously incubated in fresh
DMEM for MCF-7 cells or RPMI 1640 for MDA-MB-231 cells without FBS
(Thermo Fisher Scientific, Inc.) and cultured in a humidified
atmosphere containing 5% CO2 at 37°C. Wound closure was
observed after 0 and 48 h under a brightfield microscope.
For the invasion assays, 5×10⁴ cells per
well in serum-free DMEM or RPMI 1640 were seeded into the upper
chamber (Corning Life Sciences), which had been previously coated
with 50 µl of Matrigel (BD Biosciences) at 37°C for 1 h. The lower
chamber of the Transwell insert was filled with the respective
culture medium containing 20% FBS (Thermo Fisher Scientific, Inc.).
After the chambers were incubated at 37°C for 48 h, cells remaining
on the upper chamber were wiped with cotton swabs, while cells on
the lower membrane were fixed with 100% methanol for 15 min at room
temperature, and subsequently stained with 0.1% crystal violet for
20 min at room temperature. A total of five fields of view were
randomly selected in each well for quantifying cell invasion via
cell counting under a brightfield microscope (Olympus IX71; Olympus
Corporation).
Western blot analysis
Transfected MCF-7 and MDA-MB-231 cells were lysed
using RIPA buffer (Beyotime Biotechnology) containing protease
inhibitors (Roche Diagnostics). Protein concentration was
determined by measuring the absorbance at 280 nm using a NanoDrop
One spectrophotometer (Thermo Fisher Scientific, Inc.). A total of
50 µg of protein from each group per lane was mixed with 5X protein
loading buffer and separated on a 12% SDS-polyacrylamide gel,
before being transferred to 0.45 µm PVDF membranes (MilliporeSigma;
Merck KGaA). Samples on the membranes were blocked with 5% non-fat
dry milk for 1 h at room temperature, and then incubated with
primary antibodies, including GAPDH (1:1,000; cat. no. sc-47724;
Santa Cruz Biotechnology, Inc.), mitotic checkpoint
serine/threonine-protein kinase BUB1β (BUB1B; 1:1,000; cat. no.
11504-2-AP; Proteintech Group, Inc.), cell division cycle protein
20 (CDC20; 1:2,000; cat. no. 10252-1-AP; Proteintech Group, Inc.)
and p53 (1:5,000; cat. no. 10442-1-AP; Proteintech Group, Inc.), at
4°C overnight. The membranes were washed with agitation in 0.1%
Tween 20 in TBS and incubated with horseradish peroxidase
(HRP)-conjugated goat anti-rabbit IgG antibody (1:10,000; cat. no.
D110058; Sangon Biotech Co., Ltd.) and HRP-conjugated goat
anti-mouse IgG antibodies (1:5,000; cat. no. D110087; BBI Life
Sciences Corporation; Sangon Biotech Co, Ltd.) for 2 h at room
temperature. Finally, membranes were incubated with enhanced
chemiluminescence reagent (BeyoECL plus; Beyotime Biotechnology).
The signals were visualized using the ChemiDOC imaging system
(Bio-Rad Laboratories, Inc.). Densitometric analysis was performed
using ImageJ software (v.1.54; National Institutes of Health). Data
were normalized against GAPDH protein levels. FCs in the intensity
of protein signals were reported as the mean of results from three
experimental repeats.
Statistical analysis
All data were presented as mean ± SD and were
analyzed using GraphPad Prism (version 8.0; Dotmatics). All the
analyses and plots from TCGA datasets were performed and generated
using R version 4.2.1 (Posit Software, PBC) (37). ROC analysis was performed using the
‘timeROC’ package in R. Survival analyses were performed using the
KM method. The standard log-rank test was used for comparisons
under the assumption of proportional hazards, resulting in log-rank
P-values. The Renyi test, which provided Renyi P-values, was
further employed for the survival plots where late-stage crossover
was observed. The normality of the data distribution was assessed
using the Shapiro-Wilk test. For data in Fig. S2C and D that followed a normal
distribution, comparisons between two groups were performed using
two-tailed paired or unpaired Student's t-test where appropriate.
For comparisons between two groups not following a normal
distribution such as Fig. 4D, the
Mann-Whitney U test or Wilcoxon matched-pairs signed rank tests
were performed for unpaired and paired data respectively.
Correlations were analyzed using Pearson's correlation coefficient
for normal distributed data (Tables
SIV and SV), while Spearman's
correlation was applied to non-normally distributed data (Fig. S2E). Group comparisons were
performed using either one-way ANOVA followed by Tukey's post-hoc
comparisons or the Kruskal-Wallis test with Dunn's
multiple-comparison post-hoc test, based on normality and the
results of the variance homogeneity test. All the experiments were
performed in triplicate. P<0.05 was considered statistically
significant.
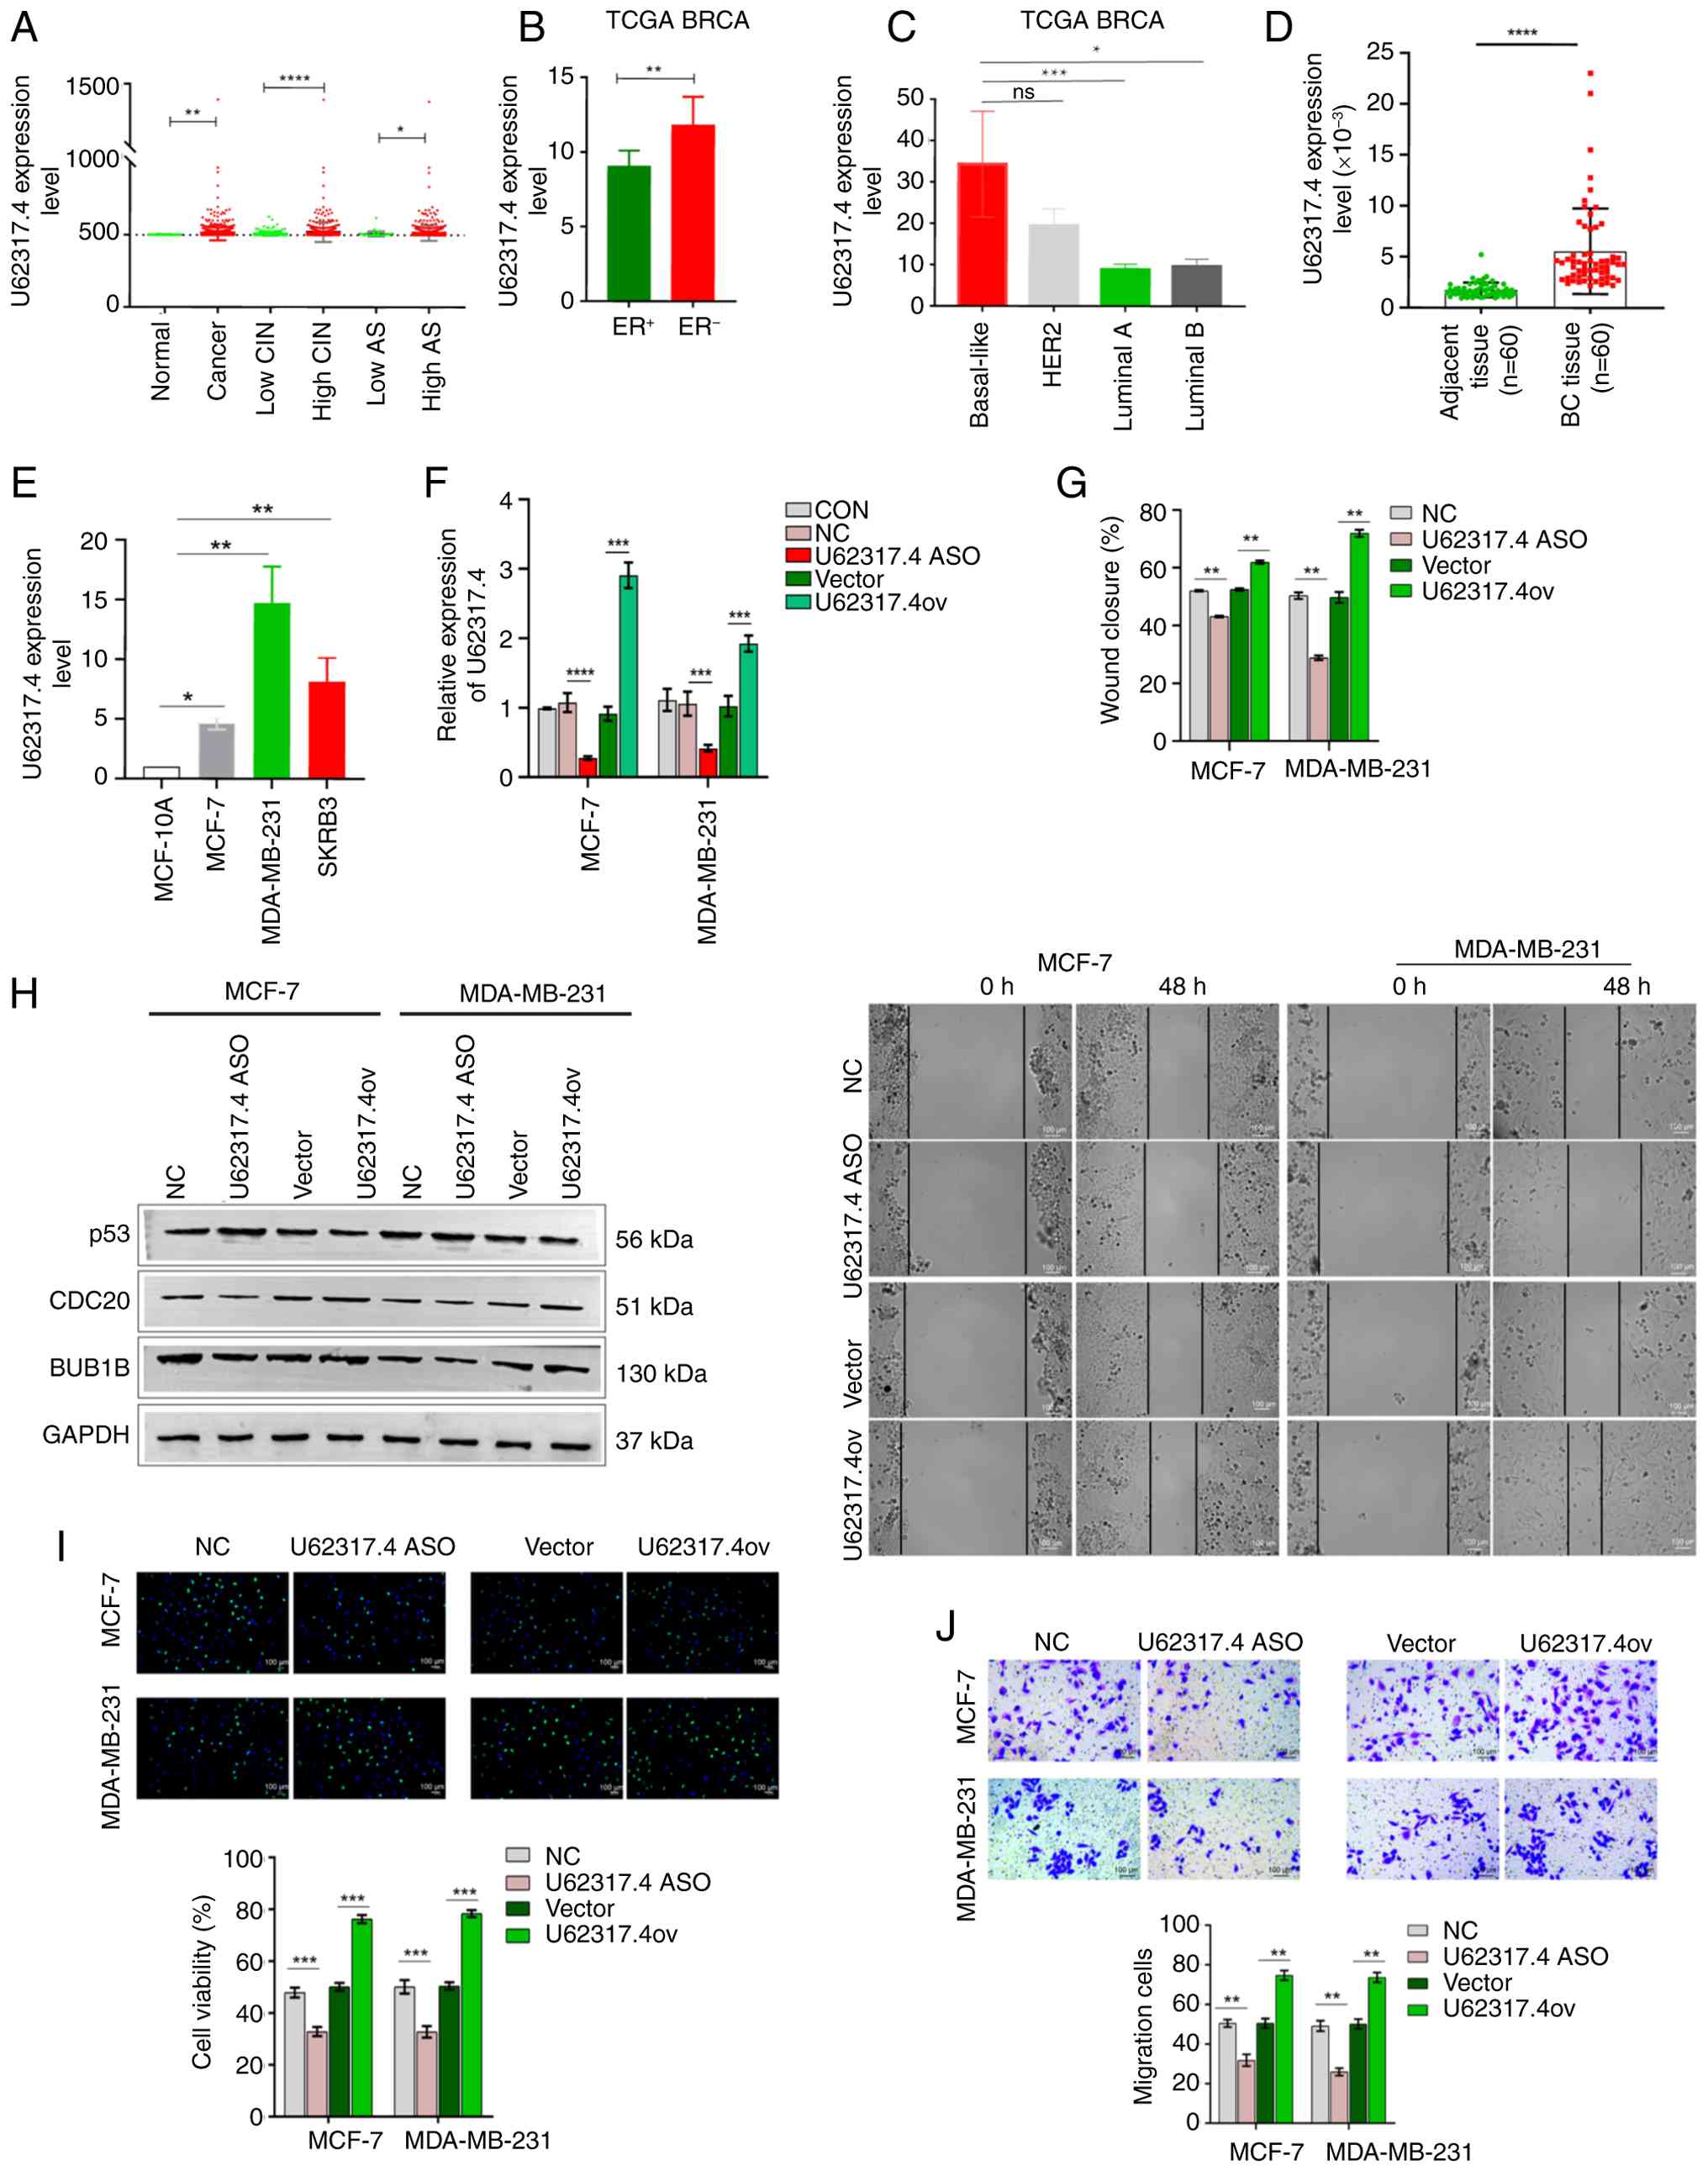 | Figure 4.Upregulation of U62317.4 induces
malignant phenotypes in BC. (A) Validation of the expression level
of U62317.4 in BC tissues, normal tissues, high- and low-CIN
groups, and high- and low-AS groups from TCGA dataset. (B) The
expression of U62317.4 in patients with ER+ and
ER− BC in TCGA dataset. (C) Comparison of U62317.4
expression among BC subtypes from TCGA dataset, including
basal-like, HER2-enriched, luminal A and B subtypes, which was
conducted using the Kruskal-Wallis test followed by Dunn's post hoc
test. (D) Validation of U62317.4 expression levels in BC tissues
and paired adjacent normal tissues (n=60). The comparison was
conducted using the Wilcoxon signed-rank test. (E) The expression
level of U62317.4 in MCF-10A, MCF-7, MDA-MB-231 and SKBR3 cell
lines. (F) The efficiency of U62317.4 overexpression and
ASO-mediated knockdown was determined by reverse
transcription-quantitative PCR analysis. MCF-7 and MDA-MB-231 cells
were transfected with U62317.4 pcDNA3.1 overexpression plasmids and
ASOs. (G) Representative images and quantification of wound healing
assays showing the migration of MCF-7 and MDA-MB-231 cells
transfected with U62317.4 ASOs and overexpression plasmids. The
area between cell fronts on either side of the wound was measured
and calculated as a percentage of the scratch area at 0 h. Scale
bar, 100 µm. (H) Western blot assay demonstrated the protein levels
of p53, BUB1B and CDC20 in MCF-7 and MDA-MB-231 cells transfected
with U62317.4 ASOs and overexpression plasmids, as well as their
relevant controls. (I) Ethynyldeoxyuridine staining analysis was
performed to measure the viability of MCF-7 and MDA-MB-231
transfected with U62317.4 ASOs and overexpression plasmids, as well
as their relevant controls. Scale bar, 100 µm. (J) Matrigel assays
were used to determine the invasive abilities of MCF-7 and
MDA-MB-231 cells transfected with U62317.4 ASOs and overexpression
plasmids, as well as their relevant controls. Comparisons between
the results of assays performed in MCF-7 and MDA-MB-231 cells were
analyzed by one-way ANOVA, followed by Tukey's post hoc test. Data
were represented as the mean ± SD from three independent
experiments. Scale bar, 100 µm. *P<0.05, **P<0.01,
***P<0.001 and ****P<0.0001. BC, breast cancer; ASO,
antisense oligonucleotide; CON, control without transfection
treatment; NC, antisense oligonucleotide negative control; TCGA,
The Cancer Genome Atlas; ER+, estrogen
receptor-positive; ER−, estrogen receptor-negative;
BRCA, breast cancer type 1 susceptibility protein; ns, not
significant; U62317.4ov, U62317.4 overexpression plasmids; Vector,
overexpression control; CIN, chromosomal instability; AS,
aneuploidy score; HER2, tyrosine kinase-type cell surface receptor
HER2; BUB1B, mitotic checkpoint serine/threonine-protein kinase
BUB1β; CDC20, cell division cycle protein 20. |
Results
Characteristics of chromosomal copy
number variation in BC
Genomic CNVs, comprising both amplifications and
deletions, across different BC types, including luminal A, luminal
B, basal-like and HER2 positive types, were analyzed based on TCGA
datasets. As shown in Fig. 1A, BC
tissues showed different levels of CIN based on the distributions
of CNVs. Chromosomal deletions were more frequent compared with
that of chromosomal amplifications (Table SI). The specific patterns of gene
amplification or deletion varied, in which basal-like subtypes
displayed the most frequent CNVs, while of the other subtypes,
HER2-type BC exhibited the lowest number of CNVs (Fig. 1A). A total of 55 genes were
identified to have been significantly amplified in the genomic data
and showed diverse segmental changes among different subtypes,
while 96 genes were significantly deleted. Among these regions, the
1q21.3 duplication (dup), 9p21.3 deletion (del), 19p13.3del and
13q12.11del regions were the most frequent loci of CNV in these
four subtypes; the genes lying within these regions included cyclin
dependent kinase inhibitor 2A (CDKN2A), fibroblast growth factor 9
and human-microRNA-4257/1909/4321 (Table SI).
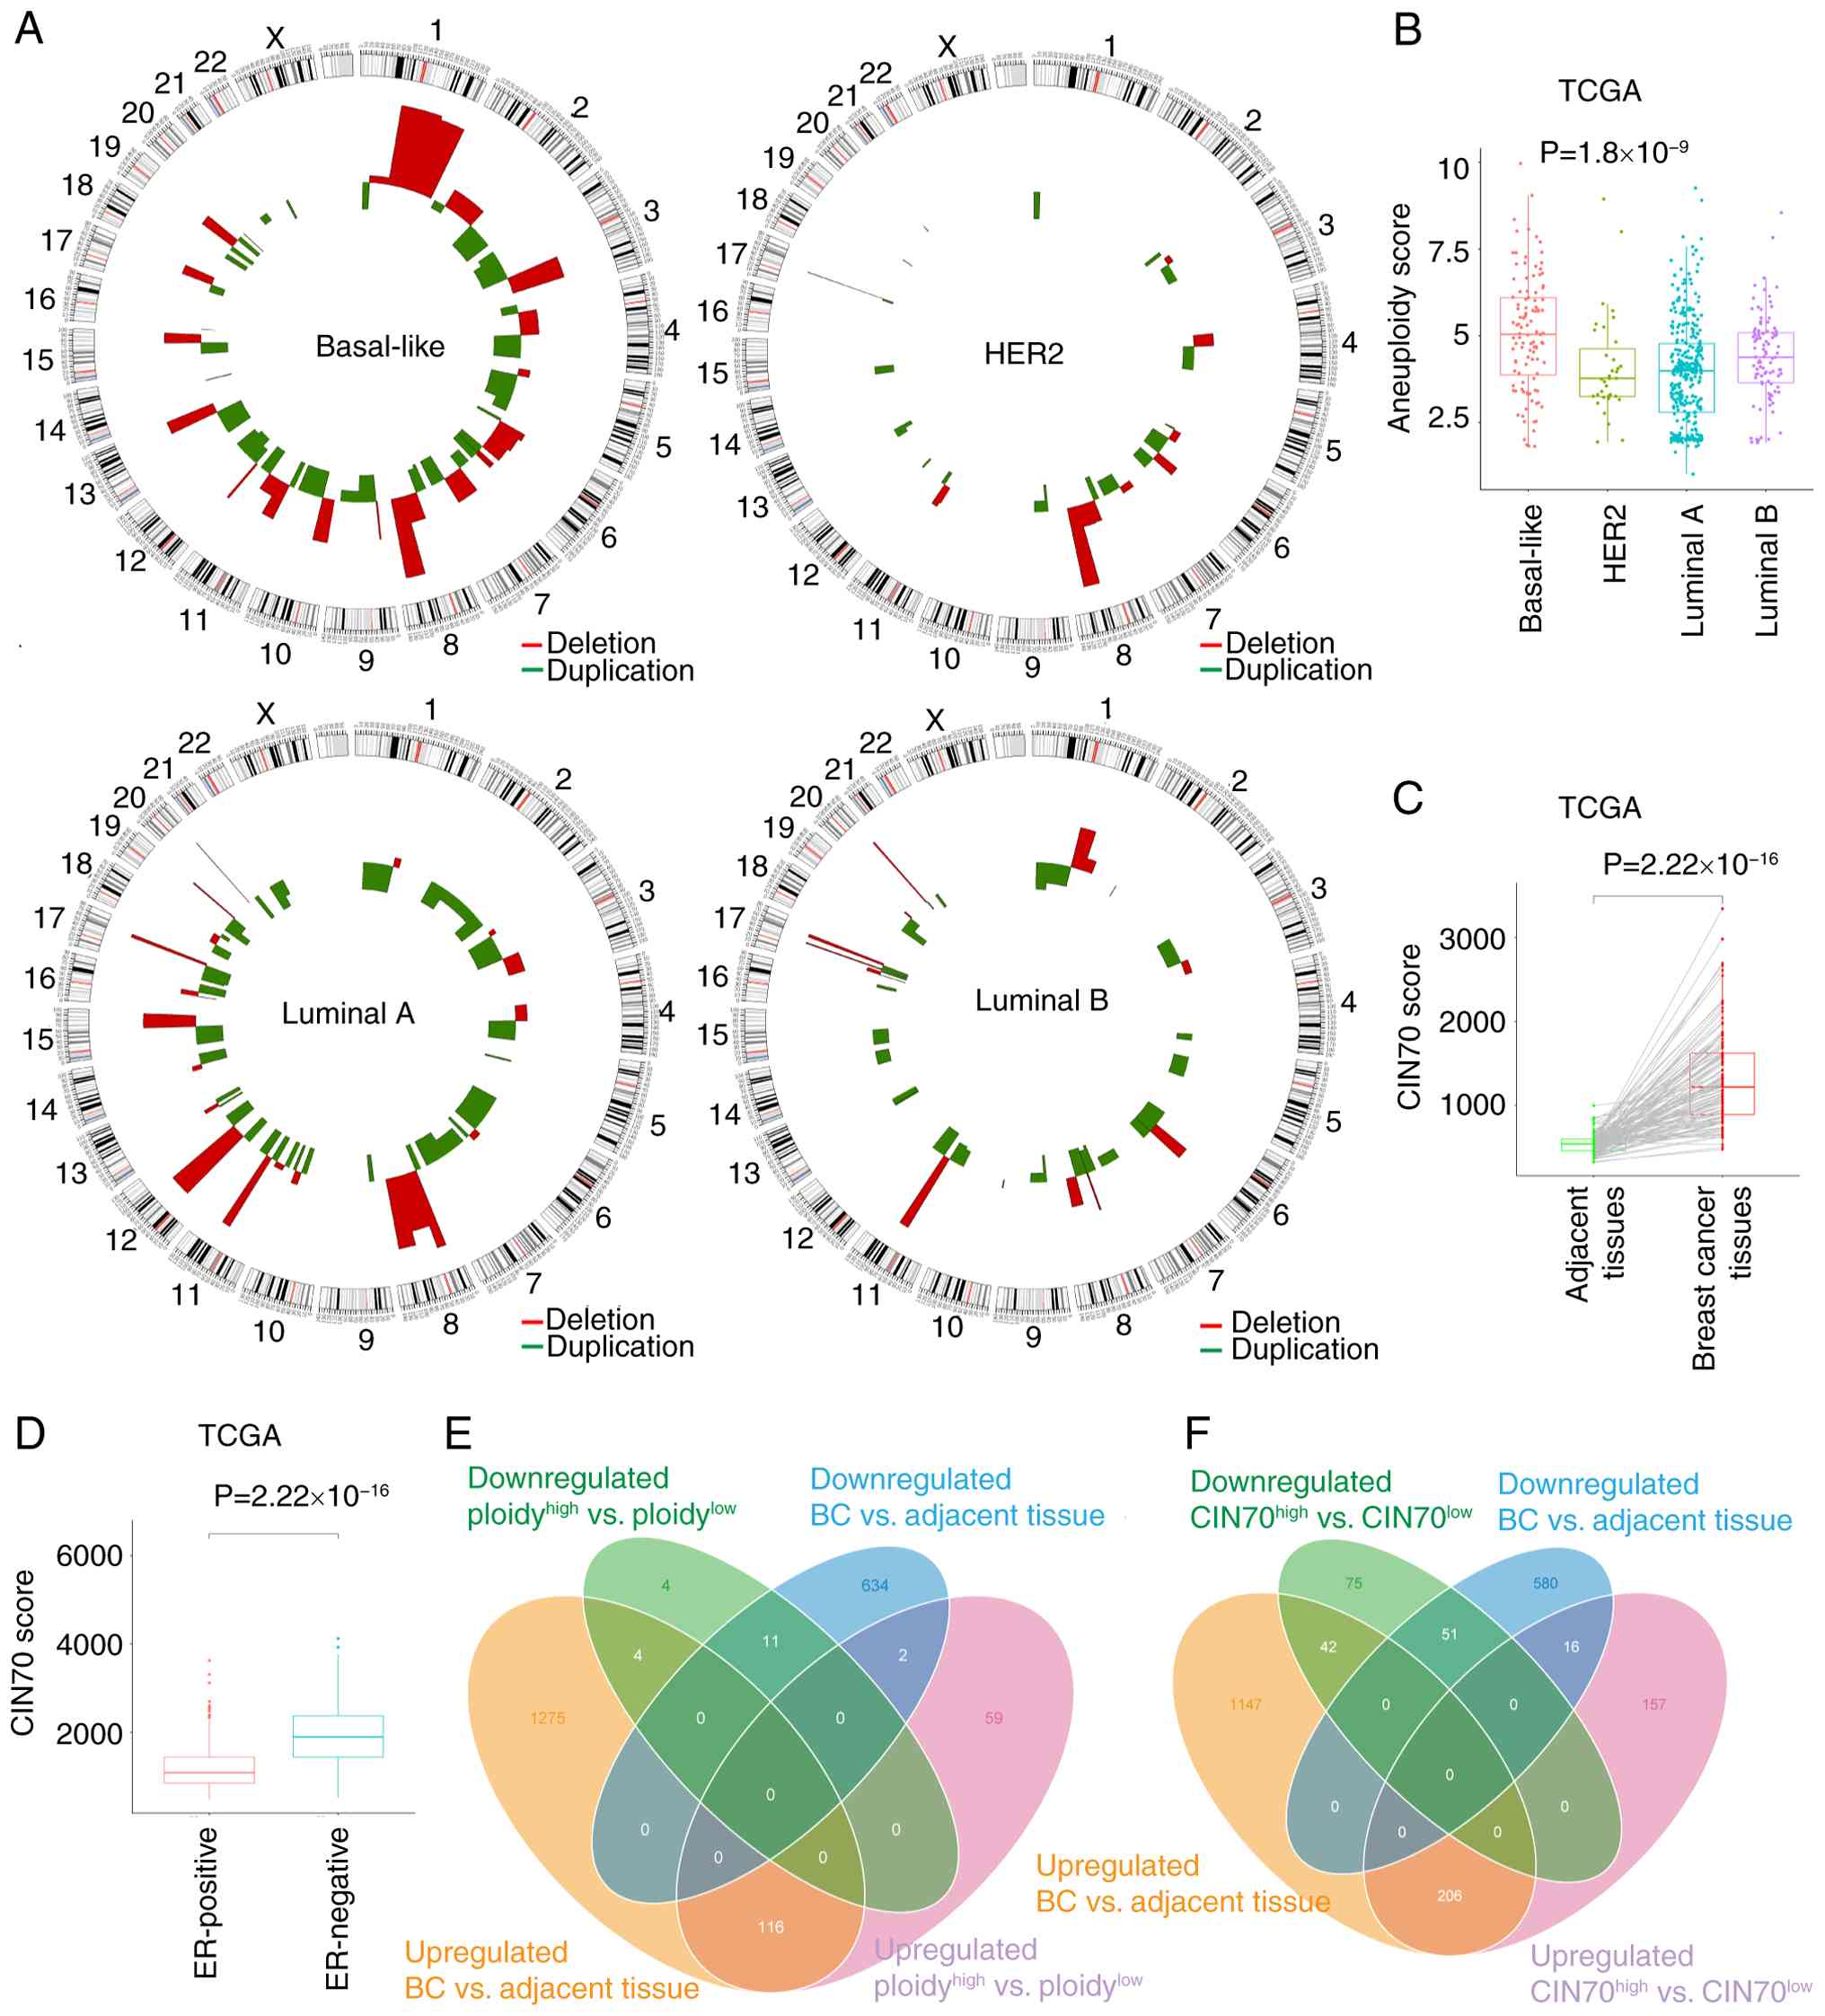 | Figure 1.Characteristics of CNVs and
differentially expressed genes in BC from TCGA dataset. (A) The
specific patterns of CNVs based on the different BC subtypes. (B)
The distribution of aneuploidy score among each subtype: The
basal-like-type showed the highest average aneuploidy score, while
HER2-type cells displayed the lowest scores on average. The
comparison of ploidy score among BC subtypes were conducted using
the Kruskal-Wallis test, followed by Dunn's post hoc test. (C)
CIN70 score was visualized in plots comparing data from BC samples
with adjacent normal tissues from TCGA dataset. (D) CIN70 score in
ER-negative tissues was compared with ER-positive tissues. (E) Venn
diagram showing that there were 196 dysregulated lncRNAs associated
with high and low ploidy levels and expression differences, among
which 19 were downregulated and 177 were upregulated. (F) The Venn
diagram showed that there were 547 dysregulated lncRNAs associated
with high and low CIN70 levels and expression differences, among
which 168 were downregulated and 379 were upregulated. CNVs, copy
number variations; HER2, tyrosine kinase-type cell surface receptor
HER2; BC, breast cancer; CIN70, 70-gene chromosomal
instability-signature; TCGA, The Cancer Genome Atlas; ER, estrogen
receptor; lncRNA, long non-coding RNA. |
Characteristics of CIN in BC
subtypes
For each BC subtype, the distribution of AS varied.
The basal-like subtype demonstrated the highest CIN levels on
average (Fig. 1A), while the HER2
subtype displayed the lowest median value (Fig. 1B). The AS distribution was
consistent with CIN levels derived from previously obtained CNV
data for each subtype (Fig. 1A).
Otherwise, the CIN70 scores demonstrated significantly higher CIN
levels in BC than in normal breast tissues (Fig. 1C). ER-negative (ER−)
samples showed significantly higher CIN levels compared with
ER-positive (ER+) samples (Fig. 1D). Regarding clinical parameters,
the present study demonstrated that high CIN70 scores were notably
associated with lymph node metastasis, and significantly associated
with advanced clinical and TNM stages (Fig. S1C, D and F). However, CIN70 scores
did not differ significantly when patients were stratified by
metastasis stage (M0 vs. M1), or by lymph node stage (N0/N1 vs.
N2/N3), where M0 and M1 indicate the absence or presence of distant
metastasis, and N0-N3 denote limited vs. advanced regional lymph
node involvement (Fig. S1B and
E). Further comparisons in Fig
S1C revealed that the N3 subgroup exhibited significantly
different CIN70 scores when compared individually with each of the
N0, N1 and N2 subgroups. ROC curves showed that the CIN70 scores
demonstrated limited performance in distinguishing BC from normal
tissues (AUC, 0.614; Fig. S1G).
However, the OS of patients with BC with high CIN70 scores showed
no significant difference compared with the low CIN70 group
(Fig. S1H; log-rank P=0.11; Renyi
P=0.078).
Screening of CIN-related lncRNAs in
patients with BC
Based on gene expression profiles, the present study
obtained 3,186 upregulated genes, which contained 1,395 lncRNAs,
and 2,404 downregulated genes containing 647 lncRNAs, which were
significantly dysregulated between BC and adjacent tissues
(Fig. S1A). To identify the
lncRNAs associated with CIN, the present study calculated the AS
and CIN70 score in each patient and arranged patients in descending
order by score. Based on CIN70 analysis, 379 lncRNAs were
upregulated and 168 lncRNAs were downregulated (Fig. 1F and Table SII); the results of AS analysis
included 177 upregulated and 19 downregulated lncRNAs (Fig. 1E and Table SIII).
Construction of a CIN-lncRNASig model
for BC
To further determine the predictive power of
candidate lncRNAs, the present study compared the association
between identified dysregulated lncRNAs and the OS rates of
patients, resulting in the construction of models containing seven
CIN70-lncRNA and six AS-lncRNA that associated with prognosis via
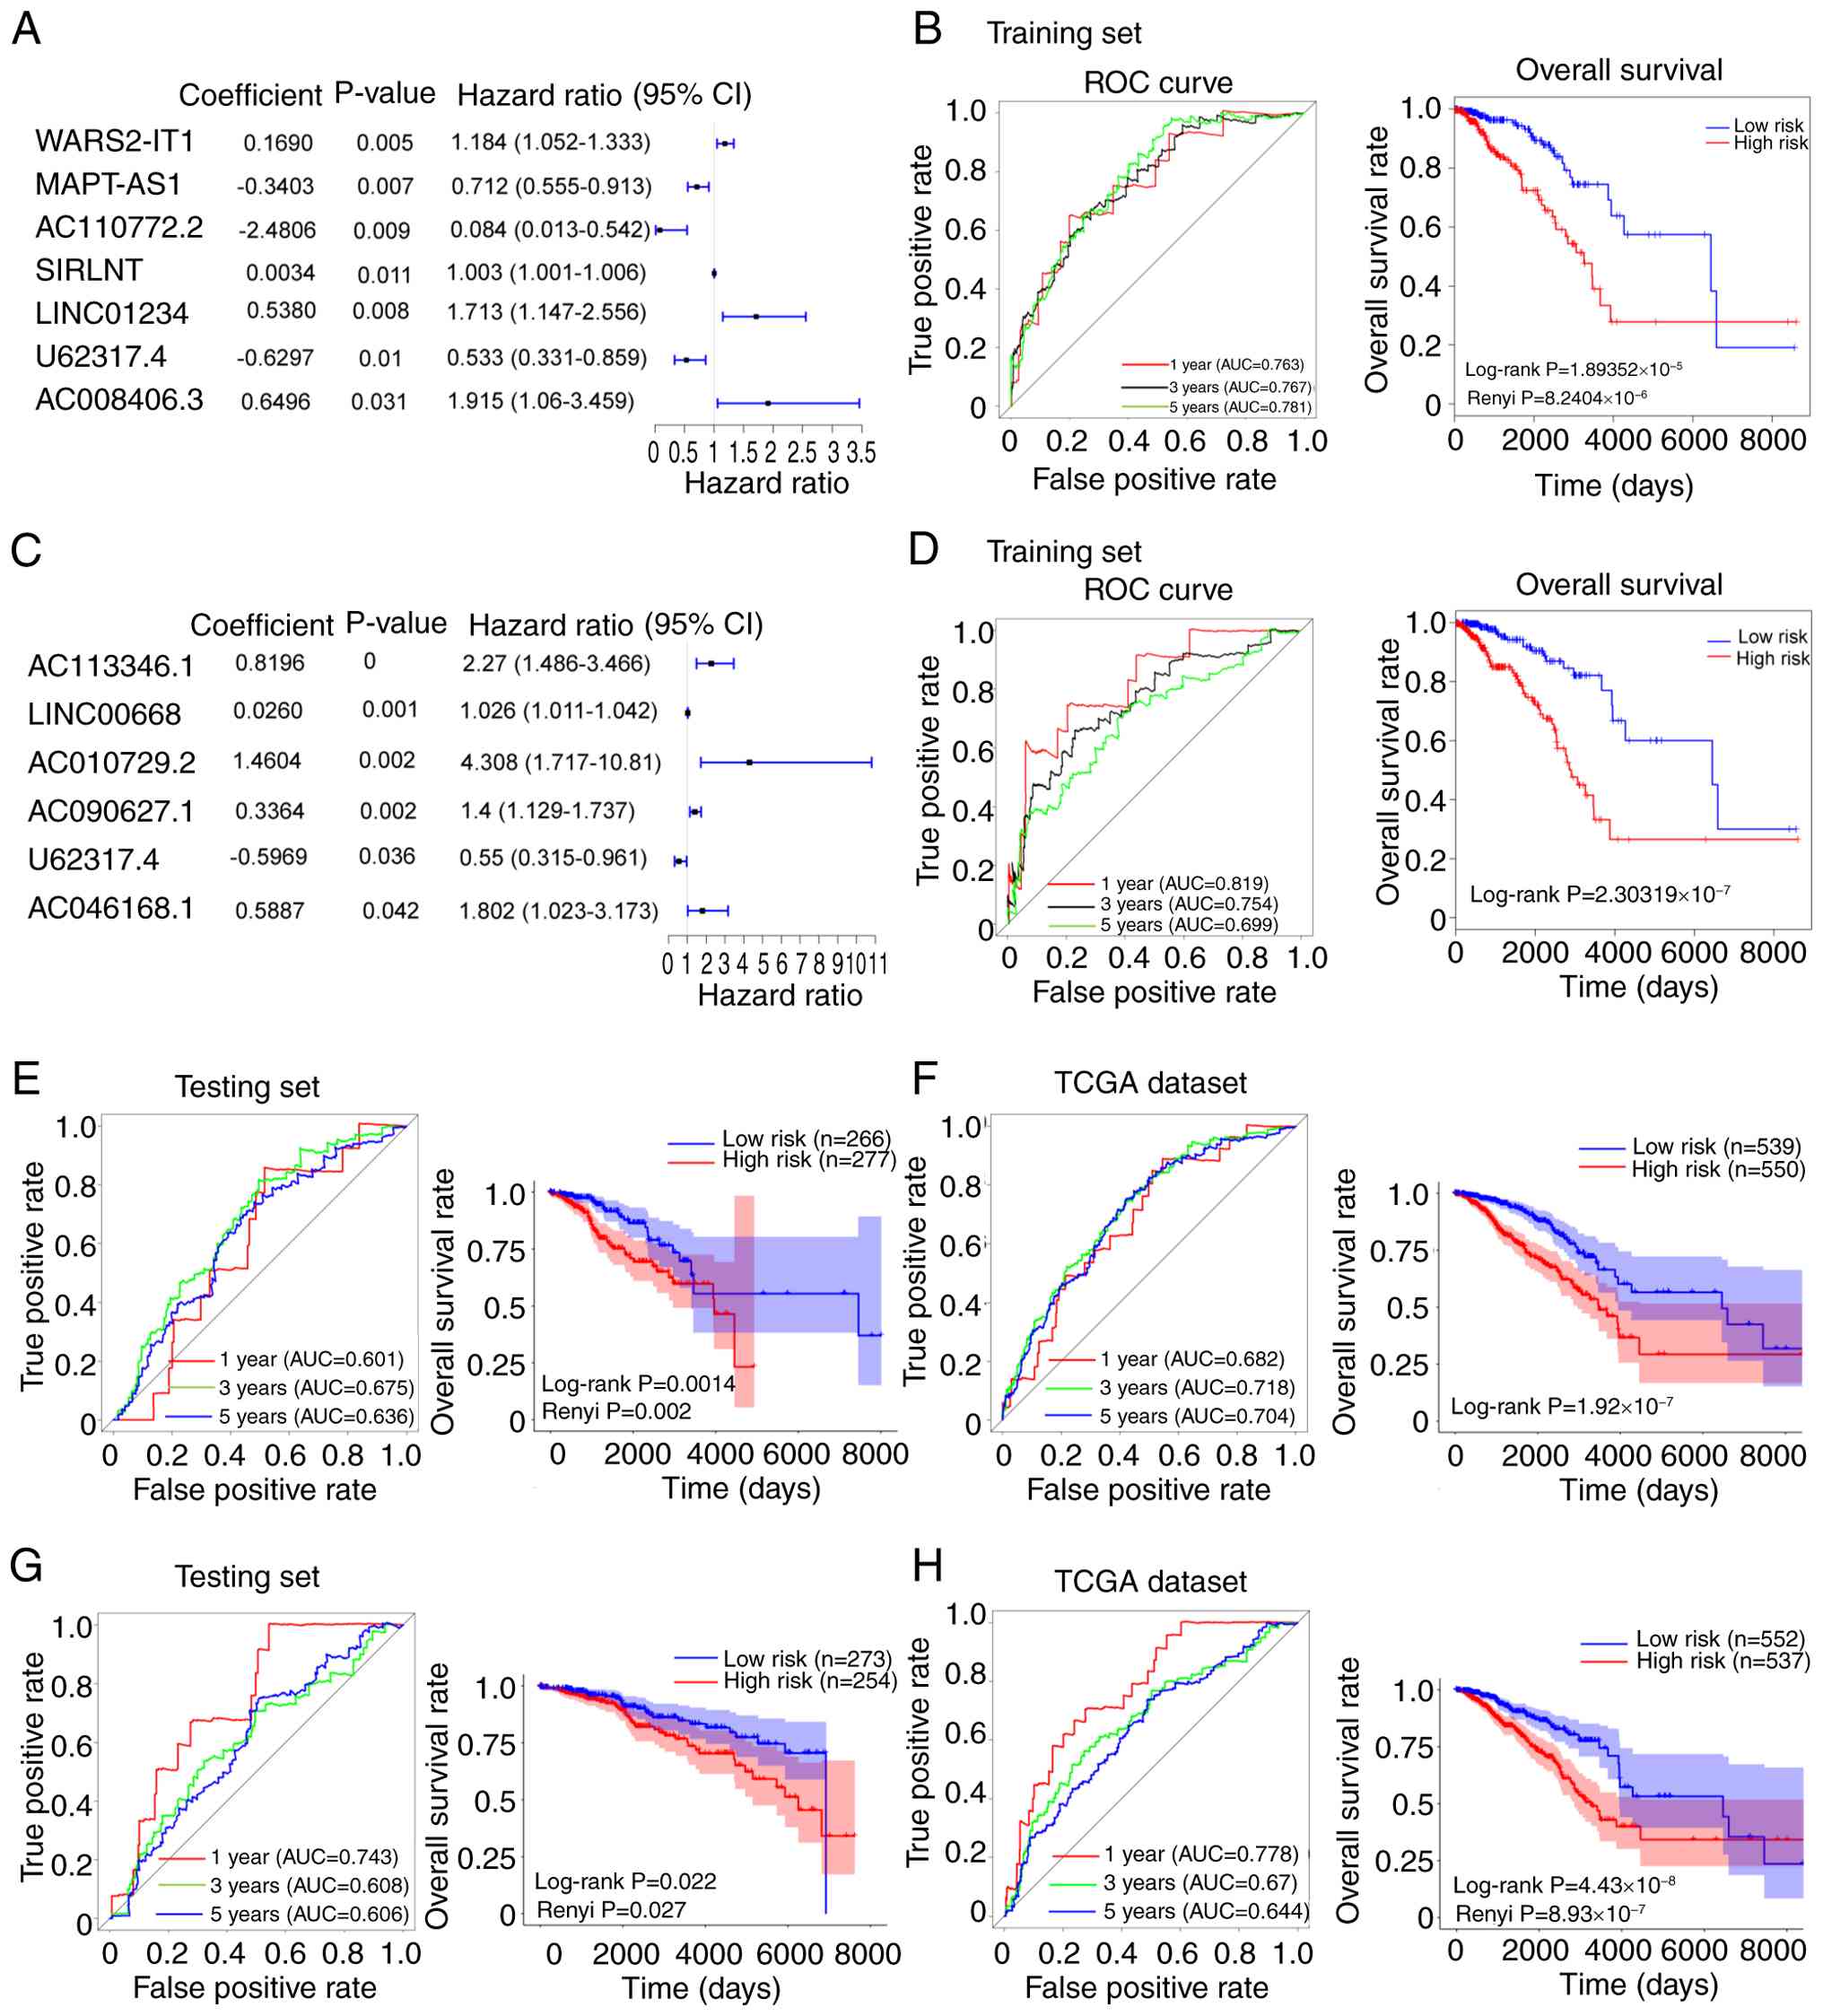
univariate and multivariate Cox regression analyses (Fig. 2A and C). CIN70 analysis revealed
significant positive coefficients for WARS2-IT1, SIRLNT, LINC01234
and AC008406.3, revealing that these were high-risk lncRNAs that
advanced BC progression, whereas the coefficients for MAPT-AS1,
AC110772.2 and U62317.4 were negative, which demonstrated that
these lncRNAs associated with the low-risk group and exhibited a
protective effect on clinical prognosis in BC (Figs. 2A and S2A). AS analysis demonstrated that
AC113346.1, LINC00668, AC010729.2, AC090627.1 and AC046168.1 had
significant positive coefficients, indicating high-risk, while the
coefficient for U62317.4 was negative, indicating that this lncRNA
was low-risk for BC (Figs. 2C and
S2B). The lncRNA U62317.4 was
selected for further analysis as it was identified as low-risk
factor by both AS and CIN70 analysis. In addition, further
multivariate Cox regression analyses in
ER+/ER− subgroups identified five prognostic
lncRNAs including U62317.4. The risk score had good performance in
predicting 1-year OS (AUC=0.815) and showed a significant survival
disparity between the high- and low-risk groups (Renyi P<0.0001;
Fig. S1I). Subsequently, the
present study used the CIN-lncRNASig to determine the risk score of
each patient in the training cohort. Using the median risk score as
the cut-off value, patients were divided into high- and low-risk
groups. ROC analysis demonstrated that the AUC values for 1-, 3-
and 5-year diagnostic performance on BC were 0.763, 0.767 and 0.781
for the CIN70 analysis (Fig. 2B),
as well as 0.819, 0.754 and 0.699 in the AS group (Fig. 2D). KM analysis showed that the OS
of patients in the low-risk group was significantly higher compared
with that of the high-risk group for both CIN70 score (Renyi
P<0.001; Fig. 2B) and AS
(log-rank P<0.001; Fig. 2D). To
further clarify whether the expression levels of these candidate
lncRNAs were associated with CIN70 and AS scores, the expression
levels of the related lncRNAs were assessed. lncRNAs such as
WARS2-IT1 and AC110772.2 were shown to be downregulated in
high-CIN70 BC tissues, whereas U62317.4, SIRLNT, LINC01234,
AC008406.3, AC113346.1, LINC00668, AC010729.2 and AC046168.1 were
upregulated in the high-CIN70 or AS groups (Tables SII and SIII), suggesting that these lncRNAs may
be associated with high CIN scores.
Validation of the CIN-lncRNASig model
in the testing and TCGA cohorts
To determine the accuracy of the CIN-lncRNASig
predictive model, its prognostic performance was validated in the
testing and TCGA cohorts used. For the CIN70-related lncRNA
prognostic model, ROC analysis showed that the AUC values for 1-,
3- and 5-year survival were 0.601, 0.675 and 0.636, respectively in
the testing cohort, whereas these values were observed to be 0.682,
0.718 and 0.704, respectively in the entire TCGA cohort (Fig. 2E and F). Survival analysis showed
that the low-risk group displayed significantly higher OS rates
compared with the high-risk group in both the testing cohort (Renyi
P=0.002; Fig. 2E) and entire TCGA
cohort(log-rank P<0.001; Fig.
2F). For the AS-related lncRNA prognostic model, KM analysis
also revealed that OS rates in the high-risk group were
significantly lower than in the low-risk group within both the
testing cohort (Renyi P<0.001; Fig.
2G) and the entire TCGA cohort (Renyi P<0.001; Fig. 2H). ROC analysis demonstrated that
the AUC values for 1-, 3- and 5-year survival were 0.743, 0.608 and
0.606, respectively in the testing cohort (Fig. 2G) and 0.778, 0.670 and 0.644,
respectively in the entire TCGA cohort used (Fig. 2H).
Efficiency of CIN-lncRNASig in
predicting clinical characteristics
To evaluate the potential independence of
CIN-lncRNASig as a prognostic factor, the present study performed a
multivariate Cox regression analysis on clinical parameters of BC,
including ER status, age, pathological stage and the CIN-lncRNASig
predictive model. Patients with BC were divided into ER+
(n=467) and ER− groups (n=152), ages ≤65 (n=974) and
>65 (n=116), and groups containing clinical stages I–II (n=800)
and III–IV (n=267). Patients within each group were stratified by
the median risk score (low risk < median ≥ high risk) into high-
and low-risk groups. There was a significant difference in OS rate
observed between the two risk groups in patients with
ER+ BC (Renyi P<0.05); however, this difference was
not significant between the ER− groups (log-rank
P>0.05). The OS rates of high-risk groups for other factors,
including age, clinical stage and tumor stage, were significantly
lower than that of the low-risk groups (log-rank P<0.05 or Renyi
P<0.05; Fig. 3A). Furthermore,
in the AS-related lncRNA-signature model, the differences in OS
between the high- and low-risk groups for these factors were
markedly consistent with those observed in the CIN-lncRNASig model
(log-rank P<0.05 or Renyi P<0.05; Fig. S1J). However, the difference
between the ER− groups in this model was significant
(log-rank P<0.05), while no significant difference was observed
between risk groups for patients aged >65 years (Renyi
P>0.05; Fig. S1J). Therefore,
these results indicated the efficiency of CIN-lncRNASig in
predicting clinical characteristics within BC cohorts.
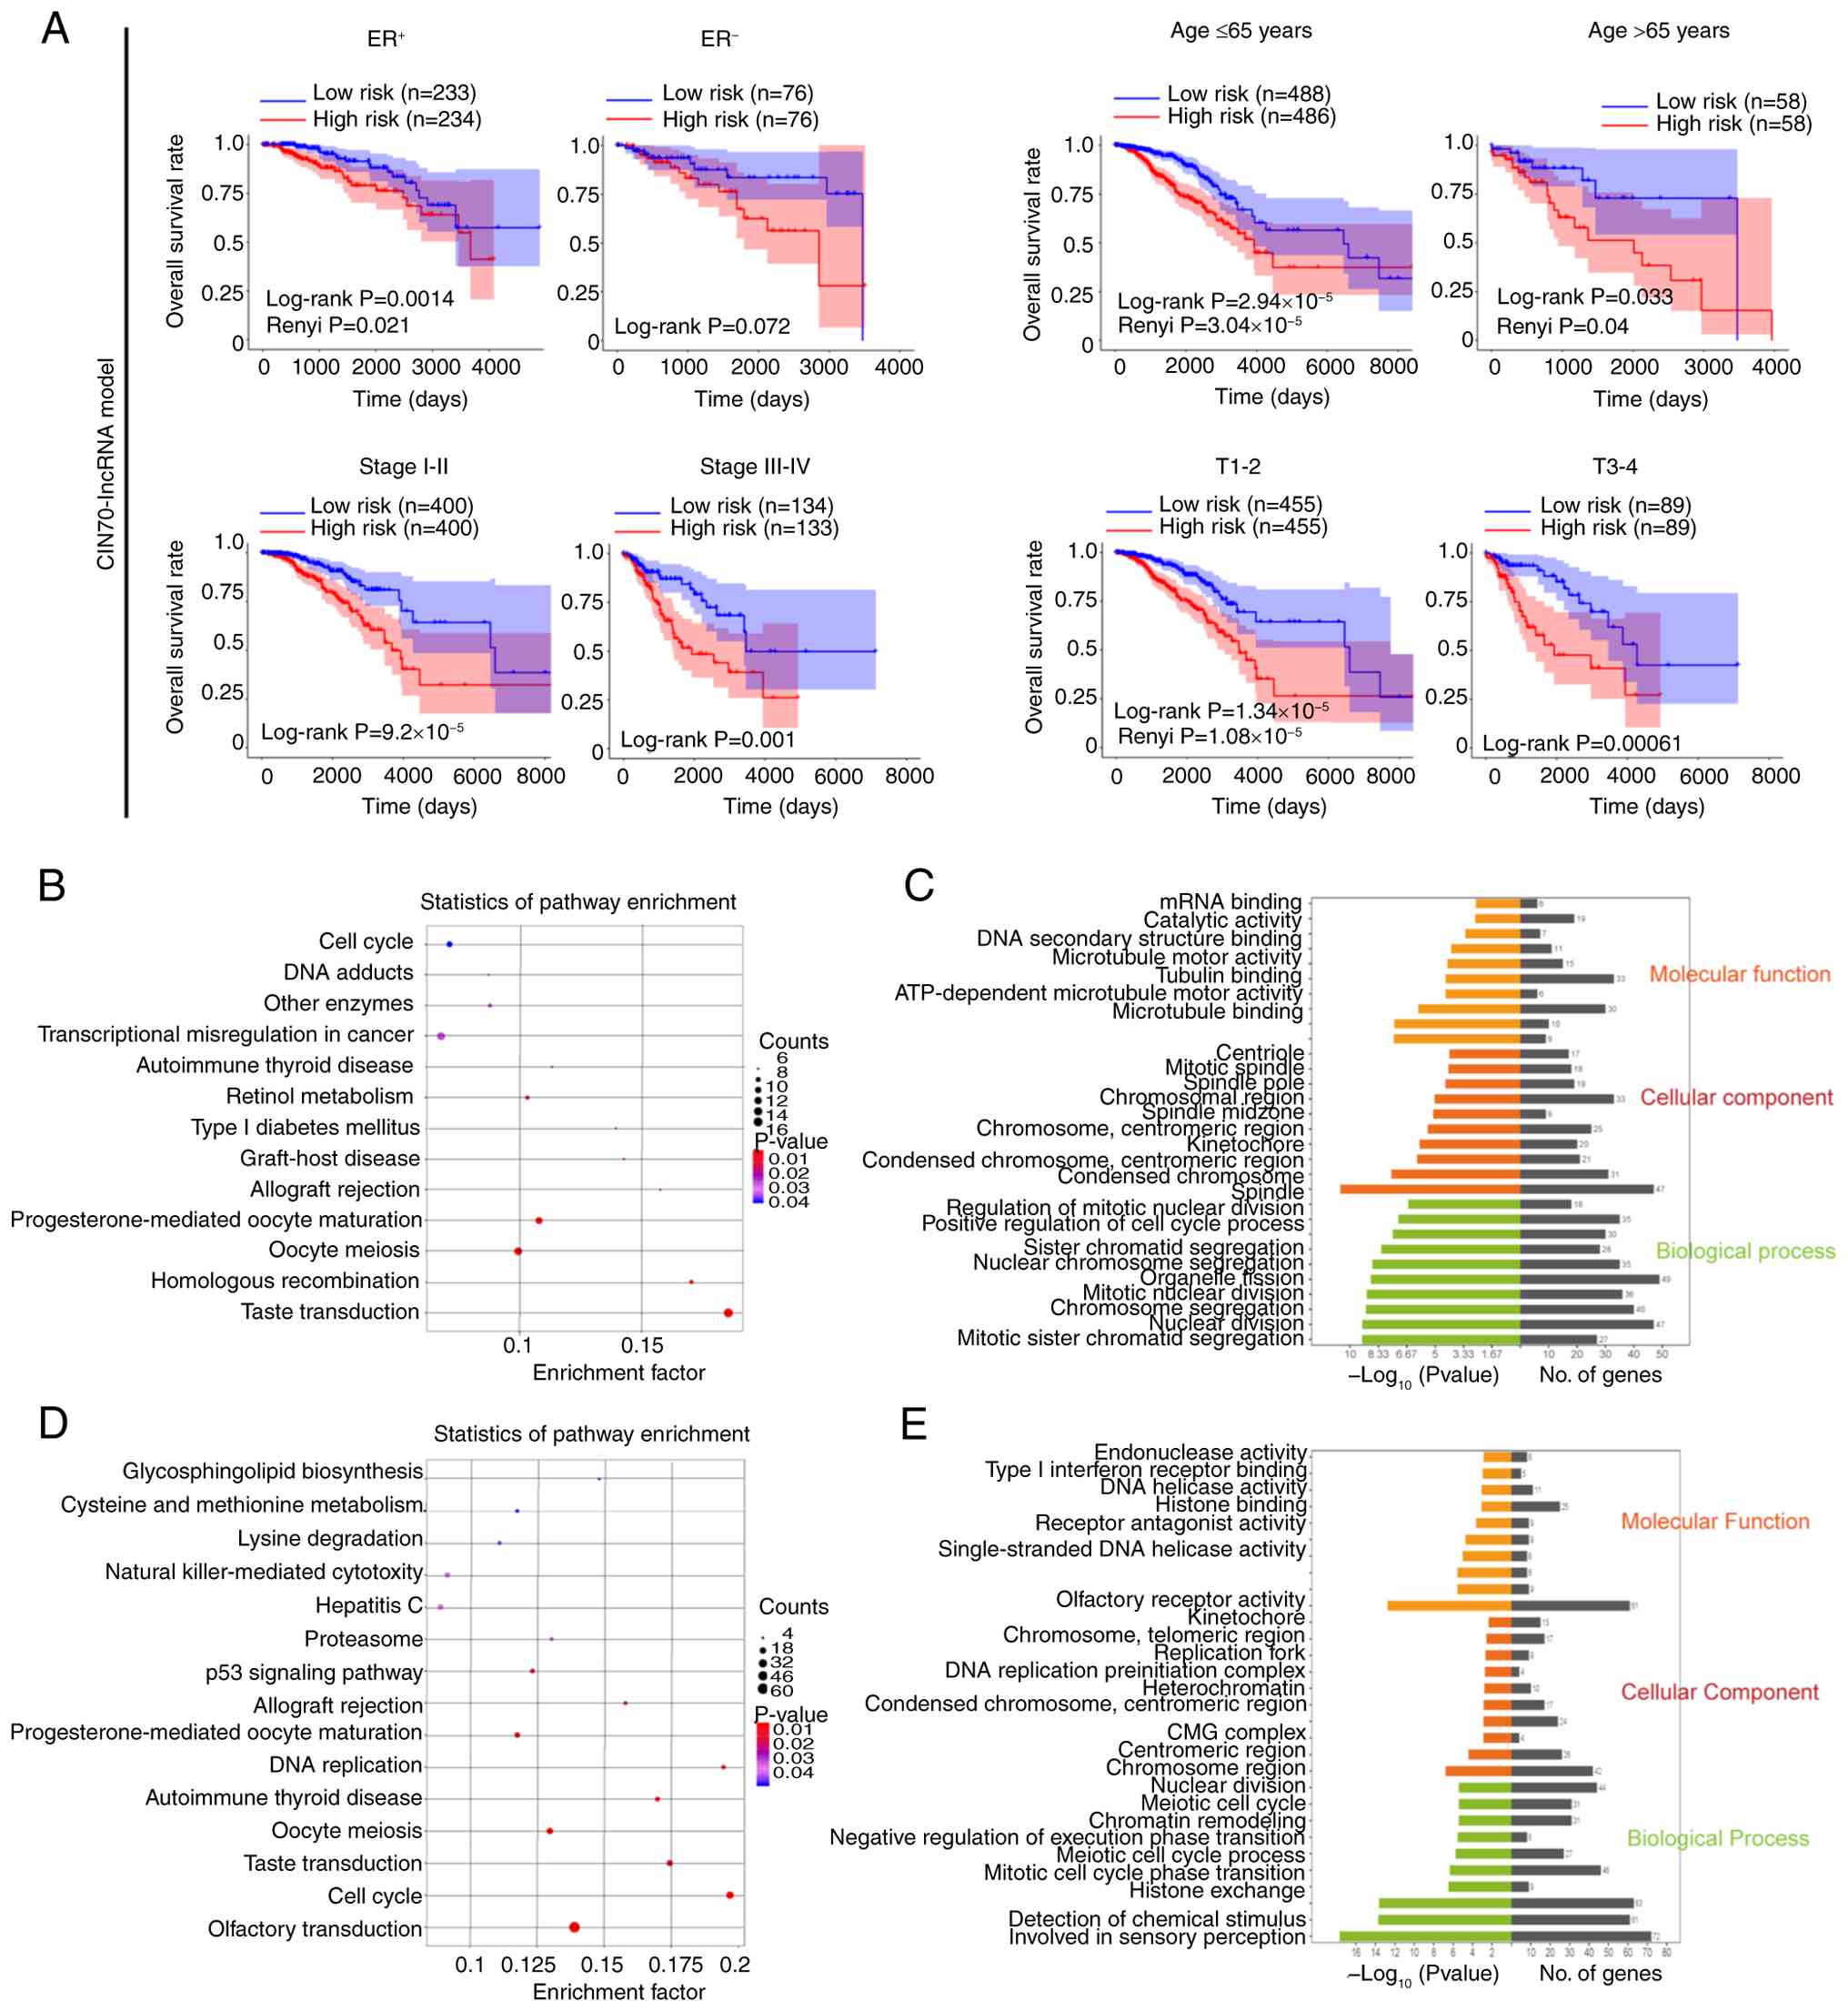 | Figure 3.Performance and efficiency of the
CIN-lncRNA signature in predicting clinical characteristics. (A)
For the CIN70 lncRNA model, the results of Kaplan-Meier analysis on
overall survival rate between low- and high-risk groups in: i)
Patients with ER+ and ER− breast cancer; ii)
patients aged≤65 years and aged >65 years; iii) patients with
clinical stage I–II and stage III–IV breast cancer; and iv)
patients with stage T1-2 and T3-4 breast cancer. (B) KEGG pathway
enrichment analysis for the seven CIN-lncRNAs and their associated
protein coding genes was carried out using the Database for
Annotation, Visualization, and Integrated Discovery to reveal the
potential pathways in which the candidate lncRNAs were involved.
(C) GO function analysis showed the top enriched terms for
‘biological process’, ‘cellular component’ and ‘molecular function’
in the CIN-lncRNA-associated protein coding genes. (D) KEGG pathway
enrichment analysis of the six AS-lncRNAs and their associated
protein coding genes. (E) GO function analysis showing the top
enriched terms for AS-lncRNA-associated protein coding genes. GO,
Gene Ontology; KEGG, Kyoto Encyclopedia of Genes and Genomes;
ER+, estrogen receptor-positive; ER−,
estrogen receptor-negative; T, tumor stage; AS, aneuploidy score;
lncRNA, long non-coding RNA; AS-lncRNA, aneuploidy-associated
lncRNAs; CIN-lncRNA, chromosomal instability-associated lncRNAs;
CIN70, 70-gene chromosomal instability-signature; CMG, Cdc45-DNA
replication licensing factor MCM-DNA replication complex GINS;
miRNA, microRNA. |
Prediction of the biological
mechanisms related to the CIN-lncRNAs
To identify the functions and signaling pathways of
CIN-related lncRNAs, the present study constructed a lncRNA-mRNA
co-expression network (Fig. S3).
Pearson's correlation coefficients were calculated, and the mRNAs
positively correlated with the seven CIN-lncRNAs and six
aneuploidy-associated lncRNAs (AS-lncRNAs) are presented in
tables SIV and SV. GO enrichment analysis revealed that
the functions of the CIN-lncRNAs were associated with ‘microtubule
binding’, ‘condensed chromosome’ and ‘mitotic sister chromatid
segregation’ (P<0.05). KEGG pathway analysis showed that the
identified CIN-lncRNAs were involved in ‘Oocyte meiosis’, ‘Cell
cycle’ and ‘Transcriptional misregulation in cancer’ (Fig. 3B and C). The functions of
AS-lncRNAs were predominantly enriched in ‘chromosome, centromeric
region’, ‘DNA helicase activity’, ‘meiotic cell cycle process’ and
‘mitotic cell cycle phase transition’ (Fig. 3E). Furthermore, KEGG pathway
analysis of AS-lncRNA-associated protein-related genes demonstrated
that the majority of enriched pathways were related to ‘Oocyte
meiosis’, ‘Cell cycle’ and ‘p53 signaling pathway’ (Fig. 3D).
Validation of expression levels of
U62317.4 in BC samples
The expression level of U62317.4 significantly
increased in BC tissue compared with adjacent tissue, and tissues
with a high CIN level displayed significantly higher U62317.4
levels than low-CIN tissues in the TCGA dataset (Fig. 4A). In addition, ER−
samples displayed significantly higher levels of U62317.4 than
ER+ samples (Fig. 4B).
Specifically, the basal-like subtype of BC displayed the highest
expression level of U62317.4, which was significantly higher than
the luminal A and B subtypes (Fig.
4C). In the GSE115275 dataset, patients with TNBC (n=6) showed
significantly higher expression of U62317.4 than adjacent tissues
(n=6) (P<0.05; Fig. S2C);
however, BC tissue (n=4) in the GSE159490 dataset showed no
significant difference in U62317.4 expression compared with
adjacent tissue (Fig. S2D). Based
on the lncRNA-mRNA network (Tables
SIV and SV) and preceding
KEGG pathway analysis (Fig. 3B and
D), the present study validated the correlation between hub
genes and their associated pathways, including CDC20, mitotic
checkpoint serine/threonine kinase B (BUB1B), survivin, threonine
tyrosine kinase (TTK), mitotic arrest deficient 2-like 1 (MAD2L1)
and Polo-like kinase 1 (PLK1), and U62317.4 levels. The present
study revealed a significant weak positive correlation between the
expression levels of U62317.4 and CDC20 (Fig. S2E). There was also a linear
correlation between U62317.4 expression and the mRNA levels of cell
cycle checkpoint proteins, such as MAD2L1, AURKB, PLK1 and BUB1B
(data not shown). Considering CDC20 is an important mitotic
regulator, and a key protein in the cell cycle and meiotic
processes, the present study proposed that high expression U62317.4
in BC may have regulated CIN by affecting mitotic processes.
Function of U62317.4 in BC cell
proliferation and migration
To validate these findings in different cell lines
and in the collected patient samples, BC tissues displayed a
significantly higher expression level of U62317.4 than adjacent
tissues (Fig. 4D). The expression
level of U62317.4 was significantly higher in BC cells compared
with epithelial cells, especially in the MDA-MB-231 cell line,
comprising basal-like TNBC cells (Fig.
4E). Compared with controls, the expression of U62317.4 in
MCF-7 cells, which are ER+, PR-positive luminal BC
cells, and MDA-MB-231 cells was significantly reduced after
transfection with ASOs, while U62317.4 expression was significantly
increased after transfection with U62317.4 overexpression plasmids
(Fig. 4F). Silencing U62317.4
significantly suppressed cell viability (Fig. 4I), wound-healing ability (Fig. 4G) and migration in BC cells
(Fig. 4J). In addition, expression
of the apoptosis-related protein p53 was notably promoted after
U62317.4 knockdown (Figs. 4H and
S2F and G), while CDC20 and BUB1B
expression showed marked decreases after U62317.4 was silenced. On
the contrary, U62317.4 overexpression promoted BC cell viability,
proliferation and migration (Fig. 4I
and J), as well as BC cell line wound closure (Fig. 4G). BUB1B and CDC20 protein levels
were markedly increased following U62317.4 overexpression while p53
protein expression significantly decreased (Figs. 4H and S2F and G). These findings suggested that
U62317.4 acted as an important regulator of tumorigenesis.
Discussion
CIN is a dynamic feature of abnormal chromosomes. It
is challenging to precisely assess the degree of CIN across
different cancer types due to its diverse patterns and
consequences, which complicates the establishment of a consistent
standard (8,10,38).
Advances in sequencing technologies have enabled systematic
detection of genomic variations in human cancers, including an
increased rate of nCINs or accumulating sCINs (39). Both nCINs and sCINs markedly
contribute to tumorigenesis, tumor progression and prognosis across
multiple cancer types (5,10,11).
A pan-cancer study established a CIN framework, proposing copy
number signatures as quantitative measures of CIN across
malignancies (8). The present
study observed that basal-like BC presents with widespread CNVs
across chromosomal regions, which were more notably associated with
elevated CIN levels and worse prognoses than the other subtypes.
Genetic amplification or deletion within these regions, such as
long intergenic non-protein coding RNA 536, keratin 15, BRCA2 and
CDKN2A, may contribute to tumorigenesis (40–42).
Thus, CNVs associated with the development of CIN result in a
further invasive and metastatic phenotype (13,43)
and poor outcomes (38,44).
The present study employed two CIN-evaluation
methods, CIN70 scores and ASs. In a number of cancers, a high CIN70
score associates with poor patient prognosis (6,12,45).
However, there is debate as to whether CIN70 score may be an
accurate predictor of CIN or whether it reflects cell proliferative
capacity (46). The present study
operated on the assumption that CIN70-associated genes reflected
partial CIN features and were associated with malignant phenotypes.
Additionally, AS score was determined using the ABSOLUTE method
based on the cellular copy number of DNA fragments (30). By analyzing CIN scores and their
associated genes, the co-expressed mRNAs were found to be
predominantly enriched in ‘Cell cycle’, ‘Oocyte meiosis’ and ‘p53
signaling pathway’. Focusing on these three pathways, the
expression levels of cell cycle checkpoint proteins, such as
serine/threonine-protein kinase Chk2, mitotic spindle assembly
checkpoint protein MAD2B, BUB1B, G2/mitotic-specific
cyclin-B1 and TTK, suggested potential correlations with the
expression of previously-identified AS- and CIN-lncRNAs, which was
consistent with the established role of these proteins in BC risk
assessment (42,47,48).
Dysregulation of cyclin-dependent kinases mediates cell cycle
defects (47), and dysregulation
of p53, which acts as a guardian of genomic integrity, may
ultimately exacerbate CIN, fostering invasive phenotypes and
metastasis (49–51). Therefore, the screened lncRNAs may
have contributed towards the regulation of BC tumor
progression.
A growing amount of evidence has highlighted the
potential interplay between CINs and lncRNAs, with CIN-lncRNAs
emerging as important regulators and potential biomarkers of cancer
development (21,22,48).
Notably, lncRNAs linked to CIN have shown promise as diagnostic
markers and therapeutic targets (6,7,10,52),
underscoring the utility of chromosomal sequencing for profiling
CNVs in cancer. In the present study, the lncRNA U62317.4 was
identified as an oncogenic lncRNA that was upregulated in BC,
particularly in subtypes with high CIN levels. The innovation of
the present study comprised the important link between CIN and
lncRNAs in terms of tumor progression and prognosis. Previous
studies have revealed that lncRNAs such as LINC01235, MAT1, CCAT2
and NORAD are involved in CIN modulation. Specifically: i) The
lncRNA MAT1 induced by CNV plays an oncogenic role in tumorigenesis
by blocking the interaction between histone-lysine
N-methyltransferase 2A and the protocadherin 20 promoter (22); ii) the lncRNA CCAT2 leads to
chromosomal segregation error and induces CIN (21); and iii) the lncRNA NORAD maintains
normal mitosis and chromosomal stability (53,54).
Furthermore, LINC01235 regulates global genetic modifications, such
as trimethylation of histone 3 at lysine 36 and acetylation of
histone 3 at lysines 9 and 27, and enhances DNA replication,
thereby increasing resistance to therapeutic intervention (55). Similarly, U62317.4 has been
described as a potential oncogenic factor in colon cancer (56), BC (57) and bladder cancer (58). Inhibition of U62317.4 has been
shown to markedly reduce the proliferation, migration and
tumorigenesis of HCT116 cells (59). The findings of the present study
indicated that U62317.4 could be used as a tumor biomarker and a
therapeutic target for BC. Furthermore, other candidate lncRNAs,
such as MAPT-AS1 and LINC00668, have been shown to participate in
cancer progression (60,61) and induce chemoresistance (62), whereas AL138789.1, AC002456.1 and
AC046168.1 are considered useful prognostic biomarkers in lung
adenocarcinoma (63), glioblastoma
multiforme (64) and
ER− BC (65). Thus,
these CIN-related lncRNAs may serve as reliable biomarkers and
provide effective prognostic information for patients with BC.
The p53 pathway has emerged as an important node in
CIN regulation. The findings of the present study suggested that
U62317.4 may have exacerbated CIN via p53/CDC20 signaling.
Wild-type p53 maintains genomic stability, whereas its loss or
mutation, common in TNBC, drives tumor progression (66). As a key response factor to DNA
damage, p53 has been shown to have a close regulatory association
with several lncRNAs (50).
Notably, the lncRNA TLNC1 promotes the cytoplasmic translocation of
p53 and inhibits its transcriptional activity (67), whereas the lncRNA SOCS2-AS1 binds
to p53 and induces its degradation (68). As a response factor to p53, DNA
damage-induced NORAD maintains normal mitosis and chromosomal
stability by preventing the stability and translation of pumilio
(53) and by decreasing aneuploidy
in multiple cells (54).
Furthermore, it has been established that CDC20 is involved in
chromosomal segregation, mitosis and meiosis, allowing cells with
CIN to exit mitosis and avoid apoptosis (69), and other spindle assembly
checkpoint proteins ensure the correct partitioning of chromosomes
during mitosis to maintain CIN (5,20).
For instance, it has been reported that the lncRNA CRYBG3 blocks
the interaction between mitotic checkpoint protein BUB3 (BUB3) and
CDC20 by directly binding to BUB3, thereby promoting mitotic error
and leading to aneuploidy and cancer progression (48).
Mutations in p53 account for the incidence of almost
80% of TNBC cases; loss of p53 function can result from genetic
inactivation by mutations or functional inactivation by
post-transcriptional modification such as ubiquitination (70). Both wild-type and mutant p53 (TP53)
can alter the expression of various genes and are associated with
tumor progression and prognosis (66). Gain-of-function of TP53 predisposes
cells to CIN, leading to TP53-CIN downstream signaling and thereby
promoting cell metastasis (51).
We hypothesize that TP53 variants may have led to the
transcriptional induction of U62317.4, resulting in higher levels
of U62317.4 and CIN in MDA-MB-231 cells than in MCF-7 cells
comprising wild-type p53. We also hypothesize that U62317.4 may
have regulated CIN in TNBC cells by decreasing variation in signals
of the TP53 gene and centromere position signals, thereby leading
to a reduction of TP53 signaling and expression. However, these
hypotheses remain to be experimentally validated in future
studies.
Although the present study evaluated the degree of
CIN and screened U62317.4 as a predictor for cancer progression and
prognosis, there were also some limitations, such as the lack of
detailed analysis of U62317.4 activity in regulating TP53
transcription or disrupting TP53 signaling, as well as a lack of
detailed investigation as to how U62317.4 influenced CIN
characteristics in BC. Further research is still needed to explore
the function of other lncRNAs in the development of BC.
Summarily, the present study defined a CIN-lncRNA
model to evaluate the prognosis of patients with BC based on CIN70
scores and mechanistically linked the lncRNA U62317.4 to oncogenic
phenotypes through p53 and CDC20 dysregulation. The findings of the
present study provided further insights into lncRNA-based BC
stratification and targeted therapies in patients with BC.
Supplementary Material
Supporting Data
Supporting Data
Supporting Data
Supporting Data
Supporting Data
Supporting Data
Acknowledgements
Not applicable.
Funding
The present work was supported by the National Natural Science
Foundation of China (grant nos. 82203146 and 82172838), Healthy
committee project of Jiangsu province (grant no. M2022008) and the
Science and Technology Planning Social Development Project of
Zhenjiang (grant no. SH2022028).
Availability of data and materials
The data generated in the present study may be
requested from the corresponding author.
Authors' contributions
QC and HC participated in data acquisition,
analysis and interpretation, and drafted the manuscript. HY
collected BC tissues and performed data analysis. QC, HY and YT
performed the experimental procedures. XZ and QC contributed to the
research design and provided substantial revisions. QC, HY and YT
confirm the authenticity of all the raw data. All authors read and
approved the final version of the manuscript.
Ethics approval and consent to
participate
The present study involving human participants was
conducted in accordance with the Declaration of Helsinki and was
approved by The Ethics Committee of the Fourth Affiliated Hospital
of Jiangsu University (approval no. 2021018). Written informed
consent was obtained from all participants in the present
study.
Patient consent for publication
Not applicable.
Competing interests
The authors declare that they have no competing
interests.
Glossary
Abbreviations
Abbreviations:
|
CIN
|
chromosomal instability
|
|
AS
|
aneuploidy score
|
|
lncRNA
|
long non-coding RNA
|
|
TCGA
|
The Cancer Genome Atlas
|
|
CNVs
|
copy number variations
|
|
ROC
|
receiver operating characteristic
|
|
GAPDH
|
glyceraldehyde 3-phosphate
dehydrogenase
|
|
GO
|
Gene Ontology
|
|
KEGG
|
Kyoto Encyclopedia of Genes and
Genomes
|
References
|
1
|
Siegel RL, Kratzer TB, Giaquinto AN, Sung
H and Jemal A: Cancer statistics, 2025. CA Cancer J Clin. 75:10–45.
2025.PubMed/NCBI
|
|
2
|
Hong R and Xu B: Breast cancer: An
up-to-date review and future perspectives. Cancer Commun (Lond).
42:913–936. 2022. View Article : Google Scholar : PubMed/NCBI
|
|
3
|
Loibl S, Poortmans P, Morrow M, Denkert C
and Curigliano G: Breast cancer. Lancet. 397:1750–1769. 2021.
View Article : Google Scholar : PubMed/NCBI
|
|
4
|
Nicolini A, Ferrari P and Duffy MJ:
Prognostic and predictive biomarkers in breast cancer: Past,
present and future. Semin Cancer Biol. 52:56–73. 2018. View Article : Google Scholar : PubMed/NCBI
|
|
5
|
Castellanos G, Valbuena DS, Pérez E,
Villegas VE and Rondón-Lagos M: Chromosomal instability as enabling
feature and central hallmark of breast cancer. Breast Cancer (Dove
Med Press). 15:189–211. 2023.PubMed/NCBI
|
|
6
|
Carter SL, Eklund AC, Kohane IS, Harris LN
and Szallasi Z: A signature of chromosomal instability inferred
from gene expression profiles predicts clinical outcome in multiple
human cancers. Nat Genet. 38:1043–1048. 2006. View Article : Google Scholar : PubMed/NCBI
|
|
7
|
Duijf PHG, Nanayakkara D, Nones K, Srihari
S, Kalimutho M and Khanna KK: Mechanisms of genomic instability in
breast cancer. Trends Mol Med. 25:595–611. 2019. View Article : Google Scholar : PubMed/NCBI
|
|
8
|
Drews RM, Hernando B, Tarabichi M, Haase
K, Lesluyes T, Smith PS, Morrill Gavarró L, Couturier DL, Liu L,
Schneider M, et al: A pan-cancer compendium of chromosomal
instability. Nature. 606:976–983. 2022. View Article : Google Scholar : PubMed/NCBI
|
|
9
|
Laughney AM, Elizalde S, Genovese G and
Bakhoum SF: Dynamics of tumor heterogeneity derived from clonal
karyotypic evolution. Cell Rep. 12:809–820. 2015. View Article : Google Scholar : PubMed/NCBI
|
|
10
|
Bach DH, Zhang W and Sood AK: Chromosomal
instability in tumor initiation and development. Cancer Res.
79:3995–4002. 2019. View Article : Google Scholar : PubMed/NCBI
|
|
11
|
Cyll K, Skaaheim Haug E, Pradhan M,
Vlatkovic L, Carlsen B, Löffeler S, Kildal W, Skogstad K, Hauge
Torkelsen F, Syvertsen RA, et al: DNA ploidy and PTEN as biomarkers
for predicting aggressive disease in prostate cancer patients under
active surveillance. Br J Cancer. 131:895–904. 2024. View Article : Google Scholar : PubMed/NCBI
|
|
12
|
Bold IT, Specht AK, Droste CF, Zielinski
A, Meyer F, Clauditz TS, Münscher A, Werner S, Rothkamm K, Petersen
C and Borgmann K: DNA damage response during replication correlates
with CIN70 score and determines survival in HNSCC patients. Cancers
(Basel). 13:11942021. View Article : Google Scholar : PubMed/NCBI
|
|
13
|
Miller ET, You S, Cadaneanu RM, Kim M,
Yoon J, Liu ST, Li X, Kwan L, Hodge J, Quist MJ, et al: Chromosomal
instability in untreated primary prostate cancer as an indicator of
metastatic potential. BMC Cancer. 20:3982020. View Article : Google Scholar : PubMed/NCBI
|
|
14
|
Rieckhoff J, Meyer F, Classen S, Zielinski
A, Riepen B, Wikman H, Petersen C, Rothkamm K, Borgmann K and
Parplys AC: Exploiting chromosomal instability of PTEN-Deficient
Triple-negative breast cancer cell lines for the sensitization
against PARP1 inhibition in a Replication-dependent manner.
Cancers. 12:28092020. View Article : Google Scholar : PubMed/NCBI
|
|
15
|
Du M, Cai Q, Sun J, Zhang M, Zhang S, Liu
X, Zhang M and Zhang X: Aneuploid serves as a prognostic marker and
favors immunosuppressive microenvironment in ovarian cancer. J
Ovarian Res. 17:302024. View Article : Google Scholar : PubMed/NCBI
|
|
16
|
Chen X, Agustinus AS, Li J, DiBona M and
Bakhoum SF: Chromosomal instability as a driver of cancer
progression. Nat Rev Genet. 26:31–46. 2024. View Article : Google Scholar : PubMed/NCBI
|
|
17
|
Jiang T, Zhu J, Jiang S, Chen Z, Xu P,
Gong R, Zhong C, Cheng Y, Sun X, Yi W, et al: Targeting lncRNA
DDIT4-AS1 sensitizes triple negative breast cancer to chemotherapy
via suppressing of autophagy. Adv Sci (Weinh). 10:e22072572023.
View Article : Google Scholar : PubMed/NCBI
|
|
18
|
Zhang Z, Lu YX, Liu F, Sang L, Shi C, Xie
S, Bian W, Yang JC, Yang Z, Qu L, et al: lncRNA BREA2 promotes
metastasis by disrupting the WWP2-mediated ubiquitination of
Notch1. Proc Natl Acad Sci USA. 120:e22066941202023. View Article : Google Scholar : PubMed/NCBI
|
|
19
|
Yang K, Liang X and Wen K: Long non-coding
RNAs interact with RNA-binding proteins to regulate genomic
instability in cancer cells (Review). Oncol Rep. 48:1752022.
View Article : Google Scholar : PubMed/NCBI
|
|
20
|
Mohapatra S, Winkle M, Ton AN, Nguyen D
and Calin GA: The role of Non-coding RNAs in chromosomal
instability in cancer. J Pharmacol Exp Ther. 384:10–19. 2023.
View Article : Google Scholar : PubMed/NCBI
|
|
21
|
Chen B, Dragomir MP, Fabris L, Bayraktar
R, Knutsen E, Liu X, Tang C, Li Y, Shimura T, Ivkovic TC, et al:
The long noncoding RNA CCAT2 induces chromosomal instability
through BOP1-AURKB signaling. Gastroenterology. 159:2146–2162.e33.
2020. View Article : Google Scholar : PubMed/NCBI
|
|
22
|
Pan H, Wang H, Zhang X, Yang F, Fan X and
Zhang H: Chromosomal instability-associated MAT1 lncRNA insulates
MLL1-guided histone methylation and accelerates tumorigenesis. Cell
Rep. 41:1118292022. View Article : Google Scholar : PubMed/NCBI
|
|
23
|
Berger AC, Korkut A, Kanchi RS, Hegde AM,
Lenoir W, Liu W, Liu Y, Fan H, Shen H, Ravikumar V, et al: A
comprehensive Pan-Cancer molecular study of gynecologic and breast
cancers. Cancer Cell. 33:690–705.e9. 2018. View Article : Google Scholar : PubMed/NCBI
|
|
24
|
Frankish A, Carbonell-Sala S, Diekhans M,
Jungreis I, Loveland JE, Mudge JM, Sisu C, Wright JC, Arnan C,
Barnes I, et al: GENCODE: Reference annotation for the human and
mouse genomes in 2023. Nucleic Acids Res. 51:D942–D949. 2023.
View Article : Google Scholar : PubMed/NCBI
|
|
25
|
Ritchie ME, Phipson B, Wu D, Hu Y, Law CW,
Shi W and Smyth GK: limma powers differential expression analyses
for RNA-sequencing and microarray studies. Nucleic Acids Res.
43:e472015. View Article : Google Scholar : PubMed/NCBI
|
|
26
|
Wickham H: ggplot2: Elegant Graphics for
Data Analysis. Springer Cham; Edition 2. New York: 2016
|
|
27
|
Tang L, Chen Y, Tang X, Wei D, Xu X and
Yan F: Long noncoding RNA DCST1-AS1 promotes cell proliferation and
metastasis in Triple-negative breast cancer by forming a positive
regulatory loop with miR-873-5p and MYC. J Cancer. 11:311–323.
2020. View Article : Google Scholar : PubMed/NCBI
|
|
28
|
Zheng F, Chen J, Zhang X, Wang Z, Chen J,
Lin X, Huang H, Fu W, Liang J, Wu W, et al: The HIF-1α antisense
long non-coding RNA drives a positive feedback loop of HIF-1α
mediated transactivation and glycolysis. Nat Commun. 12:13412021.
View Article : Google Scholar : PubMed/NCBI
|
|
29
|
Mermel CH, Schumacher SE, Hill B, Meyerson
ML, Beroukhim R and Getz G: GISTIC2.0 facilitates sensitive and
confident localization of the targets of focal somatic copy-number
alteration in human cancers. Genome Biol. 12:R412011. View Article : Google Scholar : PubMed/NCBI
|
|
30
|
Carter SL, Cibulskis K, Helman E, McKenna
A, Shen H, Zack T, Laird PW, Onofrio RC, Winckler W, Weir BA, et
al: Absolute quantification of somatic DNA alterations in human
cancer. Nat Biotechnol. 30:413–421. 2012. View Article : Google Scholar : PubMed/NCBI
|
|
31
|
Dennis G Jr, Sherman BT, Hosack DA, Yang
J, Gao W, Lane HC and Lempicki RA: DAVID: Database for annotation,
visualization, and integrated discovery. Genome Biol. 4:P32003.
View Article : Google Scholar : PubMed/NCBI
|
|
32
|
Giuliano AE, Connolly JL, Edge SB,
Mittendorf EA, Rugo HS, Solin LJ, Weaver DL, Winchester DJ and
Hortobagyi GN: Breast Cancer-Major changes in the American Joint
Committee on Cancer eighth edition cancer staging manual. CA Cancer
J Clin. 67:290–303. 2017.PubMed/NCBI
|
|
33
|
Filippi A and Mocanu MM: Mining TCGA
database for genes with prognostic value in breast cancer. Int J
Mol Sci. 24:16222023. View Article : Google Scholar : PubMed/NCBI
|
|
34
|
Neve RM, Chin K, Fridlyand J, Yeh J,
Baehner FL, Fevr T, Clark L, Bayani N, Coppe JP, Tong F, et al: A
collection of breast cancer cell lines for the study of
functionally distinct cancer subtypes. Cancer Cell. 10:515–527.
2006. View Article : Google Scholar : PubMed/NCBI
|
|
35
|
Subik K, Lee JF, Baxter L, Strzepek T,
Costello D, Crowley P, Xing L, Hung MC, Bonfiglio T, Hicks DG and
Tang P: The expression patterns of ER, PR, HER2, CK5/6, EGFR, Ki-67
and AR by immunohistochemical analysis in breast cancer cell lines.
Breast Cancer (Auckl). 4:35–41. 2010. View Article : Google Scholar : PubMed/NCBI
|
|
36
|
Livak KJ and Schmittgen TD: Analysis of
relative gene expression data using real-time quantitative PCR and
the 2(−Delta Delta C(T)) method. Methods. 25:402–408. 2001.
View Article : Google Scholar : PubMed/NCBI
|
|
37
|
R Core Team, . A Language and Environment
for Statistical Computing. R Foundation for Statistical Computing;
Vienna: 2023
|
|
38
|
Birkbak NJ, Eklund AC, Li Q, McClelland
SE, Endesfelder D, Tan P, Tan IB, Richardson AL, Szallasi Z and
Swanton C: Paradoxical relationship between chromosomal instability
and survival outcome in cancer. Cancer Res. 71:3447–3452. 2011.
View Article : Google Scholar : PubMed/NCBI
|
|
39
|
Meléndez-Flórez MP, Ortega-Recalde O,
Rangel N and Rondón-Lagos M: Chromosomal instability and clonal
heterogeneity in breast cancer: From mechanisms to clinical
applications. Cancers. 17:12222025. View Article : Google Scholar : PubMed/NCBI
|
|
40
|
Hu C, Zhang X, Fang K, Guo Z and Li L:
LINC00536 promotes breast cancer progression by regulating ROCK1
via sponging of miR-214-5p. Biochem Genet. 61:1163–1184. 2022.
View Article : Google Scholar : PubMed/NCBI
|
|
41
|
Chong LY, Cheok PY, Tan WJ, Thike AA,
Allen G, Ang MK, Ooi AS, Tan P, The BT and Tan PH: Keratin 15,
transcobalamin I and homeobox gene Hox-B13 expression in breast
phyllodes tumors: novel markers in biological classification.
Breast Cancer Res Treat. 132:143–151. 2012. View Article : Google Scholar : PubMed/NCBI
|
|
42
|
Couch FJ, Shimelis H, Hu C, Hart SN,
Polley EC, Na J, Hallberg E, Moore R, Thomas A, Lilyquist J, et al:
Associations between cancer predisposition testing panel genes and
breast cancer. JAMA Oncol. 3:1190–1196. 2017. View Article : Google Scholar : PubMed/NCBI
|
|
43
|
D'Assoro AB, Leontovich A, Amato A,
Ayers-Ringler JR, Quatraro C, Hafner K, Jenkins RB, Libra M, Ingle
J, Stivala F, et al: Abrogation of p53 function leads to metastatic
transcriptome networks that typify tumor progression in human
breast cancer xenografts. Int J Oncol. 37:1167–1176.
2010.PubMed/NCBI
|
|
44
|
Danielsen HE, Hveem TS, Domingo E, Pradhan
M, Kleppe A, Syvertsen RA, Kostolomov I, Nesheim JA, Askautrud HA,
Nesbakken A, et al: Prognostic markers for colorectal cancer:
Estimating ploidy and stroma. Ann Oncol. 29:616–623. 2018.
View Article : Google Scholar : PubMed/NCBI
|
|
45
|
Spurr LF, Martinez CA, Katipally RR, Iyer
SC, Pugh SA, Bridgewater JA, Primrose JN, Domingo E, Maughan TS,
D'Angelica MI, et al: A proliferative subtype of colorectal liver
metastases exhibits hypersensitivity to cytotoxic chemotherapy. NPJ
Precis Oncol. 6:722022. View Article : Google Scholar : PubMed/NCBI
|
|
46
|
Sheltzer JM: A transcriptional and
metabolic signature of primary aneuploidy is present in
chromosomally unstable cancer cells and informs clinical prognosis.
Cancer Res. 73:6401–6412. 2013. View Article : Google Scholar : PubMed/NCBI
|
|
47
|
Malumbres M and Barbacid M: Cell cycle,
CDKs and cancer: A changing paradigm. Nat Rev Cancer. 9:153–166.
2009. View Article : Google Scholar : PubMed/NCBI
|
|
48
|
Guo Z, Dai Y, Hu W, Zhang Y, Cao Z, Pei W,
Liu N, Nie J, Wu A, Mao W, et al: The long noncoding RNA CRYBG3
induces aneuploidy by interfering with spindle assembly checkpoint
via direct binding with Bub3. Oncogene. 40:1821–1835. 2021.
View Article : Google Scholar : PubMed/NCBI
|
|
49
|
Marei HE, Althani A, Afifi N, Hasan A,
Caceci T, Pozzoli G, Morrione A, Giordano A and Cenciarelli C: p53
signaling in cancer progression and therapy. Cancer Cell Int.
21:7032021. View Article : Google Scholar : PubMed/NCBI
|
|
50
|
Saito A, Kamikawa Y, Ito T, Matsuhisa K,
Kaneko M, Okamoto T, Yoshimaru T, Matsushita Y, Katagiri T and
Imaizumi K: p53-independent tumor suppression by cell-cycle arrest
via CREB/ATF transcription factor OASIS. Cell Rep. 42:1124792023.
View Article : Google Scholar : PubMed/NCBI
|
|
51
|
Zhao M, Wang T, Gleber-Netto FO, Chen Z,
McGrail DJ, Gomez JA, Ju W, Gadhikar MA, Ma W, Shen L, et al:
Mutant p53 gains oncogenic functions through a chromosomal
instability-induced cytosolic DNA response. Nat Commun. 15:1802024.
View Article : Google Scholar : PubMed/NCBI
|
|
52
|
Winkle M, El-Daly SM, Fabbri M and Calin
GA: Noncoding RNA therapeutics-challenges and potential solutions.
Nat Rev Drug Discov. 20:629–651. 2021. View Article : Google Scholar : PubMed/NCBI
|
|
53
|
Lee S, Kopp F, Chang TC, Sataluri A, Chen
B, Sivakumar S, Yu H, Xie Y and Mendell JT: Noncoding RNA NORAD
regulates genomic stability by sequestering PUMILIO proteins. Cell.
164:69–80. 2016. View Article : Google Scholar : PubMed/NCBI
|
|
54
|
Yu Y, Chen F, Jin Y, Yang Y, Wang S, Zhang
J, Chen C, Zeng Q, Han W, Wang H, et al: Downregulated NORAD in
neuroblastoma promotes cell proliferation via chromosomal
instability and predicts poor prognosis. Acta Biochim Pol.
67:595–603. 2020.PubMed/NCBI
|
|
55
|
Zhang Q, Wang X, Shao Z, Zhang Y, Zhang L,
Chen M, Zhou X, Zhu H, Zhou Y, Lu X, et al: LINC01235 promotes
clonal evolution through DNA replication Licensing-induced
chromosomal instability in breast cancer. Adv Sci (Weinh).
12:e24135272025. View Article : Google Scholar : PubMed/NCBI
|
|
56
|
Jiao Y, Li S, Wang X, Yi M, Wei H, Rong S,
Zheng K and Zhang L: A genomic instability-related lncRNA model for
predicting prognosis and immune checkpoint inhibitor efficacy in
breast cancer. Front Immunol. 13:9298462022. View Article : Google Scholar : PubMed/NCBI
|
|
57
|
Li X, Jin F and Li Y: A novel
autophagy-related lncRNA prognostic risk model for breast cancer. J
Cell Mol Med. 25:4–14. 2021. View Article : Google Scholar : PubMed/NCBI
|
|
58
|
Wan J, Guo C, Fang H, Xu Z, Hu Y and Luo
Y: Autophagy-related long non-coding RNA is a prognostic indicator
for bladder cancer. Front Oncol. 11:6472362021. View Article : Google Scholar : PubMed/NCBI
|
|
59
|
Chen Y, Zhang Y, Lu J, Liu Z, Zhao S,
Zhang M, Lu M, Xu W, Sun F, Wu Q, et al: Characteristics of
prognostic programmed cell Death-Related long noncoding RNAs
associated with immune infiltration and therapeutic responses to
colon cancer. Front Immunol. 13:8282432022. View Article : Google Scholar : PubMed/NCBI
|
|
60
|
Li B, Liu D and Xu J, Lu Z, Liu Q, Zhao X,
Wang X, Peng T and Xu J: Overexpression of lncRNA MAPT-AS1
exacerbates cell proliferation and metastasis in breast cancer.
Transl Cancer Res. 11:835–847. 2022. View Article : Google Scholar : PubMed/NCBI
|
|
61
|
Pan Y, Pan Y, Cheng Y, Yang F, Yao Z and
Wang O: Knockdown of LncRNA MAPT-AS1 inhibites proliferation and
migration and sensitizes cancer cells to paclitaxel by regulating
MAPT expression in ER-negative breast cancers. Cell Biosci.
8:72018. View Article : Google Scholar : PubMed/NCBI
|
|
62
|
Qian W, Zhu Y, Wu M, Guo Q, Wu Z, Lobie PE
and Zhu T: Linc00668 promotes invasion and stem Cell-like
properties of breast cancer cells by interaction with SND1. Front
Oncol. 10:882020. View Article : Google Scholar : PubMed/NCBI
|
|
63
|
Zhang Z, Yang L, Li Y, Wu Y, Li X and Wu
X: Four long noncoding RNAs act as biomarkers in lung
adenocarcinoma. Open Med (Wars). 16:660–671. 2021. View Article : Google Scholar : PubMed/NCBI
|
|
64
|
Yu W, Ma Y, Hou W, Wang F, Cheng W, Qiu F,
Wu P and Zhang G: Identification of Immune-related lncRNA
prognostic signature and molecular subtypes for glioblastoma. Front
Immunol. 12:7069362021. View Article : Google Scholar : PubMed/NCBI
|
|
65
|
Zhang X, Zhang H, Li J, Ma X, He Z, Liu C,
Gao C, Li H, Wang X and Wu J: 6-lncRNA assessment model for
monitoring and prognosis of HER2-Positive breast cancer: Based on
transcriptome data. Pathol Oncol Res. 27:6090832021. View Article : Google Scholar : PubMed/NCBI
|
|
66
|
Harris SL and Levine AJ: The p53 pathway:
Positive and negative feedback loops. Oncogene. 24:2899–2908. 2005.
View Article : Google Scholar : PubMed/NCBI
|
|
67
|
Yuan K, Lan J, Xu L, Feng X, Liao H, Xie
K, Wu H and Zeng Y: Long noncoding RNA TLNC1 promotes the growth
and metastasis of liver cancer via inhibition of p53 signaling. Mol
Cancer. 21:1052022. View Article : Google Scholar : PubMed/NCBI
|
|
68
|
Zhang X, Zhang X, Yang G, Wan L, Yin F, Li
H and Yin D: LncRNA SOCS2-AS1 promotes the progression of papillary
thyroid cancer by destabilizing p53 protein. Biochem Biophys Res
Commun. 669:95–102. 2023. View Article : Google Scholar : PubMed/NCBI
|
|
69
|
Zheng S, Raz L, Zhou L, Cohen-Sharir Y,
Tian R, Ippolito MR, Gianotti S, Saad R, Wardenaar R, Broekhuis M,
et al: High CDC20 levels increase sensitivity of cancer cells to
MPS1 inhibitors. EMBO Rep. 26:1036–1061. 2025. View Article : Google Scholar : PubMed/NCBI
|
|
70
|
Petitjean A, Mathe E, Kato S, Ishioka C,
Tavtigian SV, Hainaut P and Olivier M: Impact of mutant p53
functional properties on TP53 mutation patterns and tumor
phenotype: Lessons from recent developments in the IARC TP53
database. Hum Mutat. 28:622–629. 2007. View Article : Google Scholar : PubMed/NCBI
|