Introduction
The incidence of lung cancer is increasing worldwide
(1). Notably, lung cancer is
strongly associated with tobacco exposure, and it is characterized
by a high tumor mutational burden, rapid disease progression, high
propensity for recurrence and metastasis, and poor overall survival
(OS) (2,3). Immune checkpoint inhibitors (ICIs)
target signaling pathways such as programmed cell death protein
1/programmed cell death ligand 1 and cytotoxic
T-lymphocyte-associated protein 4, and offer renewed optimism for
lung cancer treatment (4);
however, their immunotherapeutic efficacy remains suboptimal. This
is primarily due to the complex tumor microenvironment (TME) of
lung cancer, which is characterized by low immunogenicity and
prominent immune evasion (5).
Therefore, to overcome the current challenges in lung cancer
treatment, in-depth investigations are required into the molecular
pathogenesis of lung cancer and the identification of target genes
with clinical translational potential.
Lactate is a crucial metabolite within the TME
(6) and lactate metabolism, driven
by the Warburg effect, is a major pathway that undergoes
alterations in cancer (7). This
metabolic alteration leads to the overproduction of lactate, even
in the presence of sufficient oxygen; this boosts tumor cell
proliferation and creates an immunosuppressive TME (8). Increased lactate levels hinder immune
function by altering the pH of the TME, thereby impairing the
activity of cytotoxic T lymphocytes and dendritic cells (9). Additionally, lactate acts as the
substrate for histone lactylation, a novel post-translational
modification that has far-reaching effects on gene regulation.
Histone lactylation participates in immune evasion by altering gene
expression in the immune cells within the TME (10). This leads to increased expression
of genes that inhibit immune activity, thereby assisting tumors in
evading immune surveillance (11,12).
For example, LDH-mediated histone H3K18 lactylation upregulates
Nur77 to drive immune escape in small cell lung cancer (13,14).
Traditional observational studies are susceptible to
confounding factors and reverse causality, hindering the
establishment of conclusive gene-disease connections (15). Mendelian randomization (MR)
overcomes this issue by employing genetic variants as instrumental
variables (IVs). This method takes advantage of the random
inheritance of these variants at birth to enhance causal inference.
It allows for efficient deduction of causal links between exposures
(such as gene expression and protein levels) and disease outcomes
(such as lung cancer incidence) at the population level, while
markedly reducing biases (16,17).
Recently, MR analyses that integrate data from protein quantitative
trait loci and expression quantitative trait loci (eQTL) have
successfully identified numerous potential therapeutic targets in
prostate cancer (18) and breast
cancer (19), providing a novel
paradigm for precision oncology investigations.
Given the critical roles of lactate metabolism and
histone lactylation in tumor progression and immune regulation, the
current study employed the MR approach to screen for
lactylation-related genes, which may have a causal relationship
with lung cancer. The present study aimed to offer novel
perspectives for the mechanistic research and therapeutic target
exploration of lung cancer.
Materials and methods
Study design and data sources
The present study employed a two-sample MR method.
The eQTL datasets of lactylation-related genes were used as
exposure variables, and the genome-wide association study (GWAS)
summary statistics of lung cancer were used as outcome variables.
As described previously (20–23),
a catalog of 46 lactylation-related genes was compiled.
eQTL exposure data
The eQTL exposure data were acquired from the IEU
OpenGWAS Project (https://opengwas.io/), a global public database.
Single nucleotide polymorphisms (SNPs) exhibiting a strong
association with the expression of the 46 lactylation-related genes
(P<5×10⁻⁸) were selected as IVs. To avoid weak
instrument bias, only SNPs with an F-statistic >10 were included
as IVs, ensuring a strong association between the IVs and gene
expression.
Lung cancer outcome data
The lung cancer outcome data were sourced from the
Finnish database (finngen_R12_C3_lung cancer_EXALLC; http://r12.finngen.fi/pheno/C3_lung_cancer_EXALLC),
which included 909 lung cancer cases and 3,788,794 healthy
controls. The GWAS summary statistics in this database contained
~21,325,071 SNPs.
MR analysis
The MR analyses were performed using R software
(version 4.4.2; http://cran.r-project.org/bin/windows/base/old/4.4.2/)
packages ‘TwoSampleMR’ (version 0.5.6; http://CRAN.R-project.org/package=TwoSampleMR),‘ieugwasr’
(version 0.1.7; http://CRAN.R-project.org/package=ieugwasr) and
‘MRInstruments’ (version 0.4.0; http://CRAN.R-project.org/package=MRInstruments).
IV selection was conducted by retaining SNPs strongly associated
with lactylation-related gene expression (P<5×10⁻⁸) and with an
F-statistic>10 to avoid weak instrument bias; SNPs were then
clumped to remove linkage disequilibrium (LD) using a threshold of
r<0.001 and a window size of 1Mb to ensure independence. The
processed eQTL data were used as the exposure dataset, and the lung
cancer GWAS summary statistics were used as the outcome dataset.
Prior to analysis, allele harmonization was performed to ensure
consistency of allele orientation and effect direction between
exposure and outcome datasets. Strand-ambiguous SNPs and those with
conflicting effect directions were excluded. The specific methods
employed in the present study included inverse variance weighting
(IVW), MR Egger, weighted median, simple mode and weighted mode.
For each gene, the causal impact size (β), P-value, standard error,
95% confidence interval (95% CI) and odds ratio were recorded.
Subsequently, The heterogeneity and pleiotropy of the odds ratio
were calculated using Cochran's Q test (for heterogeneity) and the
MR Egger intercept test (for horizontal pleiotropy), followed by
multivariate sensitivity analyses including leave-one-out
validation and MR-PRESSO outlier detection. The reliability of the
MR findings was confirmed using scatter diagrams, forest plots and
leave-one-out sensitivity analysis. Funnel plots were generated to
assess potential publication bias and the presence of outliers. The
screening criteria for core causal genes were set as P<0.05 in
the IVW method and uniform OR direction trends across all five
analytical approaches.
Multiple testing correction
The multiple testing correction protocol was
performed as follows: First, the IVW P-values of all
lactylation-related genes were extracted from the MR analysis
results to construct a raw P-value dataset. Second, the ‘p.adjust’
function in R software (version 4.4.2; r-project.org/) was used to
implement false discovery rate (FDR) and Bonferroni corrections,
with the correction base set as the number of effectively analyzed
candidate genes; the FDR correction threshold was defined as 0.05
to balance false-positive and false-negative risks, whereas the
Bonferroni correction threshold was set to 0.05 divided by the
number of effectively analyzed genes as a strict verification
standard. Finally, genes with corrected P-values below the
corresponding thresholds were identified as significantly
associated genes, and the screening criteria for core causal genes
were updated to: IVW method P<0.05, consistent OR directions
across all five MR analytical methods, and statistical significance
after at least one multiple testing correction.
Transcriptomic analysis
The transcriptomic data, including five Gene
Expression Omnibus (GEO) datasets, among which GSE6044 included
nine lung cancer tissues and 5 normal lung tissues, GSE11969
included 9 lung cancer tissues and 5 normal lung tissues, GSE40275
included 15 lung cancer tissues and 41 normal lung tissues, and
GSE43346 included 23 lung cancer tissues and 42 normal lung
tissues. (ncbi.nlm.nih.gov/geo/query/acc.cgi?acc=GSE6044;
ncbi.nlm.nih.gov/geo/query/acc.cgi?acc=GSE11969;
ncbi.nlm.nih.gov/geo/query/acc.cgi?acc=GSE40275;
ncbi.nlm.nih.gov/geo/query/acc.cgi?acc=GSE43346). Expression data
from three independent studies: George et al (24), Cai et al (25) and Liu et al (26) were also included.
Analysis of expression and
survival
RNA sequencing data from the GEO datasets underwent
differential expression profiling using the R software package
‘limma’ (version 3.58.1; http://www.bioconductor.org/packages/release/bioc/html/limma.html).
Log2 fold change (log2FC) and adjusted
P-value (P.adj) for Stathmin1 (STMN1) were calculated in
tumor vs. normal tissues derived from healthy individuals. The
differential expression profiles were visualized using box plots.
Kaplan-Meier survival analysis, paired with the log-rank test, was
used to explore the relationship between STMN1 expression
and OS, with all computations conducted in the ‘survival’ R package
(version 3.5–8; http://CRAN.R-project.org/package=survival) and
survival curves visualized for publication using ‘survminer’
(version 0.4.9; http://CRAN.R-project.org/package=survminer). The
findings from multivariate Cox proportional hazards regression
analysis were illustrated using a forest plot, which was generated
with the ‘forestplot’ R package (version 2.0.5;
CRAN.R-project.org/package=forestplot).
Immune correlations
The ‘MCPcounter’ (Microenvironment Cell Populations
counter) method was used to measure the infiltration abundance of
10 immune cell subsets (version 1.0.0; http://github.com/ebecht/MCPcounter). All analyses
were conducted using the George et al (24) dataset. Samples were dichotomized
into the low and high STMN1 expression group by taking the
median STMN1 expression level as the cut-off value. The
abundances of major immune cell infiltration were further
characterized using the Cell-type Identification By Estimating
Relative Subsets of RNA Transcripts (‘CIBERSORT’ R package, version
1.0; cibersort.stanford.edu/) (27), MCPcounter (28), Estimation of Proportions of Immune
and Cancer cells (EPIC) (‘EPIC’ R package, version 1.1.0;
http://github.com/GfellerLab/EPIC)
(29), Quantitative
Transcriptomics for Immune cell Quantification (quanTIseq)
(‘quanTIseq’ R package, version 2.1.0; http://icbi-lab.github.io/quanTIseq/) (30) and xCell algorithms (‘xCell’ R
package, version 1.1; http://xcell.ucsf.edu/) (31). Moreover, the expression patterns of
immune checkpoint molecules were compared between the high and low
STMN1 expression groups. The ESTIMATE algorithm (‘ESTIMATE’
R package, version 1.0.13; http://CRAN.R-project.org/package=ESTIMATE) and
Spearman's rank correlation analysis (‘stats’ R package, version
4.4.0; http://CRAN.R-project.org/package=stats) were applied
to calculate the correlation coefficient (R) and significance
(P-value) between STMN1 expression and stromal score, immune
score, estimate score and tumor purity.
Mutation data processing
The association between STMN1 expression and
lung cancer-related genomic alterations, including copy number
variations (CNVs) and somatic single-nucleotide variants/indels,
was evaluated using Spearman's rank correlation analysis and OR
analysis. CNVs were obtained from cBioPortal (cbioportal.org/) and
classified into amplification and homozygous deletion types.
Somatic mutation data, including SNPs, and insertions and
deletions, were obtained from the UCSC genome browser (https://genome.ucsc.edu/). The R software package
‘maftools’ was used for the data integration and analysis (version
2.14.0; bioconductor.org/packages/release/bioc/html/maftools.html),
and the R software packages ‘read.maf’ and ‘oncoplot’ (integrated
in maftools version 2.14.0) were used for file import facilitation
and generating waterfall plot visualizations. The enrichment of
mutated genes in patients with lung cancer and high or low
STMN1 expression in oncogenic signaling pathways was also
analyzed. All analyses were conducted using the George et al
(24) dataset. Samples were
dichotomized into the low STMN1 expression group and high
STMN1 expression group by taking the median STMN1
expression level (9.477354) as the cut-off value. The Drug-Gene
Interaction database (DGIdb) (32)
was used to generate a hypothesis on mutant gene druggability and
match the gene lists to drug-gene interactions.
Functional enrichment and pathway
analysis
The STMN1-associated proteins with differential
expression were identified, and their expression patterns were
visualized using volcano plots and heatmaps. A protein-protein
interaction (PPI) network was built using Cytoscape (version
3.10.4; cytoscape.org/Cytoscape) and the hub proteins within this
network were identified using the cytoHubba plugin. All analyses
were conducted using the Liu et al (26) dataset. Additionally, the top 20
proteins co-expressed with STMN1 were selected for in-depth
investigation. Enrichment analysis was conducted on these proteins
to clarify the potential mechanisms underlying the role of STMN1 in
lung cancer. Prior to this analysis, Pearson correlation analysis
was used to filter STMN1-associated genes based on the
criteria of a correlation coefficient >0.3 and P<0.05.
Subsequently, over-representation analysis (ORA) was performed by
leveraging datasets from Kyoto Encyclopedia of Genes and Genomes
(KEGG; genome.jp/kegg/), Reactome (reactome.org/), WikiPathways
(https://www.wikipathways.org/) and Gene
Ontology (GO; geneontology.org/Gene Ontology), with support from
the R packages including ‘clusterProfiler’ (version 4.10.0;
http://bioconductor.org/packages/clusterProfiler/),
‘org.Hs.eg.db’ (version 3.18.0; http://bioconductor.org/packages/org.Hs.eg.db/) and
‘ReactomePA’ (version 1.46.0; http://bioconductor.org/packages/ReactomePA/).
Cell lines and culture conditions
The RP1 cell line is a well-characterized
immortalized lung cancer cell line established by immortalizing the
primary lung cells isolated from
RbL/L/Trp53L/L (Rb1 and Trp53 conditional
double knockout) mice. Specifically, the cell line was derived from
spontaneous lung cancer tumors induced by intranasal inhalation of
adenovirus-mediated Cre recombinase in these knockout mice, which
triggers specific deletion of Rb1 and Trp53 genes in lung tissues.
Primary tumor cells were subsequently isolated from the induced
lung cancer lesions and immortalized to generate the RP1 cell line,
which has been verified to maintain stable proliferation and
malignant phenotypes over continuous passages in vitro. This
cell line was generously donated by the research group of Professor
Hongbin Ji (Center for Excellence in Molecular Cell Science,
Chinese Academy of Sciences, Shanghai, China) (33). The human lung cancer cell line
DMS114, human lung sarcomatoid carcinoma cell line H196 and 293T
cell line were purchased from The Cell Bank of Type Culture
Collection of The Chinese Academy of Sciences. DMS114 and H196 were
cultured in RPMI-1640 medium (Gibco; Thermo Fisher Scientific,
Inc.) supplemented with 10% fetal bovine serum (FBS; Gibco; Thermo
Fisher Scientific, Inc.), 100 IU/ml penicillin and 100 µg/ml
streptomycin. 293T cells were cultured in Dulbecco's Modified Eagle
Medium (Gibco; Thermo Fisher Scientific, Inc.) supplemented with
10% FBS, 100 IU/ml penicillin, and 100 µg/ml streptomycin. All of
the cells were maintained in a humidified incubator at 37°C with 5%
CO2 and were passaged every 2–3 days once they reached
80–90% confluence.
The cell lines were authenticated by short tandem
repeat (STR) profiling, and were confirmed to match reference STR
profiles in the American Type Culture Collection (atcc.org/), DSMZ
(dsmz.de/), Japanese Collection of Research Bioresources
(cellbank.nibio.go.jp/) and ExPASY/Cellosaurus databases
(cellosaurus.org/), verifying their identity and ruling out
cross-contamination.
Construction of stable cell lines
Briefly, 293T cells were seeded in 10-cm culture
dishes at a density of 5×10⁶ cells/dish 24 h prior to
transfection, ensuring cells reached 70–80% confluence. All
lentiviral vectors (pLKO.1, pCDH/hygro, psPAX2, pMD2.G) were
obtained from Addgene, Inc. Lentiviral packaging was performed
using a third-generation packaging system.
For knockdown, short hairpin RNA (shRNA) sequences
were inserted into the pLKO.1 lentiviral vector, and an empty
vector was used as a negative control. Lentiviral packaging and
infection were performed identically for both knockdown and
overexpression constructs. For transfection, a total of 6 µg
plasmid DNA was used at a ratio of lentiviral vector: psPAX2:
pMD2.G=2:1:1. Transfection was performed using polyethylenimine
(cat. no. 40820ES, Yeasen Biotech Co., Ltd.) at 37°C in a 5% CO2
incubator for 6 h. Lentiviral supernatants were collected at 48 h
post-transfection and filtered through a 0.45 µm filter. RP1,
DMS114 and H196 cells were infected with lentivirus at a
multiplicity of infection of 10 for 24 h. The culture medium was
replaced with fresh complete medium. Cells were cultured at 37°C in
a 5% CO2 incubator for an additional 48 h before antibiotic
selection. Stable knockdown cell lines were established by
selection with 1 µg/ml puromycin for 2 weeks, and maintained in
medium containing 0.5 µg/ml puromycin thereafter. The shRNA
sequences are listed in Table
I.
 | Table I.shRNA sequences. |
Table I.
shRNA sequences.
| shRNA | Targeting portion,
5′→3′ |
|---|
| shNC |
CCTAAGGTTAAGTCGCCCTCG |
| Mouse |
|
|
STMN1-sh1 |
GCAGAAGAAAGACGCAAGTCT |
|
STMN1-sh2 |
AGAAGGACAAGCACGTGGAAG |
| Human |
|
|
STMN1-sh1 |
CTGGAGGAAATTCAGAAGAAA |
|
STMN1-sh2 |
GAGCACGAGAAAGAAGTGCTT |
For overexpression, the human STMN1 gene was
amplified using PCR and then ligated with the digested pCDH/hygro
lentiviral vector to construct a recombinant plasmid
(STMN1-OE). For the negative control, an empty pCDH/hygro
vector without the STMN1 insert was used to infect cells in
parallel. The successful construction of the recombinant plasmid
was then verified through transformation, single colony screening
and Sanger sequencing. Subsequently, the recombinant plasmid was
co-transfected with packaging plasmids into 293T cells for viral
packaging, followed by the collection of lentivirus-containing
supernatant. Ultimately, DMS114 and H196 cells were infected with
the viral supernatant. Stable STMN1 overexpression cell lines were
established by selection with 200 µg/ml hygromycin B for 10–14
days, and maintained in complete medium supplemented with 100 µg/ml
hygromycin B.
Western blotting
Total proteins were isolated from cultured lung
cancer cells (DMS114, H196, RP1) and mouse subcutaneous tumor
tissue using radioimmunoprecipitation assay (RIPA) lysis buffer
(supplemented with protease and phosphatase inhibitors). Histones
were extracted employing the 0.2 mol/l H2SO4
method: Cell pellets were resuspended in histone extraction buffer
[10 mmol/l HEPES (pH 7.9), 1.5 mmol/l MgCl2, 10 mmol/l
KCl, 0.5 mmol/l DTT] and incubated on ice for 30 min. 5 mol/l
H2SO4 to achieve a final concentration of 0.2
mol/l, and the mixture was incubated at 4°C overnight. Following
centrifugation at 13,700 × g at 4°C for 10 min, 100%
trichloroacetic acid was added to the supernatant to achieve a
final concentration of 20%, followed by precipitation at 4°C for 2
h. The precipitate was collected and washed three times with cold
acetone, lyophilized under vacuum and dissolved in histone lysis
buffer [20 mmol/l Tris-HCl (pH 7.5), 7 mol/l urea, 2 mol/l
thiourea, 4% CHAPS]. A total of 20 µg of total protein or 1 µg of
histone protein were loaded per lane and separated by 12% SDS-PAGE
gels. The proteins were then transferred to PVDF membranes, which
were blocked with 5% skimmed milk for 60 min at room temperature to
minimize non-specific antibody adsorption. For immunodetection, the
blocked membranes were incubated with primary antibodies at 4°C for
16 h, followed by incubation with HRP-linked secondary antibodies
for 1 h at room temperature. The protein bands were visualized
using the Pierce ECL Western blotting Substrate (Thermo Fisher
Scientific, Inc.), and the band optical density was analyzed using
ImageJ software (version 1.53t; National Institutes of Health). The
primary antibodies used in the present study were as follows:
Anti-STMN1 (1:1,000; cat. no. TB2777;), anti-Bcl-2 (1:1,000; cat.
no. T40056), anti-Vimentin (1:1,000; cat. no. T55134), anti-GAPDH
(1:10,000; cat. no. P60037) (all from Abmart Pharmaceutical
Technology Co., Ltd.), global histone lysine lactylation (Pan Kla)
(1:1,000; cat. no. 1401), histone H3 lysine 18 lactylation
(H3K18la) (1:1,000; cat. no. 1427RM) (both from PTM BIO LLC) and
Histone H3 (1:1,000; cat. no. 17168-1-AP; Proteintech Group, Inc.).
HRP-linked secondary antibodies used were horseradish
peroxidase-conjugated goat anti-rabbit IgG (1:5,000; cat. no.
SA00001-2; Proteintech Group, Inc.) and horseradish
peroxidase-conjugated goat anti-mouse IgG (1:5,000; cat. no.
SA00001-1; Proteintech Group, Inc.).
Co-immunoprecipitation (co-IP)
For IP, 500 µg total protein (200 µl of cell lysate)
extracted from human lung cancer DMS114 and H196 was diluted to 500
µl with IP lysis buffer [20 mmol/l Tris-HCl (pH 7.5), 150 mmol/l
NaCl, 1% Nonidet P-40 (NP-40), 1 mmol/l EDTA, supplemented with
protease and phosphatase inhibitors]. The protein solution was
pre-cleared with 20 µl protein A/G agarose beads (Santa Cruz
Biotechnology, Inc.) at 4°C for 1 h to reduce non-specific binding.
After centrifugation at 118,000 × g at 4°C for 10 min, the
supernatant was incubated with 2 µg anti-STMN1 antibody (cat. no.
TB2777; Abmart Pharmaceutical Technology Co., Ltd.) or 2 µg normal
IgG (cat. no. 30000-0-AP; Proteintech Group, Inc.) as a negative
control at 4°C overnight with gentle rotation. Subsequently, 30 µl
protein A/G agarose beads were added and incubated for another 4 h
at 4°C. The beads were washed four times with IP wash buffer [20
mmol/l Tris-HCl (pH 7.5), 300 mmol/l NaCl, 1% NP-40, 1 mmol/l
EDTA]. After a final centrifugation at 78,400 × g at 4°C for 3 min,
immune complexes were eluted by boiling with 2X SDS loading buffer
for 10 min. The eluted proteins were then subjected to SDS-PAGE and
western blotting as aforementioned.
Cell viability and colony formation
assays
Cell viability was evaluated using the Cell Counting
Kit-8 (CCK-8; cat. no. B34302; Selleck Chemicals). Briefly, DMS114
and H196 cells were seeded onto 96-well culture plates at a density
of ~3,000 cells/well. After adhering to the plate, the cells were
subjected to the required treatment: Continuous culture for an
additional 48 h in a standard 37°C, 5% CO2 incubator
under normal growth conditions. The CCK-8 reagent was then added
according to the manufacturer's instructions at 37°C with 5% CO2
for 2 h. To assess cell viability, the absorbance value was
measured at 450 nm wavelength using a microplate reader.
For the colony formation assay, DMS114 and H196
cells were seeded onto 6-well plates at a density of ~500
cells/well and maintained in culture for 14 days to allow colony
formation. After 14 days, the cells were then washed with
phosphate-buffered saline (PBS) to eliminate leftover medium. They
were subsequently fixed in 4% paraformaldehyde (PFA) at room
temperature for 15 min and stained with 0.1% crystal violet
solution at room temperature for 20 min to make colonies visible.
The cells were then re-rinsed with PBS to eliminate excess stain
and finally air-dried at room temperature for subsequent colony
counting and analysis. Colonies were defined as cell clusters
containing >50 cells, and counting was performed using ImageJ
software (version 1.53t; National Institutes of Health) in a
blinded manner.
Wound-healing assay
DMS114 and H196 cells with stable
STMN1-knockdown (STMN1-sh) or overexpression
(STMN1-OE) were seeded onto 6-well plates. Subsequently, 2
ml culture medium (supplemented with 10% FBS) was added to each
well, and the cells were cultured for 24 h to allow adherence and
initial growth. Upon reaching 95–100% cell confluence, vertical
scratches were made on the confluent cell monolayer using a sterile
200-µl pipette tip. The scratched cells and cell debris were gently
rinsed off with PBS to ensure a clear scratch area. The plates were
then refreshed with 2 ml serum-free media to minimize the
interference of cell proliferation, and the cells were incubated
for another 24 h. Cell migration was monitored by capturing images
of the scratch areas at 0, 12 and 24 h under a light microscope (×4
magnification). For each experimental group, three random fields
were imaged to ensure data reproducibility. The migration rate was
calculated using the following formula: Migration rate
(%)=[(Scratch width at 0 h-Scratch width at each time
point)/Scratch width at 0 h] ×100.
Flow cytometric analysis
DMS114 and H196 cells were collected by
centrifugation at 300 × g at 4°C for 5 min, after which, the
supernatant was discarded and the pellet was washed with 1 ml PBS.
The cells were then centrifuged again at 300 × g at 4°C for 5 min
and the supernatant was discarded. The cell pellet was resuspended
in 300 µl Stain Buffer (cat. no. 420201; Biolegend, Inc.), and
PI-PE (cat. no. HY-D0815; MedChemExpress) and Annexin V-FITC (cat.
no. 640949; Biolegend, Inc.) were added, at 4°C in the dark for 15
min. Cell apoptosis was detected using a FACSCalibur flow cytometer
(BD Biosciences). Data were analyzed using FlowJo software (version
10.8.1, BD Biosciences). Early apoptosis and late apoptosis were
combined, and the total apoptosis rate was calculated using the
following formula: Total apoptosis rate (%)=early apoptotic cells
(%) + late apoptotic cells (%).
Transwell migration and invasion cell
assays
Cell migration and invasion were evaluated using the
Transwell assays (0.4-µm pore-size inserts in 12-well plates). For
the cell migration assay, ~3×10⁴ DMS114 or H196 cells
were suspended in 200 µl serum-free medium. This cell suspension
was seeded into the upper chambers of Transwell inserts, whereas
600 µl medium supplemented with 10% FBS was added to the lower
chambers as a chemoattractant. After incubating the cells at 37°C
for 48 h, the non-migrated cells were removed from the upper
surface of the inserts using cotton swabs. The migrated cells
adhering to the lower surface were fixed in 4% PFA for 20 min and
then stained with 0.1% crystal violet for 20 min at room
temperature, followed by rinsing with PBS. Images of the cells were
captured under a light microscope at ×10 magnification across three
random fields, followed by cell counting.
For the cell invasion assay, the insert chambers
were pre-coated with 50 µl Matrigel (diluted to 1:8 in ice-cold
serum-free culture medium) at 37°C for 60 min to construct a matrix
barrier layer. The subsequent protocol was identical to that
described for the migration assay.
Subcutaneous tumor model
6-8-week-old male C57BL/6 mice (weight, 18~22 g)
were purchased from the Laboratory Animal Center of Huazhong
University of Science and Technology (Wuhan, China). A total of 15
mice were included All mice were housed at a temperature of 22±2°C,
with a relative humidity of 50–60%, a 12 h light/12 h dark cycle,
and free access to standard chow and water. In order to establish
subcutaneous tumors, the stably transduced RP1 cells (transduced
with NC, STMN1-sh1 and STMN1-sh2) were respectively
inoculated into the right axilla (~1×10⁶ cells in 100 µl
PBS/mouse, n=5/group). Tumor dimensions were recorded every 4 days
for a total of 24 days. Tumor volume was calculated using the
following formula: Tumor volume=1/2 × length × width2.
Humane endpoints were set as follows: i) tumor volume exceeding
2,000 mm3; ii) >20% body weight loss; iii) severe
signs of distress or impaired mobility. No mice met these endpoints
On day 24, the mice were euthanized by cervical dislocation. Death
was confirmed by two indicators: i) Complete cessation of thoracic
movement and breathing for ≥1 min; and ii) absence of hindlimb
withdrawal reflex when gently pinched with forceps. After
confirming death, the tumor tissues were dissected, weighed and
processed: Tissues were fixed in 4% PFA) at room temperature for 24
h, followed by paraffin embedding and sectioning at a thickness of
4 µm. Some tissue were lysed with RIPA lysis buffer (supplemented
with protease and phosphatase inhibitors) for protein extraction
and western blotting.
Hematoxylin and eosin (H&E)
staining
The paraffin-embedded sections of subcutaneous tumor
tissues were prepared. After gradient deparaffinization with xylene
and rehydration with ethanol at room temperature, the sections were
stained with hematoxylin for 10 sec at room temperature.
Subsequently, the tissue sections were differentiated in 1%
hydrochloric acid-ethanol at room temperature for 20 sec, blued in
0.5% ammonia water for 2 min and counterstained with eosin for 3
min at room temperature. The tissue sections were then dehydrated
with gradient ethanol, cleared with xylene and mounted using
neutral balsam at room temperature. Images were captured using a
light microscope (Olympus BX53, Olympus Corporation).
Immunofluorescence staining
The paraffin-embedded subcutaneous tumor tissue
sections were deparaffinized with xylene, rehydrated with a graded
series of ethanol and subjected to antigen retrieval using citrate
buffer (pH 6.0) at 95°C for 15 min. The sections were then
permeabilized with 0.2% Triton X-100 at room temperature for 10 min
and blocked with 5% bovine serum albumin (BSA, cat. no. A1933,
Sigma-Aldrich; Merck KGaA) at room temperature for 1 h.
Subsequently, the sections were incubated with a primary antibody
against Vimentin (cat. no. T55134; Abmart Pharmaceutical Technology
Co., Ltd.) at a dilution of 1:200 at 4°C overnight, followed by
incubation with Cy3-conjugated goat anti-rabbit IgG (cat. no.
GB21303; Wuhan Servicebio Technology Co., Ltd.) at a dilution of
1:400 for 1 h at room temperature. The cell nuclei were
counterstained with DAPI at room temperature for 5 min. Images of
the cells were captured under a fluorescence microscope, and the
mean fluorescence intensity was analyzed and semi-quantified using
ImageJ software (version 1.53t; National Institutes of Health).
Immunohistochemistry
The paraffin-embedded subcutaneous tumor tissue
sections were deparaffinized with xylene, rehydrated with a graded
series of ethanol. Antigen retrieval was performed using citrate
buffer (pH 6.0) under high-pressure at 121°C for 15 min to restore
antigen epitopes. To eliminate endogenous peroxidase interference,
the prepared sections were incubated with 3% hydrogen peroxide
(H2O2) at room temperature for 10 min, and to
block the non-specific antibody binding, they were treated with 5%
BSA at room temperature for 60 min. The sections were then
incubated with primary antibodies, including anti-Ki67 (cat. no.
TW0001; Abmart Pharmaceutical Technology Co., Ltd.), anti-Caspase-3
(cat. no. 19677-1-AP; Proteintech Group, Inc.) and
anti-Cleaved-Caspase-3 (C-Caspase-3; cat. no. AF7022; Affinity
Biosciences) overnight at 4°C. The next day, the sections were
incubated with HRP-conjugated secondary antibodies (cat. no.
SA00001-2; Proteintech Group, Inc.) at room temperature for 1 h.
DAB chromogen (cat. no. DA1010; Beijing Solarbio Science &
Technology Co., Ltd.) was used for visualization of protein
expression with subsequent counterstaining with hematoxylin at room
temperature for 10 sec. Under an optical microscope, three random
high-power fields (×40 magnification) were assessed for each
section. Positive cells were semi-quantified using Image-Pro Plus
6.0 software (Media Cybernetics, Inc.). The percentage of positive
cells was calculated using the following formula: Positive cells
(%)=[(Number of positive cells in each field/Total number of cells
in each field)] ×100, to assess protein expression levels.
Integrated optical density (IOD) of positive staining was
quantified using Image-Pro Plus 6.0 software (Media Cybernetics,
Inc.). IOD represents the total optical density of positively
stained areas, reflecting the overall expression level of the
target protein. For C-Caspase-3, the IOD value was normalized to
the IOD of total Caspase-3 to indicate the level of apoptotic
activation.
TUNEL staining
Paraffin-embedded tumor tissue sections were
deparaffinized in xylene and rehydrated through a graded ethanol
series. Following antigen retrieval using proteinase K (20 µg/ml)
for 20 min at 37°C, the sections were incubated with the TUNEL
reaction mixture at 37°C for 60 min in the dark, according to the
manufacturer's instructions (cat. no. C1088; Beyotime
Biotechnology). Subsequently, the sections were mounted with an
anti-fade mounting medium containing DAPI to visualize cell nuclei.
Images were captured using a fluorescence microscope equipped with
appropriate filter sets for FITC and DAPI detection (Olympus BX53,
Olympus Corporation, Tokyo, Japan). To ensure representative
quantification, at least 3 randomly selected non-overlapping fields
of view per section were observed. The apoptotic index was
calculated as the ratio of TUNEL-positive cells (green
fluorescence) to the total number of cells (blue fluorescence).
Cell lactate concentration
measurement
Cellular lactate concentrations were measured using
Lactate Colorimetric Assay Kit (cat. no. K607-100, BioVision, Inc.,
according to the manufacturer's instructions. DMS114 and H196 cells
with stable STMN1 knockdown or overexpression were seeded in
6-well plates at a density of 1×10⁶ cells/well and cultured for 48
h. After washing twice with ice-cold PBS, cells were lysed in
lactate assay buffer and centrifuged at 12,000 × g for 10 min at
4°C to remove cell debris. The supernatant was collected and
incubated with the lactate detection reagent mix at 37°C for 30 min
in the dark. The absorbance was measured at 570 nm using a
microplate reader, and lactate concentrations were calculated based
on a standard curve generated with known lactate
concentrations.
Statistical analysis
Pearson correlation coefficient was used to assess
linear associations between STMN1 expression and continuous
variables with approximately normal distributions, such as the
expression levels of co-expressed genes. Spearman's rank
correlation coefficient was applied to evaluate non-linear or
non-normally distributed relationships, including those between
STMN1 expression and immune cell infiltration scores,
stromal/immune/ESTIMATE scores, tumor purity and genomic alteration
frequencies. ORA was utilized for functional enrichment
assessments. For the in vitro and in vivo
experimental data, the results are presented as the mean ± standard
deviation. Comparisons between two groups were performed using
unpaired Student's t-test, whereas those among multiple groups were
performed using one-way analysis of variance (ANOVA). When ANOVA
results were significant, Bonferroni's multiple comparisons test
was used for post-hoc analysis, comparing each experimental group
with the control group. All in vitro experiments were
performed with three biological replicates. P<0.05 was
considered to indicate a statistically significant difference. For
MR analyses, additional multiple testing corrections were performed
using the FDR and Bonferroni methods, with FDR-corrected P<0.05
regarded as statistically significant.
Results
MR analysis of lactylation-associated
genes and lung cancer
From the eQTL data of 46 lactylation-related genes,
the IVs meeting strict quality control criteria for MR analysis
were identified: 63 SNPs for the platelet-type phosphofructokinase
(PFKP) gene (F-statistic=315.6), 8 SNPs for the SWI/SNF
related, matrix associated, actin dependent regulator of chromatin,
subfamily a, member 4 (SMARCA4) gene (F-statistic=92.7) and
7 SNPs for the STMN1 gene (F-statistic=109.9). All of the
IVs satisfied the strong instrument threshold (F>10). Following
allele harmonization, no strand-ambiguous SNPs or SNPs with
conflicting effect directions were detected. The detailed
information on the finally included IVs is provided in Table II.
| Table II.Basic information of instrumental
variables selected from core lactylation-related genes. |
Table II.
Basic information of instrumental
variables selected from core lactylation-related genes.
| Gene | No. of SNPs | P-value | Average
F-statistic |
|---|
| PFKP | 63 |
1.00×10−200−7.14×10−138 | 315.6 |
| SMARCA4 | 8 |
2.04×10−82−8.55×10⁻¹³ | 92.7 |
| STMN1 | 7 |
7.51×10−77−1.63×10⁻¹⁰ | 109.9 |
To investigate the causal relationships between
these three core lactylation-related genes and lung cancer, MR
analyses were conducted using multiple statistical approaches,
including IVW, MR Egger, weighted median, simple mode and weighted
mode. Among these methods, IVW served as the main model for causal
inference ('I), and the detailed quantitative results of all five
MR analytical methods for each gene are summarized in Table III. IVW analysis revealed that
PFKP (OR=0.909, 95% CI: 0.845–0.979) and SMARCA4
(OR=0.633, 95% CI: 0.409–0.979) were associated with a lower risk
of lung cancer, whereas STMN1 (OR=1.741, 95% CI:
1.182–2.564) was associated with an elevated risk.
| Table III.Results of MR analyses for core
lactylation-related genes and small-cell lung cancer risk. |
Table III.
Results of MR analyses for core
lactylation-related genes and small-cell lung cancer risk.
| A, PFKP |
|---|
|
|---|
| Analysis | No. of SNPs | β | SE | P-value | OR (95%CI) |
|---|
| MR Egger | 63 | −0.135 | 0.067 | 0.048 | 0.874
(0.766–0.996) |
| Weighted
median | 63 | −0.071 | 0.057 | 0.209 | 0.931
(0.833–1.041) |
| IVW | 63 | −0.095 | 0.038 | 0.012 | 0.909
(0.845–0.979) |
| Simple mode | 63 | −0.110 | 0.083 | 0.191 | 0.896
(0.761–1.055) |
| Weighted mode | 63 | −0.087 | 0.061 | 0.159 | 0.916
(0.813–1.033) |
|
| B,
SMARCA4 |
|
|
Analysis | No. of
SNPs | β | SE | P-value | OR
(95%CI) |
|
| MR Egger | 8 | −0.518 | 0.551 | 0.384 | 0.596
(0.202–1.754) |
| Weighted
median | 8 | −0.514 | 0.265 | 0.053 | 0.598
(0.355–1.006) |
| IVW | 8 | −0.458 | 0.223 | 0.040 | 0.633
(0.409–0.979) |
| Simple mode | 8 | −0.711 | 0.442 | 0.152 | 0.491
(0.207–1.169) |
| Weighted mode | 8 | −0.551 | 0.288 | 0.098 | 0.576
(0.328–1.014) |
|
| C,
STMN1 |
|
|
Analysis | No. of
SNPs | β | SE | P-value | OR
(95%CI) |
|
| MR Egger | 7 | 0.414 | 0.453 | 0.402 | 1.513
(0.623–3.674) |
| Weighted
median | 7 | 0.419 | 0.242 | 0.084 | 1.520
(0.946–2.442) |
| IVW | 7 | 0.555 | 0.198 | 0.005 | 1.741
(1.182–2.564) |
| Simple mode | 7 | 0.782 | 0.370 | 0.079 | 2.185
(1.058–4.514) |
| Weighted mode | 7 | 0.321 | 0.301 | 0.328 | 1.379
(0.764–2.489) |
Scatter diagrams were drawn to illustrate the
detailed MR analyses results. The calculation of individual causal
impacts demonstrated that increased SNP-mediated effects on
STMN1 expression were associated with elevated lung cancer
risk (Fig. 1A). Conversely,
enhanced SNP effects on PFKP and SMARCA4 expression
were linked to more pronounced protective effects against lung
cancer (Fig. 1B and C). The
effects of SNPs corresponding to each of the three core exposure
factors (STMN1, PFKP and SMARCA4) on lung cancer risk
were assessed by generating forest plots. Examining the effects of
SNPs linked to each of the three key genes revealed consistent
patterns across all analytical frameworks (Fig. 1D-F).
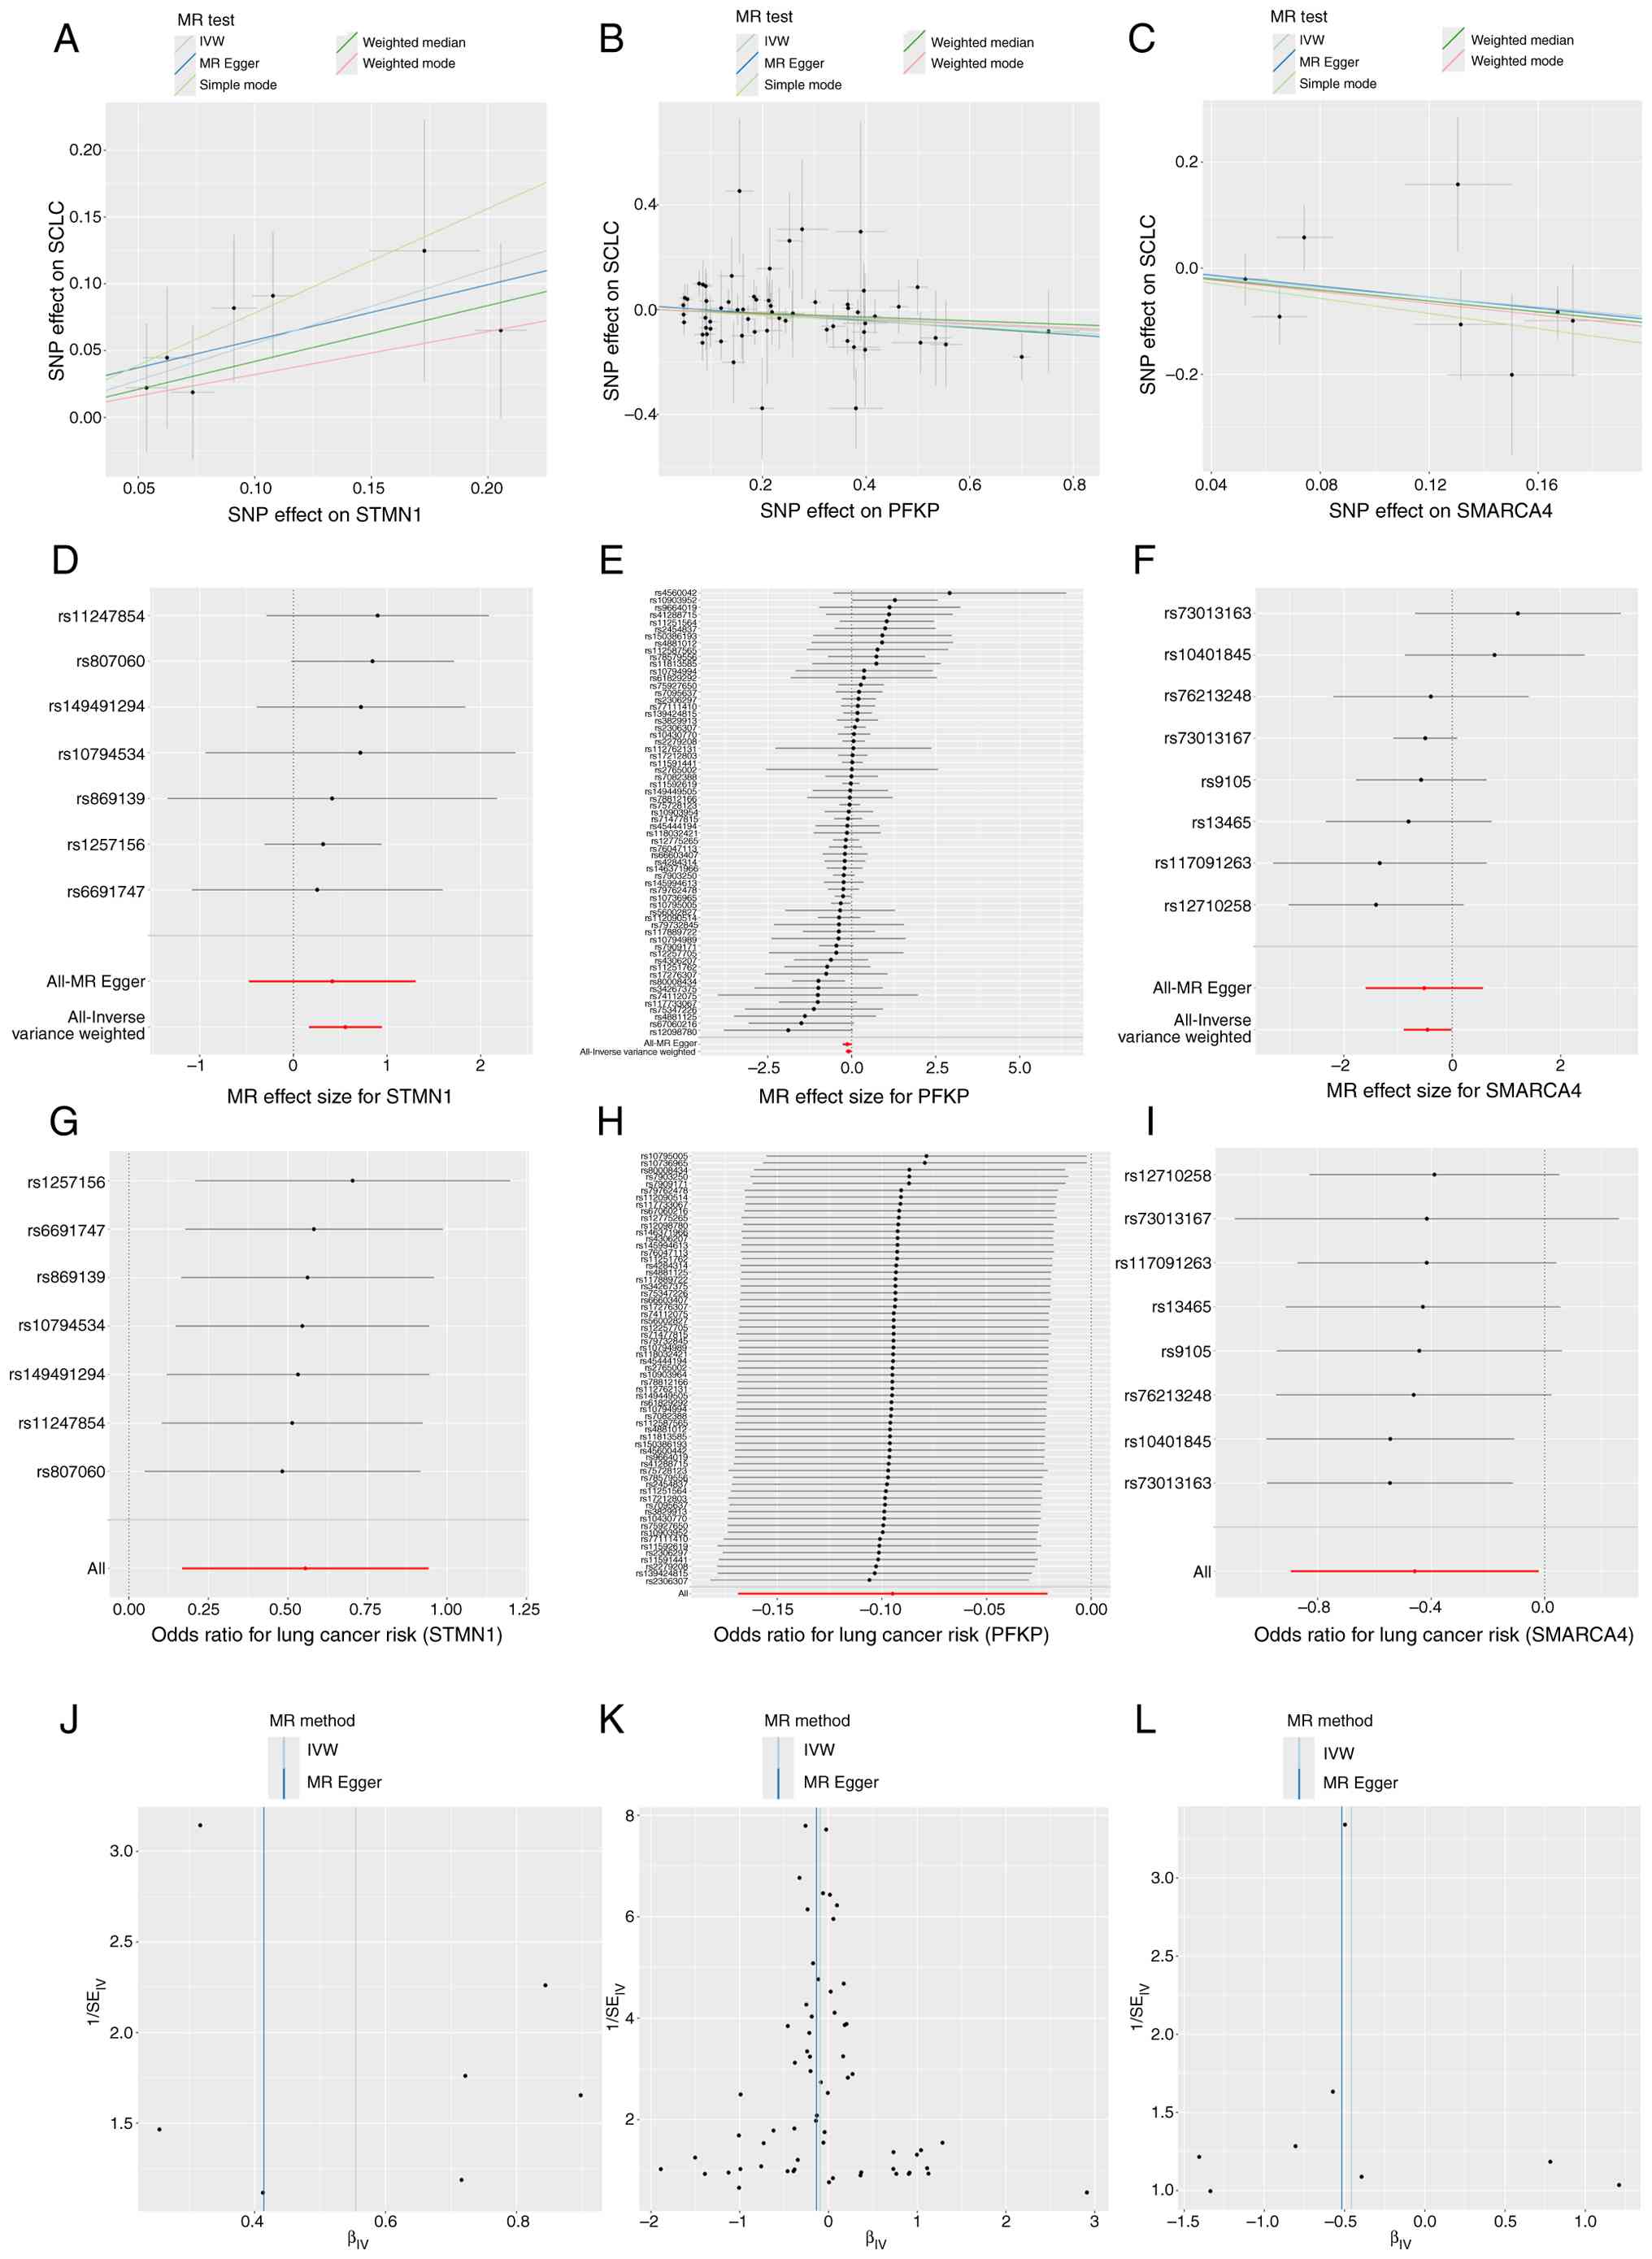 | Figure 1.MR analysis and pleiotropy,
heterogeneity and sensitivity analyses of lactylation-related genes
and lung cancer. (A) Impact of SNPs on STMN1, (B)
PFKP and (C) SMARCA4 expression and lung cancer risk.
(D) Effect sizes of SNPs related to STMN1 on lung cancer
risk. (E) Forest plot showing the effect sizes of SNPs related to
PFKP and (F) SMARCA4 on lung cancer risk. (G)
Leave-one-out sensitivity analysis plot for STMN1. (H)
Leave-one-out sensitivity analysis plot for PFKP. (I)
Leave-one-out sensitivity analysis plot for SMARCA4. (J)
Funnel plot for assessing publication bias and outliers related to
STMN1, (K) PFKP. (L) Funnel plot for assessing
publication bias and outliers related to SMARCA4. CI,
confidence interval; IVW, inverse variance weighting; MR, Mendelian
randomization; OR, odds ratio; PFKP, platelet-type
phosphofructokinase; SE, standard error; SMARCA4, SWI/SNF
related, matrix associated, actin dependent regulator of chromatin,
subfamily a, member 4; SNPs, single nucleotide polymorphisms;
STMN1, Stathmin 1. |
Multiple testing correction
results
A total of three genes with valid MR results
underwent multiple testing correction. STMN1 was the only
gene significantly associated with lung cancer risk in both
correction methods. PFKP and SMARCA4 were only
significant after FDR correction, but not after Bonferroni
correction (Table IV).
| Table IV.Multiple testing correction
summary. |
Table IV.
Multiple testing correction
summary.
| Gene | P-value | P-FDR | P-bonferroni |
Significance-FDR |
Significance-bonferroni |
|---|
| PFKP | 0.0118 | 0.0178 | 0.0355 | TRUE | FALSE |
| SMARCA4 | 0.0397 | 0.0397 | 0.1190 | TRUE | FALSE |
| STMN1 | 0.0050 | 0.0150 | 0.0150 | TRUE | TRUE |
Sensitivity, pleiotropy and
heterogeneity evaluations for MR outcomes
To enhance the reliability of the MR analyses
findings, the IVs underwent rigorous screening standards, and all
the samples were confined to a European ancestry cohort to reduce
the risk of false-negative results and population stratification
bias. The heterogeneity across SNPs linked to the three exposure
factors (STMN1, PFKP and SMARCA4) was evaluated using
Cochran's Q test and the MR Egger approach. The results showed no
notable heterogeneity among the SNPs corresponding to the three
genes, thus verifying the stability of the selected IVs (Table V).
| Table V.Heterogeneity and pleiotropy tests
for core lactylation-related genes. |
Table V.
Heterogeneity and pleiotropy tests
for core lactylation-related genes.
|
| Heterogeneity test
(IVW method) | Pleiotropy test (MR
Egger intercept) |
|---|
|
|
|
|
|---|
| Gene | Q value | df | P-value | Intercept | SE | P-value |
|---|
| PFKP | 59.83 | 62 | 0.554 | 0.012 | 0.017 | 0.471 |
| SMARCA4 | 7.49 | 7 | 0.380 | 0.007 | 0.062 | 0.908 |
| STMN1 | 1.65 | 6 | 0.949 | 0.016 | 0.048 | 0.744 |
Moreover, the MR Egger intercept test was conducted
to detect the occurrence of horizontal pleiotropy. The respective
intercept values were 0.012, 0.007 and 0.016 for PFKP,
SMARCA4 and STMN1 genes, respectively, with no
statistical significance. This result indicated that MR estimates
were not biased by directional pleiotropy. The MR-PRESSO test did
not identify any outliers (Table
V).
A leave-one-out sensitivity assessment was
additionally performed to evaluate the impact of individual SNPs on
the overall IVW estimate. Excluding a single SNP had a minimal
effect on the overall causal estimate (Fig. 1G-I). In addition, funnel plots were
symmetric (Fig. 1J-L), indicating
no significant publication bias or outlier interference. This
observation confirmed that no individual SNP exerted a
disproportionate influence on the outcomes, thus enhancing the
credibility and stability of the MR results.
Among the three core lactylation-related genes
identified by MR analysis, STMN1 was the only gene that
exhibited a significant causal association with increased lung
cancer risk after both FDR and Bonferroni corrections, and its
upregulation in lung cancer tissues was correlated with poor
patient prognosis.
Expression, survival and functional
enrichment analyses of STMN1
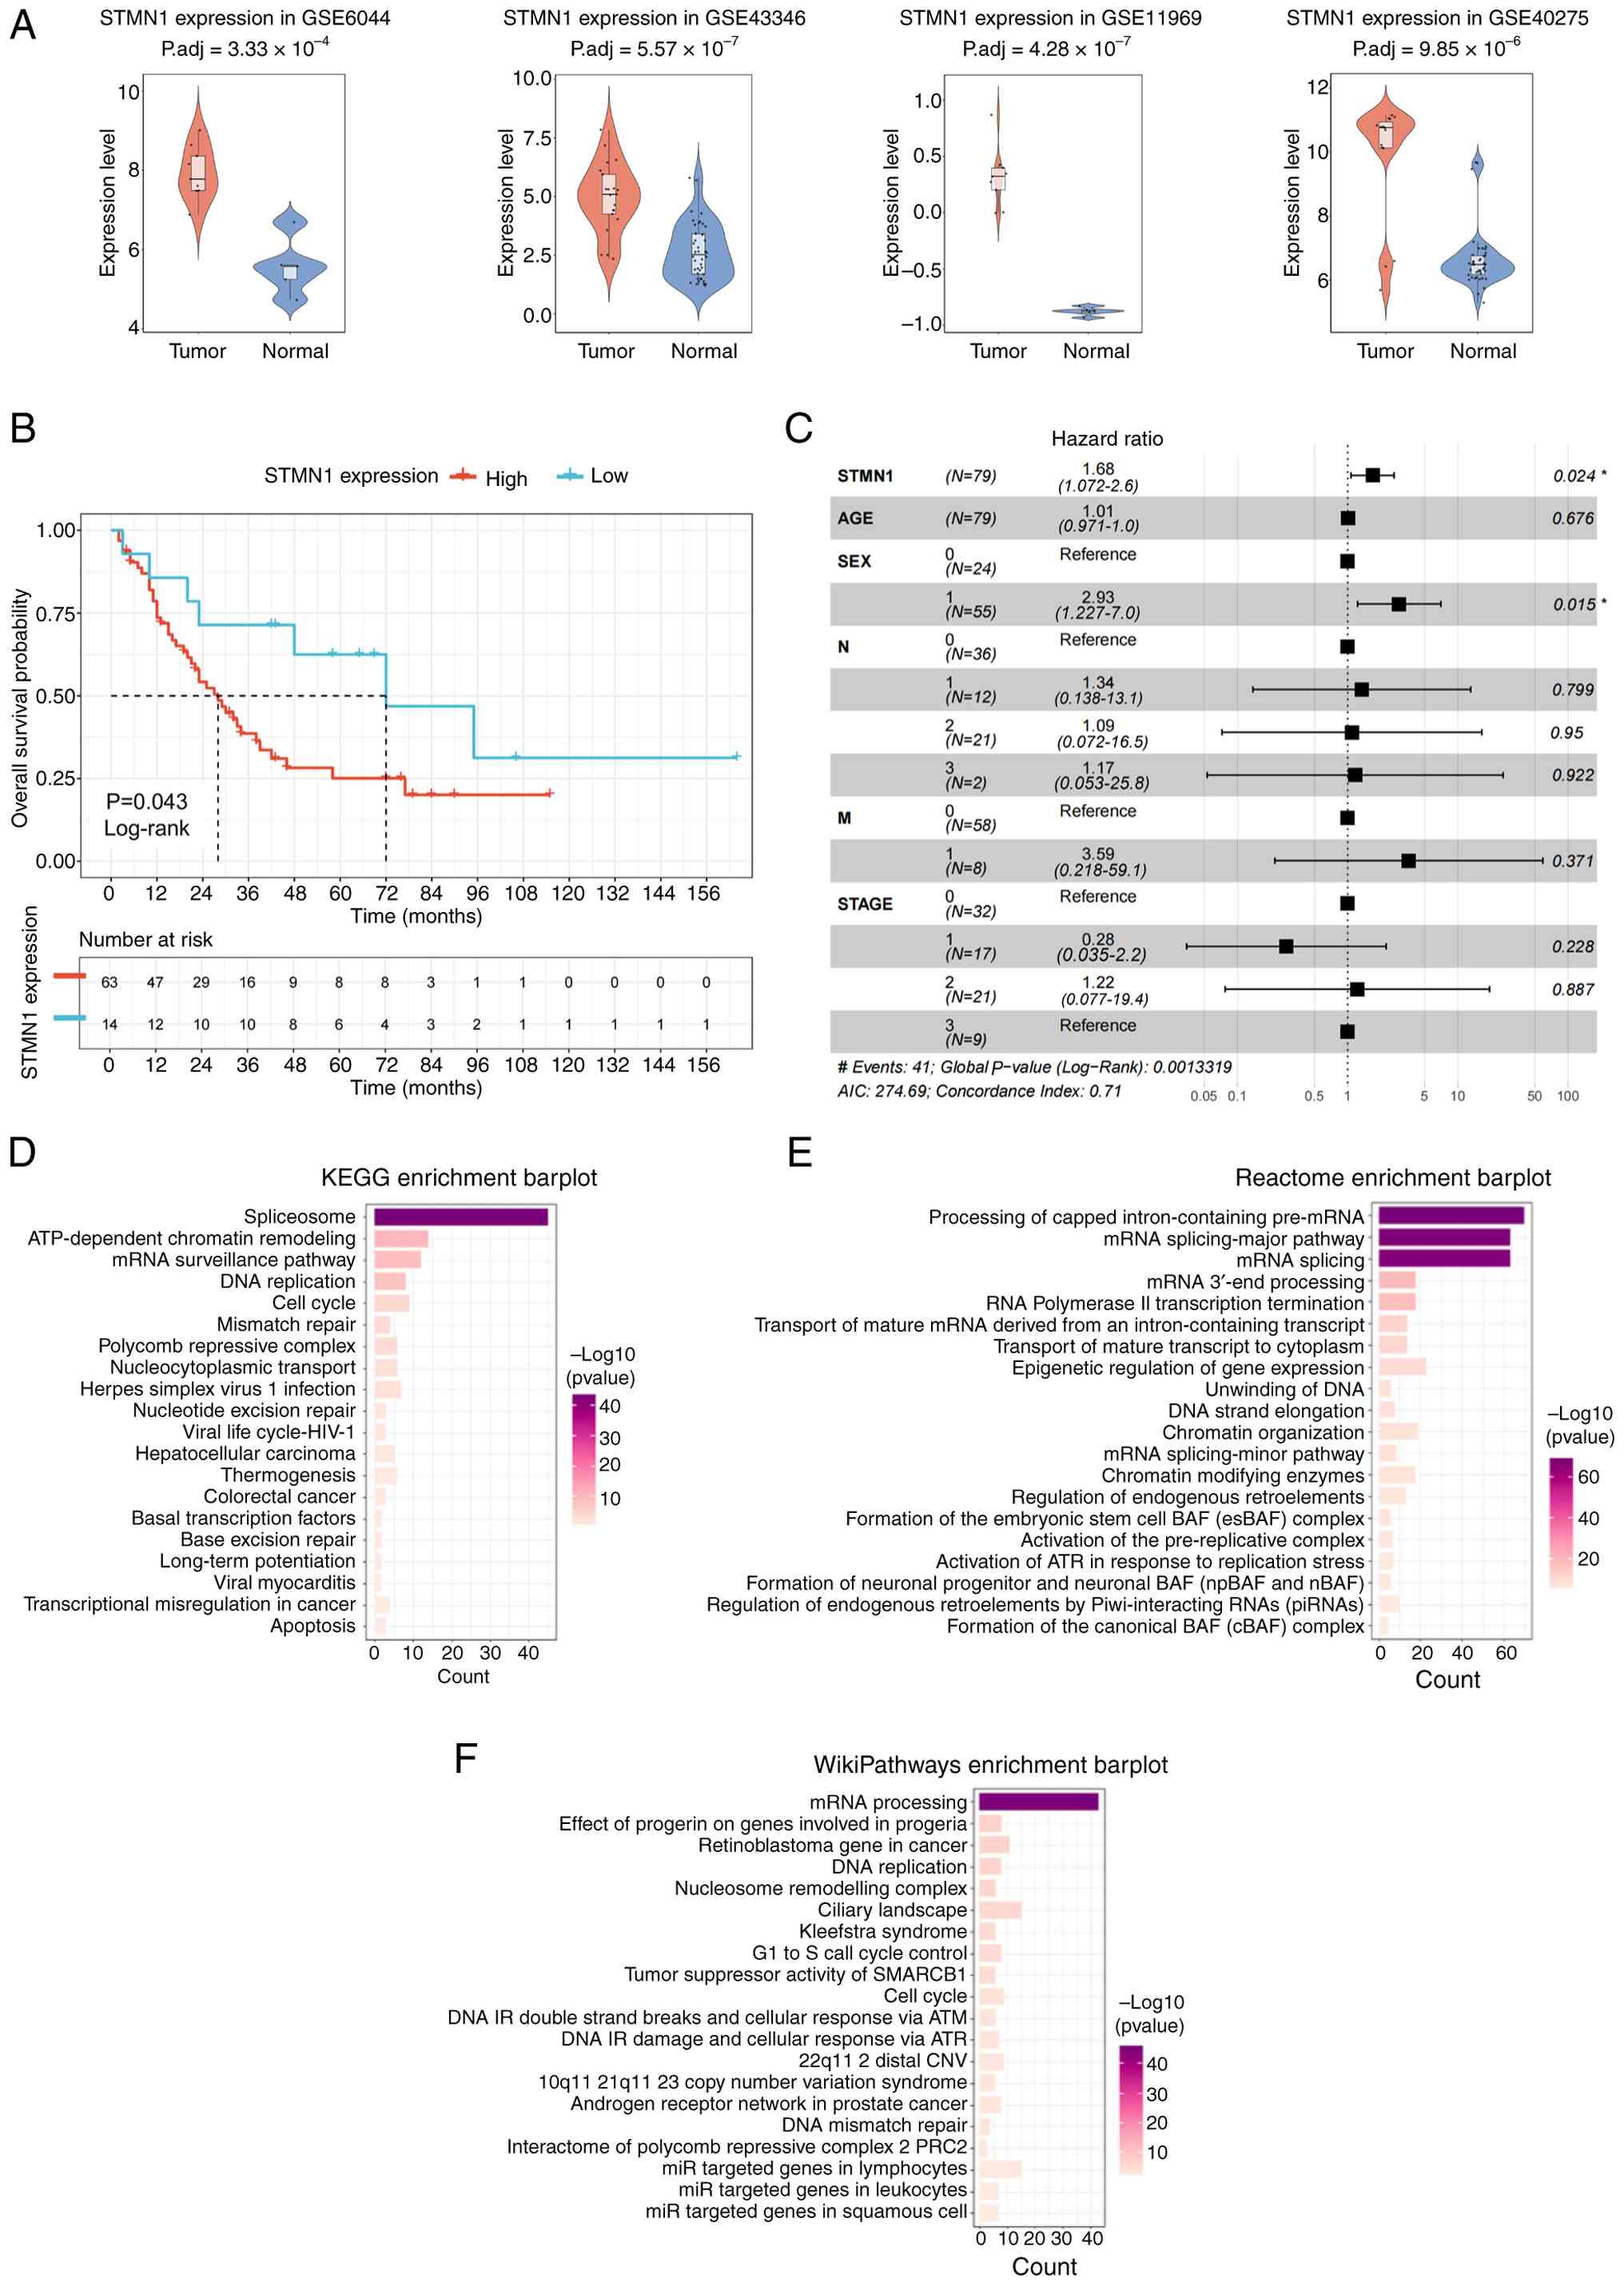
Expression analyses of the GEO datasets (GSE6044,
GSE43346, GSE11969 and GSE40275) revealed that STMN1 was
significantly upregulated in lung cancer tissues compared with in
normal tissues (Fig. 2A).
Furthermore, the patients exhibiting high STMN1 expression
had a shorter OS time (Fig. 2B),
and high STMN1 expression was associated with a higher risk
of poor prognosis (Fig. 2C).
Functional enrichment analyses were performed to
investigate the biological roles of STMN1. KEGG pathway enrichment
analysis (Fig. 2D) demonstrated
significant enrichment in pathways, including ‘spliceosome’ and
‘ATP-dependent chromatin remodeling’. Reactome enrichment analysis
(Fig. 2E) highlighted its
enrichment in processes, including ‘processing of capped
intron-containing pre-mRNA’, ‘mRNA splicing major pathway’ and
‘mRNA splicing’. WikiPathways enrichment analysis (Fig. 2F) revealed its role in the ‘mRNA
processing’ pathway.
Immune correlations
Immune cell infiltration profiling revealed that the
infiltration scores of B lineage cells, CD4+ T cells, fibroblasts,
monocytic lineage cells and neutrophils were significantly lower in
the high STMN1 expression group as compared with those in
the low STMN1 expression group (Fig. 3A). The correlation analysis of
STMN1 expression and immune checkpoint molecules further
revealed an inverse association between STMN1 and most
immune checkpoint molecules (Fig.
3B), suggesting a potential role of STMN1 in modulating
checkpoint-mediated immune suppression. In order to validate the
association between STMN1 and key antitumor immune cells,
the infiltration abundances of CD4+ and CD8+ T cells and M1
macrophages were quantified using five independent algorithms
(CIBERSORT, MCPcounter, EPIC, quanTIseq and xCell). All of the
algorithms demonstrated a weak inverse correlation between
STMN1 expression and the infiltration of these three cell
types (Fig. 3C-E), highlighting
the association between STMN1 and reduced antitumor immune
cell infiltration. ESTIMATE algorithm-derived immune scores
combined with Spearman's rank correlation analysis confirmed that
high STMN1 expression was weakly negatively correlated with
the overall immune score (r=−0.276; Fig. 3F). These results indicated that
STMN1 high expression may be associated with the
characteristics of an immunosuppressive TME in lung cancer,
suggesting a potential role of STMN1 in regulating TME
immune status.
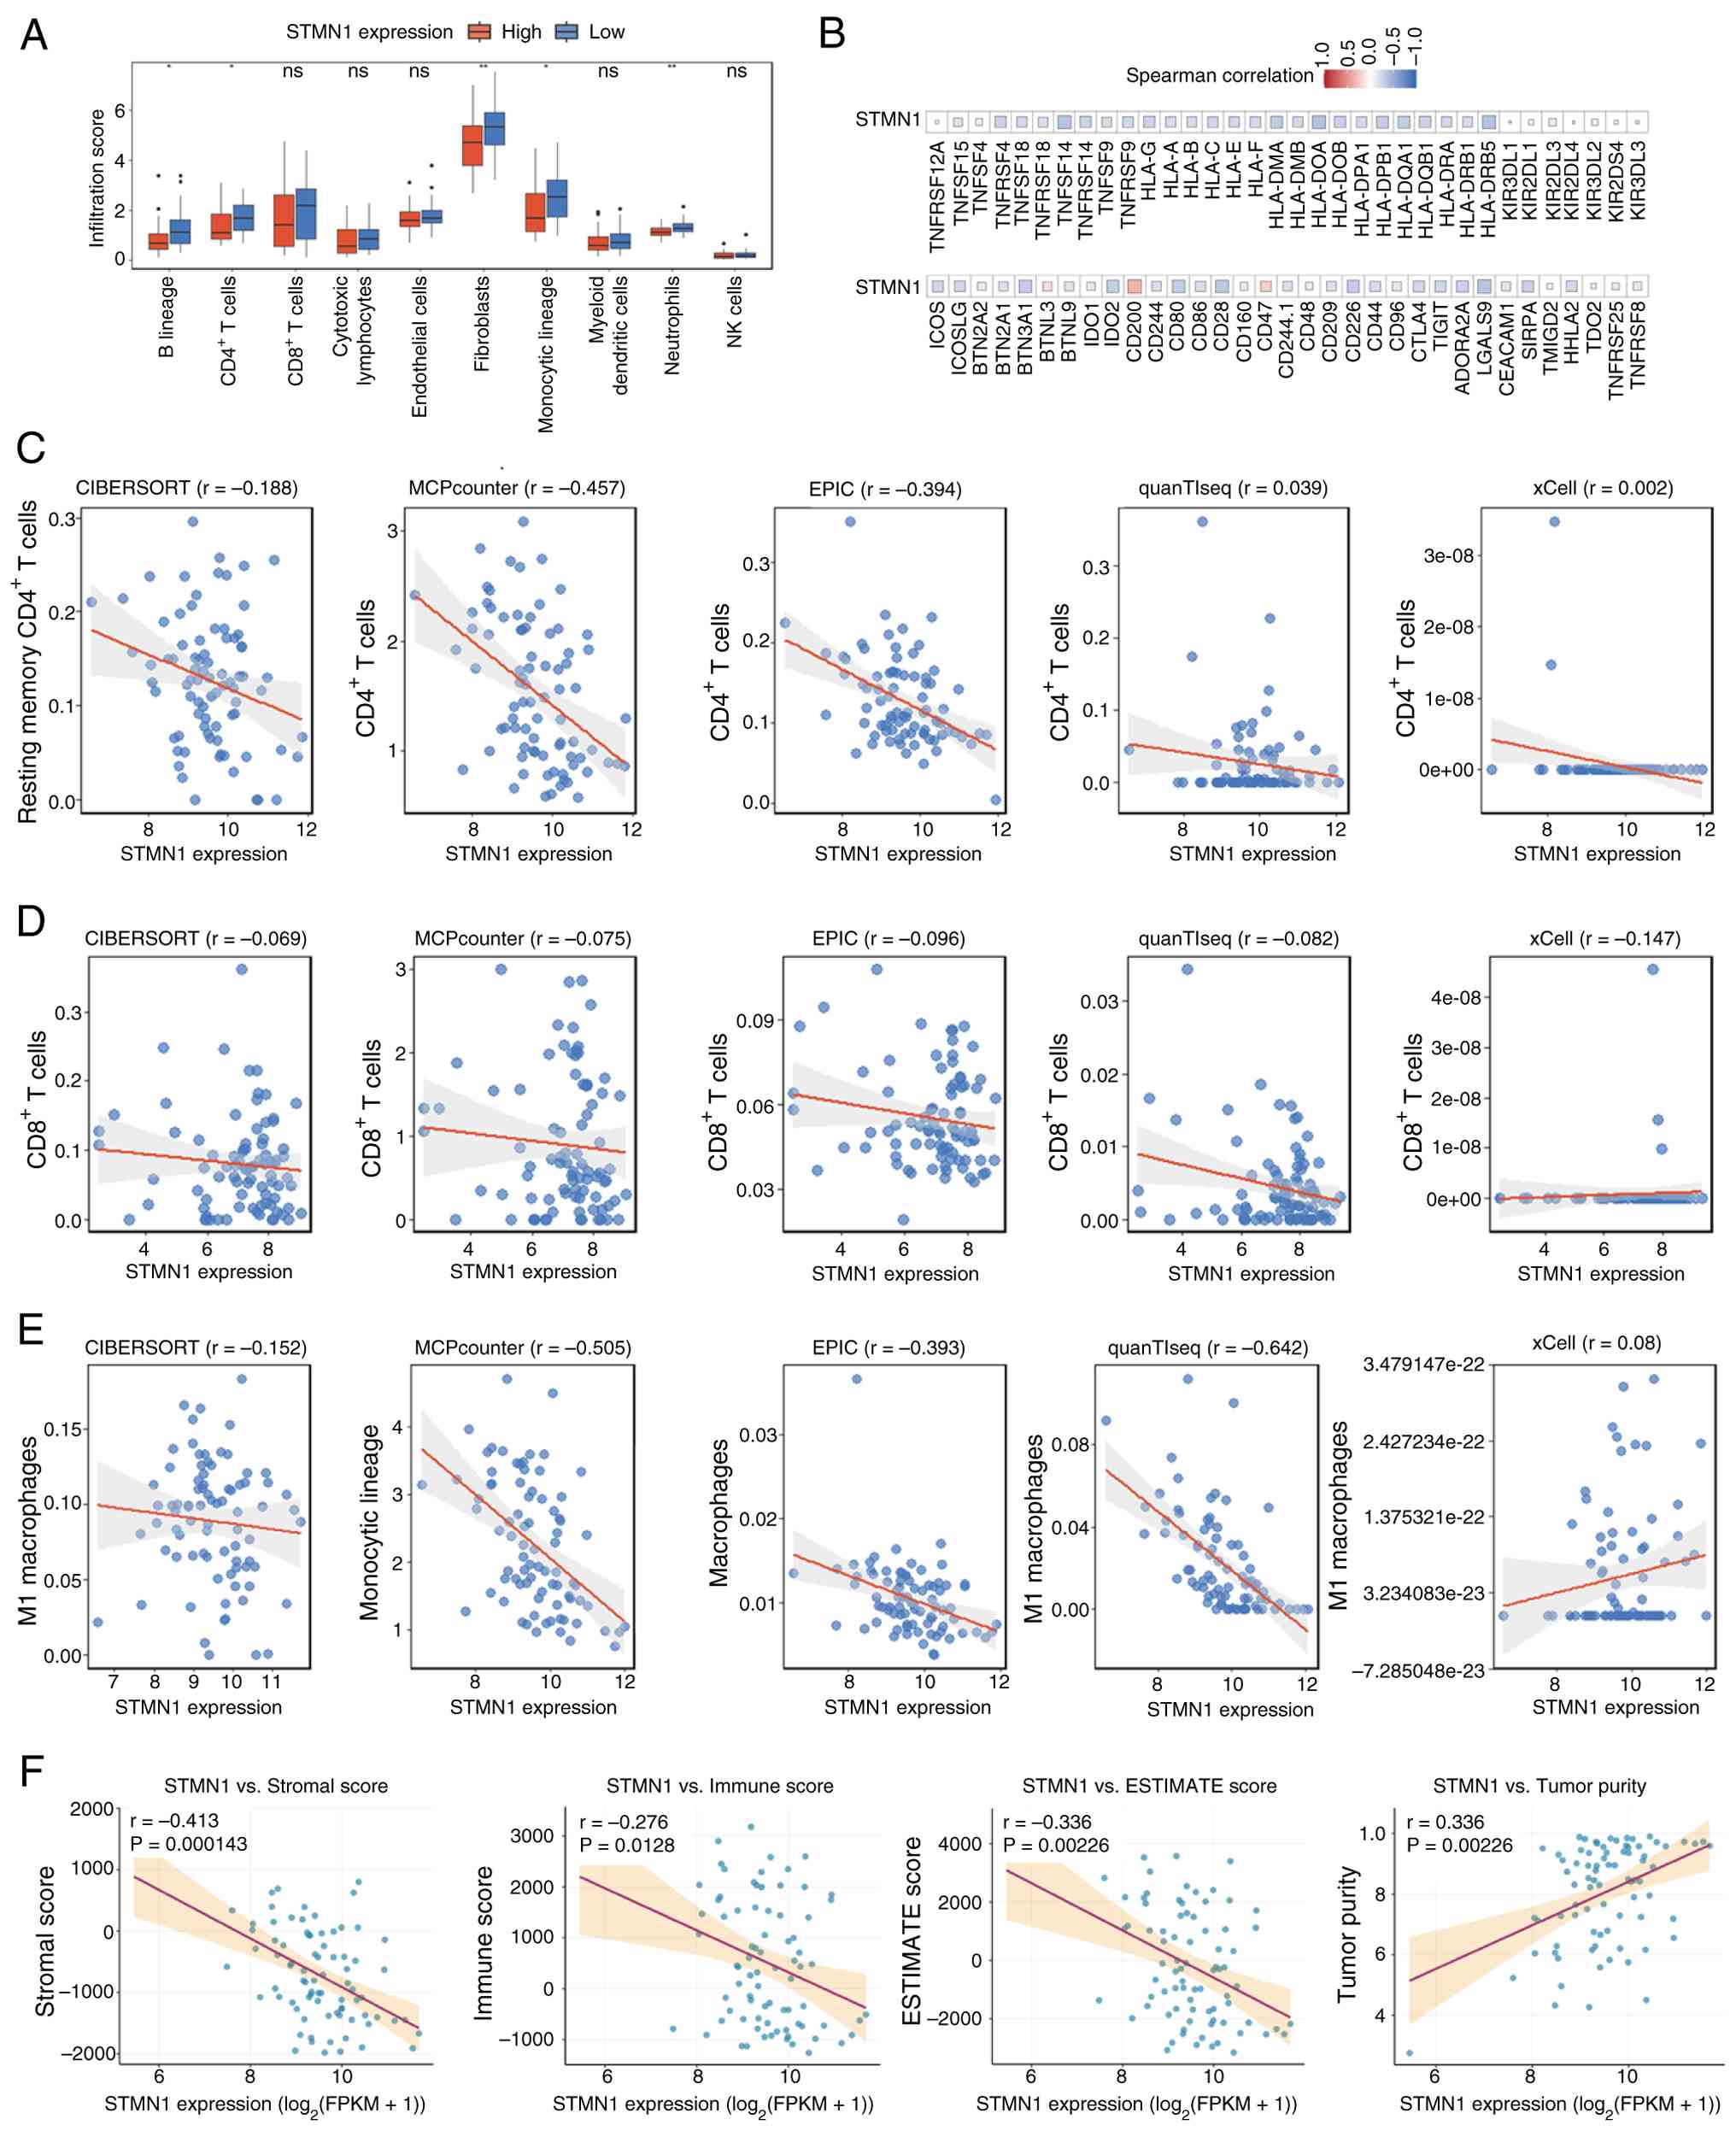 | Figure 3.Correlation between STMN1
expression and immune characteristics in lung cancer. (A) Bar plot
comparing immune cell infiltration scores (quantified using the
MCPcounter algorithm) between high and low STMN1 expression
groups. (B) Heatmap of Spearman correlation coefficients linking
STMN1 expression to immune checkpoint genes. The color
gradient (blue to red) indicates the strength of correlation
(negative to positive). (C) Association between STMN1
expression level and infiltration abundance of CD4+ T cells,
quantified using five algorithms (CIBERSORT, MCPcounter, EPIC,
quanTIseq and xCell). (D) Scatter diagram showing the association
between STMN1 expression level and infiltration abundance of
CD8+ T cells, quantified using five algorithms (CIBERSORT,
MCPcounter, EPIC, quanTIseq and xCell). (E) Scatter diagram showing
the association between STMN1 expression level and
infiltration abundance of M1 macrophages, quantified using five
algorithms (CIBERSORT, MCPcounter, EPIC, quanTIseq and xCell). (F)
Scatter diagrams of Spearman correlation between STMN1
expression and Stromal Score, Immune Score, ESTIMATE Score and
Tumor Purity (calculated using the ESTIMATE algorithm). Each plot
includes the r- and P-values. *P<0.05, **P<0.01. CIBERSORT,
Cell-type Identification By Estimating Relative Subsets of RNA
Transcripts; EPIC, Estimation of Proportions of Immune and Cancer
cells; MCPcounter, Microenvironment Cell Populations counter;
quanTIseq, Quantitative Transcriptomics for Immune cell
Quantification; STMN1, Stathmin 1. |
Genomic alteration analyses of
STMN1
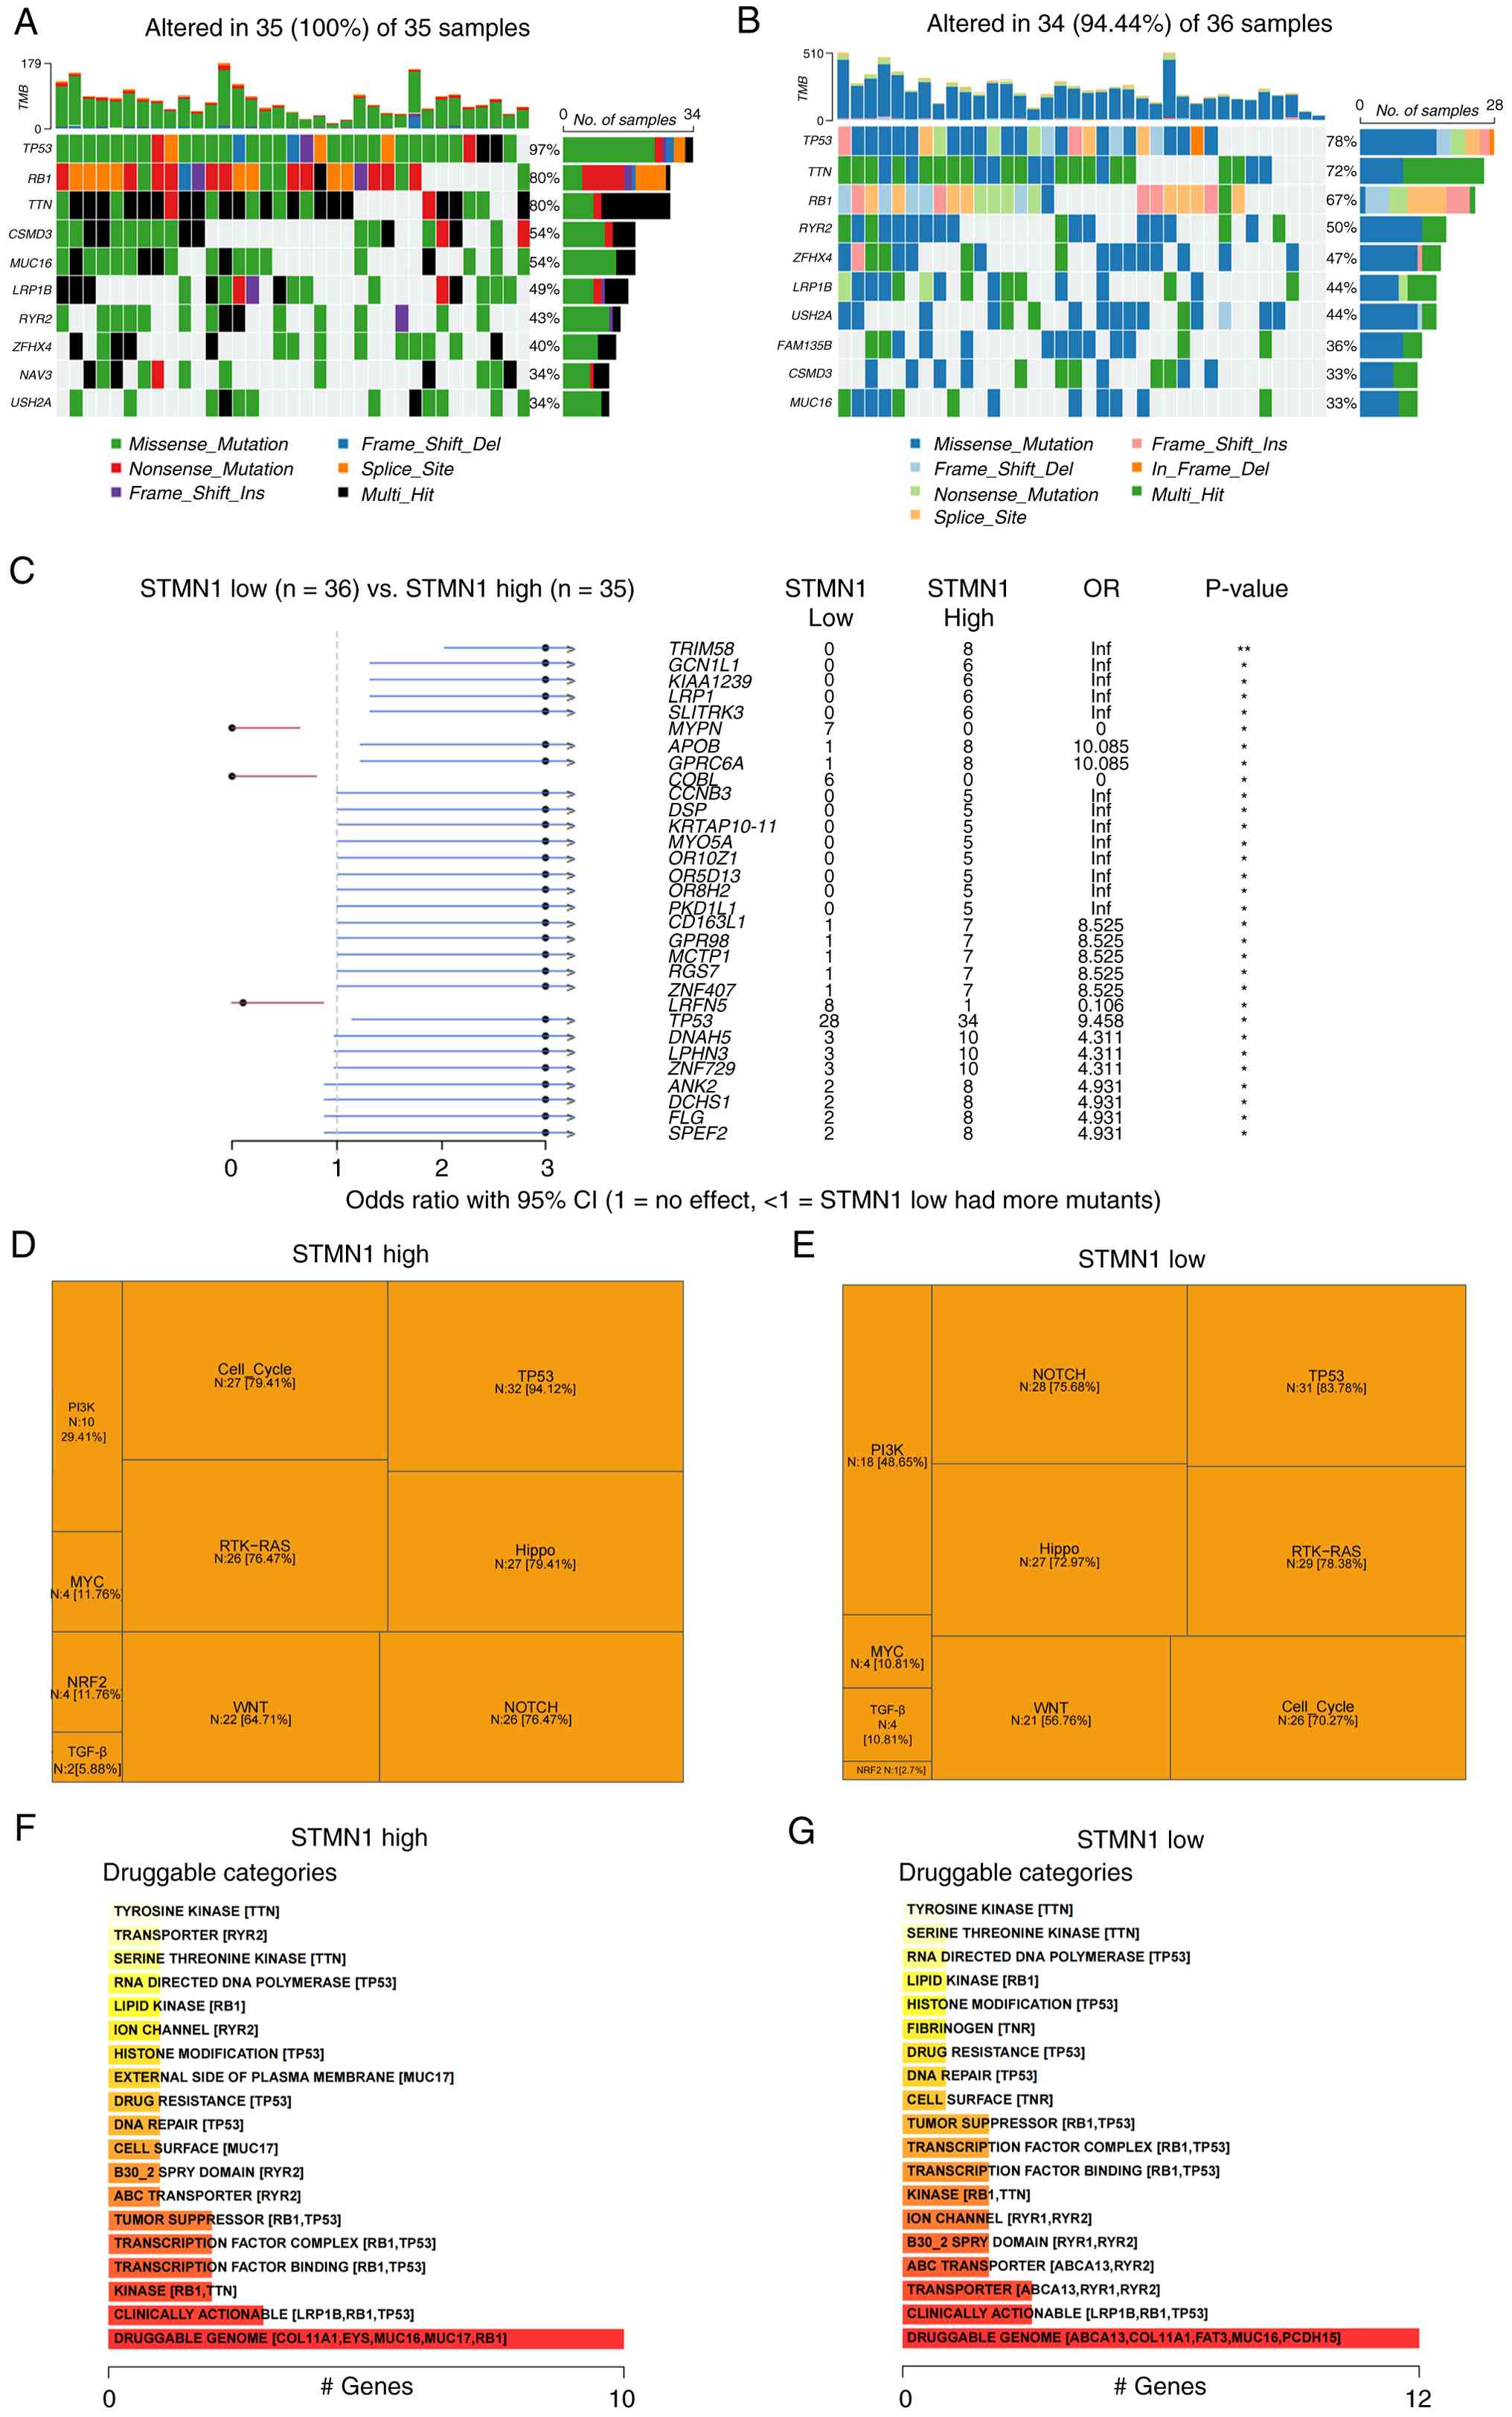
Waterfall plots visualized the genetic mutation
patterns of lung cancer samples across STMN1 expression
subgroups. In the high STMN1 expression group (Fig. 4A), all 35 lung cancer samples
(100%) harbored genetic mutations. Moreover, 34 of 36 samples
(94.44%) in the low STMN1 expression group (Fig. 4B) exhibited genetic alterations,
with mutation types comparable to those in the high STMN1
expression subgroup. OR analysis was performed to quantify the
association between STMN1 expression and gene mutation
status. Numerous genes, including TRIM58, GCN1L1, KIAA1239,
LRP1, SLITRK3, APOB, GPRC6A and TP53, showed an OR of
>1, indicating a higher mutation probability in the high
STMN1 expression group. On the other hand, genes such as
MYPN, COBL and LRFN5, had an OR of <1, suggesting
a lower mutation probability with high STMN1 expression
(Fig. 4C).
As compared with in the low STMN1 expression
group (Fig. 4E), the high
STMN1 expression group (Fig.
4D) was relatively highly enriched in the TP53 signaling
pathway (94.12% vs. 83.78%), Hippo signaling pathway (79.41% vs.
72.97%), cell cycle (79.41% vs. 70.27%) and WNT signaling pathway
(64.71% vs. 56.76%). By contrast, the enrichment levels of the
RTK-RAS (76.47% vs. 78.38%) and NOTCH (76.47% vs. 75.68%) signaling
pathways demonstrated no statistically significant difference
between the two groups. The druggable categories in the lung cancer
subgroups (high and low STMN1 expression groups) were
analyzed using the DGIdb. In the high STMN1 subgroup,
druggable categories included ‘serine threonine kinase’ (such as
TTN), ‘transporter’ (such as RYR2) and TP53-related histone
modification pathways, with ‘druggable genome’ involving
COL11A1 and RB1 (Fig.
4F). The druggable categories in the low STMN1
expression subgroup included ‘serine threonine kinase’ (such as
TTN), TP53-related RNA-directed DNA polymerases, ‘fibrinogen’ (TNR)
and ‘drug resistance’ (TP53), with ‘druggable genome’ involving
ABCA13 and COL11A1 (Fig.
4G). Despite the overlapping core elements, gene composition in
druggable categories was different, suggesting that STMN1
expression may shape druggable target landscapes in lung cancer and
guide subgroup-specific therapies.
Identification and functional analysis
of proteins associated with STMN1 expression
To identify the proteins associated with varying
STMN1 expression levels, the protein expression patterns
were visualized using volcano plots and heatmaps. These analyses
revealed 452 differentially expressed proteins, including 72
upregulated and 380 downregulated proteins (Fig. 5A and B). Next, a PPI network was
drawn, and Cytoscape software was used to select hub proteins from
the top 20 upregulated and top 20 downregulated proteins (Fig. 5C-F).
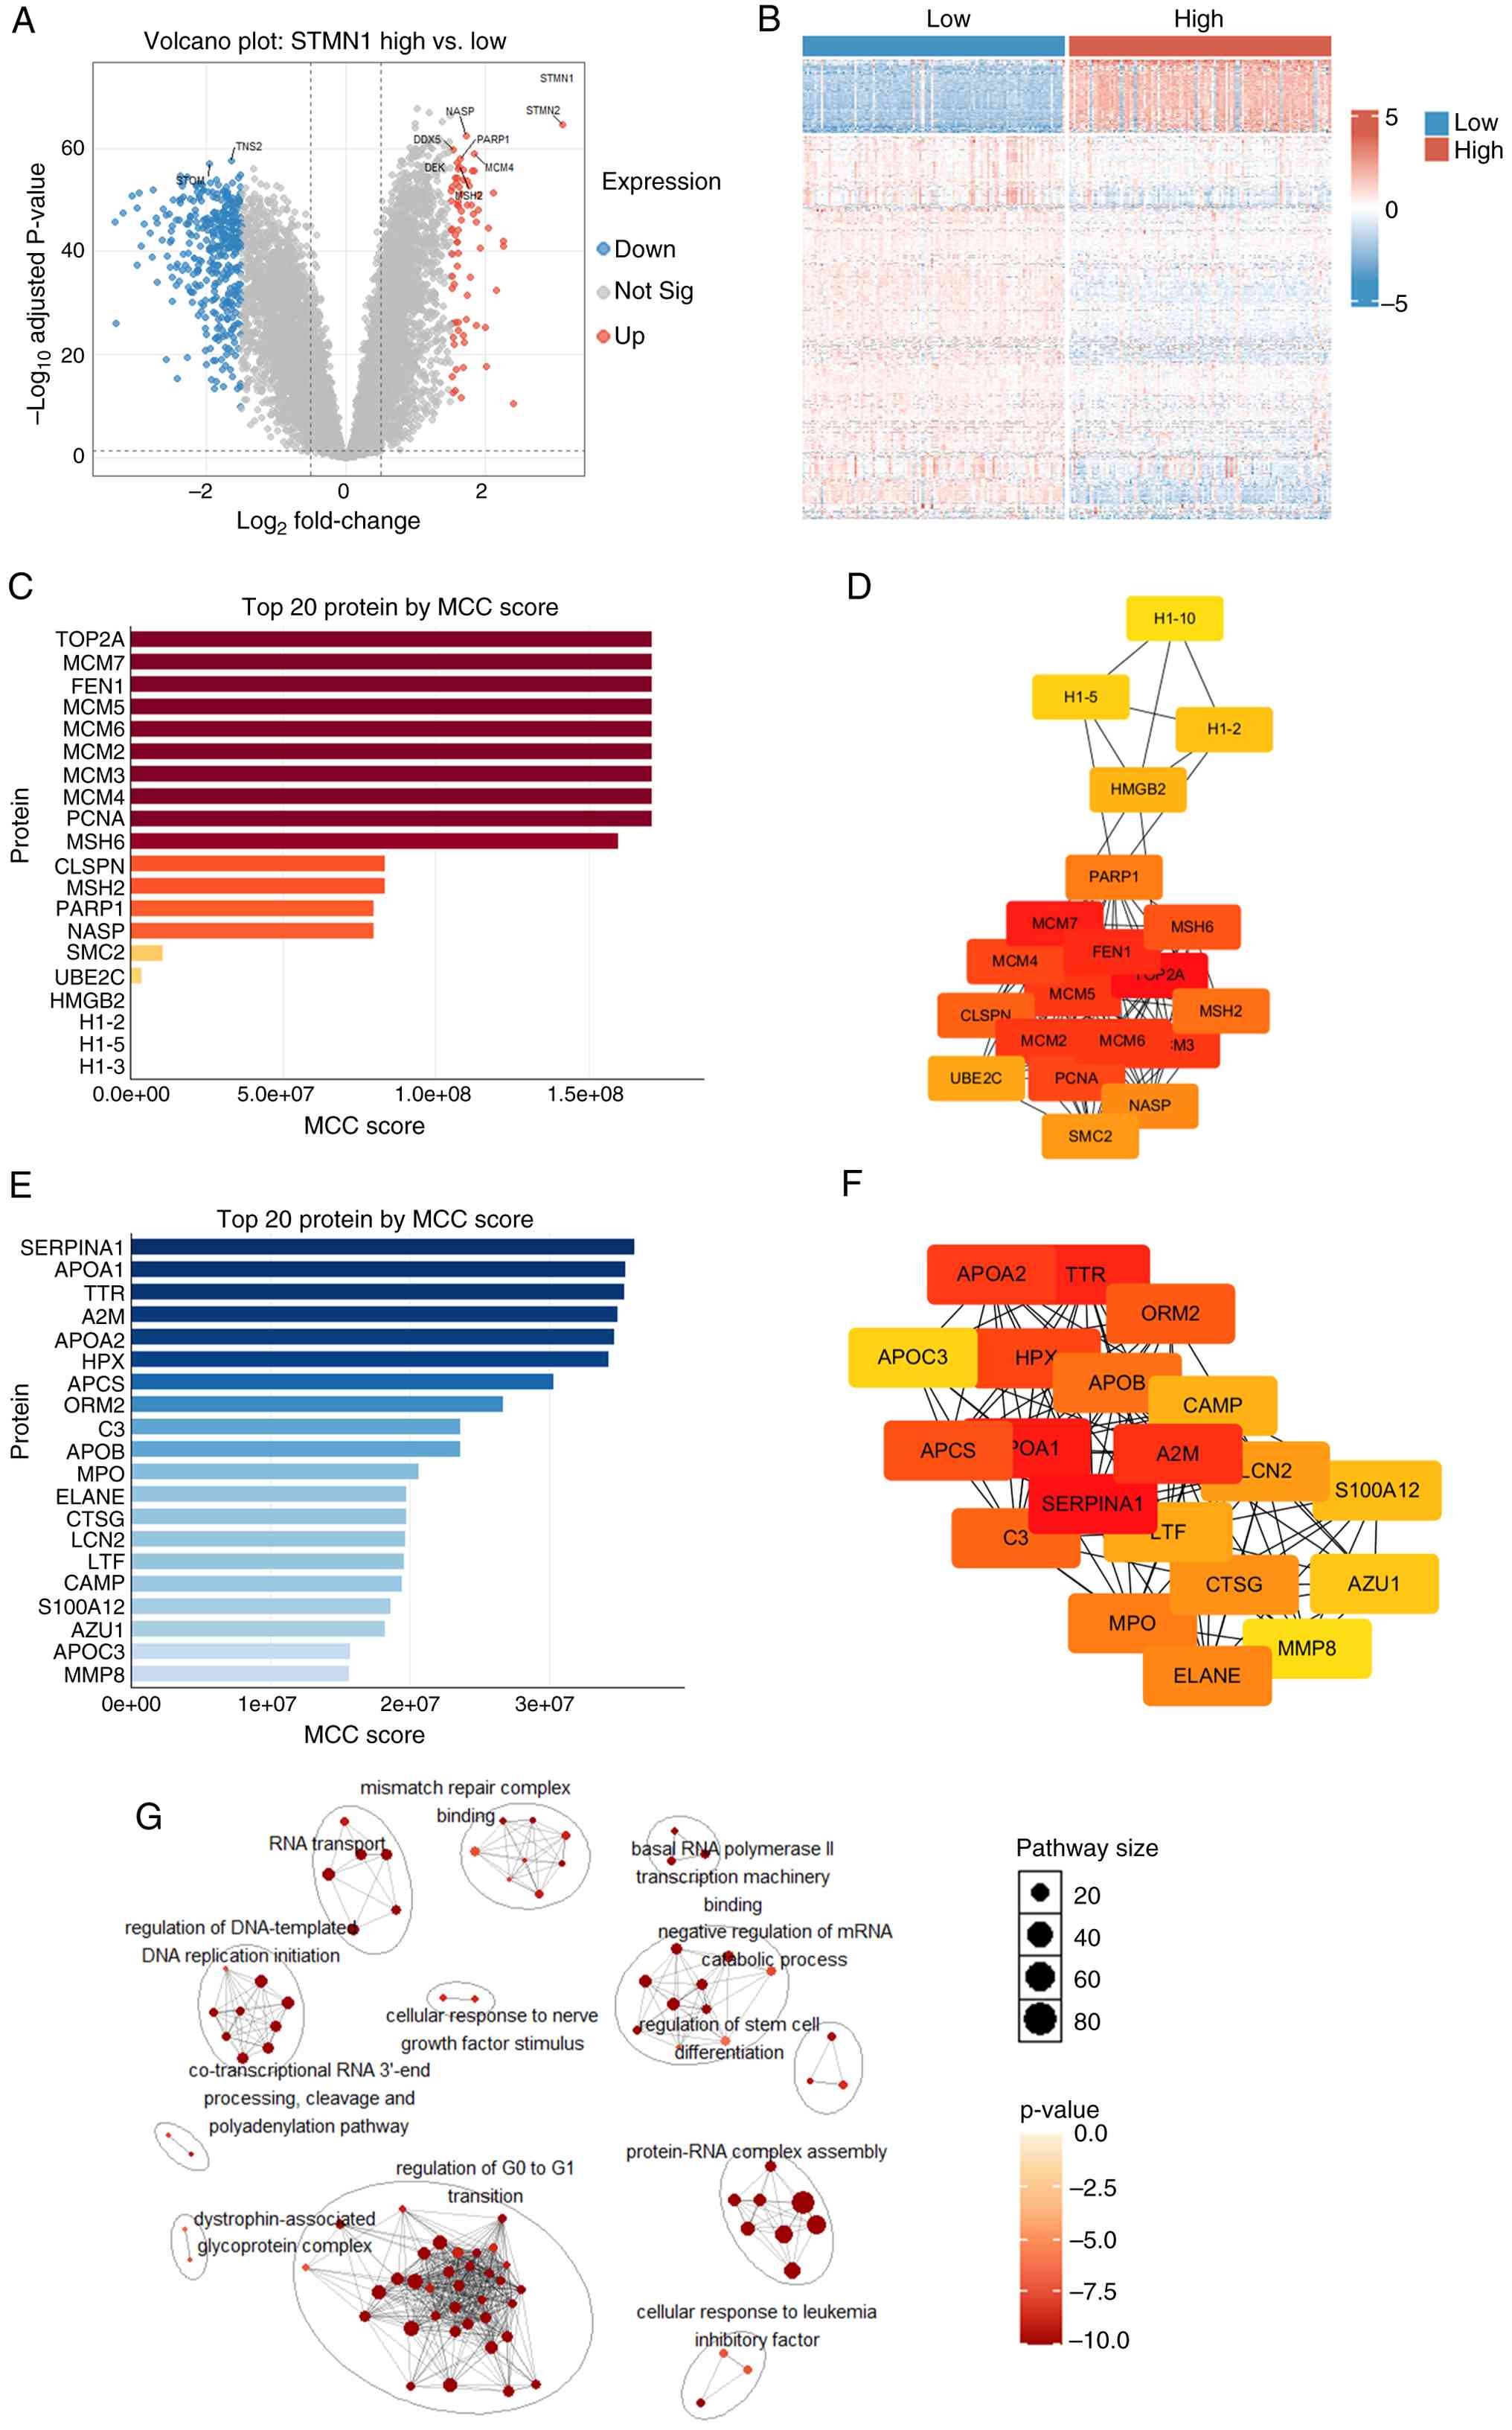 | Figure 5.Identification and functional
analysis of differentially expressed proteins in association with
STMN1. (A) Volcano plot displaying proteins with
differential expression between high and low STMN1
expression groups. (B) Heatmap illustrating the expression profiles
of 452 expression-divergent proteins. (C) Top 20 upregulated hub
proteins, ranked by MCC scores as calculated in Cytoscape. (D) PPI
network of the top upregulated hub proteins identified by MCC
scoring, with nodes colored to represent functional modules. (E)
Bar plot of the top 20 downregulated hub proteins, ranked by MCC
scores calculated in Cytoscape. (F) PPI network of the top
downregulated hub proteins identified by MCC scoring, with nodes
colored to represent functional modules. (G) Dot plot of GO
enrichment analysis for STMN1-associated proteins. Bubble
size indicates the gene counts, and the color gradient
denotes-log10(P-value). FC, fold change; GO, Gene
Ontology; MCC, maximal clique centrality; PPI, protein-protein
interaction; STMN1, Stathmin 1. |
Subsequent GO enrichment analysis showed that
STMN1-associated proteins were involved in the ‘regulation
of G0 to G1 cell cycle transition’ and
‘negative regulation of messenger RNA catabolic process’ (Fig. 5G). These results indicated that
STMN1 could regulate cell cycle progression and maintain
mRNA stability in lung cancer.
Effects of STMN1 on cell proliferation
and migration in DMS114 and H196 cells
The effects of STMN1 expression were further
assessed using cells transduced with NC, STMN1-sh1,
STMN1-sh2, vector and STMN1-OE. Western blotting was
performed to verify the efficiency of STMN1 knockdown and
overexpression in DMS114 and H196 cells (Fig. 6A-D). In both cell lines,
STMN1-sh1 and STMN1-sh2 significantly reduced STMN1
protein expression compared with the negative control group
(Fig. 6A and C). Conversely,
OE-STMN1 markedly increased STMN1 protein levels relative to
the vector control (Fig. 6B and
D). These results confirmed the successful construction of
stable STMN1-knockdown and -overexpression cell lines for
subsequent functional assays. Subsequently, CCK-8 assays
demonstrated that STMN1 knockdown significantly suppressed
cell proliferation in both DMS114 and H196 cells, whereas
STMN1-OE transduction significantly accelerated cell
proliferation (Fig. 6E-H).
Moreover, wound healing assays showed that STMN1 knockdown
markedly impaired cell migration in both DMS114 and H196 cells,
whereas its overexpression significantly accelerated cell migration
(Fig. 6I-L).
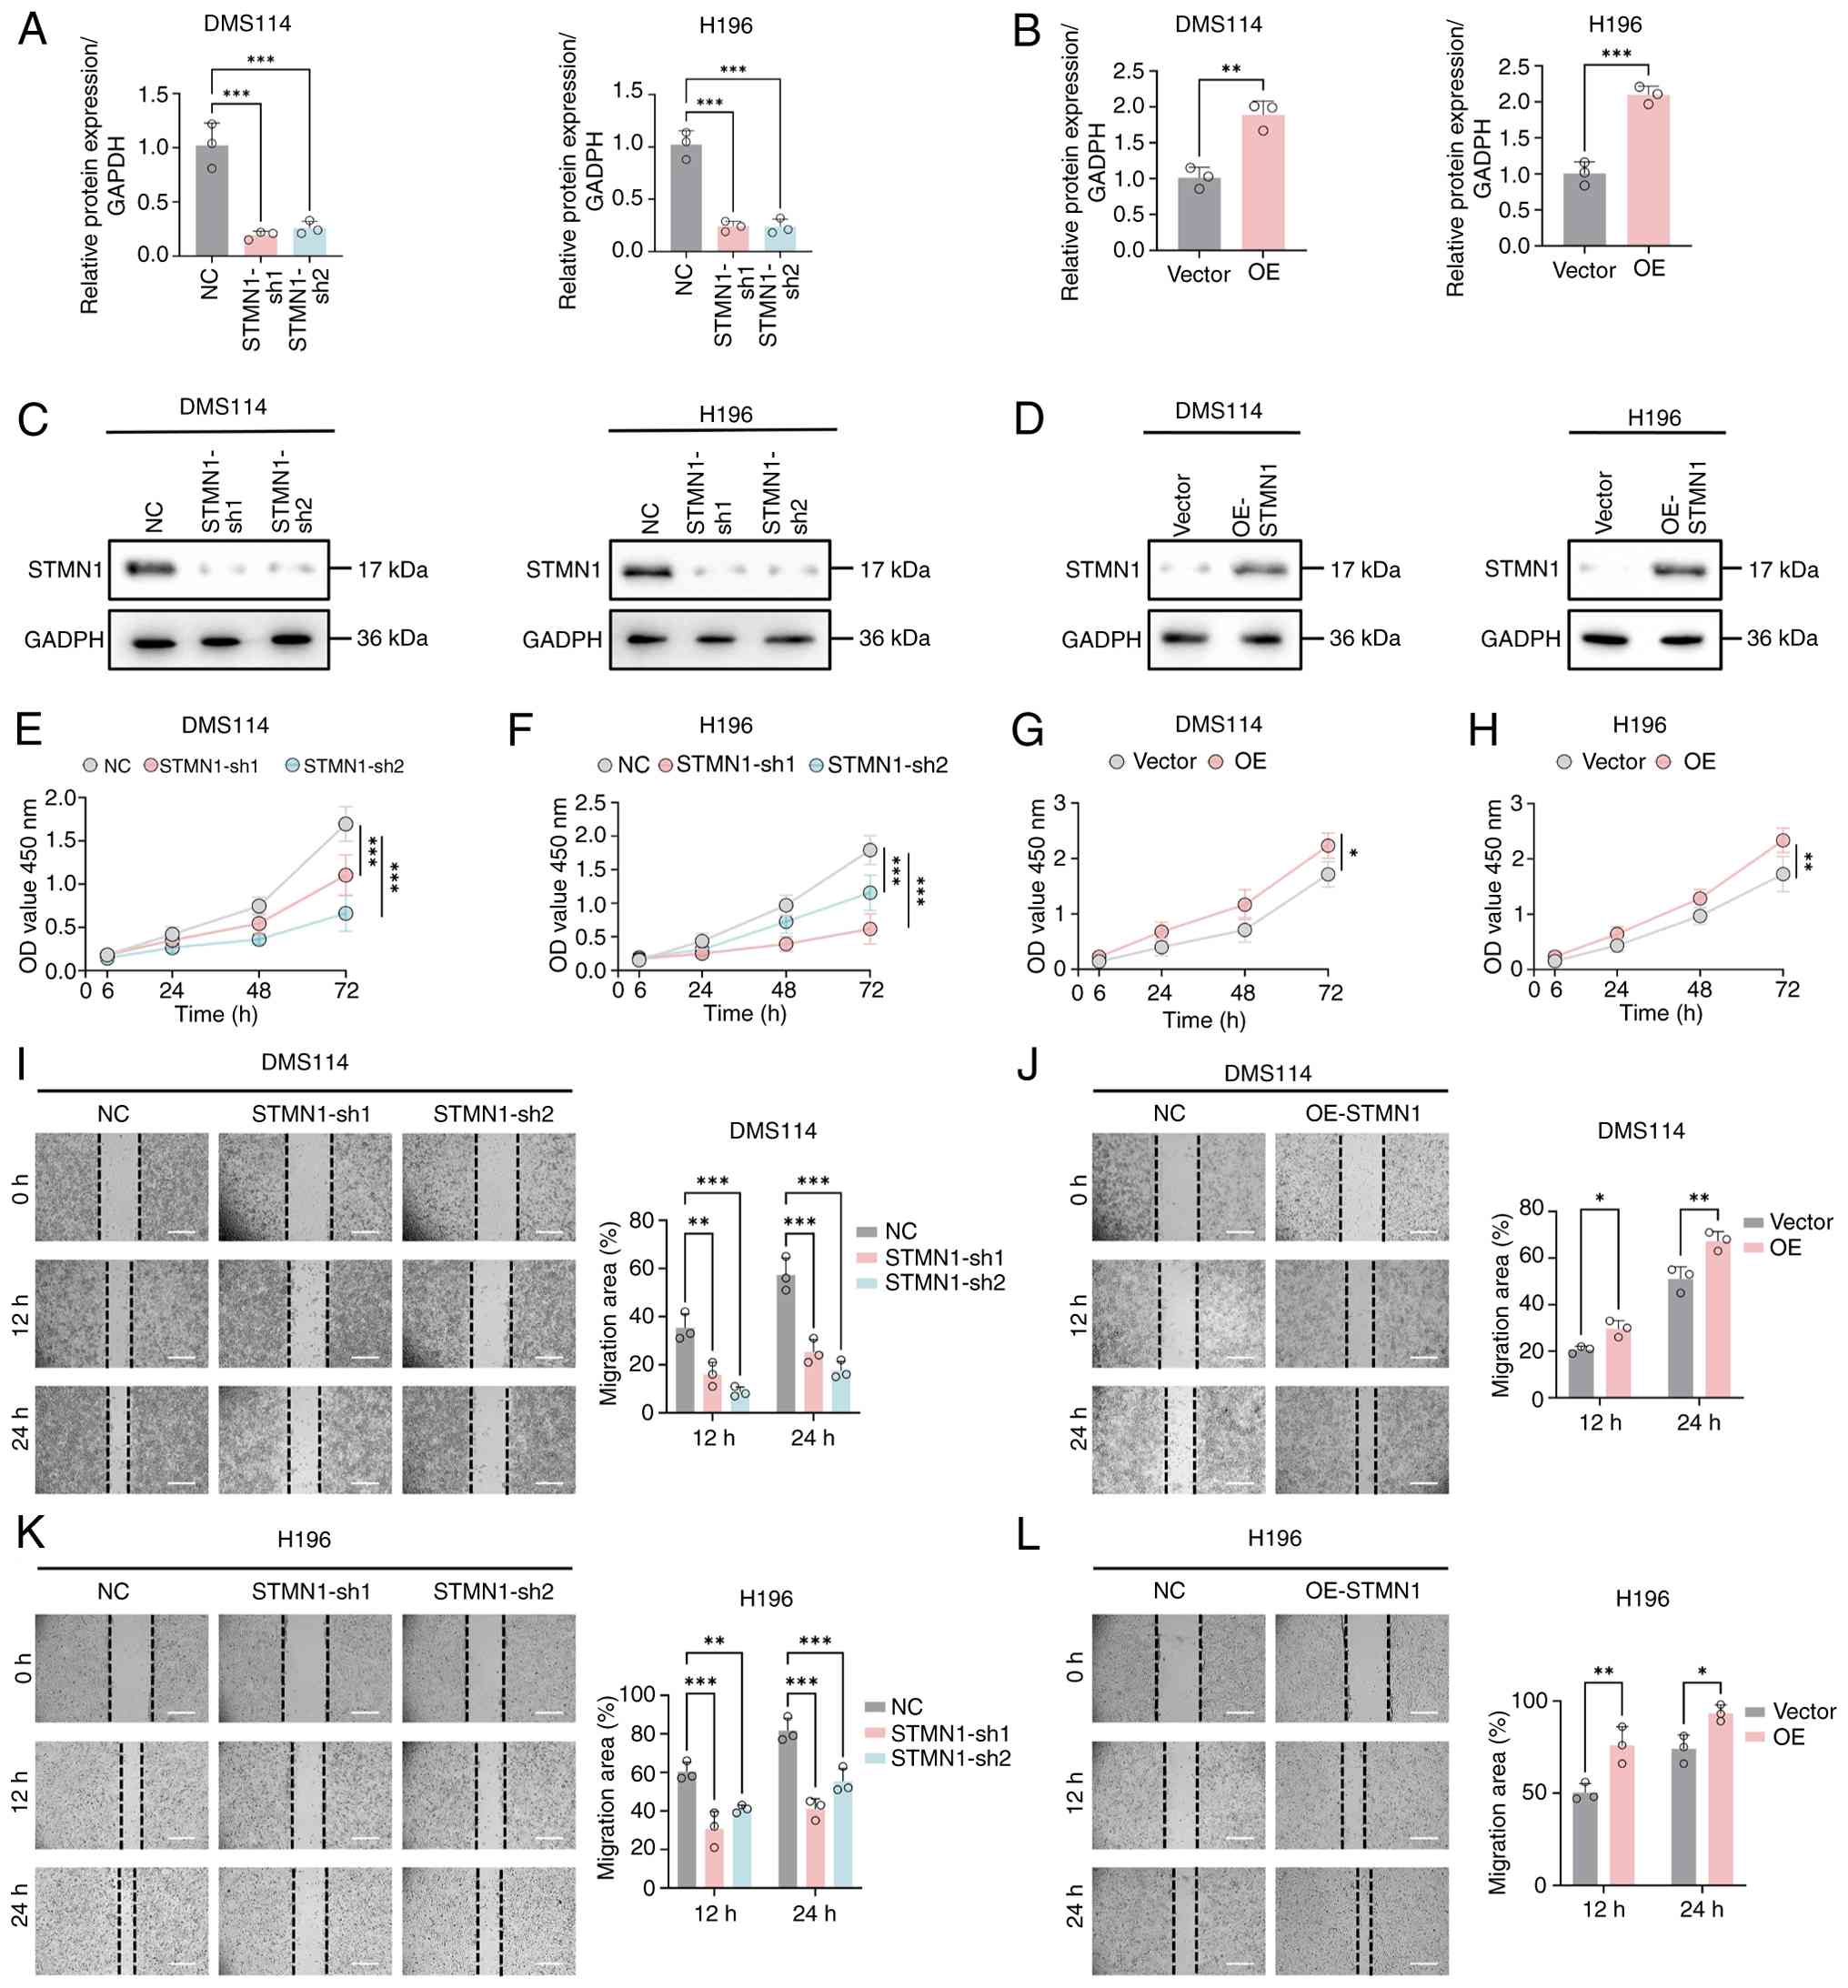 | Figure 6.Effects of STMN1 on the proliferation
and migration of DMS114 and H196 cells. (A) Western blot analysis
was performed to assess STMN1 knockdown efficiency in DMS114 and
H196 cells. (B) Western blot analysis was performed to assess STMN1
overexpression efficiency in DMS114 and H196 cells, with
quantification of relative protein expression normalized to GAPDH.
(C) Representative western blot images showing STMN1 protein
expression in DMS114 and H196 cells following STMN1
knockdown, with GAPDH used as a loading control. (D) Representative
Western blot images showing STMN1 protein expression in DMS114 and
H196 cells following STMN1 overexpression, with GAPDH used
as a loading control. (E) Proliferation of DMS114 and (F) H196
cells following STMN1 knockdown. (G) Proliferation of DMS114
and (H) H196 cells following STMN1 overexpression. (I)
Migration of DMS114 cells following STMN1 knockdown and (J)
overexpression. (K) Representative wound healing assays showing the
migration of H196 cells following STMN1 knockdown. (L)
Representative images and bar graph of wound healing assays showing
the migration of H196 cells following STMN1 overexpression.
Scale bar, 300 µm. *P<0.05, **P<0.01, ***P<0.001. NC,
negative control; OE, overexpression; sh, short hairpin; STMN1,
Stathmin 1. |
Functional characterization of the
effects of STMN1 on apoptosis, colony formation and cell
invasion/migration
To characterize the functional role of STMN1
in lung cancer, its effects on apoptosis, colony formation and
invasion/migration were assessed in DMS114 and H196 cells. Flow
cytometric analysis showed that STMN1 knockdown
significantly enhanced apoptosis in both cell lines. Total
apoptosis rate was significantly higher in the STMN1-sh
groups compared with the control group. By contrast, STMN1
overexpression modestly decreased apoptosis, indicating that the
pro-apoptotic effect of STMN1 seems to be mainly achieved
through its knockdown rather than overexpression (Fig. 7A-D). Colony formation assays
revealed that STMN1 knockdown markedly diminished
colony-forming ability, which was evidenced by fewer and smaller
colonies compared with that in the NC group (Fig. 7E and F). By contrast,
STMN1-OE transduction significantly enhanced this capacity.
Additionally, Transwell assays demonstrated that STMN1
knockdown impaired invasive and migratory capacities (with fewer
membrane-penetrating cells), whereas its overexpression
significantly elevated these abilities (Fig. 7G-J).
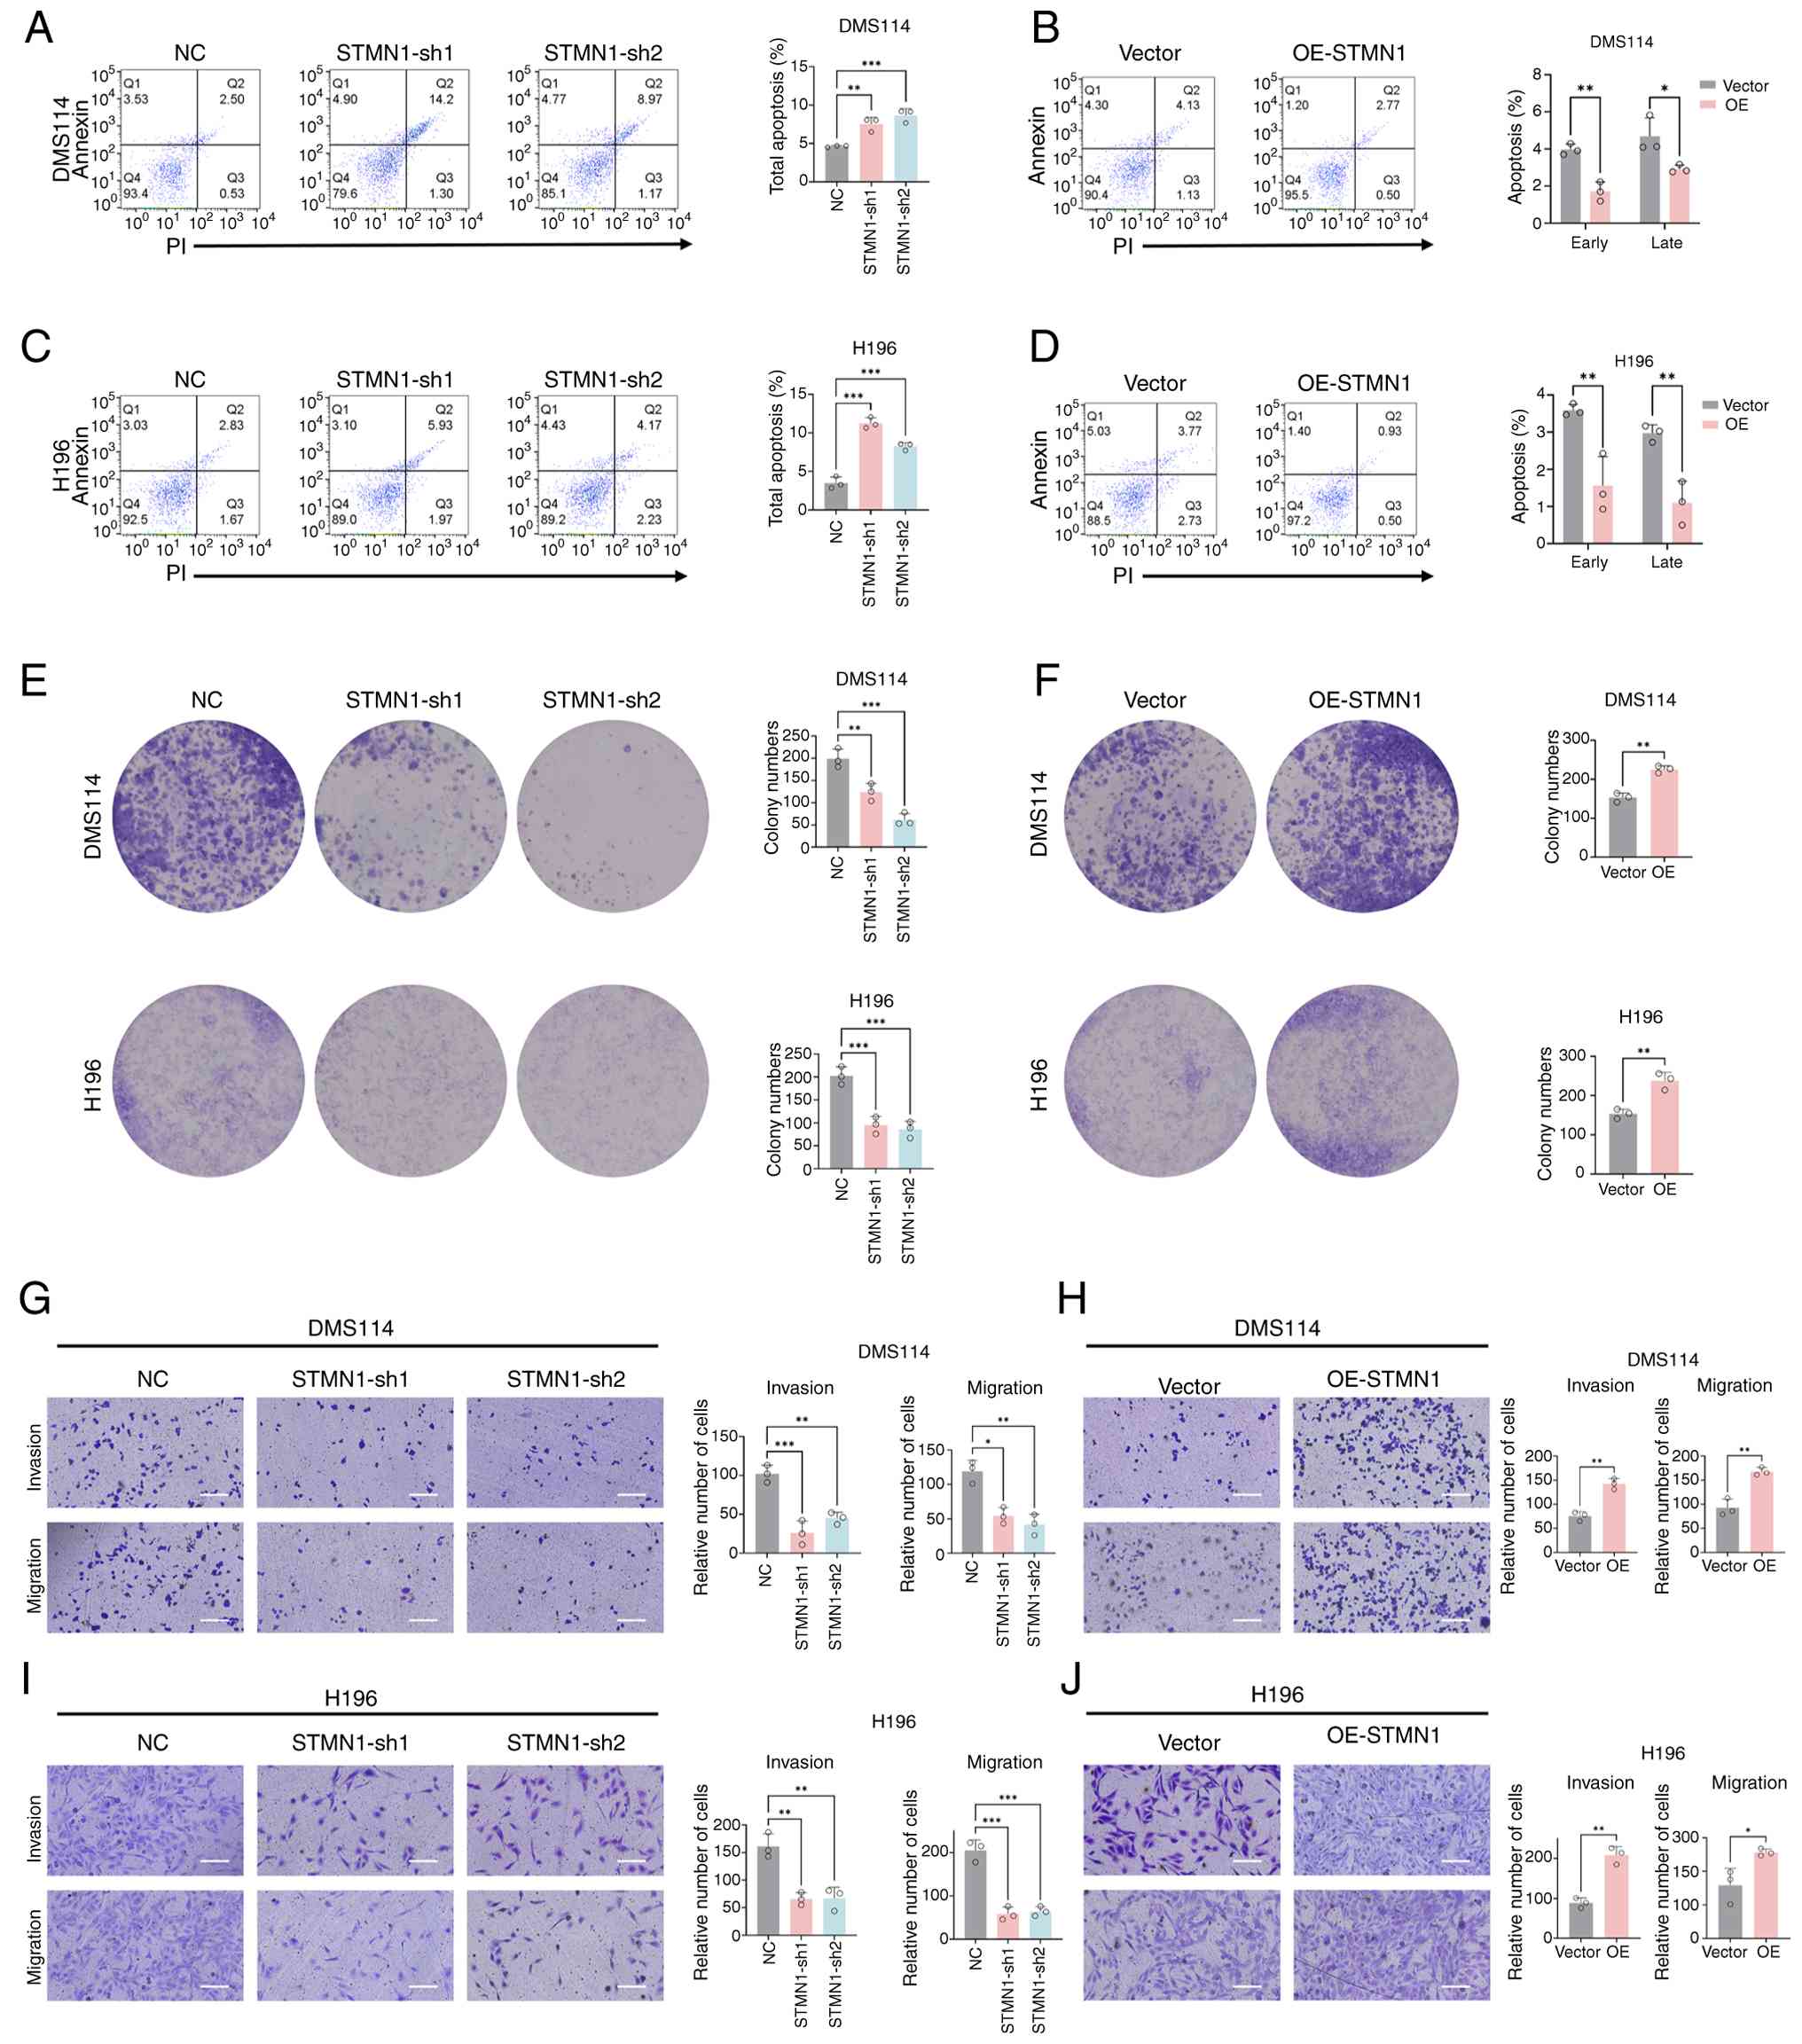 | Figure 7.Effects of STMN1 on apoptosis,
colony formation, invasion and migration of DMS114 (human lung
cancer cell line) and H196 (human lung sarcomatoid carcinoma cell
line) cells. (A) Representative flow cytometry of Annexin V/PI
staining for total apoptosis in DMS114 cells after STMN1
knockdown. (B) Representative flow cytometric dot plots and bar
graphs of Annexin V/PI staining for early and late apoptosis in
DMS114 cells after STMN1 overexpression (OE-STMN1) compared
with empty vector control (Vector). (C) Representative flow
cytometric dot plots and bar graphs of Annexin V/PI staining for
total apoptosis in H196 cells after STMN1 knockdown
(STMN1-sh1, STMN1-sh2) compared with negative control
(NC). (D) Representative flow cytometric dot plots and bar graphs
of Annexin V/PI staining for early and late apoptosis in H196 cells
after STMN1 overexpression (OE-STMN1) compared with
empty vector control (Vector). (E and F) Representative images and
bar graphs of colony formation assays: Colony formation of DMS114
cells after STMN1 knockdown and OE. (G-J) Representative
images and bar graphs of Transwell assays: Invasion and migration
of DMS114 and H196 cells after STMN1 knockdown and OE. Scale
bar, 120 µm. *P<0.05, **P<0.01, ***P<0.001. NC, negative
control; OE, overexpression; sh, short hairpin; STMN1, Stathmin
1. |
STMN1 knockdown inhibits tumor growth
in vivo
A murine shRNA model targeting STMN1 was
established to assess the in vivo effects of STMN1.
As compared with in the NC group, both STMN1-sh1 and -sh2
groups exhibited reduced tumor volumes (Fig. 8A), decreased tumor weights
(Fig. 8B) and slower tumor growth
kinetics (Fig. 8C). The maximum
tumor volume was 1,654 mm3, corresponding to a maximum
diameter of 15 mm. H&E staining and immunohistochemical
analysis revealed that STMN1 knockdown was associated with
reduced expression of the proliferation marker Ki67, and elevated
levels of the apoptosis marker C-Caspase-3/Caspase-3 in tumor
tissues (Fig. 8D-F).
Immunofluorescence staining demonstrated that Vimentin expression
was reduced in the STMN1-sh1 and -sh2 groups, indicating
impaired epithelial-mesenchymal transition (EMT) progression
(Fig. 8G and H). The TUNEL assay
further confirmed a significant increase in apoptotic cells in
STMN1-knockdown tumors (Fig. 8I
and J). Western blotting validated these findings, showing
downregulated Vimentin and Bcl-2 (anti-apoptotic protein)
expression levels in the STMN1-sh1 and -sh2 groups (Fig. 8K). These results were consistent
with the enhanced apoptosis and suppressed EMT. STMN1
knockdown efficiency was also confirmed in tumor tissues (Fig. 8K). Collectively, these results
indicated that STMN1 knockdown could induce tumor regression
by suppressing cell proliferation, enhancing apoptosis and
impairing EMT in vivo.
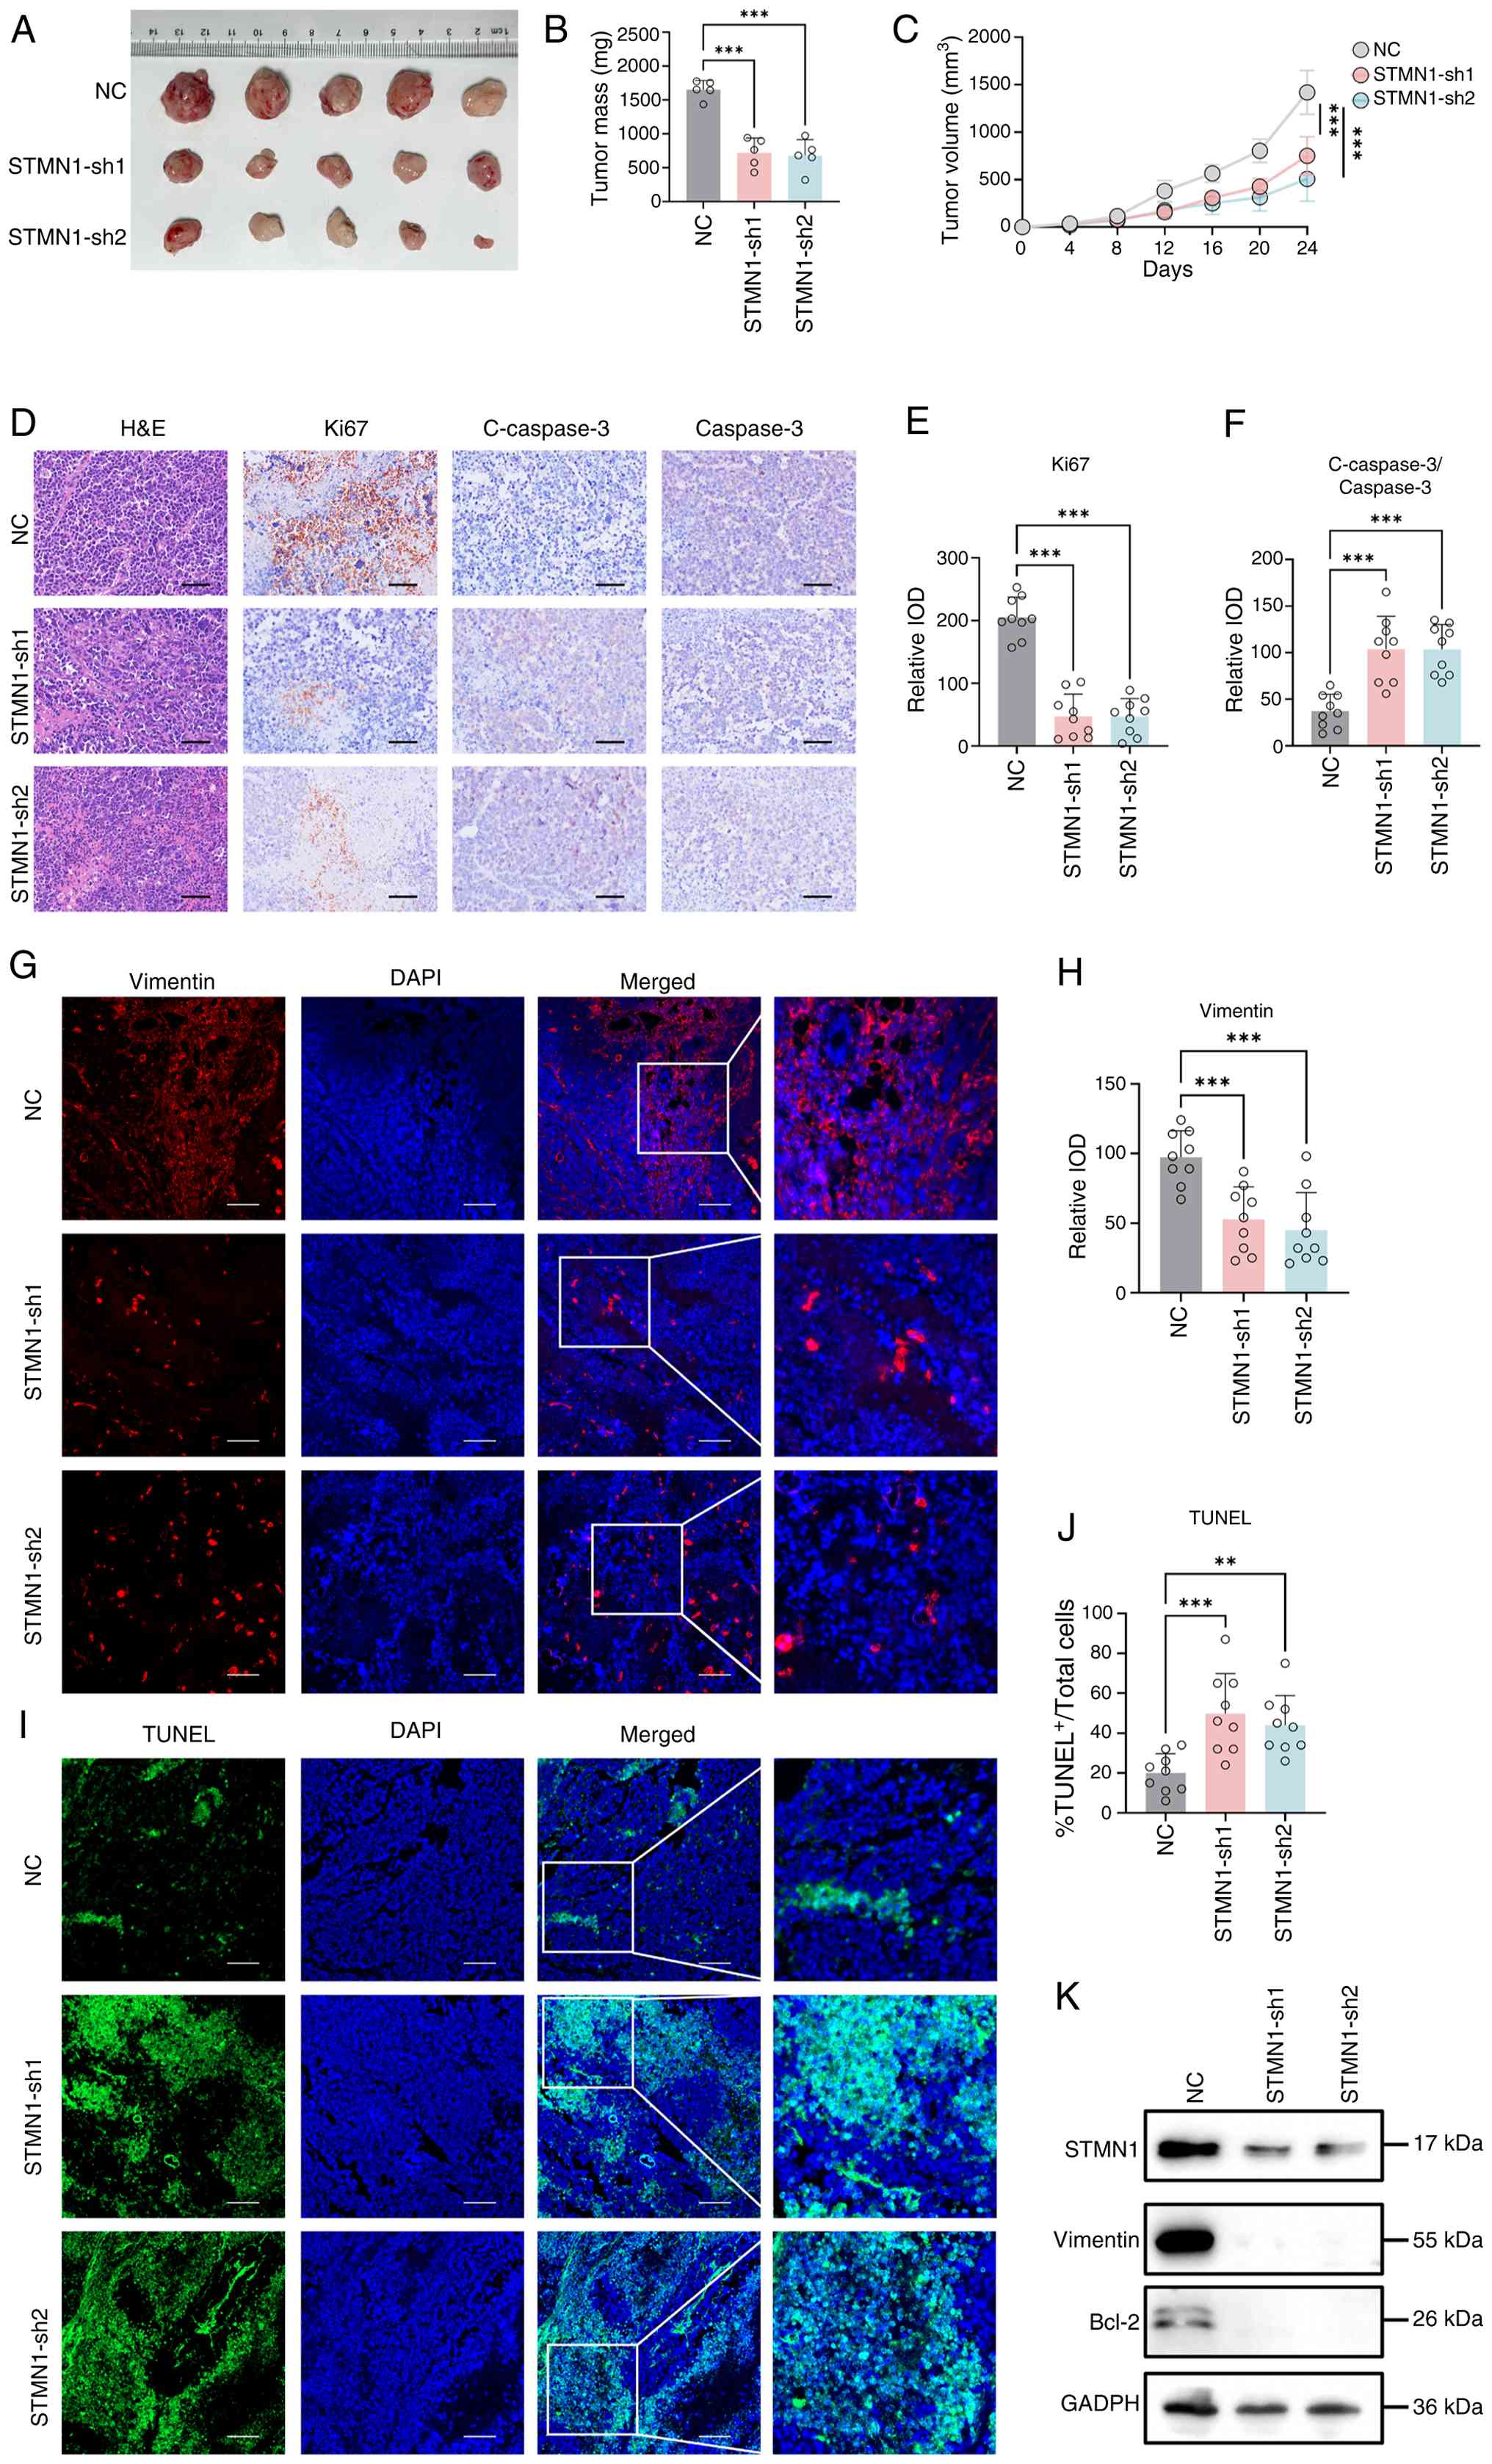 | Figure 8.STMN1 knockdown inhibits tumor
growth in vivo. Tumor growth characteristics of the
STMN1-sh1/sh2 and NC group: (A) Representative images of
subcutaneous tumors are shown (n=5/group). (B) Bar graph of tumor
weights. (C) Line graph of tumor volume growth. (D) Representative
H&E staining and immunohistochemical staining for Ki67,
C-Caspase-3, and Caspase-3 in NC, STMN1-sh1, and
STMN1-sh2 groups. Scale bar, 50 µm. (E) Bar graph showing
the relative IOD of Ki67 staining in NC, STMN1-sh1, and
STMN1-sh2 groups. (F) Bar graph showing the relative IOD of
C-Caspase-3 normalized to total Caspase-3 in NC, STMN1-sh1,
and STMN1-sh2 groups. (G) Representative immunofluorescence
staining of vimentin in tumor tissues from the NC, STMN1-sh1
and STMN1-sh2 groups. Scale bar, 50 µm. (H) Bar graph of the
relative integrated optical density of Vimentin immunofluorescence
staining. (I) Representative images of TUNEL staining in tumor
tissues from the NC, STMN1-sh1 and STMN1-sh2 groups.
Scale bar, 50 µm. (J) Proportion of TUNEL-positive cells relative
to total cells in tumor tissues. (K) Western blot analysis
verifying the expression of STMN1, Vimentin and Bcl-2
(anti-apoptotic protein) in tumor tissues. GAPDH served as a
loading control. **P<0.01, ***P<0.001. C-Caspase-3,
cleaved-Caspase-3; H&E, hematoxylin and eosin; MFI, mean
fluorescence intensity; NC, negative control; sh, short hairpin;
STMN1, Stathmin 1; IOD, Integrated Optical Density. |
STMN1 promotes histone
lactylation
To elucidate the effect of STMN1 on histone
lactylation, histones were extracted from DMS114 and H196 cells
following STMN1 knockdown or overexpression. The levels of
Pan Kla and H3K18la were decreased upon STMN1 knockdown and
increased upon STMN1 overexpression, demonstrating that
STMN1 promotes histone lactylation (Fig. 9A-D).
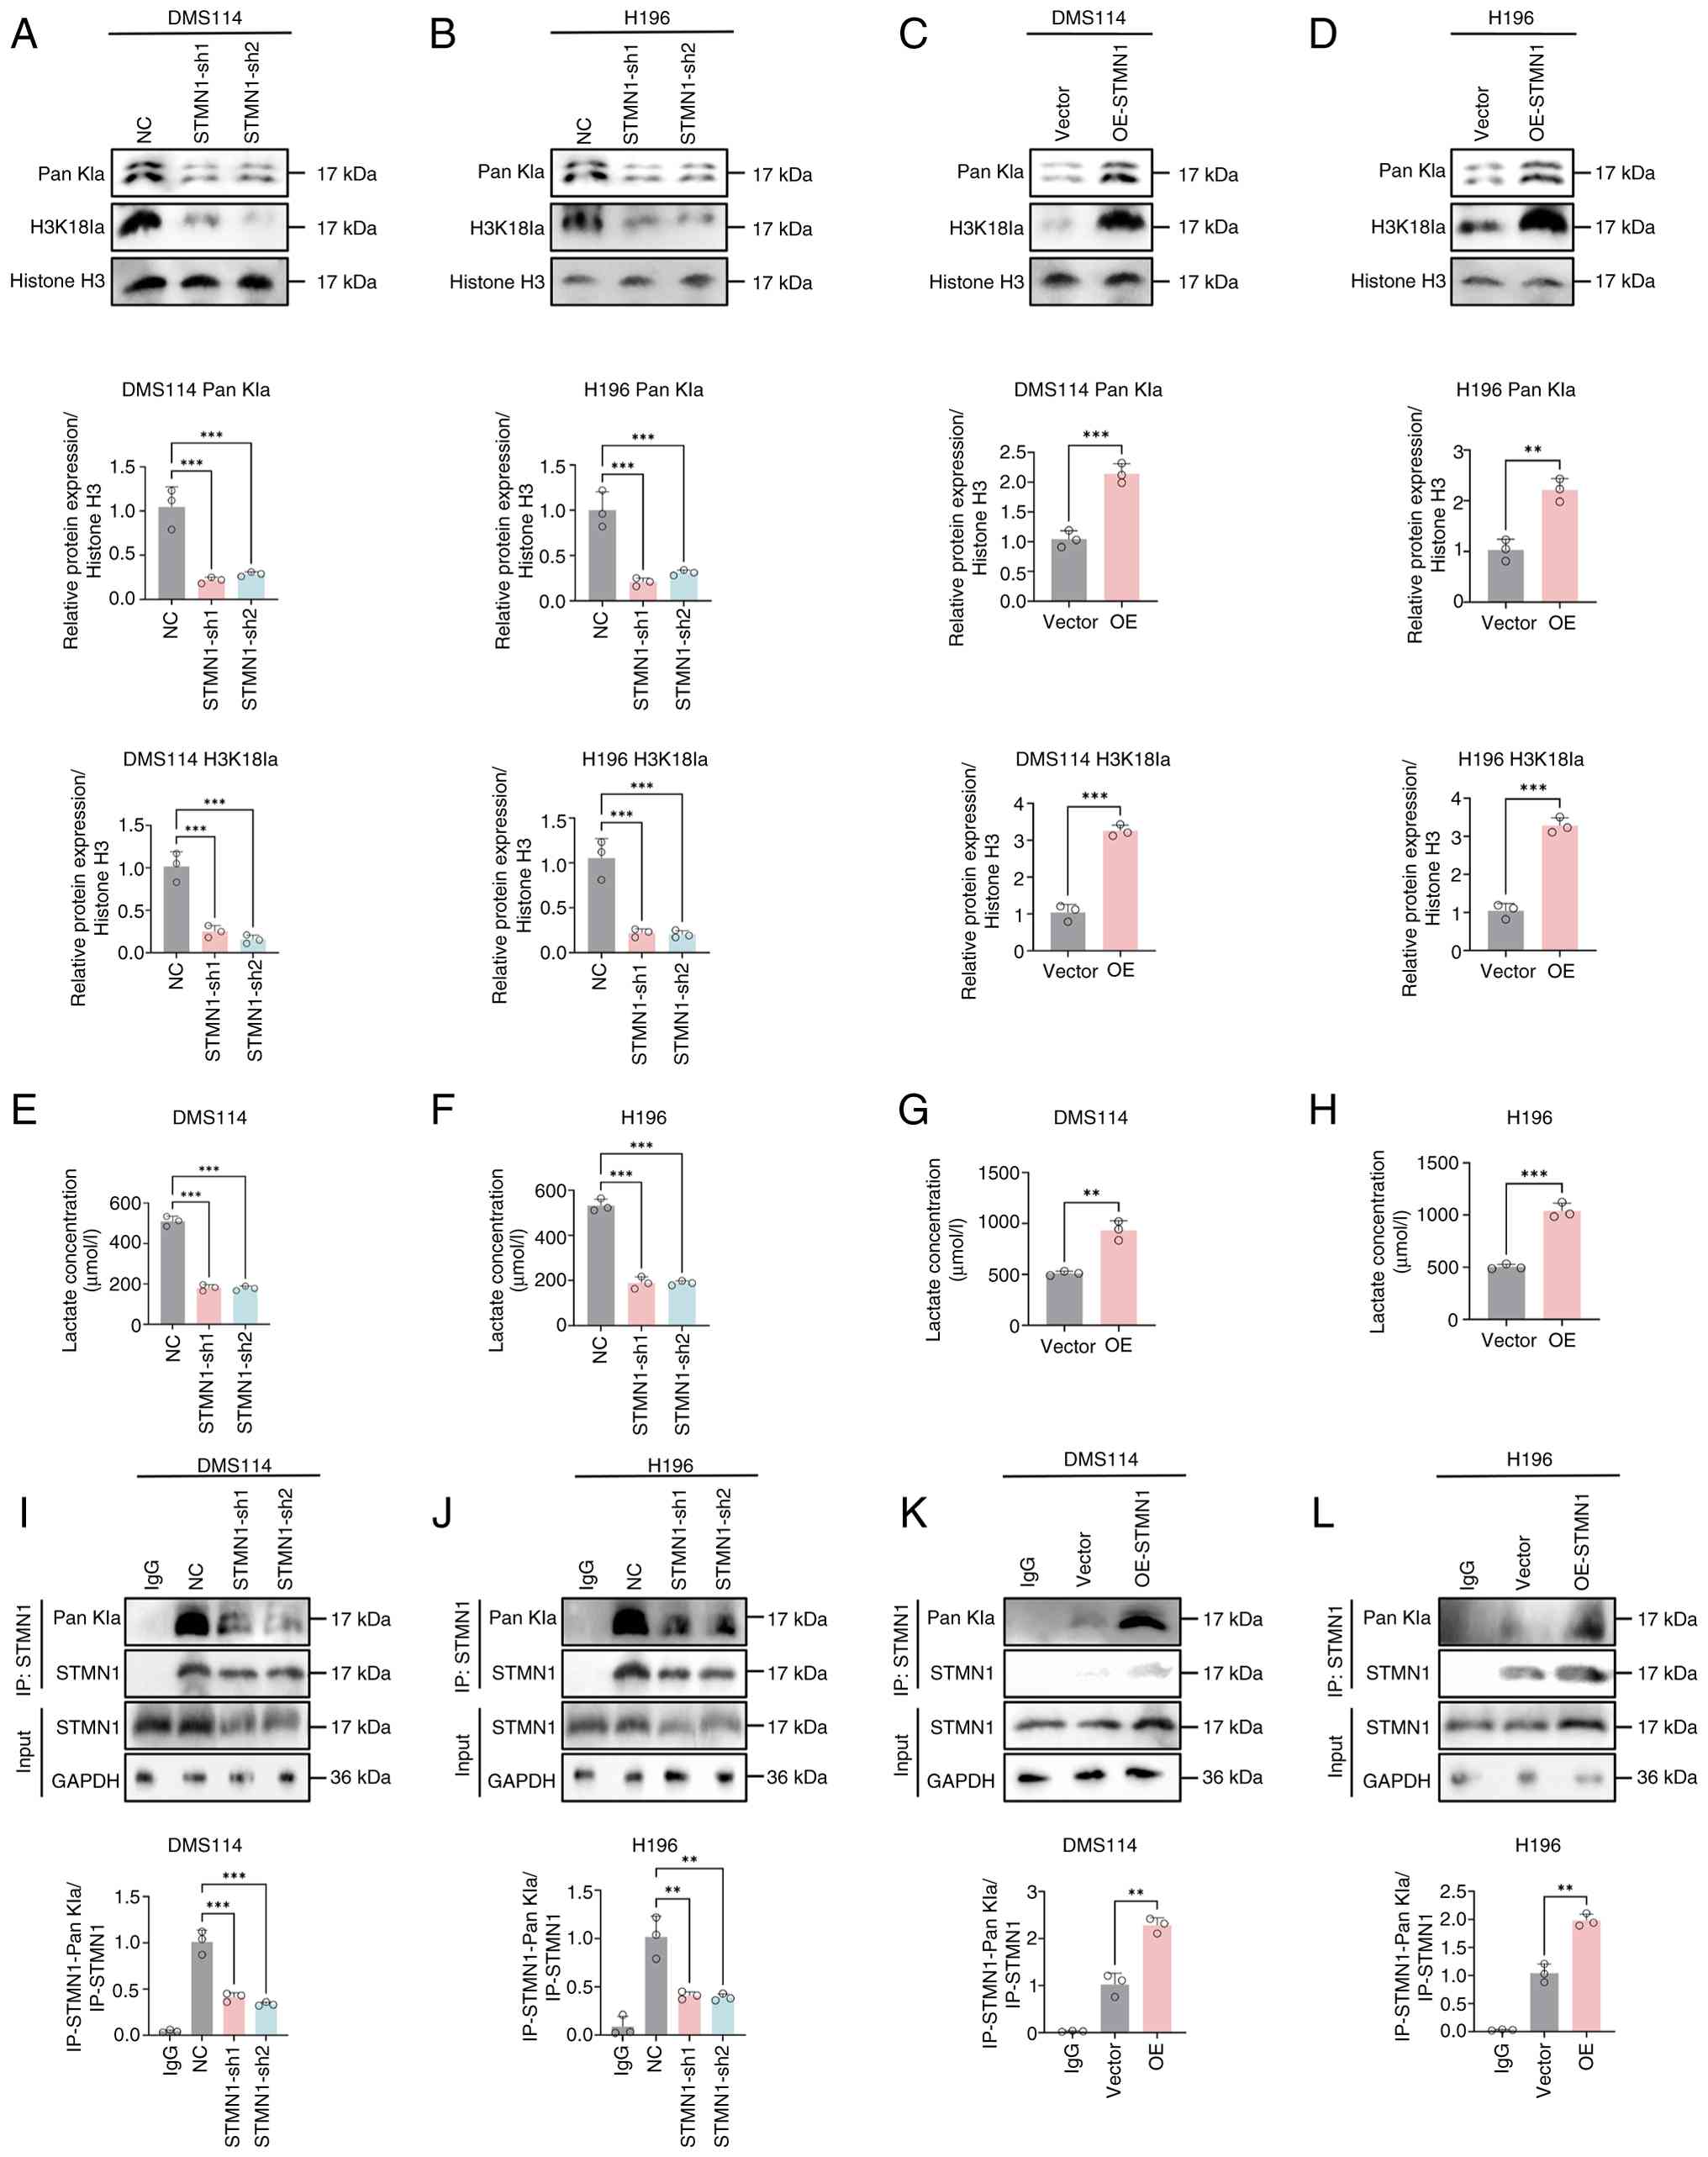 | Figure 9.STMN1 promotes histone
lactylation and undergoes lactylation modification itself. (A)
Western blotting of Pan Kla and H3K18la in DMS114 cells with
STMN1 knockdown (sh1, sh2) or NC, using Histone H3 as
loading control. (B) Western blotting of Pan Kla and H3K18la in
H196 cells with STMN1 knockdown (sh1, sh2) or NC, using
Histone H3 as loading control. (C) Western blotting of Pan Kla and
H3K18la in DMS114 cells with STMN1 OE) or vector control,
using Histone H3 as loading control. (D) Western blotting of Pan
Kla and H3K18la in H196 cells with STMN1 overexpression (OE)
or vector control, using Histone H3 as loading control. (E-H)
Cellular lactate concentrations in DMS114 and H196 cells with
STMN1 knockdown or STMN1-OE was measured using a
lactate assay kit, verifying the regulatory effect of STMN1
on cellular lactate production. (I-L) Co-IP combined with western
blotting was performed to validate the lactylation of STMN1 itself
in DMS114 and H196 cells, and the effect of STMN1
knockdown/overexpression on its own lactylation level was
quantitatively analyzed, with IgG as the negative control and GAPDH
as the input internal reference. **P<0.01, ***P<0.001.
H3K18la, histone H3 lysine 18 lactylation; IP, immunoprecipitation;
NC, negative control; OE, overexpression; Pan Kla, global histone
lactylation; sh, short hairpin; STMN1, Stathmin 1. |
To explore the underlying mechanism, cellular
lactate concentrations were measured and it was revealed that
STMN1 knockdown significantly reduced lactate levels,
whereas STMN1 overexpression increased lactate production
(Fig. 9E-H), indicating that
STMN1 may regulate histone lactylation by modulating cell
lactate generation.
To determine whether STMN1 itself undergoes
lactylation, co-IP and western blotting was performed. The results
confirmed that STMN1 was lactylated in both DMS114 and H196
cells, and its lactylation level was positively associated with its
expression: STMN1 knockdown decreased its lactylation,
whereas STMN1 overexpression increased it (Fig. 9I-L). Collectively, these findings
indicated that STMN1 may not only promote cellular lactate
production and histone lactylation, but also undergoes lactylation
itself.
Discussion
The present study investigated the association
between lactate metabolism and lung cancer pathogenesis. The
oncogenic role and regulatory mechanisms of STMN1 in lung
cancer were investigated by integrating MR analysis with
multi-dimensional functional validation.
Traditional observational studies are limited by
their inability to fully eliminate confounding factors and reverse
causality. By contrast, the MR approach capitalizes on the random
inheritance of genetic variants, offering robust evidence for
causal inference between exposures and outcomes (34). Recently, the mechanisms underlying
lactate and lactylation in cancer, along with their potential as
therapeutic targets and clinical applications in cancer, have been
increasingly elucidated (35–37).
In this context, the current study sought to identify
lactylation-related genes with a direct causal link to lung cancer.
In the parallel analysis of multiple genes, multiple testing can
increase the risk of false positives. Therefore, both FDR and
Bonferroni multiple testing correction methods were implemented.
Three core candidates were screened from 46 lactylation-related
genes. Ultimately, only STMN1 was confirmed to exhibit a
significant association with lung cancer susceptibility, with an OR
of 1.741. This finding suggested that elevated STMN1 may
serve as a key pathogenic driver of lung cancer.
As a microtubule-binding protein, STMN1 is involved
in microtubule polymerization and depolymerization, and
participates in critical cellular processes, such as mitosis and
apoptosis. Its upregulation in numerous tumor cells contributes to
malignant phenotypes, including proliferation, migration and
invasion (38,39). Numerous studies have indicated that
increased STMN1 expression is associated with unfavorable
clinical outcomes in patients with prostate cancer (40), gallbladder carcinoma (41), colorectal carcinoma (42), pancreatic cancer (43) and breast carcinoma (44). By contrast, STMN1 can exert
tumor-suppressive effects on bladder cancer (45), highlighting its context-dependent
role in carcinogenesis. To date, to the best of our knowledge, the
role of STMN1 in lung cancer has not been explored. A
previous study on hepatocellular carcinoma identified 16
lactylation-related prognosis-associated differentially expressed
genes, including STMN1, by analyzing the gene expression
profiles from The Cancer Genome Atlas database (46). Additionally, STMN1 has been
recognized as a marker of glycolysis (47), further linking its role to
metabolic reprogramming in cancer. Elevated expression of immune
checkpoint molecules can weaken antitumor immune reactions, thereby
allowing the tumor to evade immune surveillance and promote disease
advancement (48). The current
study demonstrated that STMN1 was significantly linked to an
unfavorable prognosis in patients with lung cancer. Furthermore,
high STMN1 expression was correlated with reduced immune
cell infiltration and lower immune scores in lung cancer tissues.
These observations support the dual potential of STMN1 as
both a prognostic marker and a therapeutic target in lung cancer.
The combination of STMN1 inhibitors with ICIs may enhance
the anti-lung cancer efficacy of ICIs, which could be related to
the potential improvement of the TME immune status associated with
STMN1 downregulation. This hypothesis warrants further
validation in future studies.
Using functional enrichment analysis, and in
vitro and in vivo experiments, the present study
initially elucidated the multi-dimensional mechanisms by which
STMN1 could promote lung cancer progression. GO enrichment
analysis showed that proteins related to STMN1 participated
in G0-G1 cell cycle transition and negative
regulation of mRNA catabolism. This suggested that STMN1 may
support the rapid proliferation of tumor cells through two parallel
pathways: Accelerating cell cycle progression and ii) maintaining
the stability of carcinogenesis-related mRNA. The former can
shorten the time for lung cancer cells to switch from the quiescent
phase to the proliferative phase, whereas the latter can sustain
the continuous activation of oncogenic signaling pathways by
inhibiting the degradation of tumor suppressor gene mRNAs (49).
Both cell-based and animal studies further
validated the regulatory function of STMN1 in cell functions
and the TME. STMN1 knockdown notably suppressed the
proliferation, migration and invasion capabilities of DMS114 human
lung cancer cells and H196 human lung sarcomatoid carcinoma cells,
induced cell apoptosis, and downregulated the expression levels of
the anti-apoptotic protein Bcl-2 and the EMT marker Vimentin. This
result partially overlaps with the reported mechanism of
STMN1 in other tumors. For example, STMN1 can promote
cell migration by regulating microtubule dynamic stability in
breast cancer (50). Consistent
with these findings, the present study demonstrated that
STMN1 promoted EMT by upregulating vimentin expression in
DMS114 and H196 cells. These results indicated that the pro-tumor
and pro-metastatic function of STMN1 is conserved across
different cancer types, supporting the existence of universal
oncogenic pathways regulated by STMN1.
In the present study, the enrichment ratio of
oncogenic pathways, such as TP53 and Hippo signaling pathways, was
notably greater in the high STMN1 expression group compared
with that in the low STMN1 expression group. Additionally,
DGIdb analysis revealed differences in the categories of druggable
targets between the two groups, providing further insights into
understanding the interaction between STMN1 and other
oncogenic pathways. For example, STMN1 may enhance the
resistance of lung cancer cells to apoptotic signals by activating
TP53 mutation-related pathways. Meanwhile, the high enrichment of
the Hippo signaling pathway could further amplify
STMN1-mediated cell proliferation, forming an
‘STMN1-TP53-Hippo’ synergistic oncogenic network. Thus, it
may be hypothesized that the combined targeted intervention against
this network (such as by using an STMN1 inhibitor and a TP53
repair agent) might be more effective in inhibiting lung cancer
progression compared with a single-target intervention, offering a
molecular foundation for developing precise therapeutic
regimens.
To further assess the functional link between
STMN1 and lactate metabolism, a series of mechanistic
experiments were performed. First, intracellular lactate levels
were measured in lung cancer cells with STMN1 knockdown or
overexpression, and it was revealed that STMN1 positively
regulated lactate production: Depletion of STMN1 reduced
lactate concentration, whereas its overexpression increased it.
This result directly connects STMN1 to the upstream
metabolic process of lactate generation, which is the precursor for
protein lactylation. Subsequently, it was confirmed that
STMN1 could promote Pan Kla and H3K18la in lung cancer
cells, as evidenced by reduced lactylation levels after
STMN1 knockdown and enhanced lactylation after
overexpression. Notably, the current study further verified that
STMN1 itself undergoes lactylation modification. These
findings not only validate the role of STMN1 as a
lactylation-related gene, but also reveal a novel
post-translational modification of STMN1, which may be
involved in the feedback regulation of its oncogenic function. The
newly discovered link between STMN1 and lactate
metabolism/lactylation further expands the mechanistic
understanding. STMN1 may promote lung cancer progression not
only by regulating microtubule dynamics and cell cycle, but also by
enhancing lactate production and subsequent protein lactylation,
including its own self-lactylation. This dual regulatory mechanism
suggests that STMN1 acts as a key node connecting metabolic
reprogramming and oncogenic signaling in lung cancer, which may
explain its strong pathogenic effect in the current MR
analysis.
Despite the rigorous design and reliable results of
the present study, there are certain limitations. First, the
exposure data for MR analysis were derived from eQTL databases,
which may have constraints regarding sample scale and ethnic
background. In the current study, the lung cancer GWAS datasets
were derived from the Finnish population, whereas the eQTL effect
of STMN1 might vary across different ethnic groups. As no
publicly available Asian or multi-ethnic lung cancer GWAS datasets
with sufficient sample size and comprehensive genotype-phenotype
annotations currently exist, the generalizability of the MR
findings to non-European populations remains to be verified. In the
future, we aim to validate the MR results in Asian or multi-ethnic
cohorts once relevant datasets are released. Second, the study did
not investigate the direct association between STMN1,
lactate metabolism and histone lactylation in depth. As a
lactylation-related gene, it remains unclear whether lactate
metabolites regulate STMN1 expression. Subsequent
verification using techniques such as metabolomics and chromatin
immunoprecipitation-sequencing is required.
In conclusion, the present study clarified the
causal association between STMN1 and lung cancer using the
MR method, and revealed its mechanism in regulating tumor cell
functions and TME. The study provided a novel theoretical
foundation for prognostic evaluation and targeted treatment of lung
cancer. In the future, the clinical value of STMN1 should be
further verified to promote the development of related targeted
drugs.
Acknowledgements
Not applicable.
Funding
This study was supported by the National Natural Science
Foundation of China (grant no. 82472879).
Availability of data and materials
The data generated in the present study may be
requested from the corresponding author.
Authors' contributions
YC, YZ and HW jointly conceptualized the study
framework and designed the research protocols. HW and YZ performed
in vitro and in vivo experiments, with HW assisting
in data collection and preliminary sorting. SZ and SH led the
bioinformatics analyses and interpreted the key results. YC drafted
the initial manuscript, whereas SH and QZ conceived and designed
the study, interpreted data, and revised the manuscript. FH and SZ
supplemented experimental data and verified result reproducibility.
All authors reviewed the manuscript and agreed to the submission,
and all authors read and approved the final manuscript. YC and SH
confirm the authenticity of all the raw data.
Ethics approval and consent to
participate
The present study was approved by the Animal
Experimentation Ethics Committee of the Huazhong University of
Science and Technology (IACUC no. 4847; Wuhan, China).
Patient consent for publication
Not applicable.
Competing interests
The authors declare that they have no competing
interests.
References
|
1
|
Singh A, Daemen A, Nickles D, Jeon SM,
Foreman O, Sudini K, Gnad F, Lajoie S, Gour N, Mitzner W, et al:
NRF2 Activation promotes aggressive lung cancer and associates with
poor clinical outcomes. Clin Cancer Res. 27:877–888. 2021.
View Article : Google Scholar : PubMed/NCBI
|
|
2
|
Zugazagoitia J, Osma H, Baena J, Ucero AC
and Paz-Ares L: Facts and hopes on cancer immunotherapy for small
cell lung cancer. Clin Cancer Res. 30:2872–2883. 2024. View Article : Google Scholar : PubMed/NCBI
|
|
3
|
Chen H, Deng C, Gao J, Wang J, Fu F, Wang
Y, Wang Q, Zhang M, Zhang S, Fan F, et al: Integrative spatial
analysis reveals tumor heterogeneity and immune colony niche
related to clinical outcomes in small cell lung cancer. Cancer
Cell. 43:519–536.e5. 2025. View Article : Google Scholar : PubMed/NCBI
|
|
4
|
Paz-Ares L, Dvorkin M, Chen Y, Reinmuth N,
Hotta K, Trukhin D, Statsenko G, Hochmair MJ, Özgüroğlu M, Ji JH,
et al: Durvalumab plus platinum-etoposide versus platinum-etoposide
in first-line treatment of extensive-stage small-cell lung cancer
(CASPIAN): A randomised, controlled, open-label, phase 3 trial.
Lancet. 394:1929–1939. 2019. View Article : Google Scholar : PubMed/NCBI
|
|
5
|
Cui Y, Qiu T, Wang J, Liu X, Luo L, Yin J,
Zhi X, Wang W, Feng G, Wu C, et al: IFITM3 enhances
immunosensitivity via MHC-I regulation and is associated with the
efficacy of anti-PD-1/-L1 therapy in SCLC. Mol Cancer. 24:1872025.
View Article : Google Scholar : PubMed/NCBI
|
|
6
|
Lu Y, Li H, Zhao P, Wang X, Shao W, Liu Y,
Tian L, Zhong R, Liu H and Cheng Y: Crosstalk between
cancer-associated fibroblasts and non-neuroendocrine tumor cells in
small cell lung cancer involves in glycolysis and
antigen-presenting features. Mol Med. 30:2742024. View Article : Google Scholar : PubMed/NCBI
|
|
7
|
Boullier C, Lamaze FC, Haince JF, Bux RA,
Orain M, Zheng J, Zhang L, Wishart DS, Bossé Y, Manem VSK and
Joubert P: Metabolomic profiling of pulmonary neuroendocrine
neoplasms. Cancers (Basel). 16:31792024. View Article : Google Scholar : PubMed/NCBI
|
|
8
|
Ding XJ, Mei T, Xi XN, Wang JY, Wang WJ,
Chen Y, Lu YX, Qin TT and Huang DZ: ACT001 suppresses the malignant
progression of Small-cell lung cancer by inhibiting lactate
production and promoting Anti-tumor immunity. Thoracic Cancer.
16:e700282025. View Article : Google Scholar : PubMed/NCBI
|
|
9
|
Ma J, Tang L, Tan Y, Xiao J, Wei K, Zhang
X, Ma Y, Tong S, Chen J, Zhou N, et al: Lithium carbonate
revitalizes tumor-reactive CD8+ T cells by shunting lactic acid
into mitochondria. Nat Immunol. 25:552–561. 2024. View Article : Google Scholar : PubMed/NCBI
|
|
10
|
Zhang D, Tang Z, Huang H, Zhou G, Cui C,
Weng Y, Liu W, Kim S, Lee S, Perez-Neut M, et al: Metabolic
regulation of gene expression by histone lactylation. Nature.
574:575–580. 2019. View Article : Google Scholar : PubMed/NCBI
|
|
11
|
Shang X, Cheng B, Zhang C, Zhao C, Wang R,
Zhang X, Jiang D, Zhang X, Ma X, Mao H, et al: The
LDH-H3K18La-Nur77 axis potentiates immune escape in small cell lung
cancer. Adv Sci (Weinh). 12:e136082025. View Article : Google Scholar : PubMed/NCBI
|
|
12
|
De Leo A, Ugolini A, Yu X, Scirocchi F,
Scocozza D, Peixoto B, Pace A, D'Angelo L, Liu JKC, Etame AB, et
al: Glucose-driven histone lactylation promotes the
immunosuppressive activity of monocyte-derived macrophages in
glioblastoma. Immunity. 57:1105–1123.e8. 2024. View Article : Google Scholar : PubMed/NCBI
|
|
13
|
Huang ZW, Zhang XN, Zhang L, Liu LL, Zhang
JW, Sun YX, Xu JQ, Liu Q and Long ZJ: STAT5 promotes PD-L1
expression by facilitating histone lactylation to drive
immunosuppression in acute myeloid leukemia. Signal Transduct
Target Ther. 8:3912023. View Article : Google Scholar : PubMed/NCBI
|
|
14
|
Zhang C, Zhou L, Zhang M, Du Y, Li C, Ren
H and Zheng L: H3K18 lactylation potentiates immune escape of
Non-small cell lung cancer. Cancer Res. 84:3589–3601. 2024.
View Article : Google Scholar : PubMed/NCBI
|
|
15
|
Larsson SC and Burgess S: Appraising the
causal role of smoking in multiple diseases: A systematic review
and meta-analysis of Mendelian randomization studies. EBioMedicine.
82:1041542022. View Article : Google Scholar : PubMed/NCBI
|
|
16
|
Li Y, Sundquist K, Zhang N, Wang X,
Sundquist J and Memon AA: Mitochondrial related genome-wide
Mendelian randomization identifies putatively causal genes for
multiple cancer types. EBioMedicine. 88:1044322023. View Article : Google Scholar : PubMed/NCBI
|
|
17
|
Zhou L, Gao H, Zhang J, Xu Q, Wang Q, Wang
L, Tan Y, Luo Z, Zhou J, Shuai H, et al: Metabolic syndrome and
cancer risk: A two-sample Mendelian randomization study of European
ancestry. Int J Surg. 111:311–321. 2025. View Article : Google Scholar : PubMed/NCBI
|
|
18
|
Wu J, Yang Z, Ding J, Hao S, Chen H, Jin
K, Zhang C and Zheng X: Proteome-wide Mendelian randomization
identifies causal plasma proteins in prostate cancer development.
Hum Genomics. 19:172025. View Article : Google Scholar : PubMed/NCBI
|
|
19
|
Zhang N, Li Y, Sundquist J, Sundquist K
and Ji J: Identifying actionable druggable targets for breast
cancer: Mendelian randomization and population-based analyses.
EBioMedicine. 98:1048592023. View Article : Google Scholar : PubMed/NCBI
|
|
20
|
Yao W, Hu X and Wang X: Crossing
epigenetic frontiers: The intersection of novel histone
modifications and diseases. Signal Transduct Target Ther.
9:2322024. View Article : Google Scholar : PubMed/NCBI
|
|
21
|
Bao C, Ma Q, Ying X, Wang F, Hou Y, Wang
D, Zhu L, Huang J and He C: Histone lactylation in macrophage
biology and disease: From plasticity regulation to therapeutic
implications. EBioMedicine. 111:1055022025. View Article : Google Scholar : PubMed/NCBI
|
|
22
|
Jiao Y, Ji F, Hou L, Lv Y and Zhang J:
Lactylation-related gene signature for prognostic prediction and
immune infiltration analysis in breast cancer. Heliyon.
10:e247772024. View Article : Google Scholar : PubMed/NCBI
|
|
23
|
Wang Y, Li P, Xu Y, Feng L, Fang Y, Song
G, Xu L, Zhu Z, Wang W, Mei Q and Xie M: Lactate metabolism and
histone lactylation in the central nervous system disorders:
Impacts and molecular mechanisms. J Neuroinflammation. 21:3082024.
View Article : Google Scholar : PubMed/NCBI
|
|
24
|
George J, Lim JS, Jang SJ, Cun Y, Ozretić
L, Kong G, Leenders F, Lu X, Fernández-Cuesta L, Bosco G, et al:
Comprehensive genomic profiles of small cell lung cancer. Nature.
524:47–53. 2015. View Article : Google Scholar : PubMed/NCBI
|
|
25
|
Cai L, Liu H, Huang F, Fujimoto J, Girard
L, Chen J, Li Y, Zhang YA, Deb D, Stastny V, et al: Cell-autonomous
immune gene expression is repressed in pulmonary neuroendocrine
cells and small cell lung cancer. Commun Biol. 4:3142021.
View Article : Google Scholar : PubMed/NCBI
|
|
26
|
Liu Q, Zhang J, Guo C, Wang M, Wang C, Yan
Y, Sun L, Wang D, Zhang L, Yu H, et al: Proteogenomic
characterization of small cell lung cancer identifies biological
insights and subtype-specific therapeutic strategies. Cell.
187:184–203.e8. 2024. View Article : Google Scholar : PubMed/NCBI
|
|
27
|
Newman AM, Liu CL, Green MR, Gentles AJ,
Feng W, Xu Y, Hoang CD, Diehn M and Alizadeh AA: Robust enumeration
of cell subsets from tissue expression profiles. Nat Methods.
12:453–457. 2015. View Article : Google Scholar : PubMed/NCBI
|
|
28
|
Becht E, Giraldo NA, Lacroix L, Buttard B,
Elarouci N, Petitprez F, Selves J, Laurent-Puig P, Sautès-Fridman
C, Fridman WH and de Reyniès A: Estimating the population abundance
of tissue-infiltrating immune and stromal cell populations using
gene expression. Genome Biol. 17:2182016. View Article : Google Scholar : PubMed/NCBI
|
|
29
|
Racle J, de Jonge K, Baumgaertner P,
Speiser DE and Gfeller D: Simultaneous enumeration of cancer and
immune cell types from bulk tumor gene expression data. ELife.
6:e264762017. View Article : Google Scholar : PubMed/NCBI
|
|
30
|
Finotello F, Mayer C, Plattner C,
Laschober G, Rieder D, Hackl H, Krogsdam A, Loncova Z, Posch W,
Wilflingseder D, et al: Correction to: Molecular and
pharmacological modulators of the tumor immune contexture revealed
by deconvolution of RNA-seq data. Genome Med. 11:502019. View Article : Google Scholar : PubMed/NCBI
|
|
31
|
Aran D, Hu Z and Butte AJ: xCell:
Digitally portraying the tissue cellular heterogeneity landscape.
Genome Biol. 18:2202017. View Article : Google Scholar : PubMed/NCBI
|
|
32
|
Griffith M, Griffith OL, Coffman AC,
Weible JV, McMichael JF, Spies NC, Koval J, Das I, Callaway MB,
Eldred JM, et al: DGIdb: Mining the druggable genome. Nat Methods.
10:1209–1210. 2013. View Article : Google Scholar : PubMed/NCBI
|
|
33
|
Jin Y, Xiao T, Feng Y, Yang J, Guo C, Hu L
and Ji H: A mesenchymal-like subpopulation in non-neuroendocrine
SCLC contributes to metastasis. J Genet Genomics. 48:571–581. 2021.
View Article : Google Scholar : PubMed/NCBI
|
|
34
|
Li J, Tang M, Gao X, Tian S and Liu W:
Mendelian randomization analyses explore the relationship between
cathepsins and lung cancer. Commun Biol. 6:10192023. View Article : Google Scholar : PubMed/NCBI
|
|
35
|
Li F, Si W, Xia L, Yin D, Wei T, Tao M,
Cui X, Yang J, Hong T and Wei R: Positive feedback regulation
between glycolysis and histone lactylation drives oncogenesis in
pancreatic ductal adenocarcinoma. Mol Cancer. 23:902024. View Article : Google Scholar : PubMed/NCBI
|
|
36
|
Li W, Zhou C, Yu L, Hou Z, Liu H, Kong L,
Xu Y, He J, Lan J, Ou Q, et al: Tumor-derived lactate promotes
resistance to bevacizumab treatment by facilitating autophagy
enhancer protein RUBCNL expression through histone H3 lysine 18
lactylation (H3K18la) in colorectal cancer. Autophagy. 20:114–130.
2024. View Article : Google Scholar : PubMed/NCBI
|
|
37
|
Zhu R, Ye X, Lu X, Xiao L, Yuan M, Zhao H,
Guo D, Meng Y, Han H, Luo S, et al: ACSS2 acts as a lactyl-CoA
synthetase and couples KAT2A to function as a lactyltransferase for
histone lactylation and tumor immune evasion. Cell Metab.
37:361–376.e7. 2025. View Article : Google Scholar : PubMed/NCBI
|
|
38
|
Zhang R, Gao X, Zuo J, Hu B, Yang J, Zhao
J and Chen J: STMN1 upregulation mediates hepatocellular carcinoma
and hepatic stellate cell crosstalk to aggravate cancer by
triggering the MET pathway. Cancer Sci. 111:406–417. 2020.
View Article : Google Scholar : PubMed/NCBI
|
|
39
|
Qian L, Cairong Z, Yongdong L, Quan L,
Haihu Z, Xiaofeng Z, Xuan Y, Yongcheng C, Kai C, Guanming L and Jie
L: Prognostic role of STMN1 expression and neoadjuvant therapy
efficacy in breast cancer. BMC Cancer. 25:4532025. View Article : Google Scholar : PubMed/NCBI
|
|
40
|
Ge S, Cen J, Liu X, Hong Y, Tang Y, Yu Y,
Li H, Xie T, Wang C, Cai M, et al: TGFβ-activated Asporin interacts
with STMN1 to promote prostate cancer docetaxel chemoresistance and
metastasis by upregulating the Wnt/β-catenin signaling pathway.
Drug Resist Updat. 81:1012272025. View Article : Google Scholar : PubMed/NCBI
|
|
41
|
Wang J, Ni X, Shen S, Zhang D, Ni X, Suo
T, Lu P, Fan K and Liu H and Liu H: Phosphorylation at Ser10
triggered p27 degradation and promoted gallbladder carcinoma cell
migration and invasion by regulating stathmin1 under glucose
deficiency. Cell Signal. 80:1099232021. View Article : Google Scholar : PubMed/NCBI
|
|
42
|
Bi C, Cui H, Fan H and Li L: LncRNA
LINC01116 promotes the development of colorectal cancer by
targeting miR-9-5p/STMN1. Onco Targets Ther. 13:10547–10558. 2020.
View Article : Google Scholar : PubMed/NCBI
|
|
43
|
Wang S, Su T, Tong H, Zhou D, Ma F, Ding
J, Hao Y, Shi W and Quan Z: Circβ-catenin promotes tumor growth and
Warburg effect of gallbladder cancer by regulating STMN1
expression. Cell Death Discov. 7:2332021. View Article : Google Scholar : PubMed/NCBI
|
|
44
|
Zhang Y, Wei S, Zhang Q, Zhang Y and Sun
C: Paris saponin VII inhibits triple-negative breast cancer by
targeting the MEK/ERK/STMN1 signaling axis. Phytomedicine.
130:1557462024. View Article : Google Scholar : PubMed/NCBI
|
|
45
|
Tan S, Kang Y, Li H, He HQ, Zheng L, Wu
SQ, Ai K, Zhang L, Xu R, Zhang XZ, et al: circST6GALNAC6 suppresses
bladder cancer metastasis by sponging miR-200a-3p to modulate the
STMN1/EMT axis. Cell Death Dis. 12:1682021. View Article : Google Scholar : PubMed/NCBI
|
|
46
|
Cheng Z, Huang H, Li M, Liang X, Tan Y and
Chen Y: Lactylation-related gene signature effectively predicts
prognosis and treatment responsiveness in hepatocellular carcinoma.
Pharmaceuticals (Basel). 16:6442023. View Article : Google Scholar : PubMed/NCBI
|
|
47
|
Dai L, Fan G, Xie T, Li L, Tang L, Chen H,
Shi Y and Han X: Single-cell and spatial transcriptomics reveal a
high glycolysis B cell and tumor-associated macrophages cluster
correlated with poor prognosis and exhausted immune
microenvironment in diffuse large B-cell lymphoma. Biomark Res.
12:582024. View Article : Google Scholar : PubMed/NCBI
|
|
48
|
Kong X, Zhang J, Chen S, Wang X, Xi Q,
Shen H and Zhang R: Immune checkpoint inhibitors: Breakthroughs in
cancer treatment. Cancer Biol Med. 21:451–472. 2024.PubMed/NCBI
|
|
49
|
Chen W, Zhao W, Wu X, Fang T, Chen Z, Chen
Z, Su W, Zhao X, Hu Y, Xu Y, et al: circFOXK2 Stabilizes STMN1 mRNA
via PABPC1 to promote the progression of NSCLC. Cancer Med.
14:e707292025. View Article : Google Scholar : PubMed/NCBI
|
|
50
|
Liao L, Zhang YL, Deng L, Chen C, Ma XY,
Andriani L, Yang SY, Hu SY, Zhang FL, Shao ZM and Li DQ: Protein
phosphatase 1 subunit PPP1R14B stabilizes STMN1 to promote
progression and paclitaxel resistance in Triple-negative breast
cancer. Cancer Res. 83:471–484. 2023. View Article : Google Scholar : PubMed/NCBI
|