Introduction
Alzheimer's disease (AD), a gradual
neurodegenerative condition, is the leading cause of dementia and
places a notable burden on health worldwide (1). Initially presenting as mild memory
deficits, AD advances to cause marked cognitive impairment,
personality changes and language dysfunction, severely compromising
the quality of life and independence of patients (2).
Advancements in biomarker research have markedly
enhanced AD diagnosis. Positron emission tomography (PET) scans,
along with plasma measurements of amyloid β (Aβ) and p-tau
proteins, have emerged as notable diagnostic tools (3). The Aβ42/Aβ40 ratio, along with
p-tau181 and p-tau217, have emerged as pivotal plasma biomarkers
for AD diagnosis, prognosis and pathological understanding
(4). Additionally, neurofilament
light chain (NfL) and glial fibrillary acidic protein (GFAP) have
emerged as pivotal plasma biomarkers for AD (5). These biomarkers act not just as key
resources for identifying the condition early on, but also enable
tracking of disease progression, whilst yielding important insights
into the pathological mechanisms underlying AD. In doing so, they
aid in developing therapeutic methods that are more precisely
targeted and more effective (6).
Beyond the well-characterised amyloid and tau
pathologies, AD pathophysiology involves a complex interplay of
multiple biological systems (7).
Microglial activation and astrocyte reactivity trigger
neuroinflammatory cascades, whereas vascular dysfunction and
blood-brain barrier disruption exacerbate neuronal damage (8). The peripheral immune system also
plays a notable role, with T lymphocytes and B cells infiltrating
the central nervous system, thereby promoting neuroinflammation and
synaptic loss (9). Additionally,
emerging evidence suggests that the glymphatic system, responsible
for the clearance of ‘brain waste’, and the gut microbiome may
contribute to AD development and progression (10). Substantial findings underscore the
vital function of immune dysregulation in AD (11). Specifically elevated T cell
infiltration into the brain promotes crosstalk with microglia,
intensifying neuroinflammation (12). Peripheral B lymphocytes can cross
the blood-brain barrier and interact with resident microglia and
other brain immune cells, further activating the immune response
(13). Natural killer cells,
dendritic cells and mast cells have likewise been linked to a
higher risk of AD, which underscores how crucial both innate and
adaptive immune reactions are in the development of the disease
(14).
Current AD treatments focus on managing symptoms and
slowing disease progression, including cognitive enhancement
therapies, treatment of neuropsychiatric symptoms and
disease-modifying therapies (15).
Disease-modifying treatments for AD have emerged as a marked
advancement, demonstrating remarkable potential to alter the
disease trajectory. Among these, lecanemab and donanemab, both
cutting-edge monoclonal antibodies, have garnered notable
attention. These agents specifically target and bind to β-amyloid
proteins, initiating a cascade of events that facilitate the
clearance of these pathogenic aggregates (16). However, despite ongoing research
efforts, no cure exists, and several experimental drugs have shown
limited efficacy (17). This
highlights the pressing requirement for innovative approaches to
diagnosis and treatment.
Despite these advancements, the lack of curative
treatments and limited early diagnostic tools underscores the need
for robust biomarkers capable of detecting AD at pre-symptomatic or
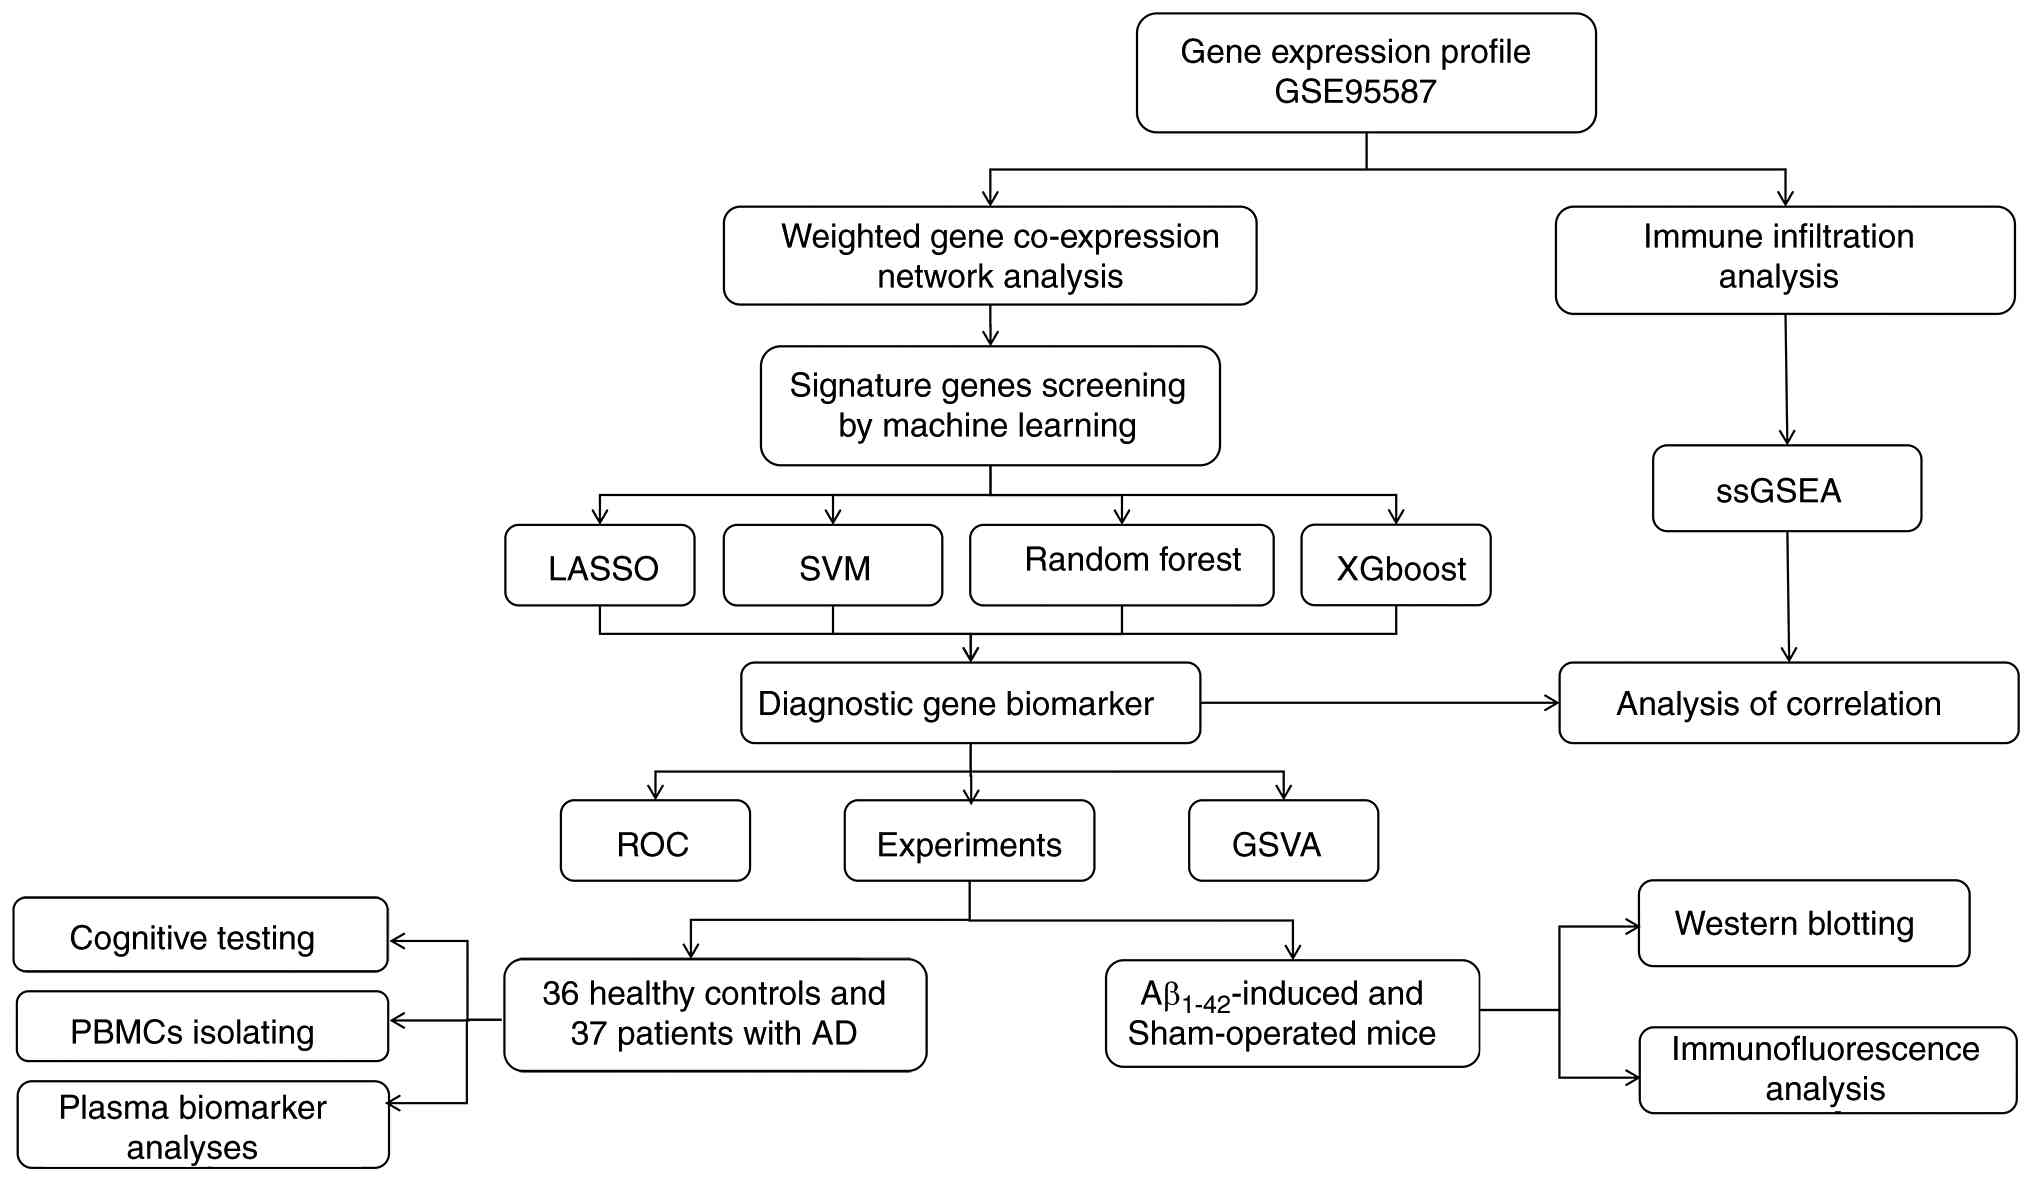
prodromal stages. In the present study, Weighted Gene Co-expression
Network Analysis (WGCNA) was used in combination with machine
learning methods to identify new candidate hub genes associated
with AD progression. A comprehensive flowchart illustrating the
study's procedure is presented in Fig.
1. The aim of the present study was to identify novel targets
for clinical diagnosis and treatment, potentially paving the way
for more effective interventions to combat AD.
Materials and methods
Data acquisition and WGCNA
To verify the diagnostic value of the candidate
biomarkers, the GSE95587 dataset (18) was selected from Gene Expression
Omnibus. This dataset consists of 117 fusiform gyrus tissue
samples: 33 from neurologically normal, age-matched controls and 84
from autopsy-confirmed patients with AD.
To elucidate the potential association between
clinical information and key genes, disease-related modules and key
driver genes, from the perspective of gene co-expression networks,
were analysed. First, to ensure analytical reliability, rigorous
quality control was performed on the raw expression matrix using
the ‘goodSamplesGenes’ function from the WGCNA package (19). This step filtered out samples and
genes with missing values, zero variance or identified as outliers
(specifically, sample GSM2516858 was detected and removed as an
outlier, while all genes passed the aforementioned criteria),
thereby ensuring the robustness of subsequent network construction.
Subsequently, a scale-free gene co-expression network was
constructed using the WGCNA method. This approach effectively
captured coordinated expression patterns among genes, clustering
functionally related genes into modules, to serve as a powerful
computational biology tool for identifying core gene sets in
disease mechanisms.
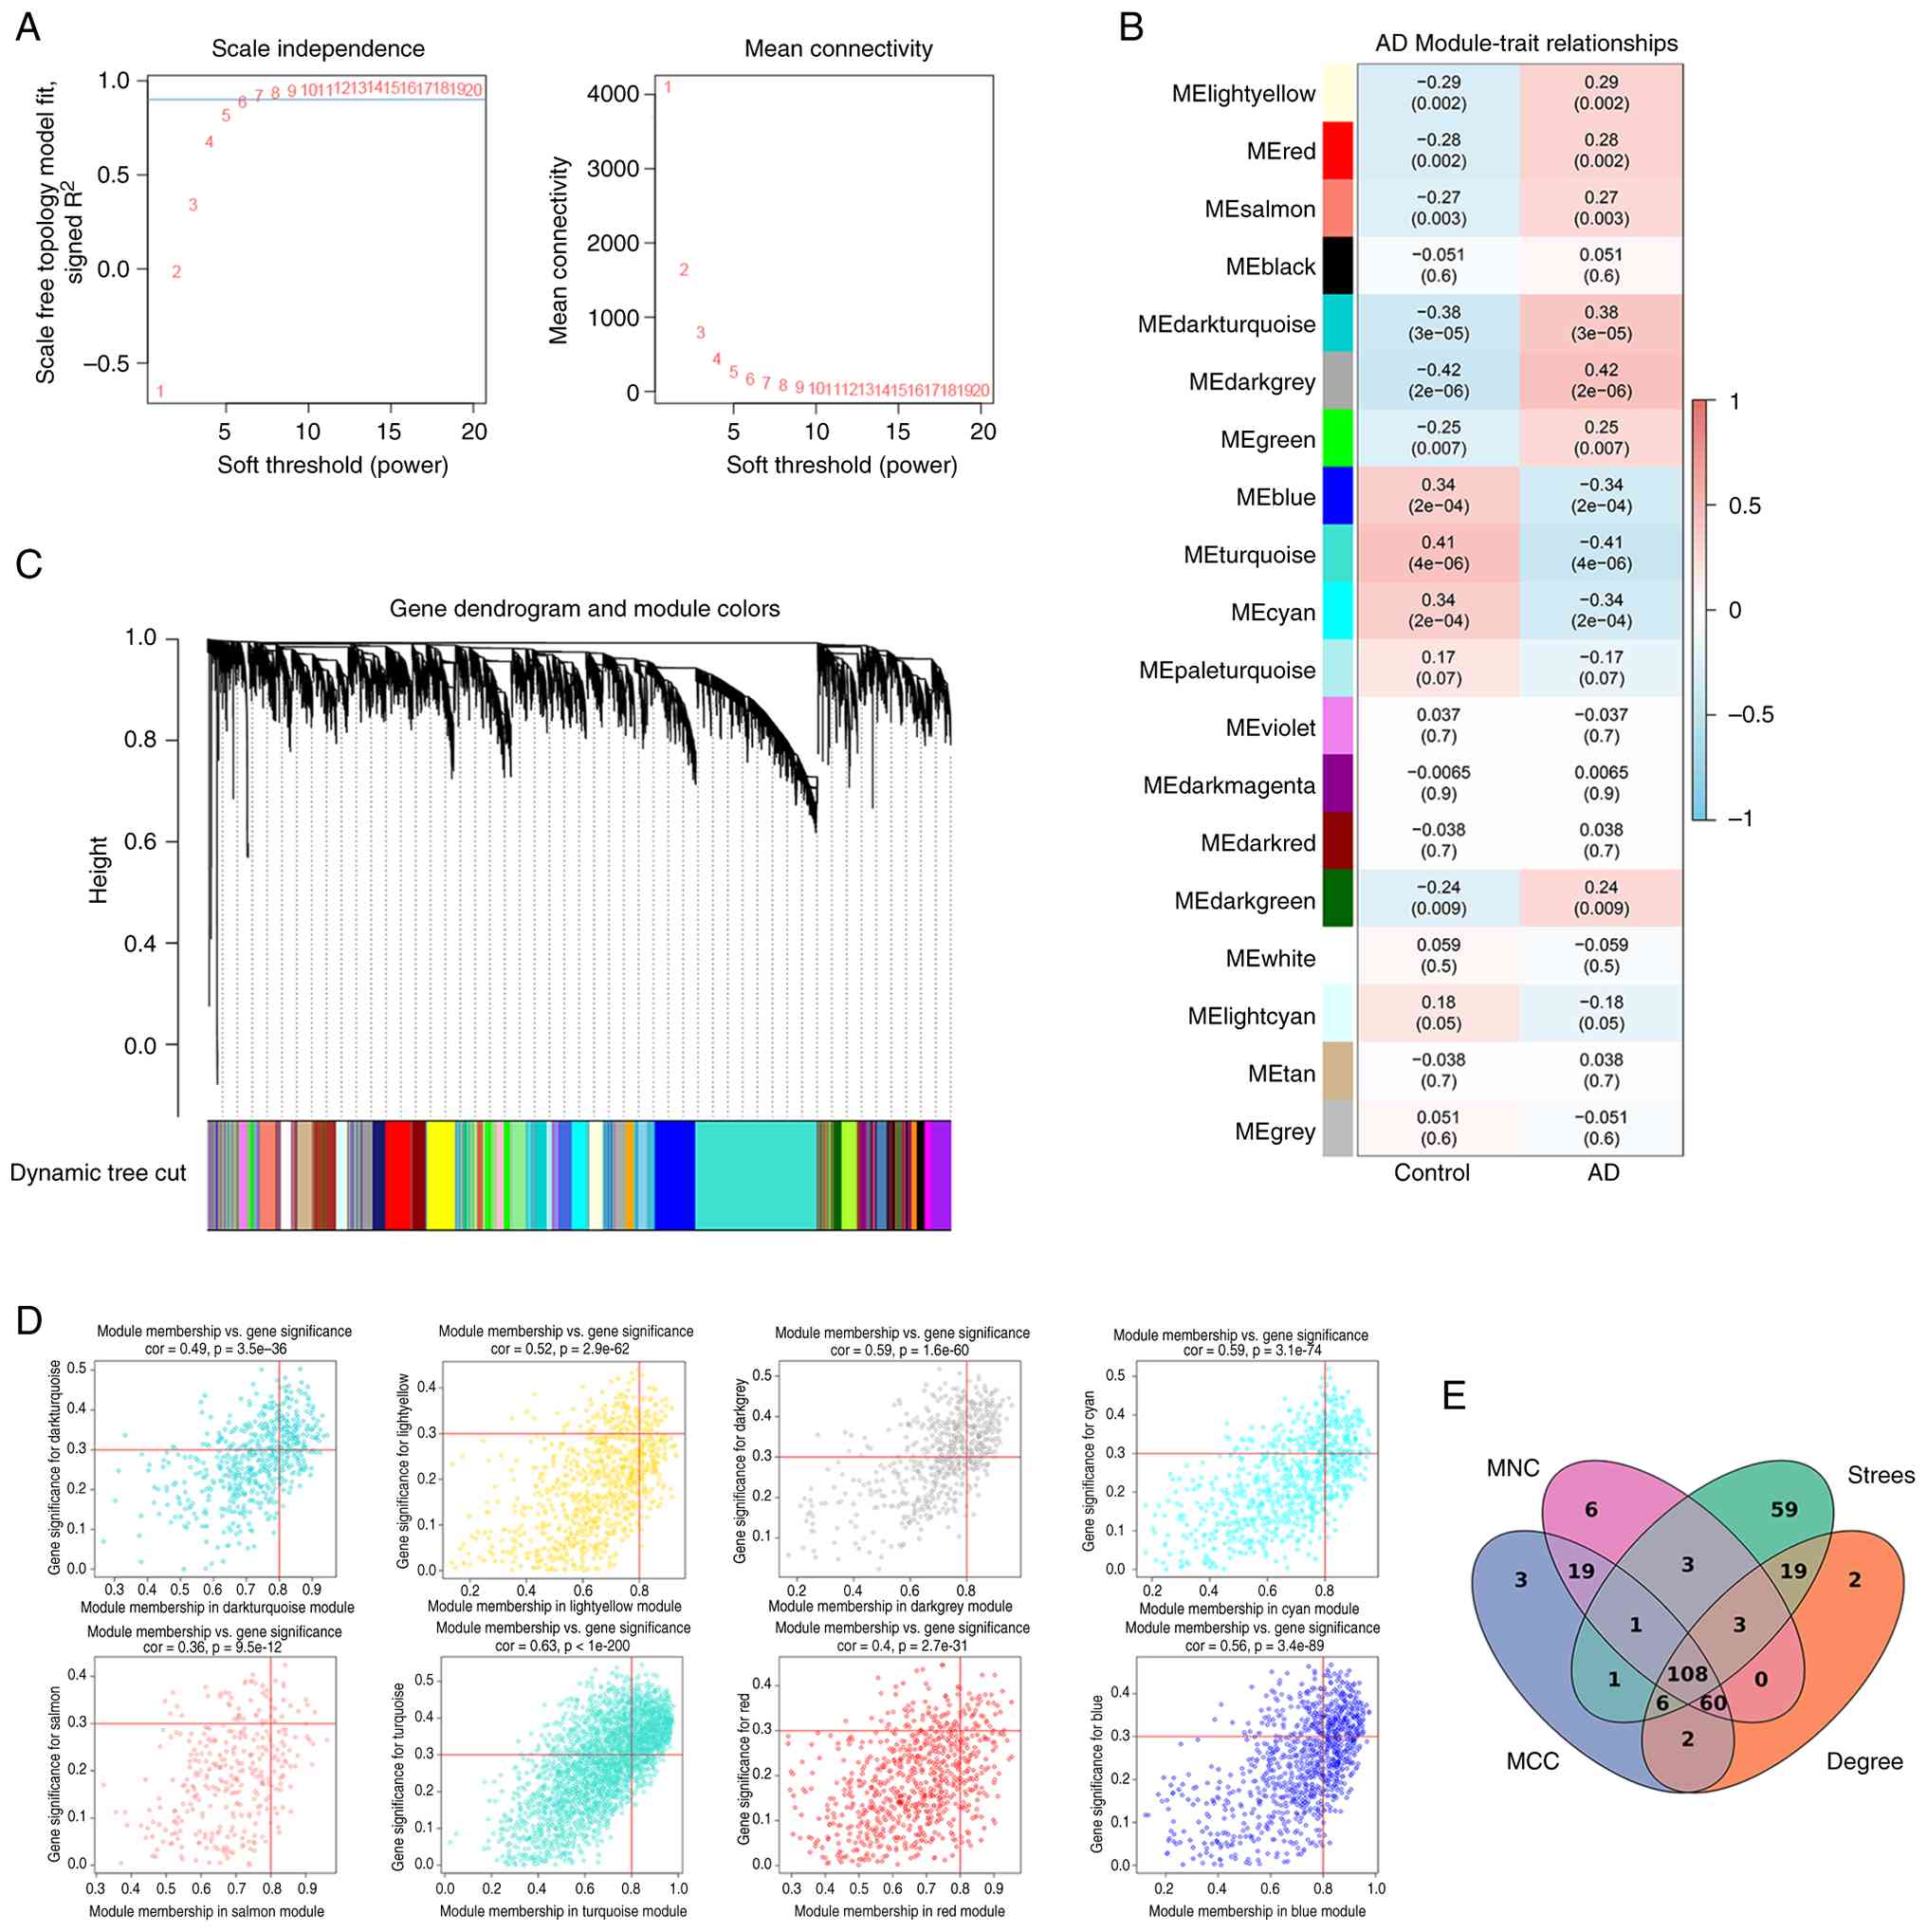
During WGCNA, the scale-free topology fit index was
evaluated under different soft-thresholding powers. The optimal
soft-thresholding power was determined to be β=7, which achieved a
scale-free topology fit index (R2)>0.9, satisfying
the prerequisite for constructing a scale-free network. To capture
network topology beyond direct connections, the adjacency matrix
was converted into a Topological Overlap Matrix. Gene modules were
then preliminarily identified through hierarchical clustering
combined with a dynamic tree-cutting algorithm. To streamline the
network and enhance biological interpretability, the module
eigengene dissimilarity was set to a cutoff of 0.25 (corresponding
to a correlation of >0.75), and markedly similar modules were
merged. Finally, Pearson's correlation coefficients were calculated
between each module eigengene and the AD status (case vs. control).
Modules demonstrating a significant association with the disease
(|R|>0.25 and P<0.01) were selected. The genes within these
significantly correlated modules were designated as candidate key
genes for subsequent in-depth study. Furthermore, single-sample
gene set enrichment analysis was conducted to quantify the
immune-related pathway enrichment levels across individual samples,
utilizing the GSVA R package. This analysis aimed to explore the
potential correlation between AD-associated co-expression modules
and the local immune microenvironment, thereby providing a
biological rationale for subsequent immune infiltration validation.
Genes within the significantly correlated modules were subsequently
used for protein-protein interaction (PPI) network construction and
hub gene identification. The STRING database (http://string-db.org) was used to establish the PPI
network structure. The topological properties of the PPI network
were identified using the cytoHubba plugin for Cytoscape (20). A medium confidence threshold
(>0.9) was applied to guarantee the reliability of the results.
The top 200 genes were selected to intersect through four
algorithms (Degree, Maximum Neighbourhood Component, Maximal Clique
Centrality and Stress Centrality), and 108 key genes were obtained,
which were used as the focus for subsequent research.
Screening of candidate hub genes via
machine learning
In the present study, four machine learning
algorithms were employed to identify key hub genes associated with
AD: Least Absolute Shrinkage and Selection Operator (LASSO),
Support Vector Machine-Recursive Feature Elimination (SVM-RFE),
Random Forest (RF) and Extreme Gradient Boosting (XGBoost).
LASSO regression refines the least squares method,
excelling at selecting minimal features from available data, thus
reducing overfitting (21). SVM
stands as a flexible method applicable to both regression and
classification tasks. Leveraging the kernel trick, it maps input
vectors to a higher-dimensional space, constructing an optimal
hyperplane for data separation (22). XGBoost, a leading boosting
algorithm, minimises the loss function by iteratively adjusting
sample and feature weights. This enables it to efficiently process
large datasets with numerous features (23). RF, a type of ensemble method,
constructs numerous decision trees using different subsets of the
data. The final prediction is derived from majority voting, and it
can quantify feature importance while being robust to feature
scaling and easy to tune (24).
The intersecting genes across the four machine learning models were
identified as AD-related hub genes.
Validation of candidate genes and
development of diagnostic models
The pROC package (25) was used to build diagnostic models
for single genes and gene combinations. The discriminatory power of
hub genes as assessed by receiver operating characteristic (ROC)
curves. By calculating the area under the curve (AUC), the
diagnostic value was assessed; AUCs >0.7 were deemed indicative
of a superior diagnostic marker.
Immune infiltration assessment
CIBERSORT is a computational approach that enables
accurate quantification of cellular composition using extensive
tissue gene expression data generated by RNA sequencing. In the
present study, the CIBERSORT tool (https://cibersort.stanford.edu/) was used to estimate
the relative abundance of 22 distinct immune cell types in the
dataset. The findings were visualised as bar charts to illustrate
the proportion of each immune cell type across different samples.
Furthermore, a t-test was used to compare how immune cell
distribution differed between patients with AD and healthy control
subjects. P<0.05 was considered to indicate a statistically
significant difference.
Gene set variation analysis
(GSVA)
GSVA is a nonparametric, unsupervised method that
evaluates shifts in gene set activity across diverse samples. In
the present study, the enrichment levels of these pathways in
normal vs. AD samples were examined. To quantify pathway scores
within the samples, enrichment analyses were conducted using the R
package GSVA (26). Subsequently,
a two-tailed Student's t-test was used to assess differences in
GSVA scores between the two experimental groups. Additionally,
Pearson's correlation coefficient was calculated to evaluate the
linear association between gene expression levels and pathway
scores.
Animal experiments
The present study complied with the National
Institutes of Health guidelines for the ethical use of animals in
research. All animal studies were implemented in accordance with
protocols approved by the Animal Care and Use Committee of Harbin
Medical University (approval no. 2024047), and all experiments
adhered to the ARRIVE guidelines for in vivo research.
Experiments were performed using 90-day-old male C57BL/6J mice
(25–30 g), purchased from Liaoning Changsheng Biotechnology Co.,
Ltd., and housed in the Animal Facility of The First Affiliated
Hospital of Harbin Medical University (Harbin, China). Consistent
with previous studies (27), male
mice were used in the present study to minimize variability
associated with the estrous cycle and to reduce confounding factors
during behavioural testing. The animals were maintained under a
12-h light/dark cycle, with unrestricted access to food and water;
all procedures were performed during the light period. The total
experimental duration was ~3 to 4 weeks. A total of 24 male mice
were randomly assigned to two groups (n=12 per group): Sham and
model. Throughout the study, mice were monitored daily for signs of
distress or abnormal behaviour. Humane endpoints were defined as
marked weight loss (>20%), persistent lethargy, inability to
ambulate or feed or other signs of severe morbidity, at which point
animals would be euthanized; however, no animals died or were
euthanized prematurely during the study. All mice were euthanized
at the experimental endpoint for tissue collection. For western
blot analysis, mice were deeply anesthetized with isoflurane and
euthanized by cervical dislocation. For histological and
immunofluorescence analyses, mice were deeply anesthetized with
isoflurane and euthanized by transcardial perfusion with saline
followed by 4% paraformaldehyde (PFA). Death was confirmed by
cessation of heartbeat and systemic rigidity (following perfusion)
or by absence of respiration and pupillary dilation (following
cervical dislocation), in accordance with standard protocols. Every
effort was made to minimise animal distress and limit the number of
animals used.
Animal grouping and establishment of
the AD model
Mice were randomly assigned to one of two groups:
The sham group received an intracerebroventricular (i.c.v.)
injection of PBS, and the model group received an i.c.v. injection
of Aβ1-42 peptide solution.
Aβ1-42 (MedChemExpress) was solubilised
in sterile 0.1 M PBS (pH 7.4) at a concentration of 1 mg/ml,
aliquoted, and stored at −20°C. Prior to use, the peptide was
aggregated by incubation at 37°C for 4 days, as previously
described (28). Aggregated
Aβ1-42 (400 pmol per mouse in 3 µl PBS) or an equal
volume of PBS for sham controls was delivered via i.c.v. injection.
For the surgery, mice were anesthetised with 60 mg/kg
intraperitoneal sodium pentobarbital and positioned in a
stereotaxic frame. A unilateral injection into the right lateral
ventricle was performed using a 28-gauge Hamilton microsyringe
(needle length: 3.0 mm) (29).
Injection coordinates relative to bregma were
anterior-posterior=0.1 mm, medial-lateral=1 mm and dorsal-ventral=3
mm; the 3 µl volume was delivered at 1 µl/min (30). The needle was left in place for an
additional 5 min before slowly withdrawing to prevent backflow.
Sham-operated mice received an i.c.v. injection of an equal volume
of PBS.
Morris water maze (MWM) test
MWM test, consisting of a 5-day spatial acquisition
phase and a 1-day probe trial, was performed to evaluate Aβ-induced
spatial learning and memory deficits in mice (n=6 per group)
(31). During spatial acquisition,
mice were trained 3 times daily for 5 days (20 min intervals
between trials). In each trial, they were placed in a
180-cm-diameter circular tank and tasked with finding a
10-cm-diameter platform submerged 2 cm below the water surface in
the target quadrant. Once found, mice were allowed to stay on the
platform for 10 sec; each trial was limited to 2 min. The escape
latency (sec) and path length (cm) were recorded. During the probe
trial, the platform was removed. Mice were positioned on the side
opposite to the target quadrant and allowed to explore for 1 min.
The time spent (%) and number of crossovers in the target quadrant
were measured with the same tracking system.
Haematoxylin and eosin (H&E) and
Nissl staining
Following the behavioural tests, mice were deeply
anaesthetized with isoflurane (5% for induction, maintained at 1.5%
via a nose cone) and transcardially perfused with ~20 ml ice-cold
0.9% saline, followed by 50 ml 4% PFA in 0.1 M phosphate buffer (pH
7.4). Brains were post-fixed in 4% PFA at 4°C for 24 h,
cryoprotected in 30% sucrose at 4°C until they sank and then
sectioned coronally at 5 µm using a freezing microtome.
For H&E staining, paraffin-embedded tissue
sections were deparaffinised in xylene and rehydrated through a
graded ethanol series (100, 95 and 70%) at room temperature.
Sections were stained with Harris haematoxylin for 5 min at room
temperature, rinsed in tap water, differentiated in 0.5%
hydrochloric acid in 70% ethanol for 10 sec, briefly washed in tap
water and counterstained with eosin Y for 2 min at room
temperature. Sections were then dehydrated through graded ethanol
(70, 95 and 100%) at room temperature, cleared in xylene for 5 min,
and mounted with coverslips using a resinous mounting medium. For
Nissl staining, sections were stained with 0.1% cresyl violet
acetate solution for 10 min at room temperature, rinsed briefly in
distilled water, differentiated in 95% ethanol containing acetic
acid until background staining was clear, dehydrated through 95%
and absolute ethanol at room temperature, cleared in xylene for 5
min and mounted on coverslips. All stained sections were examined
under a light microscope to assess general tissue morphology and
neuronal cytoarchitecture.
Western blot analysis
Mice from each group (n=3 per group) were deeply
anaesthetized with isoflurane and euthanized by cervical
dislocation. The brains were rapidly removed, and the prefrontal
cortex and hippocampus were dissected on a chilled plate. Tissues
were immediately snap-frozen in liquid nitrogen and stored at −80°C
until analysis. Tissues were homogenized in ice-cold RIPA lysis
buffer (Beyotime Biotechnology) supplemented with protease and
phosphatase inhibitors. After centrifugation at 12,000 × g for 15
min at 4°C, the supernatants were collected as protein extracts.
Protein concentration was determined using a BCA protein assay kit
(Beyotime Biotechnology) according to the manufacturer's
instructions. Equal amounts of protein (30 µg per lane) were
fractionated by 10% SDS-PAGE and transferred to PVDF membranes.
After blocking with 5% non-fat dry milk (Biosharp Life Sciences) in
Tris-buffered saline with 0.1% (v/v) Tween-20 buffer for 1 h at
room temperature, membranes were incubated overnight at 4°C with
primary antibodies against ASF/SF2 (1:1,000; cat. no. 12929-2-AP;
ProteinTech Group, Inc.) and β-actin (1:10,000; cat. no.
66009-1-Ig; ProteinTech Group, Inc.). Following incubation with
HRP-conjugated secondary antibodies, (goat anti-rabbit; 1:5,000;
cat. no. 31460; Invitrogen; Thermo Fisher Scientific, Inc.) for 1 h
at room temperature, protein bands were visualised using an
enhanced chemiluminescence reagent kit (Suzhou Xinsaimei
Biotechnology Co., Ltd.). Band intensities were quantified using
ImageJ (version 1.53t; National Institutes of Health), with ASF/SF2
expression normalised to β-actin.
Immunofluorescence analysis
For immunofluorescence analysis, tissue collection
was performed via transcardial perfusion as previously described,
using mice from each group (n=3 per group). Mice brains were
dehydrated in 15 and 30% sucrose solutions for 72 h, embedded in
optimal cutting temperature compound and stored frozen at −80°C.
The brains were sectioned into 5 µm slices for immunofluorescence
staining; these sections were incubated overnight at 4°C with the
anti-ASF/SF2 antibody (1:300; cat. no. 12929-2-AP; ProteinTech
Group, Inc.). Following mounting with Antifade Mounting Medium
containing DAPI (cat. no. P0131; Beyotime Biotechnology), the
sections were treated with a FITC-conjugated AffiniPure goat
anti-rabbit IgG antibody (H+L; 1:100; cat. no. 33107ES60; Shanghai
Yeasen Biotechnology Co., Ltd.) at room temperature for 60 min.
Images were acquired using a fluorescence microscope (DMi8; Leica
Microsystems GmbH).
Patients
Between May 2024 and March 2025, 73 participants
were recruited from The First Affiliated Hospital of Harbin Medical
University: 36 healthy controls and 37 patients with AD. Inclusion
criteria for patients with AD included: i) met the 2011 NIA-AA core
diagnostic criteria (32) for
probable or possible AD; ii) aged ≥50 years; iii) Mini-Mental State
Examination (MMSE) score ≤26; iv) Clinical Dementia Rating (CDR)
score ≥0.5; and v) ability to cooperate with neuropsychological
assessments. Exclusion criteria for all participants were as
follows: i) History of traumatic brain injury, epilepsy, stroke or
other neurological disorders; ii) severe psychiatric disorders;
iii) inability to complete cognitive scale assessments; iv) brain
tumours or other structural brain lesions; v) abnormal thyroid
function or other severe systemic diseases that may affect
cognition; and vi) use of medications that may affect cognitive
function within the past 3 months.
All protocols conformed to the ethical norms
established by institutional and national research boards, in line
with the 1964 Declaration of Helsinki. The present study was
approved by the Ethics Committee of the First Affiliated Hospital
of Harbin Medical University (approval no. 2024374). Written
informed consent was acquired from the patients or their legal
representatives, and all participants underwent clinical
evaluations, neuropsychological evaluations and blood sampling.
Collection of general information and
evaluation of cognitive scales
Data on age, sex, educational background, body mass
index (BMI), hypertension, diabetes and apolipoprotein E ε4 carrier
status were extracted from medical records. The age of patients
with AD ranged from 51 to 87 years, with a median age of 68 years.
The control group ranged from 49 to 79 years, with a median age of
66 years. All participants were evaluated using the MMSE, Montreal
Cognitive Assessment (MOCA) and CDR. The CDR assessments were
conducted by professional raters at The First Affiliated Hospital
of Harbin Medical University.
Blood sampling and peripheral blood
mononuclear cells (PBMCs)
Blood samples were collected in 3-ml K2-EDTA tubes
(Becton, Dickinson and Company). PBMCs were separated using a
Ficoll-Hypaque gradient (cat. no. LTS1077; Tianjin Haoyang
Biological Products Technology Co., Ltd.), and total RNA was
extracted using a commercial kit (cat. no. M5106; Suzhou Xinsaimei
Biotechnology Co., Ltd.). RNA concentrations were measured using a
NanoDrop ND-2000, and 1 µg RNA was reverse transcribed into cDNA
using a reverse transcriptase kit (Tiangen Biotech Co., Ltd.)
following the manufacturer's instructions: incubation at 42°C for
15 min, followed by termination at 85°C for 5 sec.
Quantitative (q)PCR
qPCR was performed using a Gene 9600 system (Applied
Biosystems; Thermo Fisher Scientific, Inc.) with 2X SYBR Green qPCR
Master Mix (cat. no. FP205; Tiangen Biotech Co., Ltd.). The
thermocycling conditions were as follows: initial denaturation at
95°C for 10 min, followed by 40 cycles of denaturation at 95°C for
15 sec and annealing/extension at 60°C for 1 min. For each sample,
Serine/Arginine Rich Splicing Factor 1 (SRSF1) mRNA expression was
measured; GAPDH served as the internal control, and relative
expression levels were determined using the 2−ΔΔCq
method (33). The primer sequences
used were: SRSF1 forward, 5′-AGGGAACAACGATTGCCGCATCTAC-3′ and
reverse, 5′-ATGTCGCGGATAGCGCCGTATTTGT'; and GAPDH forward,
5′-CTGGGCTACACTGAGCACC-3′ and reverse,
5′-AAGTGGTCGTTGAGGGCAATG-3′.
Plasma collection and biomarker
analysis
Plasma p-tau181, p-tau217, GFAP, NfL, Aβ42 and Aβ40
were measured using a chemiluminescent immunoassay on a Shine i2910
(Shenzhen Yingkai Biotechnology Co., Ltd.) with commercially
available kits (Nanjing Novozymes Biotechnology Co., Ltd.):
p-tau181 (cat. no. 251201A), p-tau217 (cat. no. 260203A), GFAP
(cat. no. 251223A), NfL (cat. no. 260128A), Aβ42 (cat. no. 251223A)
and Aβ40 (cat. no. 251217A). Blood samples were collected as
previously described. Within 30 min of blood sample collection,
samples were centrifuged at 1,500 × g for 10 min at room
temperature. After centrifugation, 1 ml plasma was transferred into
1.5 ml Protein Lobind tubes (Eppendorf SE), which are designed to
minimise protein binding. The samples were then stored at −80°C
until use. All samples were thawed, processed and subjected to
standardised processing followed by analysis using a single batch
to avoid inter-batch variability.
Statistical analysis
Each experiment was repeated at least three times.
For normally distributed data, data are presented as the mean ±
standard deviation. For non-normally distributed data, are
presented as the median and interquartile range and frequencies are
presented as n (%). Group comparisons for frequencies were compared
using a χ2 test. The expression of SRSF1 across
different Braak stage classifications was analysed using a rank-sum
test. Spearman's correlation analysis was used to assess the
relationship between SRSF1 mRNA expression levels in PBMCs and
scores from MMSE, MoCA and CDR. Additionally, to further validate
the association between SRSF1 and CDR, Kendall's tau rank
correlation analysis was performed to assess the monotonic
relationship. Statistical analyses were performed using GraphPad
Prism version 8.0 (Dotmatics). Differences between two groups were
compared using a Student's t-test for normally distributed data, or
a Mann-Whitney U test for non-normally distributed data. P<0.05
was considered to indicate a statistically significant
difference.
Results
Identification of AD-associated gene
modules
To elucidate the associations between clinical
information and key genes, WGCNA was used to analyse the GSE95587
dataset. After rigorous quality control, a scale-free co-expression
network was successfully constructed using an optimal
soft-thresholding power of β=7, achieving a scale-free topology fit
index R2>0.9. Hierarchical clustering and dynamic
tree cutting identified 19 initial gene modules, which were
subsequently merged using a module eigengene dissimilarity
cut-height of 0.25 (corresponding to a correlation of >0.75) to
streamline the network.
Following the construction and merging of similar
modules, eight distinct gene co-expression modules were identified
and assigned the following colours: Dark turquoise, light yellow,
red, dark grey, salmon, blue, turquoise and cyan. Among these, the
dark grey module exhibited the strongest positive correlation with
the normal control group (r=0.42; P=2×10⁻⁶), while the
turquoise module showed the strongest negative correlations with AD
(r=−0.41; P=4×10⁻⁶) (Fig.
2). These findings highlight the potential central roles of
these modules in AD pathogenesis.
Subsequently, to identify key driver genes within
the AD-associated modules, key genes were defined using stringent
criteria: Absolute gene significance (GS)>0.3 and absolute
module membership (MM)>0.8. Through this process, 1,714 genes
showed significant associations with AD in terms of both GS and MM.
These genes were then subjected to PPI network analysis and key
gene identification as described in the methods (Fig. S1). Intersection of the top 200
genes from each of the four cytoHubba algorithms resulted in 108
common key genes for further investigation.
Identification of AD-associated
candidate genes using multiple machine learning algorithms
All models were implemented using the dataset after
quality control, consisting of 116 samples (83 AD and 33 controls)
and an initial feature set of 108 candidate genes derived from
prior WGCNA and PPI network analyses. LASSO, SVM-RFE, RF and
XGBoost algorithms were applied to the refined dataset to pinpoint
key AD-associated hub genes.
The LASSO regression model used 10-fold
cross-validation to determine the optimal penalty coefficient λ,
and the final gene subset was selected using the ‘1 standard error’
criterion (lambda.1se) to promote a more parsimonious model and
prevent overfitting. For the SVM-RFE algorithm, feature selection
was conducted within a 5-fold cross-validation framework. Features
were iteratively eliminated based on their weights, and the optimal
subset, consisting of 104 genes, was identified as the one yielding
the lowest classification error. The RF model was constructed with
1,000 decision trees, and feature importance was evaluated using
the ‘IncNodePurity’ (mean decrease in node impurity) metric. A
threshold of 0.4 was applied to select key genes, a cut-off value
determined from the distribution of feature importance scores, and
aligned with common practices in the field (34). Finally, an XGBoost model was
trained and optimised via 10-fold cross-validation. Features were
ranked according to their ‘Gain’ value, and those with a gain
>0.03 were deemed significant, following established
methodologies for threshold setting (23).
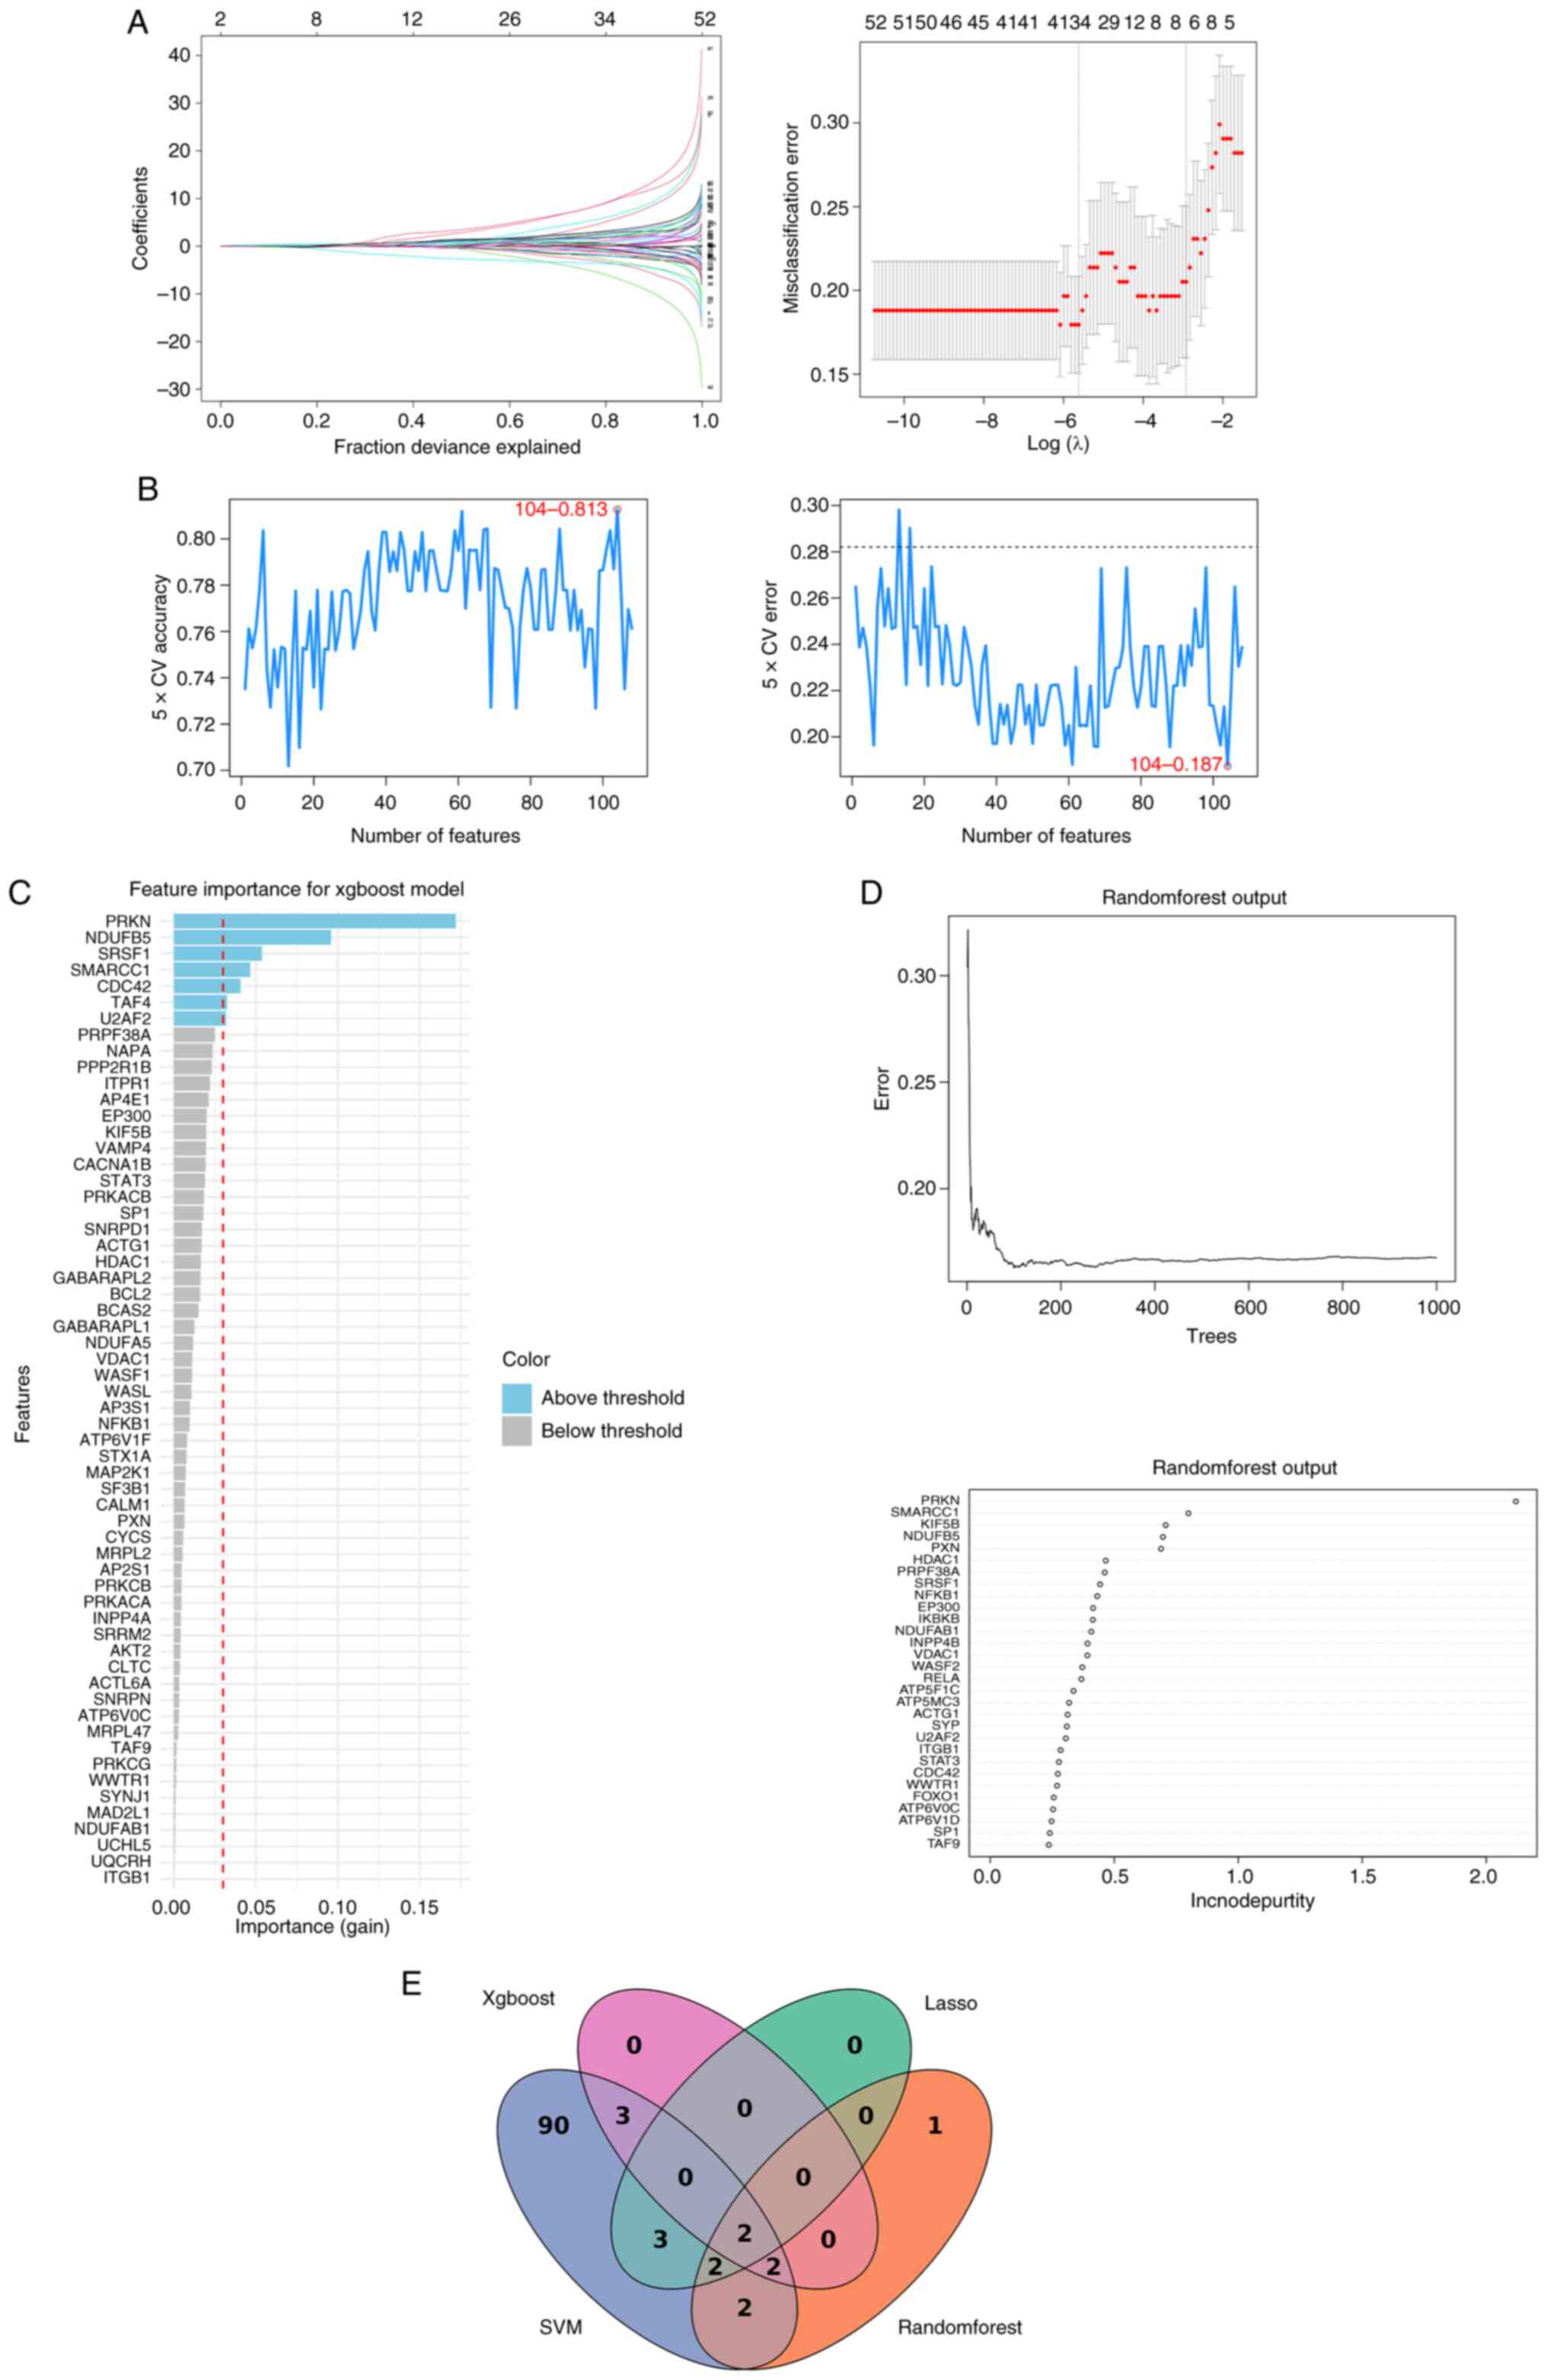
The LASSO regression analysis identified seven
potential hub genes: ACTG1, NFKB1, SRSF1, PPP2R1B, KIF5B, NDUFB5
and IKBKB (Fig. 3A). The SVM-RFE
algorithm determined that a subset of 104 genes yielded the minimum
root mean square error, representing an optimal feature set for
classification (Fig. 3B). The RF
algorithm, based on importance scores, provided 10 top-ranked
candidate genes implicated in AD-related biological processes:
PRKN, SMARCC1, KIF5B, NDUFB5, PXN, HDAC1, PRPF38A, SRSF1 and NFKB1
(Fig. 3C). The XGBoost algorithm
highlighted seven additional potential genes based on feature gain:
PRKN, NDUFB5, SRSF1, SMARCC1, CDC42, TAF4 and U2AF2 (Fig. 3D). To enhance the robustness of the
findings, the gene lists produced by all four algorithms were
intersected. This approach yielded two high-confidence candidate
hub genes: SRSF1 and NADH:Ubiquinone Oxidoreductase Subunit B5
(NDUFB5) (Fig. 3E). These genes
were considered to demonstrate marked potential as biomarkers or
therapeutic targets for AD.
Candidate biomarkers for AD identified
via ROC and differential expression analyses
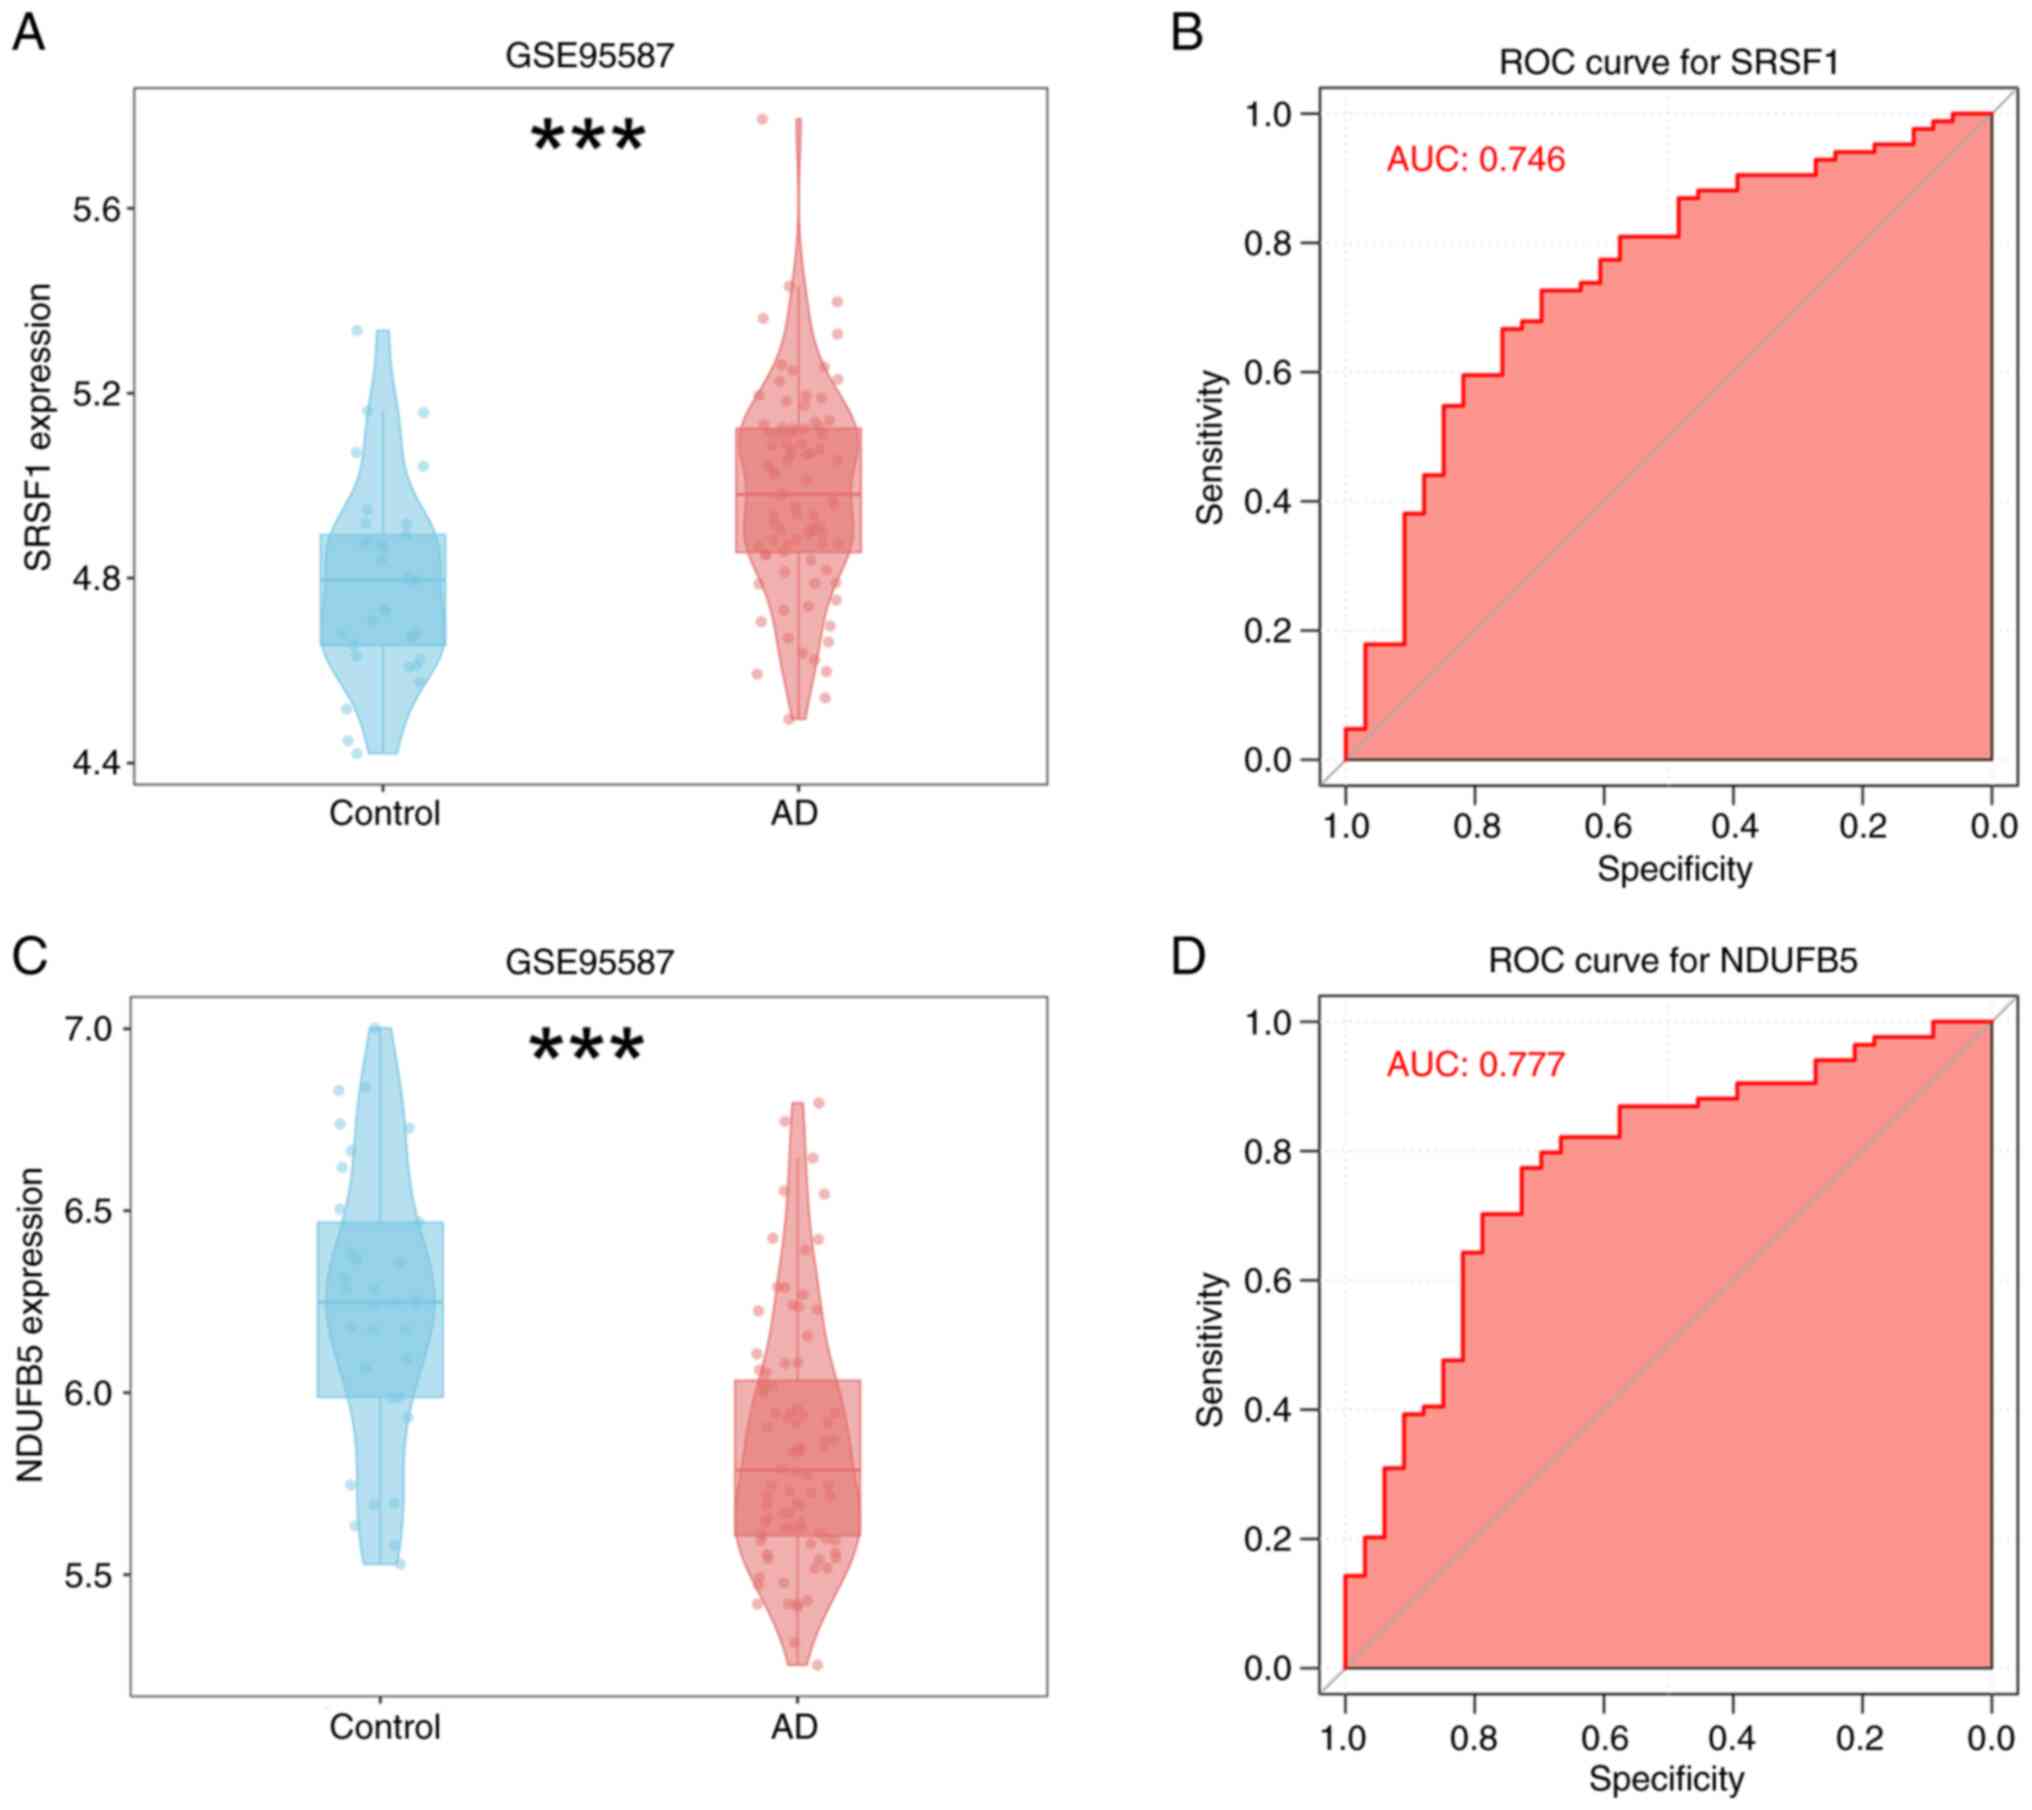
Univariate evaluation was performed on the two
identified hub genes, SRSF1 and NDUFB5, within the screening
dataset using ROC and differential expression analyses. The results
revealed that SRSF1 was significantly upregulated in AD samples
(Fig. 4A), whereas NDUFB5 was
notably downregulated (Fig. 4C).
These genes demonstrated remarkable predictive capabilities in the
screening dataset: SRSF1 achieved an AUC value of 0.746, while
NDUFB5 attained an AUC of 0.777 (Fig.
4B and D).
Immune cell dysregulation and its
association with characteristic genes in AD
To comprehensively analyse immune cell
dysregulation, a hallmark of AD, the CIBERSORT algorithm was used.
Based on linear support vector regression, CIBERSORT is a
well-established computational method for deconvoluting bulk tissue
gene expression data and estimating the relative proportions of 22
human immune cell subtypes. As shown in Fig. 5A, a marked divergence in immune
profiles was observed between AD and normal samples. Notably, 20
distinct immune cell types were detected in both groups,
establishing a basis for comparative analyses. Upon in-depth
analysis, it was observed that the abundance of several immune cell
types was significantly higher in AD samples compared with normal
controls. This list included activated B cells, activated CD4+ T
cells, activated CD8+ T cells, CD56 bright natural killer cells,
central memory CD4+ T cells, central memory CD8+ T cells, effector
memory CD8+ T cells, eosinophils, immature B cells, mast cells,
myeloid-derived suppressor cells, memory B cells, natural killer
cells, natural killer T cells, neutrophils, plasmacytoid dendritic
cells, T-helper type 1 cells, and T-helper type 17 cells (all
P<0.01). The findings revealed notable variations in the levels
of immune cell infiltration between patients with AD and healthy
individuals. A detailed heat map analysis was used to explore the
interrelationships among immune cell types. Notably, in AD samples,
natural killer cells and effector memory CD8+ T cells exhibited the
strongest positive correlation (r=0.89), suggesting a potential
cooperative role in AD immune dysregulation (Fig. 5B). Additionally, correlation
analysis (Fig. 5C) revealed a
close association between the two signature genes, SRSF1 and
NDUFB5, and immune cell abundances. Specifically, SRSF1 showed a
positive correlation with CD56 bright natural killer cells, mast
cells, memory B cells, and natural killer T cells, suggesting a
potential regulatory role in AD-related immune responses.
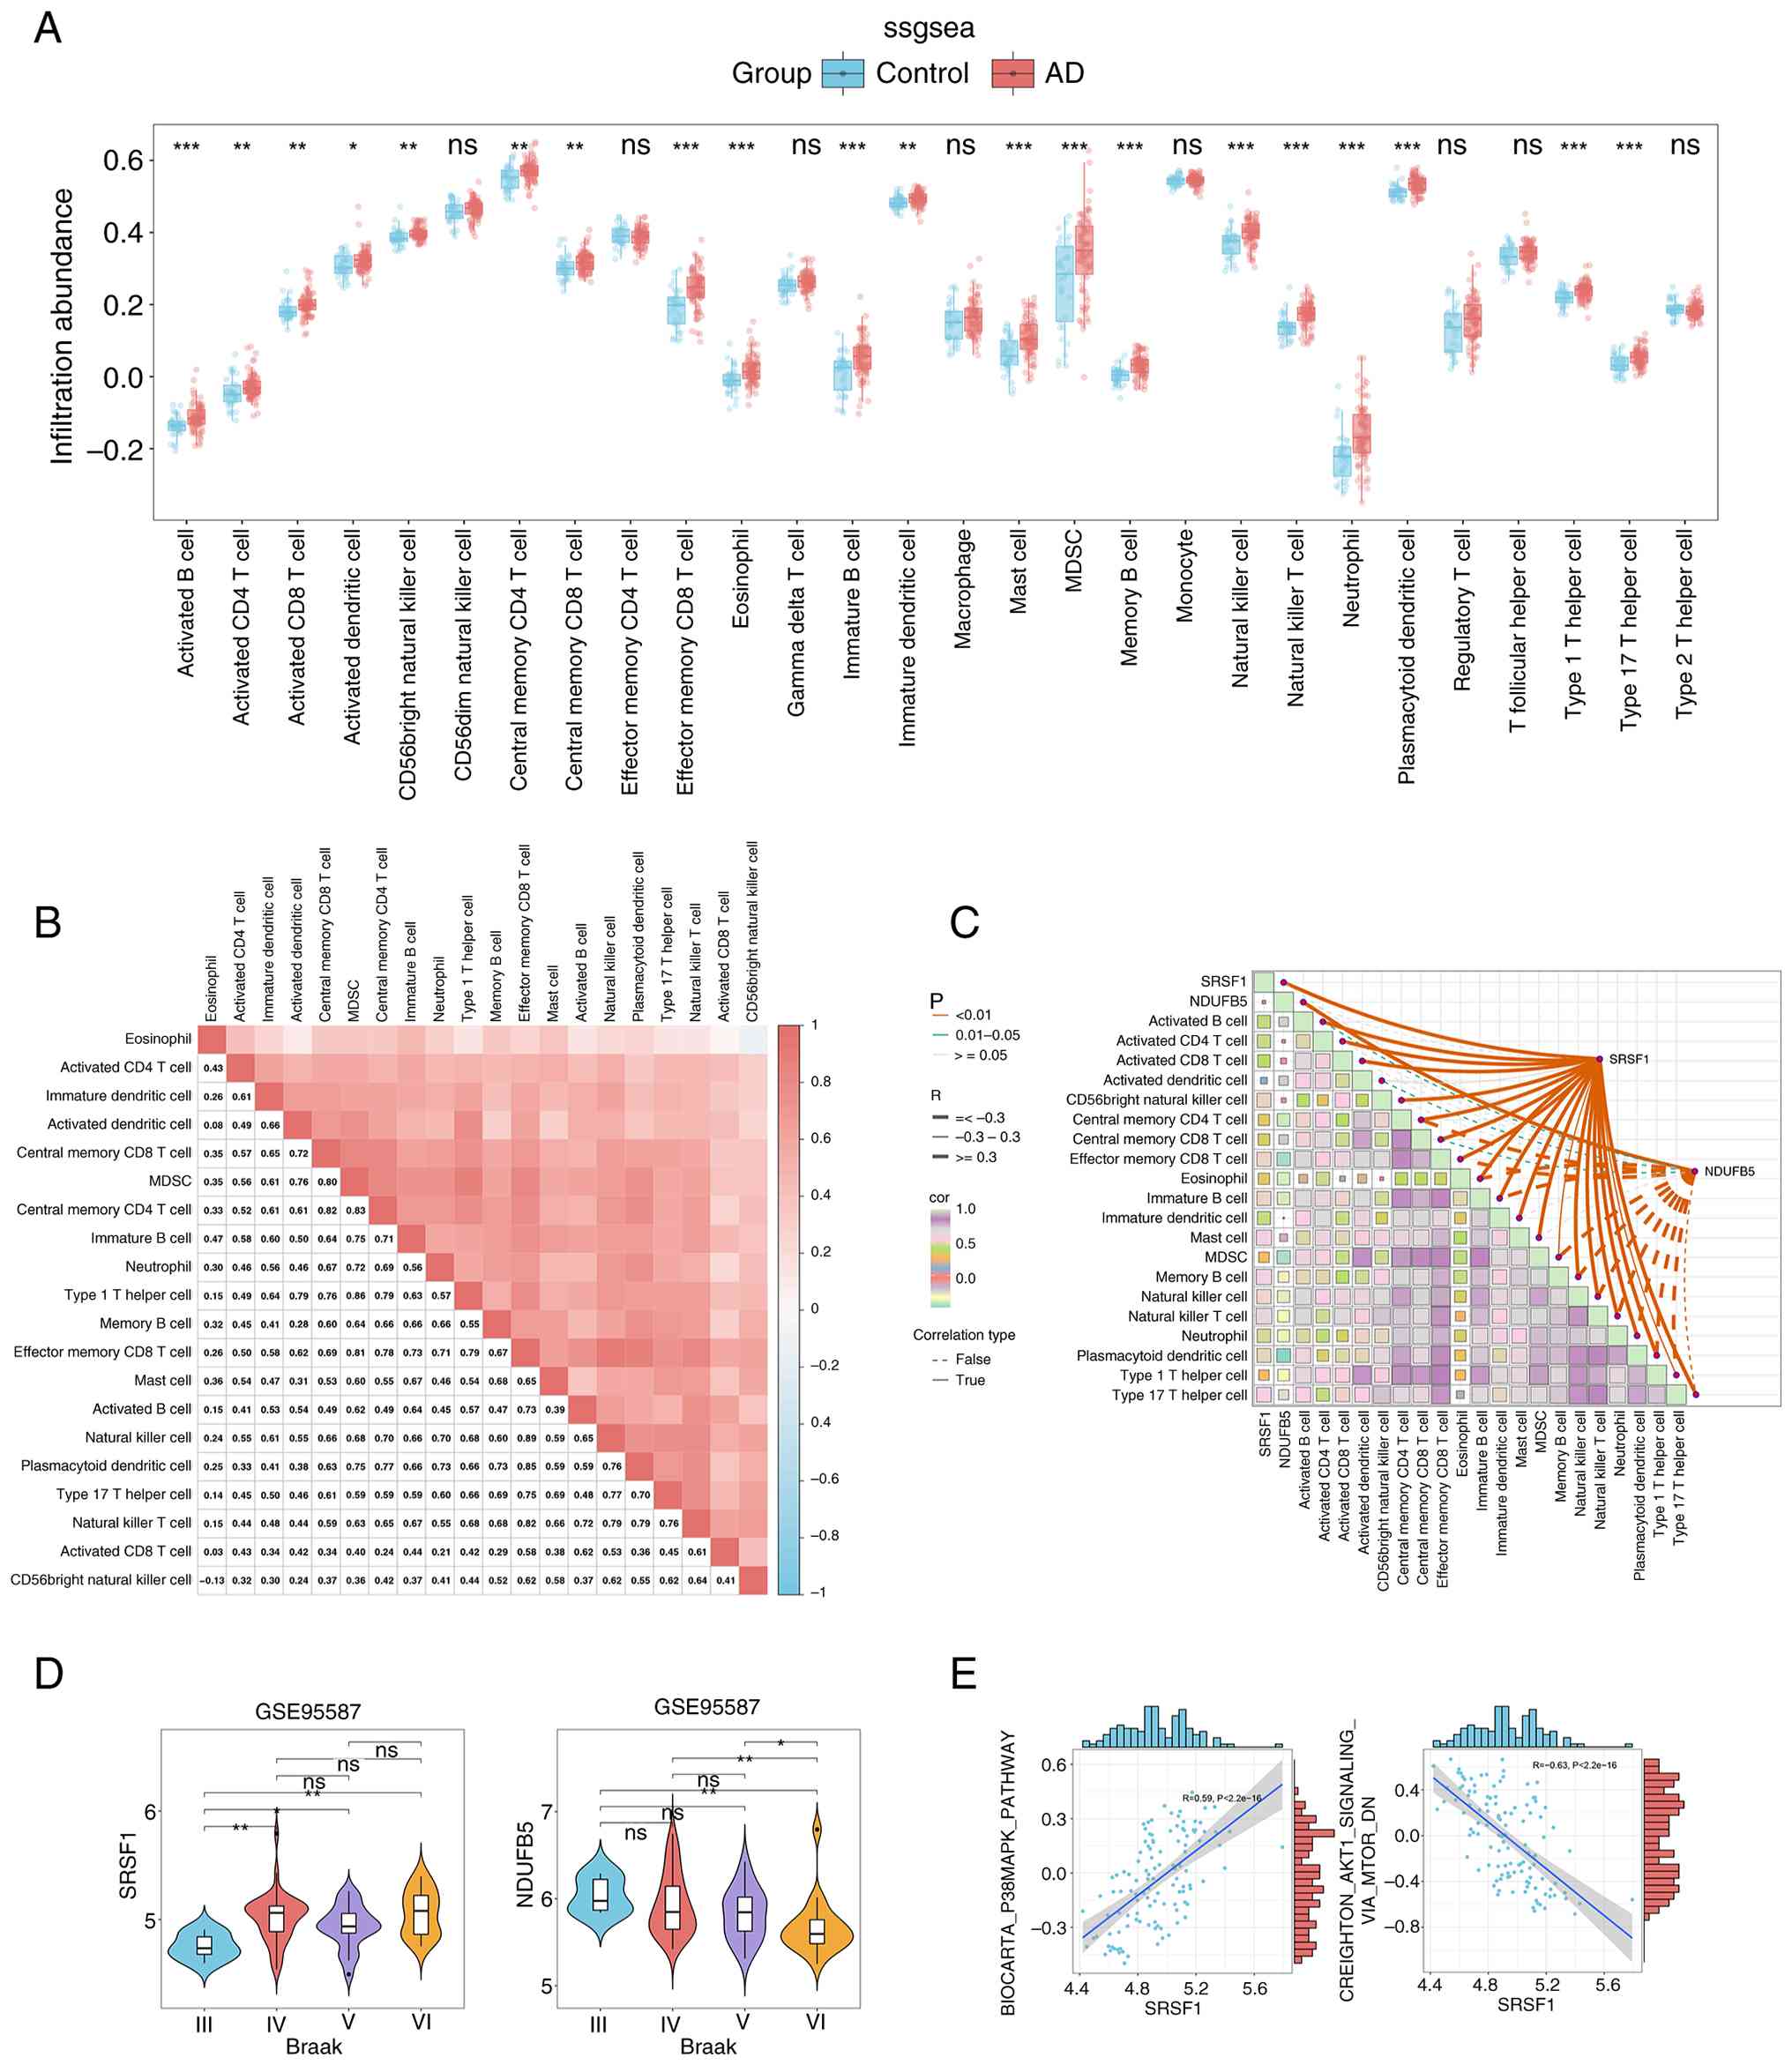 | Figure 5.Immune characteristics between the
control and AD groups. (A) Histogram of immune cell infiltration
levels in control and AD groups based on ssGSEA results. Blue
represents control samples and red represents AD samples. (B)
Heatmap of immune infiltration patterns in AD. Colores (light to
dark red) indicate immune cell infiltration levels or related
molecular markers across samples/regions. (C) Correlations between
SRSF1, NDUFB5 and differentially infiltrated immune cells. Solid
lines, positive correlations; dashed lines, negative correlations.
Colours indicate the strength of correlations between cells. Left
label, P-value; R, correlation coefficient. (D) Violin plots of
SRSF1 and NDUFB5 expression across Braak stages (III–VI) in AD. The
shape of the violin plot represents the distribution of gene
expression, with the central box indicating the interquartile range
and the median. (E) gene set variation analysis results exploring
the relationship between SRSF1 and two signalling pathways.
*P<0.05, **P<0.01, ***P<0.001. ns, not significant; AD,
Alzheimer's disease; ssGSEA, single-sample gene set enrichment
analysis; GSVA, gene set variation analysis. |
Altered SRSF1 and NDUFB5 expression
across Braak stages and their association with AD-related
signalling pathways
As shown in Fig.
5D, notable differences in the expression levels of SRSF1 and
NDUFB5 were observed across various Braak stages. Compared with
Braak Stage III, SRSF1 expression was significantly upregulated in
Braak Stages IV, V and VI, suggesting a potential association with
AD pathological progression. Conversely, NDUFB5 showed significant
downregulation at Braak Stage VI compared with Braak Stages III, IV
and V, highlighting its distinct expression pattern during later
disease stages. Moreover, GSVA analysis demonstrated a marked
positive correlation between increased SRSF1 expression and the
activation of the p38MAPK signalling pathway (r=0.59; P<0.001).
Conversely, SRSF1 overexpression was associated with inhibition of
the AKT/mTOR signalling pathway (r=−0.63; P<0.001; Fig. 5E).
Preliminary validation of
bioinformatics findings via an Aβ1-42-induced AD mouse model
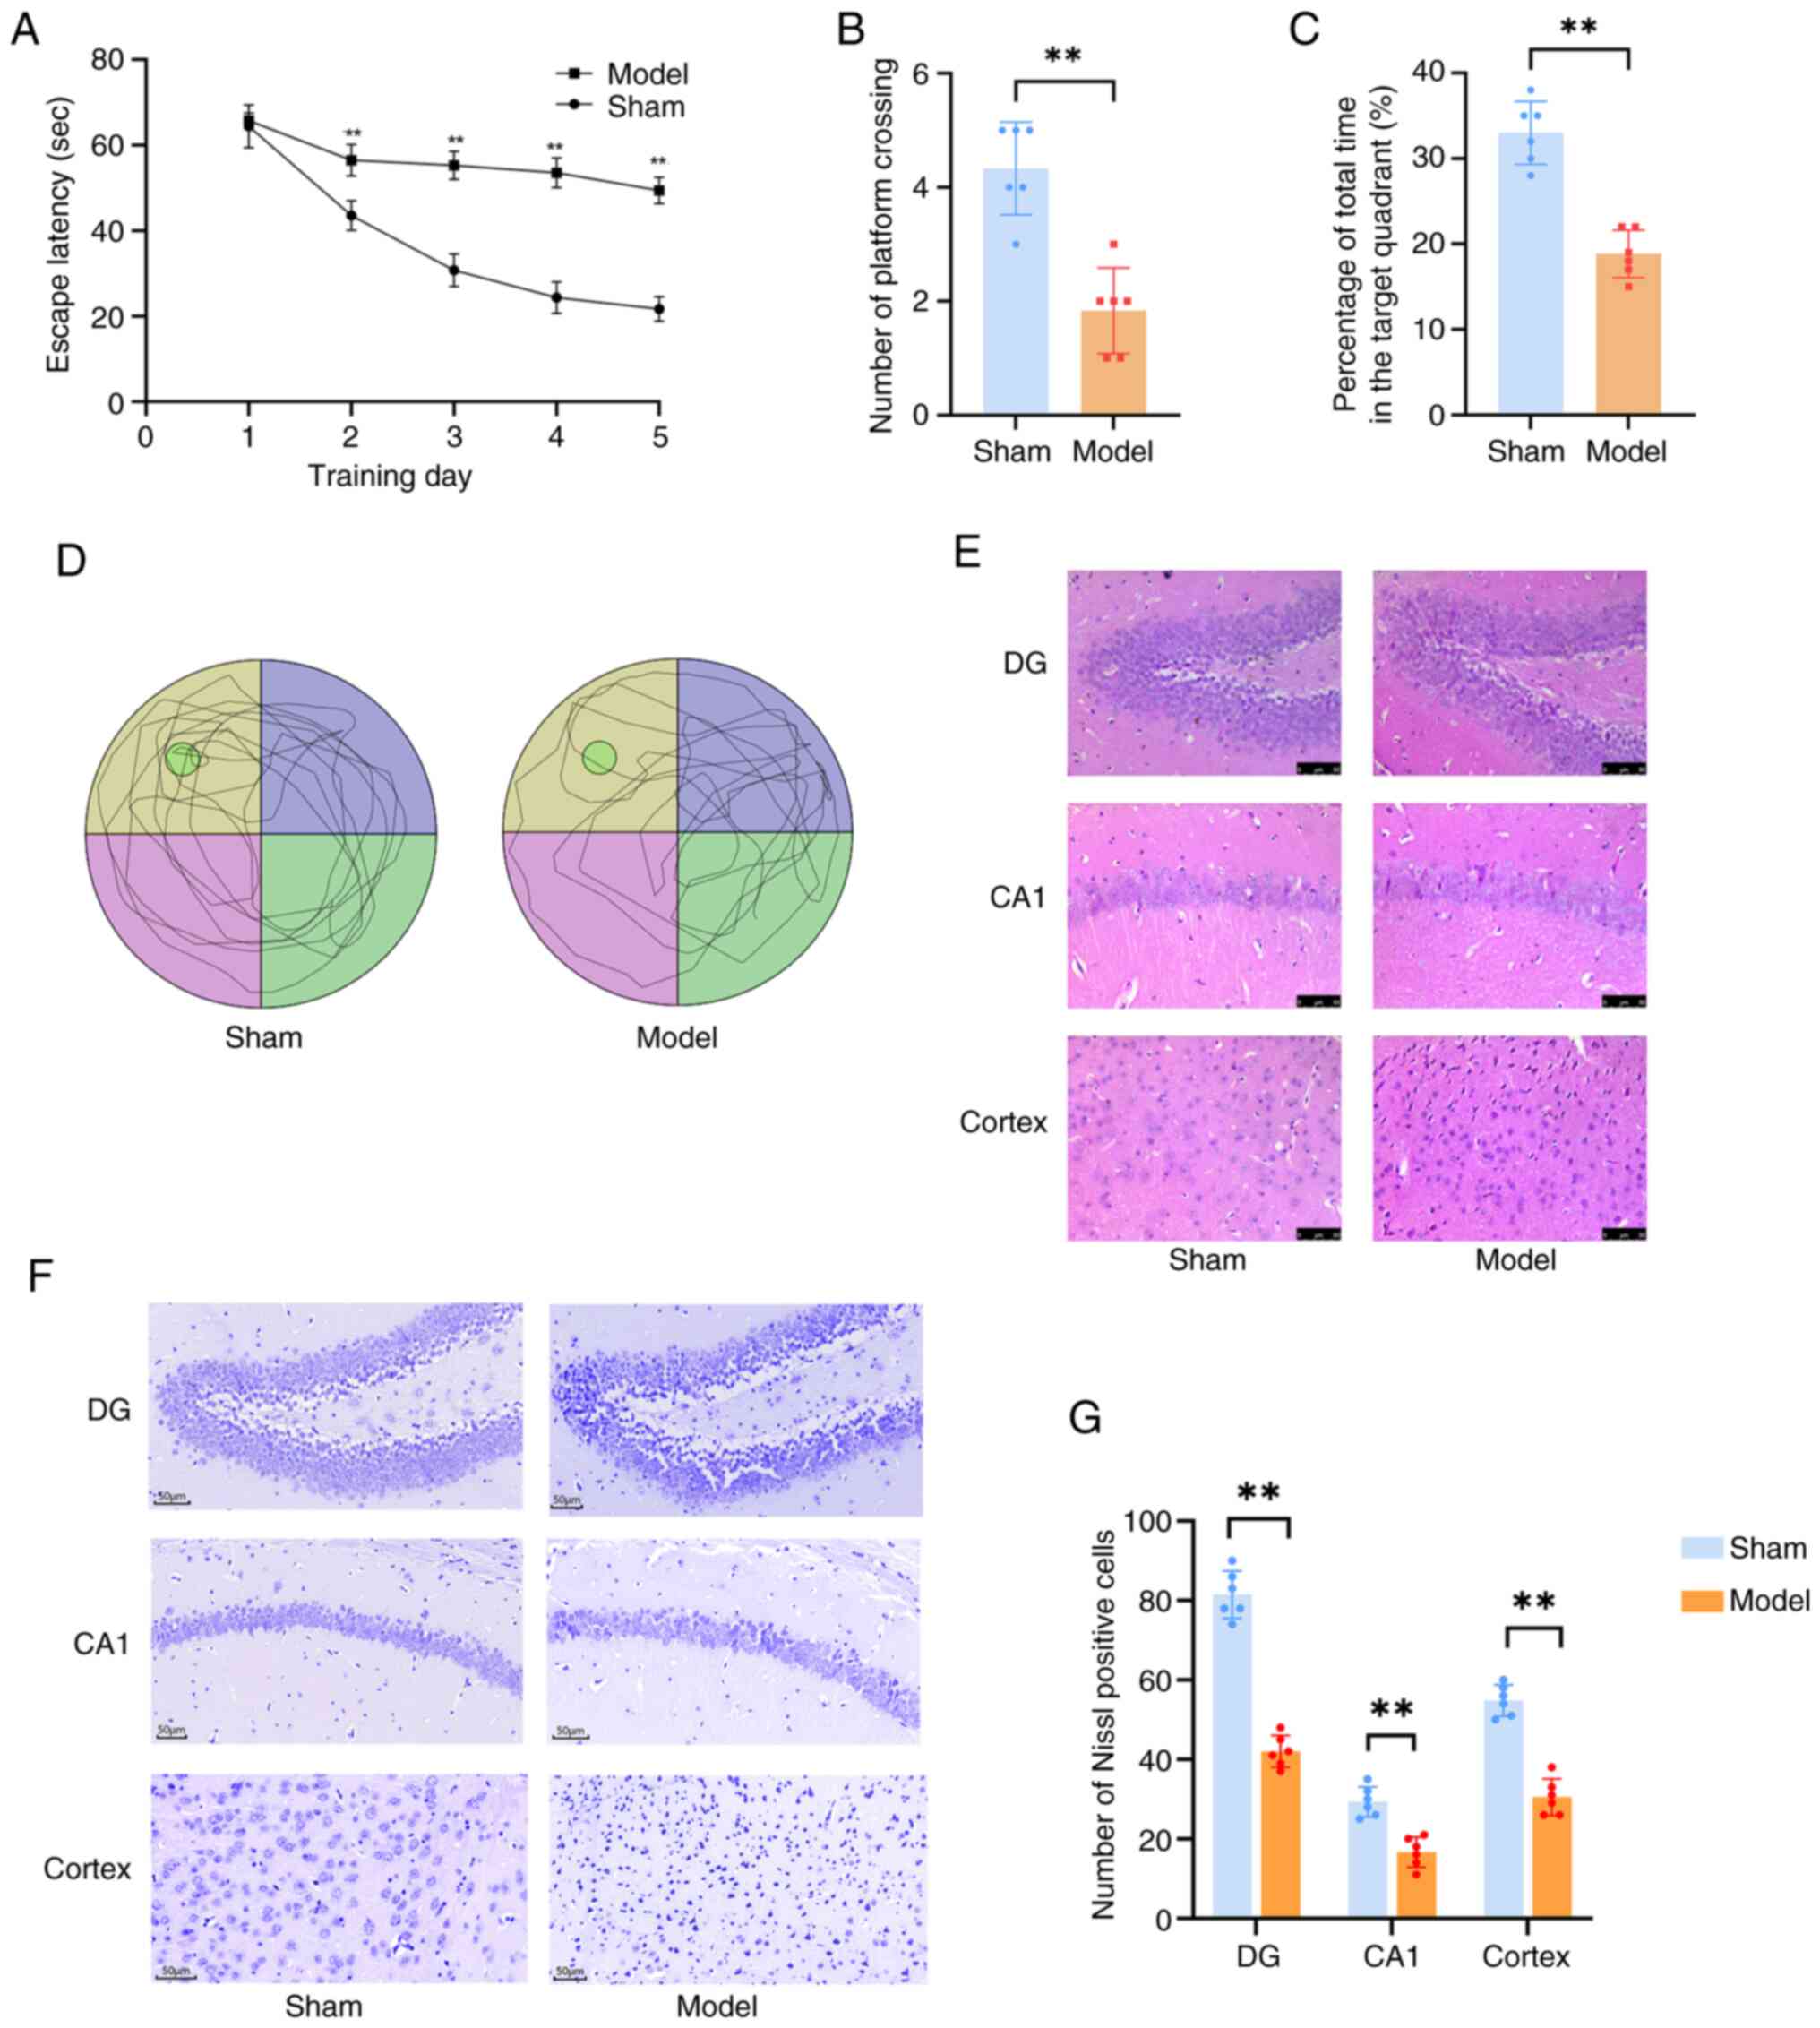
To validate the bioinformatics analysis findings, an
Aβ1-42-induced AD mouse model was successfully
established via i.c.v. injection. A total of 2 weeks after brain
stereotactic injection, MWM tests were conducted to evaluate mouse
cognitive function. Notably, Aβ1-42-injected mice
exhibited significantly longer swimming distance and escape latency
compared with the control group, which is a key indicator of
spatial memory impairment. Consistently, the number of platform
crossings and time spent in the target quadrant were also
significantly reduced (P<0.01; Fig.
6A-D), further confirming cognitive decline in the AD model
group. Following the identification of behavioural abnormalities,
morphological examinations were performed using the mouse
hippocampus. H&E and Nissl staining revealed marked neuronal
loss in the hippocampal and cortical regions of AD model mice
(Fig. 6E-G). These histological
changes directly associated with the memory impairment observed in
MWM tests, indicating successful establishment of the
Aβ1-42-induced AD mouse model.
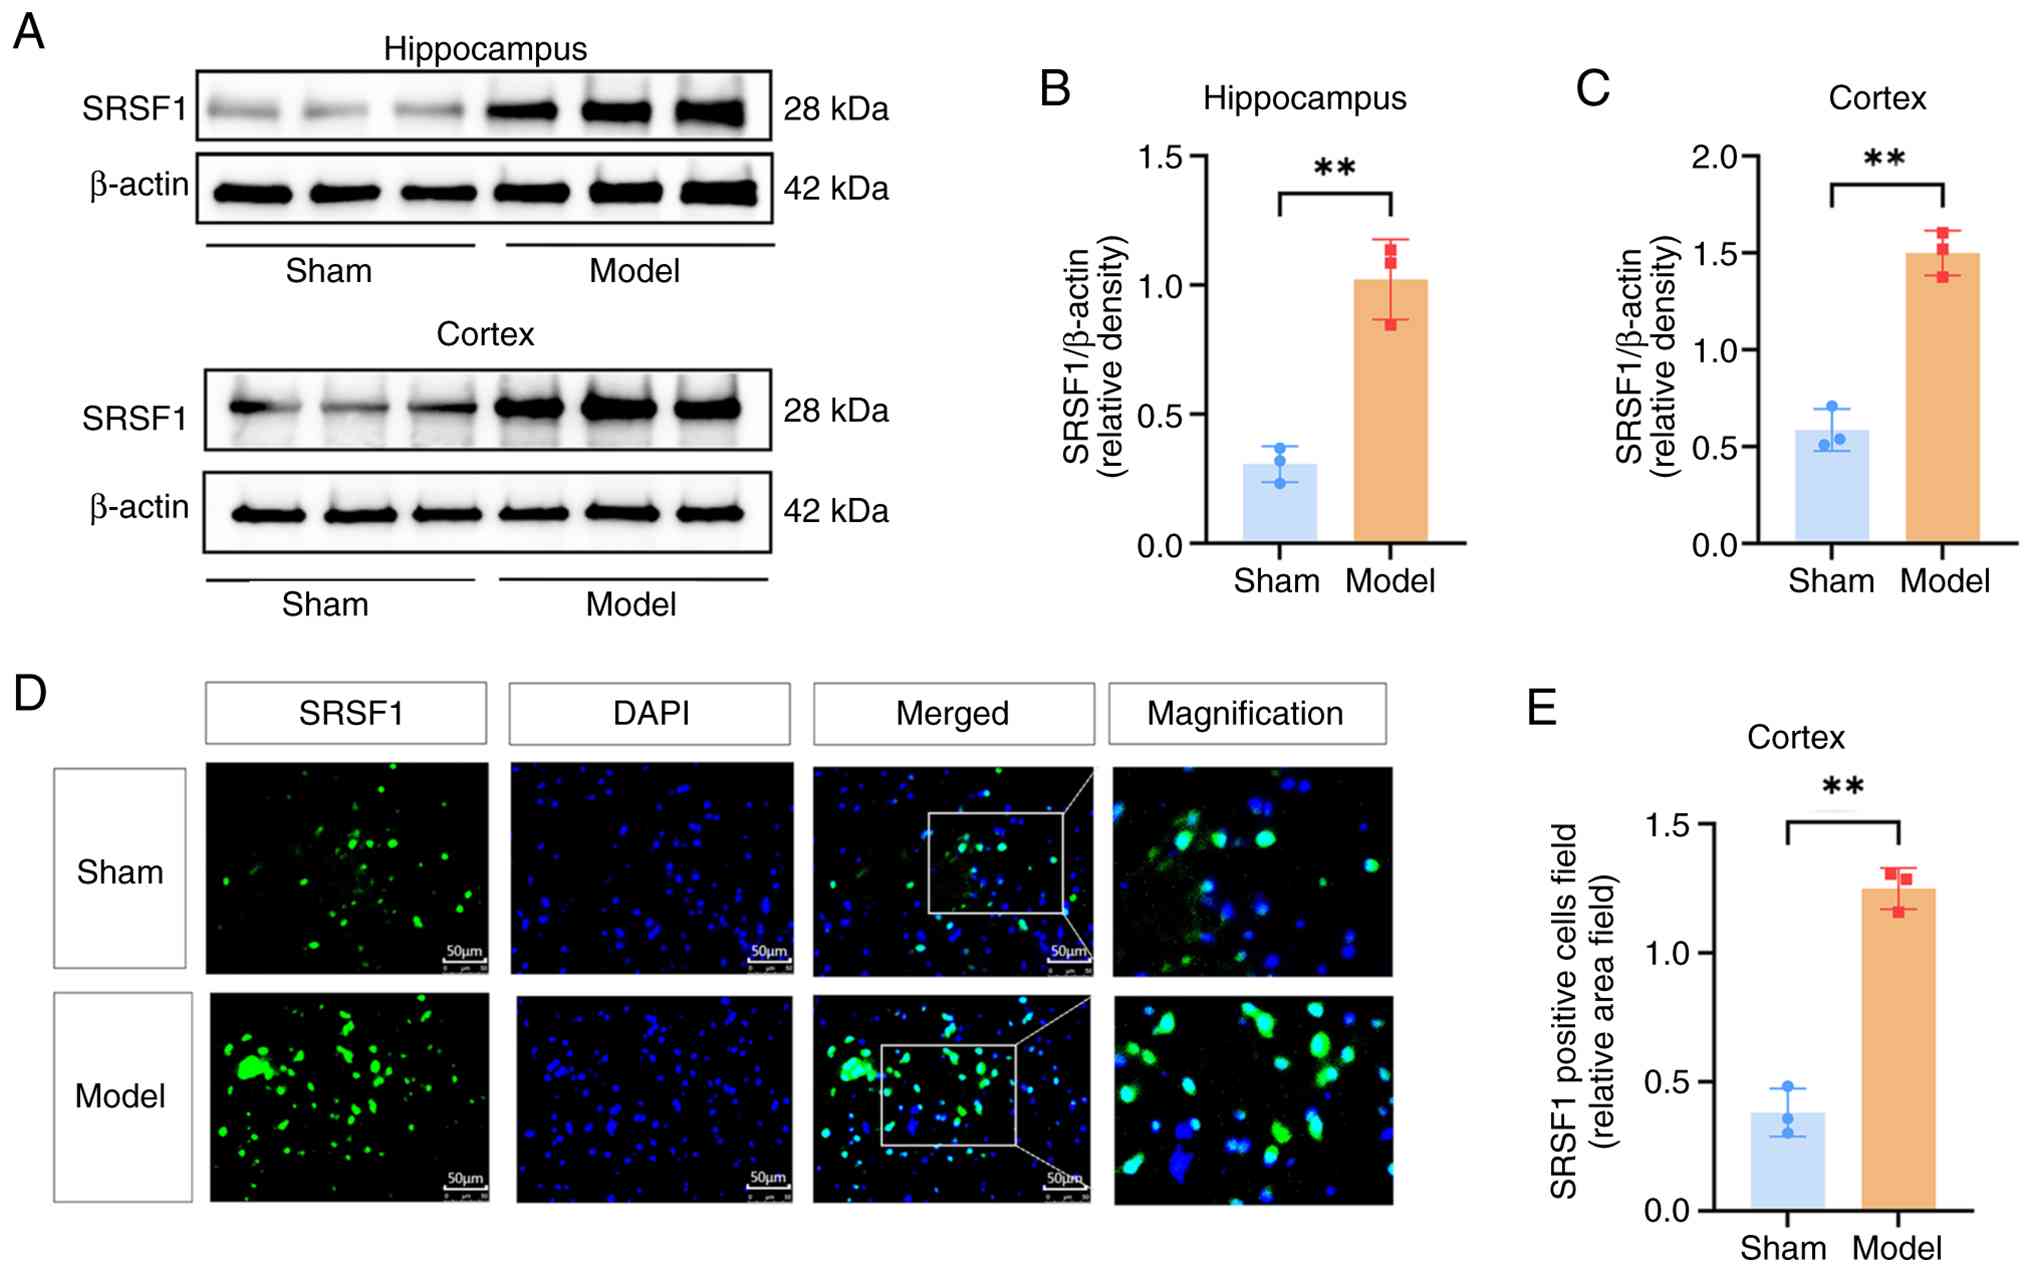
Moreover, western blot and immunofluorescence assays
were used to measure the expression levels of the target gene
SRSF1. Western blot analyses revealed a significant upregulation of
SRSF1 expression in the hippocampus and cortex of AD model mice
when compared with control mice (P<0.01; Fig. 7A-C). Immunofluorescence analysis
additionally revealed significant SRSF1 upregulation in the mouse
cerebral cortex, suggesting a potential role for SRSF1 in AD
pathogenesis (P<0.01; Fig. 7D and
E).
Baseline characteristics and biomarker
analysis of AD and control cohorts
Table I presents a
comprehensive summary and comparative analysis of the baseline
characteristics of participants in the AD and control groups.
Demographic and clinical parameters, including age, sex
distribution, educational attainment, BMI and the prevalence of
diabetes and hypertension, were statistically comparable between
the two groups (P>0.05), indicating a well-matched cohort for
subsequent analyses. Notably, cognitive assessment using the MMSE
and MOCA scores revealed significant disparities. Patients with AD
exhibited substantially lower MMSE and MOCA scores compared with
healthy controls (P<0.05), underscoring impaired cognitive
function. Moreover, molecular analyses showed that SRSF1 mRNA
expression was notably increased in the AD group compared with the
control cohort (P<0.05). This upregulation of SRSF1 may
contribute to the pathophysiological mechanisms underlying AD,
warranting further investigation into its role in disease
progression.
 | Table I.Demographic and clinical parameters
of patients with Alzheimer's disease and healthy controls. |
Table I.
Demographic and clinical parameters
of patients with Alzheimer's disease and healthy controls.
| Characteristic | Alzheimer's
disease, n=37 | Controls, n=36 | P-value |
|---|
| Age, n (%) |
|
| 0.281 |
| <65
years | 10 (27.03) | 14 (38.89) |
|
| ≥65
years | 27 (72.97) | 22 (61.11) |
|
| Sex, n (%) |
|
| 0.395 |
|
Male | 9 (24.33) | 12 (33.33) |
|
|
Female | 28 (75.67) | 24 (66.67) |
|
| Education, n
(%) |
|
| 0.871 |
| <9
years | 13 (35.14) | 12 (33.33) |
|
| ≥9
years | 24 (64.86) | 24 (66.67) |
|
| Body mass index,
kg/m2b | 20.12±2.52 | 21.57±3.51 | 0.812 |
| Diabetes, n
(%) | 6 (16.22) | 6 (16.67) | 0.959 |
| Hypertension, n
(%) | 9 (24.32) | 11 (30.55) | 0.551 |
| Apolipoprotein E4
allele carriers, n (%) | 4 (10.81) | - | - |
| Mini-mental state
examinationc | 20 (15.5,
23.5) | 27.5
(26,28.75) |
<0.001a |
| Montreal cognitive
assessmentc | 15 (8.5, 19) | 25 (23.25, 26) |
<0.001a |
| Clinical dementia
rating stage, n (%) |
|
| - |
|
0.5 | 6 (16.21) |
|
|
| 1 | 15 (40.54) |
|
|
| 2 | 14 (37.84) |
|
|
| 3 | 2 (5.41) |
|
|
| SRSF1 mRNA levels
in the peripheral blood mononuclear cellsc | 2.59 (1.76,
3.72) | 1.07 (0.833,
1.37) |
<0.001a |
Correlation between SRSF1 and
cognitive scores and plasma biomarkers
Compared with healthy controls, SRSF1 expression in
PBMCs was significantly higher in patients with AD (P<0.01;
Fig. 8A), highlighting the
potential role of SRSF1 in AD pathogenesis. Notably, in the PBMCs
of patients with AD, SRSF1 mRNA expression was strongly negatively
correlated with cognitive function as measured by MMSE (r=−0.677;
P<0.001) and MOCA scores (r=−0.678; P<0.001) (Fig. 8B and C). Moreover, SRSF1 mRNA
expression showed a positive correlation with CDR score (r=0.739;
P<0.001; Fig. 8D). This
positive association was further validated by Kendall's rank
correlation analysis, which revealed a significant positive
correlation (τ=0.580; P<0.01). These findings suggest that
increased SRSF1 expression may be associated with cognitive
decline. Furthermore, as shown in Fig.
8E-I, SRSF1 mRNA levels in the PBMCs in patients with AD showed
significant positive correlations with plasma disease-related
biomarkers, including p-tau217 (r=0.64; P<0.001), p-tau181
(r=0.51; P=0.001) and GFAP (r=0.344; P=0.04). By contrast, no
significant correlations were observed between SRSF1 expression
levels and plasma Aβ42/Aβ40 ratios or NfL levels. These findings
further elucidate the intricate relationship between SRSF1
expression and AD-associated molecular and clinical phenotypes.
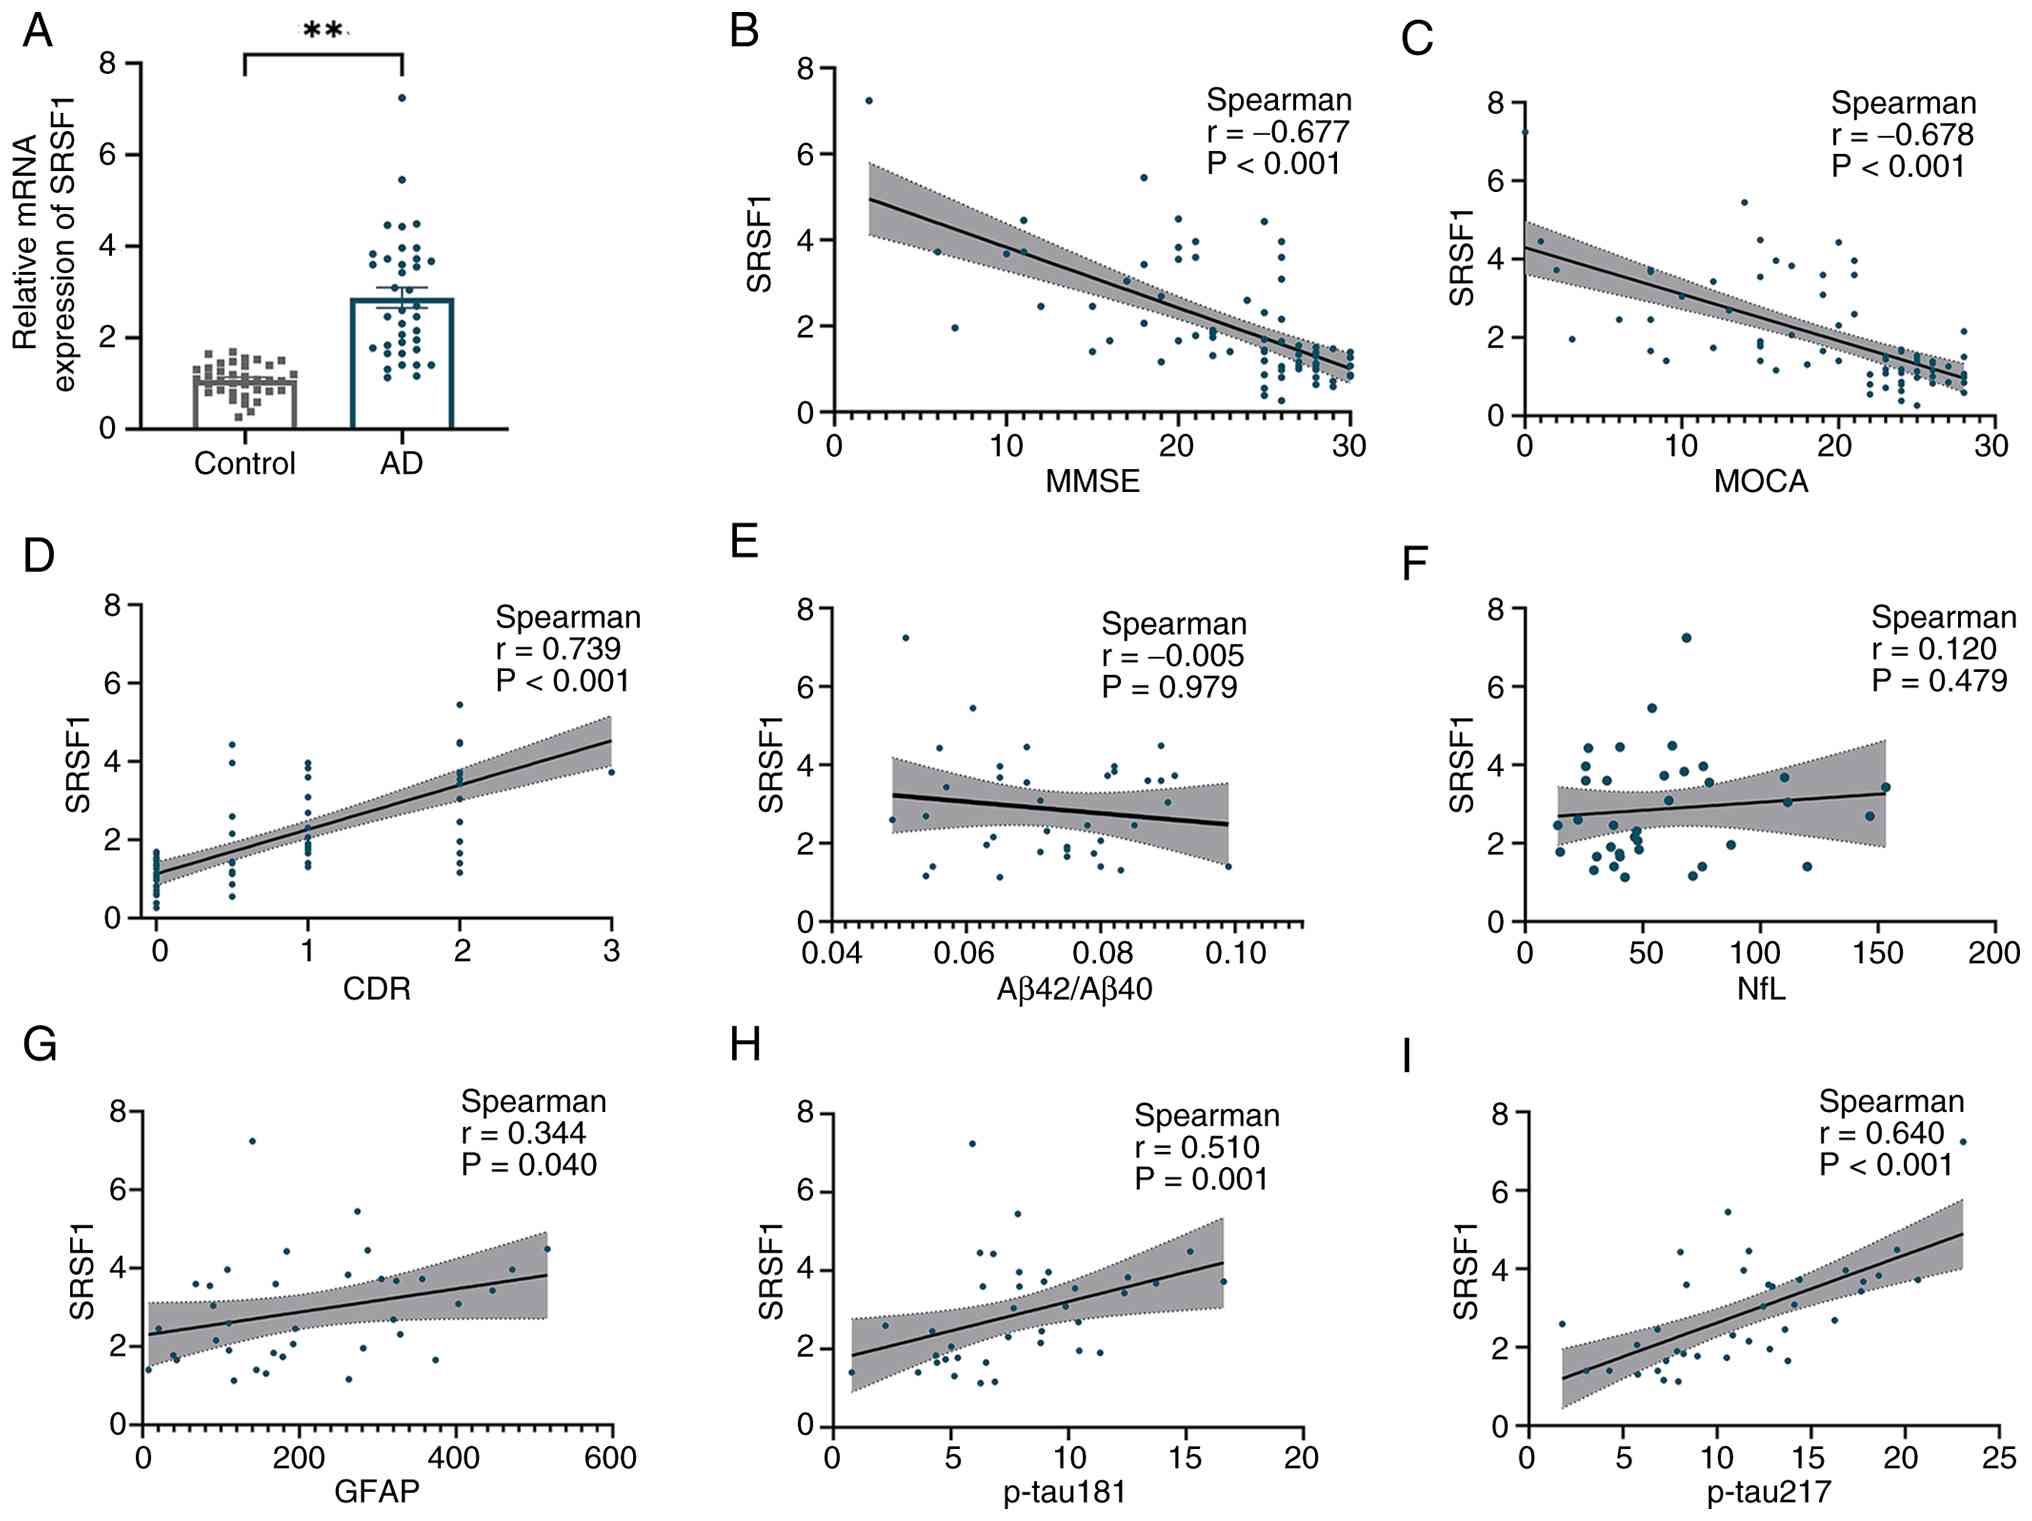 | Figure 8.SRSF1 mRNA expression in PBMCs of
control and AD groups and correlations with cognitive scores and
plasma biomarkers. (A) SRSF1 expression was upregulated in PBMCs
from patients with AD compared with controls; **P<0.01.
Cognitive state parameters in AD, such as (B) MMSE and (C) MOCA
scores, showed inverse correlations with SRSF1 expression, whereas
(D) CDR scores were positively correlated with it. No significant
correlations were found between SRSF1 expression and (E) plasma
Aβ42/Aβ40 ratios or (F) NfL levels. SRSF1 mRNA levels positively
correlated with plasma (G) GFAP levels, (H) p-tau181 and (I)
p-tau217. AD, Alzheimer's disease; SRSF1, Serine/Arginine Rich
Splicing Factor; PBMC, peripheral blood mononuclear cells; MMSE,
mini-mental state examination; MOCA, Montreal cognitive assessment;
NfL, neurofilament light chain; GFAP, glial fibrillary acidic
protein; CDR, clinical dementia rating. |
Discussion
AD, which is characterised by an insidious,
progressive and ultimately fatal course, poses a notable challenge
to global public health systems. The intricate pathophysiology of
AD remains incompletely understood, with several leading hypotheses
having been proposed to explain its pathogenesis (35). Prominent among these are the
immune-inflammatory response, the accumulation of Aβ peptides, and
the aberrant hyperphosphorylation of Tau proteins (36,37).
Given the limited efficacy of current therapies and the growing
global prevalence of AD, further elucidation of its molecular
mechanisms is urgently needed. These insights are critical for
discovering and validating novel biomarkers that can enable early
disease detection, guide personalised treatment strategies, and
accurately predict patient outcomes (38).
In the present study, using WGCNA, 19 AD-associated
modules were identified. Based on the criteria of GS>0.3 and
MM>0.8, using four topological ranking algorithms, 108 hub genes
were identified. Next, by applying four distinct models, LASSO,
SVM-RFE, RF and XGBoost, two candidate genes that demonstrated
strong correlations with AD pathological biomarkers in the dataset
were identified. The fact that SRSF1 and NDUFB5 were consistently
selected by all four methods markedly strengthens the evidence for
their association with AD, suggesting their potential to predict
disease progression, although this requires validation in larger
independent cohorts. In diagnostic test evaluation, an AUC of
0.7–0.8 is generally considered acceptable for diagnostic accuracy
(39). The AUC values of SRSF1
(0.746) and NDUFB5 (0.777) in the present study indicated
acceptable discriminatory power between AD and control samples.
Overall, these results highlighted the potential of SRSF1 and
NDUFB5 as promising biomarkers for AD. The observed discriminatory
power suggested that a diagnostic model incorporating both genes
may have acceptable utility for aiding AD diagnosis, with potential
value for early detection and clinical management, and warrants
further validation in larger cohorts. It is hypothesized that
immune system dysfunction underlies the inflammatory responses
linked to AD, although the underlying mechanisms remain
incompletely elucidated (40,41).
In the present study, bioinformatics analysis revealed that SRSF1
expression was significantly upregulated compared with healthy
controls and implicated in p38MAPK and AKT1/mTOR signalling
pathways. In vivo experiments confirmed elevated SRSF1
expression in the hippocampus and cerebral cortex of
Aβ1-42-induced AD model mice. Given that the
immune-inflammatory response is a core pathological hypothesis of
AD, and that SRSF1 has been shown to regulate immune-related genes,
the association between SRSF1 and immune cell infiltration in
patients with AD was further explored. These observations lay the
foundation for further investigating the role of SRSF1 in immune
cell infiltration, a core pathological feature of AD.
Consistent with prior studies (42), the present study found that the AD
group exhibited significant alterations in immune cell infiltration
ratios compared with the control group. These alterations primarily
included activated B cells, activated CD4+ and CD8+ T cells,
T-helper type 1 cells, T-helper type 17 cells and other cell types
(43,44). A previous study explored the roles
of peripheral immune dysfunctions and peripheral-central immune
crosstalk in the pathogenesis and progression of AD (45). Peripheral B lymphocytes, a key
element of the adaptive immune system, can cross the blood-brain
barrier in patients with AD and enhance immune activation via
interactions with resident brain cells (46). Type 1 and 17 T cells, two subsets
of CD4+ T cells, have been shown to accelerate AD progression by
inducing glial pro-inflammatory responses (47). Indeed, under different
physiological and pathological conditions, distinct patterns of
altered gene expression can either slow or accelerate disease
progression by influencing immune cells or activating multiple
synergistic regulatory mechanisms simultaneously (48). In the present study, SRSF1 was
positively associated with immune cell abundances, specifically
correlating with CD56bright natural killer cells, memory B cells,
mast cells and natural killer T cells. Thus, it was hypothesized
that SRSF1 expression may be associated with peripheral immune cell
infiltration, although the underlying regulatory mechanisms require
further functional validation. To verify this hypothesis, the
findings revealed not only elevated SRSF1 expression in the PBMCs
of patients with AD but also a significant correlation with
specific immune cell infiltration. This implicated a previously
underappreciated connection between a central splicing regulator
and peripheral immune dysregulation in AD, highlighting a systemic
aspect of the disease.
SRSF1 is a notable RNA splicing factor that
regulates pre-mRNA splicing (49,50).
The Microtubule-Associated Protein Tau (MAPT) gene encodes the tau
protein, and abnormal alternative splicing of this gene is a
hallmark of AD pathogenesis, leading to the accumulation of
pathological tau isoforms in the brain. It has been demonstrated
that SRSF1 acts as a marked splicing factor that binds to the
exonic splicing enhancer (ESE) sequences within exon 10 of MAPT
pre-mRNA. Mechanistically, SRSF1 promotes the inclusion of exon 10
in the mature MAPT transcript, which generates the 4-repeat (4R)
tau isoform. Notably, the imbalance between 3-repeat and 4R tau
isoforms is closely associated with tau hyperphosphorylation and
neurofibrillary tangle formation in the brains of patients with AD
(51). The CD33 gene is a
well-established risk factor for late-onset AD, and its alternative
splicing generates two major isoforms: The full-length isoform
(CD33-M1) and the truncated isoform (CD33-M2), which lacks the
immunoreceptor tyrosine-based inhibitory motif (ITIM) domain. SRSF1
has been identified as a key regulator of CD33 splicing by
recognizing the ESE elements in the region flanking exon 2
(52). Specifically, SRSF1
enhances exon 2 inclusion, leading to increased CD33-M1 expression
in microglia. The CD33-M1 isoform inhibits microglial phagocytosis
of Aβ plaques by activating the ITIM-dependent signalling pathway,
thereby promoting Aβ accumulation and neuroinflammation in AD
(53). By influencing CD33
splicing, SRSF1 and PTBP1 may alter microglial functional
properties and affect Aβ clearance, neuroinflammation, and synaptic
pruning (52). Additionally,
bioinformatics analyses demonstrated that SRSF1 orchestrated
distinct gene regulatory programs in regulatory T cells and
effector T cells in vivo. Genes regulated by SRSF1 include
Interleukin-17A, Interleukin-17F, colony-stimulating factor and
C-X-C motif chemokine ligand 10 (54). These genes are markedly enriched in
pathways associated with inflammatory responses and
cytokine-cytokine receptor interactions (55). The p38MAPK and AKT1/mTOR signalling
pathways regulate immune-inflammatory responses and have been
validated as promising therapeutic targets for AD (56). Identified as key players in
SRSF1-related bioinformatics analysis, they play notable roles in
regulating immune cell function and metabolism (57). The p38MAPK pathway modulates the
activation, differentiation, and functional regulation of multiple
immune cell types, whereas the AKT1/mTOR pathway drives metabolic
reprogramming to meet the energy demands of immune cell activation
(58). These two pathways are
closely interconnected rather than functioning independently, and
their crosstalk fine-tunes immune cell functions and maintains
immune microenvironment balance, further linking SRSF1 to AD
pathogenesis through immune regulation (59). The present findings offer novel
perspectives on the molecular mechanisms through which SRSF1 may be
involved in AD pathogenesis, suggesting a potential association
with the regulation of multiple signalling pathways that warrants
further functional validation. Collectively, the present results
suggest that SRSF1 expression is associated with the inflammatory
microenvironment and the dynamics of central and peripheral immune
cells in AD, possibly through links to the splicing of these key
genes, although causal relationships remain unconfirmed.
In patients with AD, neuronal degeneration and death
occur as the disease progresses (60). Activated astrocytes attempt to
repair damaged neural tissue, leading to increased GFAP expression
(61). Plasma GFAP concentrations
show a notable correlation with cognitive deterioration, making it
a useful biomarker for tracking AD progression (62). Phosphorylated tau proteins, such as
p-tau217 and p-tau181, are effective at identifying AD pathology
and distinguishing AD from other neurodegenerative disorders
(63). It has been demonstrated
that Lumipulse G plasma p-tau217 and the p-tau217/Aβ42 ratio
precisely recognised abnormal Aβ and tau PET statuses in both
clinical and community groups (64). The diagnostic capability of plasma
p-tau217 and the p-tau217/Aβ42 ratio was on par with cerebrospinal
fluid (CSF) assessments (64).
Given the core value of these biomarkers in AD diagnosis and
progression monitoring, the correlation between SRSF1 mRNA levels
in PBMCs and these indicators was further analysed to verify their
clinical relevance. In the present study, a novel clinical
correlation was identified: SRSF1 mRNA levels in PBMCs showed a
significant positive association with key AD plasma biomarkers,
including p-tau217, p-tau181 and GFAP. Notably, SRSF1 expression
also showed a negative correlation with parameters reflecting
cognitive status in patients with AD, such as MMSE and MOCA scores,
while positively correlating with CDR scores. This dual correlation
links SRSF1 not only to core AD pathological biomarkers but also to
the severity of clinical cognitive decline, reinforcing its
potential as a comprehensive biomarker reflecting both pathological
changes and cognitive impairment. SRSF1 expression was
significantly upregulated at Braak Stage IV relative to Stage III,
which is commonly associated with mild cognitive impairment, a
recognized prodromal stage of AD. Braak Stage IV corresponds to
mild dementia, indicating that SRSF1 may undergo dynamic changes
during this early dementia phase, warranting further exploration of
its role in disease mechanisms. This pattern suggested that SRSF1
may be involved in the early pathological progression of AD within
the studied clinical spectrum; however, further validation in
cohorts including pre-symptomatic or prodromal individuals is
required to confirm its potential as a biomarker for earlier
disease stages. Mechanistically, this suggests that SRSF1-mediated
splicing defects may be functionally tied to the misprocessing of
proteins involved in tau phosphorylation and glial activation
(65). Notably, neurons and glial
cells maintain intimate crosstalk in the brain (66), whereby changes in neuronal SRSF1
levels can be sensed by glial cells to trigger downstream glial
responses (55,67), ultimately leading to GFAP
upregulation. Concurrently, SRSF1 dysregulation in neurons may
drive abnormal tau phosphorylation, contributing to elevated
p-tau217 and p-tau181 levels. Beyond this, SRSF1-mediated
regulation of inflammation-related genes (68) can activate pro-inflammatory
pathways, which in turn exacerbate tau hyperphosphorylation and
glial activation, forming a pathological feedback loop.
The results of the present study support the
potential of SRSF1 as a diagnostic biomarker for AD. Its elevated
expression is easily assessable in PBMCs, and its good diagnostic
accuracy and strong correlation with cognitive function scores
suggest that SRSF1 could be used to develop a relatively
non-invasive blood-based test. Such a test could serve as a
practical complement or alternative to more expensive and invasive
methods, such as PET scans and CSF analysis.
It is worth noting that the present study has
certain limitations. The current analysis is cross-sectional,
focusing on associations between SRSF1 and baseline AD phenotypes.
However, longitudinal data are lacking to verify whether SRSF1
levels can predict disease progression or response to
interventions, and long-term follow-up studies are required to
evaluate its utility as a prognostic biomarker. The value of SRSF1
as a diagnostic biomarker has been preliminarily validated in a
single dataset and a small clinical cohort. The generalizability of
these findings is limited by the single-centre design and the
cohort's lack of diversity in ethnicity, age and comorbidities.
Accordingly, future work will include conducting a formal power
analysis to determine the necessary sample size and pursuing
multicentre collaborations to independently validate these results.
Additionally, the generalizability of the present preclinical
findings may be constrained by the exclusive use of male mice in
the animal experiments. Numerous studies have shown that female
mice often exhibit more severe cognitive impairments and greater
amyloid plaque deposition in AD models compared with males, which
is consistent with the higher prevalence of AD in women among human
populations (20). In the present
study, male mice were used; however, it is acknowledged that sex is
a notable biological variable in AD research, and the exclusive use
of male mice may introduce a potential bias, particularly in terms
of the generalizability of the present findings to female subjects.
Female mice may exhibit differences in disease susceptibility,
progression rates or treatment responses due to hormonal
influences, especially oestrogen-related neuroprotection. In future
studies, it is planned to include both male and female mice to more
comprehensively evaluate sex-specific differences in disease
mechanisms. Although it is hypothesized that SRSF1 contributes to
AD by modulating immune cell infiltration and the p38MAPK and
AKT1/mTOR signalling pathways, a causal relationship between SRSF1
and AD pathogenesis remains unverified by functional experiments.
The present study identified a significant association between
SRSF1 expression and key AD biomarkers, including p-tau (p-tau217,
p-tau181) and GFAP; however, the functional relationship and
potential regulatory role of SRSF1 in tau hyperphosphorylation and
astrocyte activation have yet to be experimentally confirmed. In
particular, whether SRSF1 directly influences AD pathological
features and the direction and molecular mechanisms underlying its
involvement in disease progression require further investigation.
To address these gaps, future work should employ gene editing or
knockdown strategies in AD models to clarify the direct impact of
SRSF1 on AD pathology and elucidate the underlying molecular
mechanisms.
Collectively, the results of the present study
suggest that SRSF1 is associated with AD pathogenesis and shows
potential as a candidate diagnostic biomarker. Its suitability as a
therapeutic target warrants further investigation through
functional studies. Its associations with immune dysregulation,
signalling pathway modulation and clinical disease progression
underscore its multifaceted role in AD, providing a foundation for
future mechanistic and translational research to advance AD
diagnosis and treatment.
Supplementary Material
Supporting Data
Acknowledgements
Not applicable.
Funding
The present study was funded by The Fundamental Research Funds
for Provincial Universities in Heilongjiang Province (grant no.
2024-KYYWF-0198) and The Fund of Scientific Research Innovation of
The First Affiliated Hospital of Harbin Medical University (grant
no. 2025M04).
Availability of data and materials
The data generated in the present study may be
requested from the corresponding author.
Authors' contributions
LJC designed the study. YCL wrote the manuscript.
YCL, YZ and YTY performed the experiments. DL, YLS, WSX and HLY
analysed the data. All authors revised the manuscript. All authors
have read and approved the final version of the manuscript. YCL and
DL confirm the authenticity of all the raw data.
Ethics approval and consent to
participate
The animal study was reviewed and approved by the
Animal Care and Use Committee of Harbin Medical University and
Authority (approval no. 2024047), and all experiments adhered to
the ARRIVE guidelines for in vivo research. The studies
involving human participants were approved by the Ethics Committee
of The First Affiliated Hospital of Harbin Medical University
(approval no. 2024374). All protocols conformed to the ethical
norms established by institutional and national research boards, in
line with the 1964 Declaration of Helsinki. Written informed
consent was obtained from all patients or their legal guardians for
the collection of samples and participation in the study.
Patient consent for publication
Not applicable.
Competing interests
The authors declare that they have no competing
interests.
References
|
1
|
Silva MVF, Loures CMG, Alves LCV, de Souza
LC, Borges KBG and Carvalho MDG: Alzheimer's disease: Risk factors
and potentially protective measures. J Biomed Sci. 26:332019.
View Article : Google Scholar : PubMed/NCBI
|
|
2
|
Jemimah S, Chabib CMM, Hadjileontiadis L
and AlShehhi A: Gut microbiome dysbiosis in Alzheimer's disease and
mild cognitive impairment: A systematic review and meta-analysis.
PLoS One. 18:e02853462023. View Article : Google Scholar : PubMed/NCBI
|
|
3
|
Jack CR Jr, Bennett DA, Blennow K,
Carrillo MC, Dunn B, Haeberlein SB, Holtzman DM, Jagust W, Jessen
F, Karlawish J, et al: NIA-AA research framework: Toward a
biological definition of Alzheimer's disease. Alzheimers Dement.
14:535–562. 2018. View Article : Google Scholar : PubMed/NCBI
|
|
4
|
Jack CR Jr, Andrews JS, Beach TG,
Buracchio T, Dunn B, Graf A, Hansson O, Ho C, Jagust W, McDade E,
et al: Revised criteria for diagnosis and staging of Alzheimer's
disease: Alzheimer's association workgroup. Alzheimers Dement.
20:5143–5169. 2024. View Article : Google Scholar : PubMed/NCBI
|
|
5
|
Wang X, Shi Z, Qiu Y, Sun D and Zhou H:
Peripheral GFAP and NfL as early biomarkers for dementia:
Longitudinal insights from the UK Biobank. BMC Med. 22:1922024.
View Article : Google Scholar : PubMed/NCBI
|
|
6
|
Chatterjee P, Pedrini S, Doecke JD, Thota
R, Villemagne VL, Doré V, Singh AK, Wang P, Rainey-Smith S, Fowler
C, et al: Plasma Aβ42/40 ratio, p-tau181, GFAP, and NfL across the
Alzheimer's disease continuum: A cross-sectional and longitudinal
study in the AIBL cohort. Alzheimers Dement. 19:1117–1134. 2023.
View Article : Google Scholar : PubMed/NCBI
|
|
7
|
Zhang ZH, Wu QY, Zheng R, Chen C, Chen Y,
Liu Q, Hoffmann PR, Ni JZ and Song GL: Selenomethionine mitigates
cognitive decline by targeting both tau hyperphosphorylation and
autophagic clearance in an Alzheimer's disease mouse model. J
Neurosci. 37:2449–2462. 2017. View Article : Google Scholar : PubMed/NCBI
|
|
8
|
Au NPB and Ma CHE: Neuroinflammation,
microglia and implications for retinal ganglion cell survival and
axon regeneration in traumatic optic neuropathy. Front Immunol.
3:8600702022. View Article : Google Scholar : PubMed/NCBI
|
|
9
|
Nava Catorce M, Acero G and Gevorkian G:
Age- and sex-dependent alterations in the peripheral immune system
in the 3×Tg-AD mouse model of Alzheimer's disease: Increased
proportion of CD3+CD4-CD8- double-negative T cells in the blood. J
Neuroimmunol. 360:5777202021. View Article : Google Scholar : PubMed/NCBI
|
|
10
|
Taoka T, Masutani Y, Kawai H, Nakane T,
Matsuoka K, Yasuno F, Kishimoto T and Naganawa S: Evaluation of
glymphatic system activity with the diffusion MR technique:
diffusion tensor image analysis along the perivascular space
(DTI-ALPS) in Alzheimer's disease cases. Jpn J Radiol. 35:172–178.
2017. View Article : Google Scholar : PubMed/NCBI
|
|
11
|
Piehl N, van Olst L, Ramakrishnan A,
Teregulova V, Simonton B, Zhang Z, Tapp E, Channappa D, Oh H,
Losada PM, et al: Cerebrospinal fluid immune dysregulation during
healthy brain aging and cognitive impairment. Cell.
185:5028–5039.e13. 2022. View Article : Google Scholar : PubMed/NCBI
|
|
12
|
Jorfi M, Park J, Hall CK, Lin CJ, Chen M,
von Maydell D, Kruskop JM, Kang B, Choi Y, Prokopenko D, et al:
Infiltrating CD8(+) T cells exacerbate Alzheimer's disease
pathology in a 3D human neuroimmune axis model. Nat Neurosci.
26:1489–1504. 2023. View Article : Google Scholar : PubMed/NCBI
|
|
13
|
Bettcher BM, Tansey MG, Dorothée G and
Heneka MT: Peripheral and central immune system crosstalk in
Alzheimer disease - a research prospectus. Nat Rev Neurol.
17:689–701. 2021. View Article : Google Scholar : PubMed/NCBI
|
|
14
|
Demir SA, Timur ZK, Ateş N, Martínez LA
and Seyrantepe V: GM2 ganglioside accumulation causes
neuroinflammation and behavioral alterations in a mouse model of
early onset Tay-Sachs disease. J Neuroinflammation. 17:2772020.
View Article : Google Scholar : PubMed/NCBI
|
|
15
|
Serrano-Pozo A, Das S and Hyman BT: APOE
and Alzheimer's disease: Advances in genetics, pathophysiology, and
therapeutic approaches. Lancet Neurol. 20:68–80. 2021. View Article : Google Scholar : PubMed/NCBI
|
|
16
|
Cummings J, Apostolova L, Rabinovici GD,
Atri A, Aisen P, Greenberg S, Hendrix S, Selkoe D, Weiner M,
Petersen RC and Salloway S: Lecanemab: Appropriate Use
Recommendations. J Prev Alzheimers Dis. 10:362–377. 2023.
View Article : Google Scholar : PubMed/NCBI
|
|
17
|
Weinstein JD: A new direction for
Alzheimer's research. Neural Regen Res. 13:190–193. 2018.
View Article : Google Scholar : PubMed/NCBI
|
|
18
|
Srinivasan K, Friedman BA, Etxeberria A,
Huntley MA, van der Brug MP, Foreman O, Paw JS, Modrusan Z, Beach
TG, Serrano GE and Hansen DV: Alzheimer's patient microglia exhibit
enhanced aging and unique transcriptional activation. Cell Rep.
31:1078432020. View Article : Google Scholar : PubMed/NCBI
|
|
19
|
Langfelder P and Horvath S: WGCNA: An R
package for weighted correlation network analysis. BMC
Bioinformatics. 9:5592008. View Article : Google Scholar : PubMed/NCBI
|
|
20
|
Shannon P, Markiel A, Ozier O, Baliga NS,
Wang JT, Ramage D, Amin N, Schwikowski B and Ideker T: Cytoscape: A
software environment for integrated models of biomolecular
interaction networks. Genome Res. 13:2498–2504. 2003. View Article : Google Scholar : PubMed/NCBI
|
|
21
|
Xie Y, Shi H and Han B: Bioinformatic
analysis of underlying mechanisms of Kawasaki disease via Weighted
gene correlation network analysis (WGCNA) and the Least absolute
shrinkage and selection operator method (LASSO) regression model.
BMC Pediatr. 23:902023. View Article : Google Scholar : PubMed/NCBI
|
|
22
|
Uddin S, Khan A, Hossain ME and Moni MA:
Comparing different supervised machine learning algorithms for
disease prediction. BMC Med Inform Decis Mak. 19:2812019.
View Article : Google Scholar : PubMed/NCBI
|
|
23
|
Yi F, Yang H, Chen D, Qin Y, Han H, Cui J,
Bai W, Ma Y, Zhang R and Yu H: XGBoost-SHAP-based interpretable
diagnostic framework for alzheimer's disease. BMC Med Inform Decis
Mak. 23:1372023. View Article : Google Scholar : PubMed/NCBI
|
|
24
|
Greener JG, Kandathil SM, Moffat L and
Jones DT: A guide to machine learning for biologists. Nat Rev Mol
Cell Biol. 23:40–55. 2022. View Article : Google Scholar : PubMed/NCBI
|
|
25
|
Robin X, Turck N, Hainard A, Tiberti N,
Lisacek F, Sanchez JC and Müller M: pROC: An open-source package
for R and S+ to analyze and compare ROC curves. BMC Bioinformatics.
12:772011. View Article : Google Scholar : PubMed/NCBI
|
|
26
|
Hänzelmann S, Castelo R and Guinney J:
GSVA: Gene set variation analysis for microarray and RNA-seq data.
BMC Bioinformatics. 14:72013. View Article : Google Scholar : PubMed/NCBI
|
|
27
|
McCarthy MM: Multifaceted origins of sex
differences in the brain. Philos Trans R Soc Lond B Biol Sci.
371:201501062016. View Article : Google Scholar : PubMed/NCBI
|
|
28
|
Souza LC, Filho CB, Goes AT, Fabbro LD, de
Gomes MG, Savegnago L, Oliveira MS and Jesse CR: Neuroprotective
effect of physical exercise in a mouse model of Alzheimer's disease
induced by β-amyloid1-4o peptide. Neurotox Res.
24:148–163. 2013. View Article : Google Scholar : PubMed/NCBI
|
|
29
|
Cioanca O, Hancianu M, Mihasan M and
Hritcu L: Anti-acetylcholinesterase and antioxidant activities of
inhaled juniper oil on amyloid beta (1–42)-induced oxidative stress
in the rat hippocampus. Neurochem Res. 40:952–960. 2015. View Article : Google Scholar : PubMed/NCBI
|
|
30
|
Chambon C, Wegener N, Gravius A and Danysz
W: Behavioural and cellular effects of exogenous amyloid-β peptides
in rodents. Behav Brain Res. 225:623–641. 2011. View Article : Google Scholar : PubMed/NCBI
|
|
31
|
Souza LC, Jesse CR, Antunes MS, Ruff JR,
de Oliveira Espinosa D, Gomes NS, Donato F, Giacomeli R and Boeira
SP: Indoleamine-2,3-dioxygenase mediates neurobehavioral
alterations induced by an intracerebroventricular injection of
amyloid-β1-42 peptide in mice. Brain Behav Immun. 56:363–377. 2016.
View Article : Google Scholar : PubMed/NCBI
|
|
32
|
McKhann GM, Knopman DS, Chertkow H, Hyman
BT, Jack CR Jr, Kawas CH, Klunk WE, Koroshetz WJ, Manly JJ, Mayeux
R, et al: The diagnosis of dementia due to Alzheimer's disease:
Recommendations from the National Institute on Aging-Alzheimer's
Association workgroups on diagnostic guidelines for Alzheimer's
disease. Alzheimers Dement. 7:263–269. 2011. View Article : Google Scholar : PubMed/NCBI
|
|
33
|
Livak KJ and Schmittgen TD: Analysis of
relative gene expression data using real-time quantitative PCR and
the 2(−Delta Delta C(T)) Method. Methods. 25:402–408. 2001.
View Article : Google Scholar : PubMed/NCBI
|
|
34
|
Chen X and Ishwaran H: Random forests for
genomic data analysis. Genomics. 99:323–329. 2012. View Article : Google Scholar : PubMed/NCBI
|
|
35
|
Golde TE: Alzheimer's disease - the
journey of a healthy brain into organ failure. Mol Neurodegener.
17:182022. View Article : Google Scholar : PubMed/NCBI
|
|
36
|
Novoa C, Salazar P, Cisternas P,
Gherardelli C, Vera-Salazar R, Zolezzi JM and Inestrosa NC:
Inflammation context in Alzheimer's disease, a relationship
intricate to define. Biol Res. 55:392022. View Article : Google Scholar : PubMed/NCBI
|
|
37
|
Johnson AM and Lukens JR: The innate
immune response in tauopathies. Eur J Immunol. 53:e22502662023.
View Article : Google Scholar : PubMed/NCBI
|
|
38
|
Luo R and Yu JT: New biomarkers for
early-stage tau pathology in Alzheimer's disease. Nat Aging.
5:734–735. 2025. View Article : Google Scholar : PubMed/NCBI
|
|
39
|
Hajian-Tilaki K: Receiver operating
characteristic (ROC) curve analysis for medical diagnostic test
evaluation. Caspian J Intern Med. 4:627–635. 2013.PubMed/NCBI
|
|
40
|
Saaoud F, Liu L, Xu K, Lu Y, Shao Y, Ben
Issa M, Jiang X, Wang X, Liu X, Autieri M, et al: Alzheimer's
disease as an auto-innate immune pathology with potential cell
trans-differentiation and enhanced trained immunity in 3×Tg-AD
mouse model. J Alzheimers Dis. 105:550–572. 2025. View Article : Google Scholar : PubMed/NCBI
|
|
41
|
Heppner FL, Ransohoff RM and Becher B:
Immune attack: The role of inflammation in Alzheimer disease. Nat
Rev Neurosci. 16:358–372. 2015. View Article : Google Scholar : PubMed/NCBI
|
|
42
|
Korte N, Barkaway A, Wells J, Freitas F,
Sethi H, Andrews SP, Skidmore J, Stevens B and Attwell D:
Inhibiting Ca(2+) channels in Alzheimer's disease model mice
relaxes pericytes, improves cerebral blood flow and reduces immune
cell stalling and hypoxia. Nat Neurosci. 27:2086–2100. 2024.
View Article : Google Scholar : PubMed/NCBI
|
|
43
|
Zieneldien T, Kim J, Sawmiller D and Cao
C: The immune system as a therapeutic target for Alzheimer's
disease. Life (Basel). 12:14402022.PubMed/NCBI
|
|
44
|
Yang F, Zhang N, Ou GY and Xu SW:
integrated bioinformatic analysis and validation identifies immune
microenvironment-related potential biomarkers in Alzheimer's
disease. J Prev Alzheimers Dis. 11:495–506. 2024. View Article : Google Scholar : PubMed/NCBI
|
|
45
|
Xu L, Li L, Pan CL, Song JJ, Zhang CY, Wu
XH, Hu F, Liu X, Zhang Z and Zhang ZY: Erythropoietin signalling in
peripheral macrophages is required for systemic β-amyloid
clearance. EMBO J. 41:e1110382022. View Article : Google Scholar : PubMed/NCBI
|
|
46
|
Zhang S, Gao Y, Zhao Y, Huang TY, Zheng Q
and Wang X: Peripheral and central neuroimmune mechanisms in
Alzheimer's disease pathogenesis. Mol Neurodegener. 20:222025.
View Article : Google Scholar : PubMed/NCBI
|
|
47
|
Dai L and Shen Y: Insights into T-cell
dysfunction in Alzheimer's disease. Aging Cell. 20:e135112021.
View Article : Google Scholar : PubMed/NCBI
|
|
48
|
Chen Y, Dai J, Tang L, Mikhailova T, Liang
Q, Li M, Zhou J, Kopp RF, Weickert C, Chen C and Liu C: Neuroimmune
transcriptome changes in patient brains of psychiatric and
neurological disorders. Mol Psychiatry. 28:710–721. 2023.
View Article : Google Scholar : PubMed/NCBI
|
|
49
|
Ding F, Su CJ, Edmonds KK, Liang G and
Elowitz MB: Dynamics and functional roles of splicing factor
autoregulation. Cell Rep. 39:1109852022. View Article : Google Scholar : PubMed/NCBI
|
|
50
|
Zhu GQ, Tang Z, Chu TH, Wang B, Chen SP,
Tao CY, Cai JL, Yang R, Qu WF, Wang Y, et al: Targeting SRSF1
improves cancer immunotherapy by dually acting on CD8(+)T and tumor
cells. Signal Transduct Target Ther. 10:252025. View Article : Google Scholar : PubMed/NCBI
|
|
51
|
Bowles KR, Pugh DA, Oja LM, Jadow BM,
Farrell K, Whitney K, Sharma A, Cherry JD, Raj T, Pereira AC, et
al: Dysregulated coordination of MAPT exon 2 and exon 10 splicing
underlies different tau pathologies in PSP and AD. Acta
Neuropathol. 143:225–243. 2022. View Article : Google Scholar : PubMed/NCBI
|
|
52
|
van Bergeijk P, Seneviratne U,
Aparicio-Prat E, Stanton R and Hasson SA: SRSF1 and PTBP1 are
trans-acting factors that suppress the formation of a CD33 splicing
isoform linked to Alzheimer's disease risk. Mol Cell Biol.
39:e00568–18. 2019. View Article : Google Scholar : PubMed/NCBI
|
|
53
|
Eskandari-Sedighi G, Crichton M, Zia S,
Gomez-Cardona E, Cortez LM, Patel ZH, Takahashi-Yamashiro K, St
Laurent CD, Sidhu G, Sarkar S, et al: Alzheimer's disease
associated isoforms of human CD33 distinctively modulate microglial
cell responses in 5XFAD mice. Mol Neurodegener. 19:422024.
View Article : Google Scholar : PubMed/NCBI
|
|
54
|
Cassidy MF, Herbert ZT and Moulton VR:
Splicing factor SRSF1 controls distinct molecular programs in
regulatory and effector T cells implicated in systemic autoimmune
disease. Mol Immunol. 141:94–103. 2022. View Article : Google Scholar : PubMed/NCBI
|
|
55
|
Paz S, Ritchie A, Mauer C and Caputi M:
The RNA binding protein SRSF1 is a master switch of gene expression
and regulation in the immune system. Cytokine Growth Factor Rev.
57:19–26. 2021. View Article : Google Scholar : PubMed/NCBI
|
|
56
|
Panwar V, Singh A, Bhatt M, Tonk RK,
Azizov S, Raza AS, Sengupta S, Kumar D and Garg M: Multifaceted
role of mTOR (mammalian target of rapamycin) signalling pathway in
human health and disease. Signal Transduct Target Ther. 8:3752023.
View Article : Google Scholar : PubMed/NCBI
|
|
57
|
Huang G, Shi LZ and Chi H: Regulation of
JNK and p38 MAPK in the immune system: signal integration,
propagation and termination. Cytokine. 48:161–169. 2009. View Article : Google Scholar : PubMed/NCBI
|
|
58
|
Winter JN, Jefferson LS and Kimball SR:
ERK and Akt signalling pathways function through parallel
mechanisms to promote mTORC1 signalling. Am J Physiol Cell Physiol.
300:C1172–C1180. 2011. View Article : Google Scholar : PubMed/NCBI
|
|
59
|
Fu X, Xu M, Zhang H, Li Y, Li Y and Zhang
C: Staphylococcal enterotoxin C2 mutant-directed fatty acid and
mitochondrial energy metabolic programs regulate CD8(+) T cell
activation. J Immunol. 205:2066–2076. 2020. View Article : Google Scholar : PubMed/NCBI
|
|
60
|
Goel P, Chakrabarti S, Goel K, Bhutani K,
Chopra T and Bali S: Neuronal cell death mechanisms in Alzheimer's
disease: An insight. Front Mol Neurosci. 15:9371332022. View Article : Google Scholar : PubMed/NCBI
|
|
61
|
Muñoz-Ballester C and Robel S:
Astrocyte-mediated mechanisms contribute to traumatic brain injury
pathology. WIREs Mech Dis. 15:e16222023. View Article : Google Scholar : PubMed/NCBI
|
|
62
|
Shen XN, Huang SY, Cui M, Zhao QH, Guo Y,
Huang YY, Zhang W, Ma YH, Chen SD, Zhang YR, et al: Plasma glial
fibrillary acidic protein in the Alzheimer disease continuum:
Relationship to other biomarkers, differential diagnosis, and
prediction of clinical progression. Clin Chem. 69:411–421. 2023.
View Article : Google Scholar : PubMed/NCBI
|
|
63
|
Janelidze S, Stomrud E, Smith R, Palmqvist
S, Mattsson N, Airey DC, Proctor NK, Chai X, Shcherbinin S, Sims
JR, et al: Cerebrospinal fluid p-tau217 performs better than
p-tau181 as a biomarker of Alzheimer's disease. Nat Commun.
11:16832020. View Article : Google Scholar : PubMed/NCBI
|
|
64
|
Wang J, Huang S, Lan G, Lai YJ, Wang QH,
Chen Y, Xiao ZS, Chen X, Bu XL, Liu YH, et al: Diagnostic accuracy
of plasma p-tau217/Abeta42 for Alzheimer's disease in clinical and
community cohorts. Alzheimers Dement. 21:e700382025. View Article : Google Scholar : PubMed/NCBI
|
|
65
|
Apicco DJ, Zhang C, Maziuk B, Jiang L,
Balance HI, Boudeau S, Ung C, Li H and Wolozin B: Dysregulation of
RNA splicing in tauopathies. Cell Rep. 29:4377–4388.e4. 2019.
View Article : Google Scholar : PubMed/NCBI
|
|
66
|
Pan Y and Monje M: Neuron-Glial
interactions in health and brain cancer. Adv Biol (Weinh).
6:e22001222022. View Article : Google Scholar : PubMed/NCBI
|
|
67
|
De I, Maklakova V, Litscher S, Boyd MM,
Klemm LC, Wang Z, Kendziorski C and Collier LS: Microglial
responses to CSF1 overexpression do not promote the expansion of
other glial lineages. J Neuroinflammation. 18:1622021. View Article : Google Scholar : PubMed/NCBI
|
|
68
|
Su S, Katopodi XL, Pita-Juarez YH,
Maverakis E, Vlachos IS and Adamopoulos IE: Serine and arginine
rich splicing factor 1 deficiency alters pathways involved in
IL-17A expression and is implicated in human psoriasis. Clin
Immunol. 240:1090412022. View Article : Google Scholar : PubMed/NCBI
|