Introduction
Multiple myeloma (MM) is a malignancy of terminally
differentiated plasma cells that accumulate in the bone marrow (BM)
(1). Epigenetic remodeling,
particularly DNA methylation changes, serves a key role in B-cell
differentiation and plasma cell maturation (2). Early B-cell stages are characterized
by enhancer demethylation and the upregulation of B-cell
transcription factors (TFs). By contrast, late differentiation
leads to extensive demethylation of heterochromatin and methylation
at Polycomb-repressed genes (3,4).
Aberrant retention of methylation patterns has been observed in MM,
suggesting a pathogenic role for DNA methylation in disease
initiation and progression (5–7).
The therapeutic landscape of MM has been influenced
by proteasome inhibitors and immunomodulatory drugs, which have
markedly improved patient outcomes (8). Among them, bortezomib is a
first-in-class proteasome inhibitor that exerts its antimyeloma
effects not only through proteasome blockade but also through
induction of reactive oxygen species, intracellular stress,
apoptosis and modulation of transcriptional pathways, such as
limiting the activity of MYC (9–11).
Notably, bortezomib induces microRNA-29b in MM cells and acute
myeloid leukemia (AML) cells, leading to downregulation of
specificity protein (Sp)-1 and Sp1-regulated genes (12–14).
Sp1 and its homolog Sp3 are ubiquitously expressed TFs that bind GC
(GGGGCGGGG) boxes to regulate genes controlling differentiation,
proliferation and oncogenesis (15). Generally, Sp1 is a transcription
activator (16) and Sp3 has been
shown to positively regulate transcription (17), but Sp3 can also act as a repressor
(18,19). Their upregulation has been
associated with poor prognosis in a number of types of solid
cancer, such as gastric, pancreatic, colorectal and breast cancer
as well as gliomas and squamous cell carcinomas, but their role in
MM remains insufficiently characterized (20–24).
DNA methylation dynamics are controlled by
ten-eleven translocation (TET) methylcytosine dioxygenases,
which catalyze the conversion of 5-methylcytosine (5-mC) to
5-hydroxymethylcytosine (5-hmC) and subsequent derivatives, thereby
promoting active demethylation (25). The family of TET
dioxygenases consist of TET1, TET2 and TET3 (26,27).
Previous studies have highlighted the complex epigenomic landscape
in MM characterized by notable alterations in cytosine
modifications. While global DNA hypomethylation typically occurs
during disease progression, hypermethylation contributes to the
silencing of tumor suppressor genes (such as p16, E-Cadherin
and DAPK) and non-coding RNAs, such as miR-15 and miR-16
(28–30). Beyond the well-characterized 5-mC,
emerging evidence has emphasized the role of 5-hmC, a dynamic
intermediate in DNA demethylation catalyzed by TET proteins
(31,32). In MM, global 5-hmC levels are
markedly reduced compared with normal plasma cells. This reduction
in 5-hmC is associated with increased disease severity, poor
prognosis and inferior overall survival (OS). Furthermore, the
distribution of 5-hmC-modified genes in circulating cell-free DNA
has been shown to differ depending on patient ancestry, suggesting
that TET-mediated pathways may contribute to the biological
heterogeneity of the disease (33). TET2 mutations are founder
mutations, defined as early clonal events that initiate malignant
transformation and are shared by all cells within the tumor clone,
in 40–50% of cases of TET2-mutant hematopoietic
malignancies, while TET1 and TET3 partially
compensate for TET2 activity and may constitute potential
strategies to treat TET2 mutated hematopoietic malignancies,
including reverting the methylation state of TET2 target
genes (such as Klf4, Jun, Chd7 and Smad3) (34,35).
Despite extensive studies regarding DNA methylation and
transcriptional regulation in MM, analyses of TET genes in
association with Sp1/Sp3 binding and response to demethylating
agents remain limited (28,30).
The present study therefore aimed to investigate the
interplay between DNA methylation and TET gene expression in
patients with MM and in MM cell lines. Specifically, the aim was to
assess whether demethylating agents can promote Sp1/Sp3 binding to
TET gene promoters and thereby modulate their expression,
uncovering potential epigenetic vulnerabilities in MM.
Materials and methods
Patients with MM
Diagnosis of MM followed the International Myeloma
Working Group (IMWG) criteria (36). The present study was approved by
the Ethics Committee of University Hospital and the Faculty of
Medicine, Palacky University in Olomouc (Olomouc, Czech Republic;
approval no. EK FNOL 112/17) and samples were collected following
informed consent from the patients.
Patients were eligible for inclusion if they met the
following criteria: i) Signed informed consent; ii) age ≥18 years;
iii) diagnosis of plasma cell disorder determined according to IMWG
criteria, including newly diagnosed MM, relapsed/progressive MM or
MM in remission; and iv) availability of BM aspirate suitable for
CD138+ plasma cell isolation. A patient with amyloidosis
was also included for comparative purposes, as amyloidosis
represents an associated plasma cell dyscrasia and was used to
complement the spectrum of TET mRNA expression profiles
across plasma cell disorders (Table
I; Fig. 1). Exclusion criteria
comprised insufficient quantity or quality of the BM sample, low
plasma cell infiltration preventing reliable CD138+ cell
sorting or degraded nucleic acids not suitable for downstream
analyses.
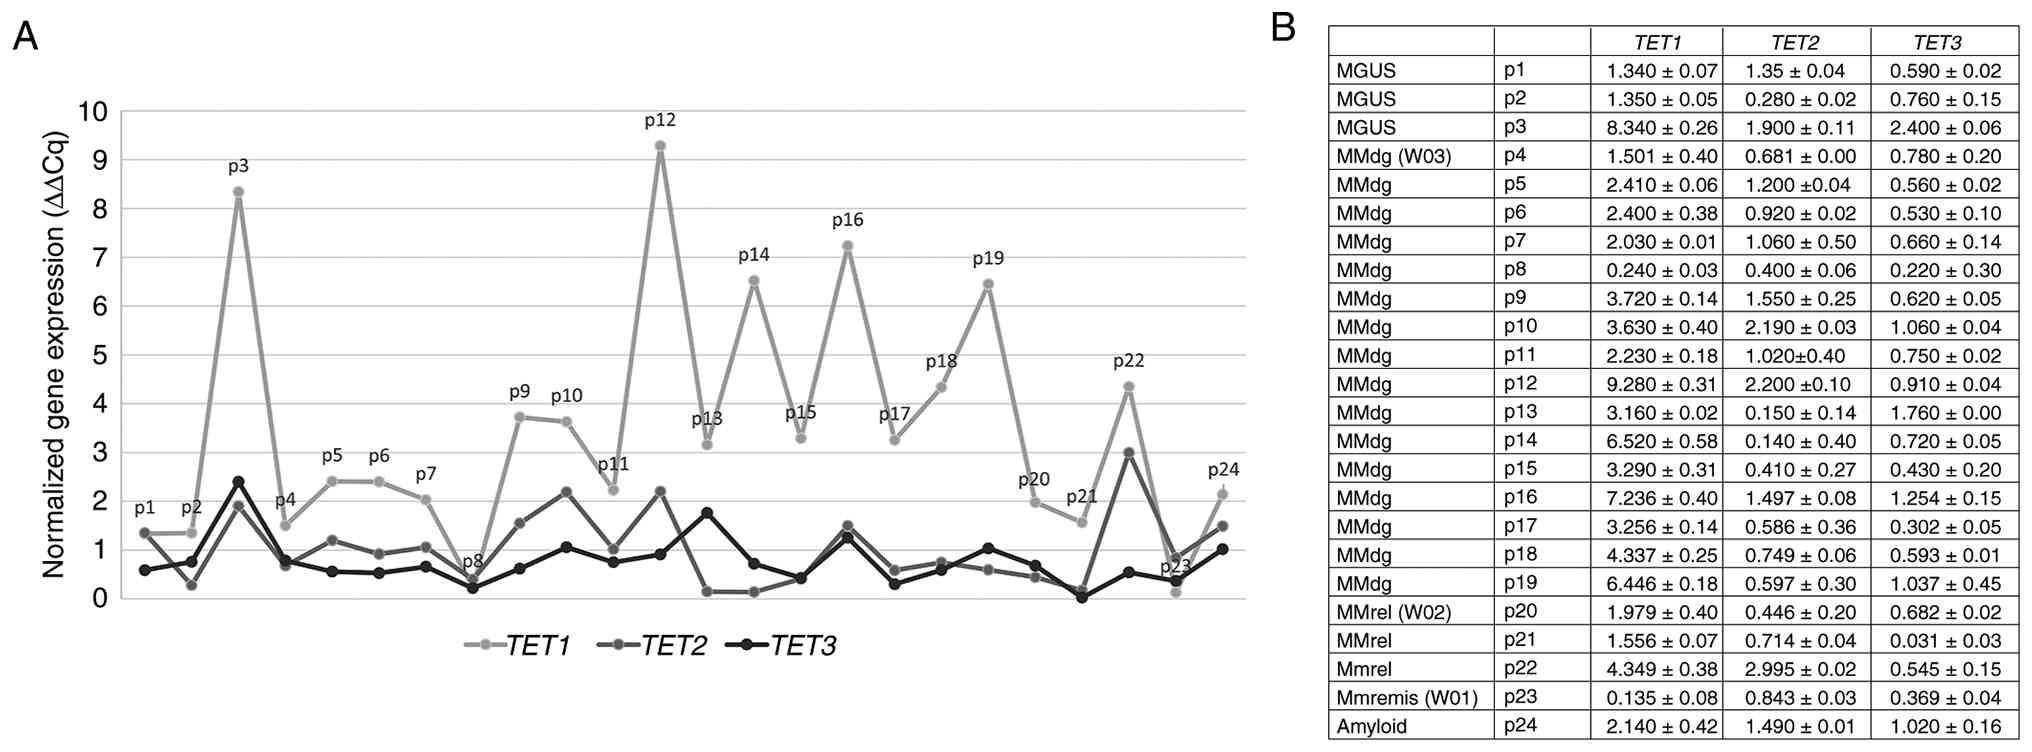 | Figure 1.Schematic overview of the mRNA
expression profile of TET1, TET2 and TET3 genes in
CD138+ purified plasma cells obtained from patients in
different stages of MM. Individuals are grouped as follows: MGUS
stage, patients 1–3; MMdg, patients 4–19; MMrel, patients 20–22;
MMremis, patient 23; and patients with amyloidosis, patient 24. (A)
Relative mRNA expression levels of TET1, TET2 and
TET3 as determined by reverse transcription-quantitative
PCR. mRNA expression was normalized to the β2-microglobulin
reference gene. (B) Table showing mean ± SD values of TET1,
TET2 and TET3 mRNA expression levels for each patient.
Each patient sample was measured in technical replicate and mean
values were used for analysis. TET, ten-eleven translocation; MM,
multiple myeloma; MGUS, monoclonal gammopathy of undetermined
significance; MMdg, newly diagnosed patients with MM; MMrel,
patients with MM in the relapsed stage; MMremis, MM patient in
remission. |
 | Table I.No. of patient samples analyzed for
each assay across disease stages, stratified by clinical stage. |
Table I.
No. of patient samples analyzed for
each assay across disease stages, stratified by clinical stage.
| Analysis | MGUS, n | MM newly diagnosed,
n | MM remission,
n | MM relapsed, n | Amyloid | Total, n | Male, n | Female, n |
|---|
| Schematic overview
of the mRNA expression of TET genes | 3 | 16 | 1 | 3 | 1 | 24 | 21 | 3 |
| mRNA expression
profiles of TET genes | 0 | 16 | 0 | 3 | 0 | 19 | 18 | 1 |
| 5-mC in CCGG sites
of TET genes | 0 | 14 | 0 | 3 | 0 | 17 | 16 | 1 |
| Proportion of 5-mC
and 5-hmC in TET gene promoters | 0 | 2 (W03 and
W04) | 1 (W01) | 1 (W02) | 0 | 4 | 4 | 0 |
The CD138+ sorted cell population data
was prepared from the plasma cells of BM-aspirate, from 24 patients
with MM in different stages: i) Active MM, comprising newly
diagnosed patients and patients in relapse/progression as per IMWG
criteria; and ii) remission phase MM, defined as achieving at least
a partial response after finished initial treatment or being in
stable remission after stem cell transplant with continued
maintenance therapy. The patients were recruited for the present
study at the Department of Hemato-Oncology, University Hospital
Olomouc (Olomouc, Czech Republic) between August 2018 and November
2019. All experiments involving patient samples were performed at
the Department of Immunology and the Department of Clinical and
Molecular Pathology, both within the Faculty of Medicine and
Dentistry, Palacky University Olomouc (Olomouc, Czech Republic).
The clinicopathological characteristics of the entire cohort (n=24)
are provided in Table II.
| Table II.Clinicopathological characteristics
of 24 patients included in the present study. |
Table II.
Clinicopathological characteristics
of 24 patients included in the present study.
|
Characteristics | MGUS (n=3) | MMdg (n=16) | MMrel (n=3) | MMremis (n=1) | Amyloid (n=1) |
|---|
| Sex, n (%) |
|
|
|
|
|
|
Male | 1 (33.3) | 15 (93.8) | 3 (100.0) | 1 (100.0) | 1 (100.0) |
|
Female | 2 (66.7) | 1 (6.2) | 0 (0.0) | 0 (0.0) | 0 (0.0) |
| Age, years | 75±7 | 65±12 | 77±5 | 66 | 53 |
| High-risk
cytogenetics, n (%) |
|
|
|
|
|
|
Yes | 0 (0.0) | 4 (25.0) | 2 (66.7) | 0 (0.0) | 1 (100.0) |
| No | 3 (100.0) | 7 (43.8) | 0 (0.0) | 1 (100.0) | 0 (0.0) |
|
Unknown | 0 (0.0) | 5 (31.2) | 1 (33.3) | 0 (0.0) | 0 (0.0) |
| Monoclonal
immunoglobulin types, n (%) |
|
|
|
|
|
|
IgG | 2 (66.7) | 14 (87.5) | 2 (66.7) | 1 (100.0) | 0 (0.0) |
|
IgA | 1 (33.3) | 2 (12.5) | 1 (33.3) | 0 (0.0) | 1 (100.0) |
| Stage ISS, n
(%) |
|
|
|
|
|
| 1 |
| 4 (25.0) | 0 (0.0) | 0 (0.0) | 1 (100.0) |
| 2 |
| 8 (50.0) | 1 (33.3) | 0 (0.0) | 0 (0.0) |
| 3 |
| 3 (18.8) | 2 (66.7) | 1 (100.0) | 0 (0.0) |
|
Unknown |
| 1 (6.2) | 0 (0.0) | 0 (0.0) | 0 (0.0) |
| Treatment exposure,
n (%) |
|
|
|
|
|
|
Untreated | 3 (100.0) | 0 (0.0) | 0 (0.0) | 0 (0.0) | 0 (0.0) |
|
Proteasome inhibitor
based | 0 (0.0) | 15 (93.8) | 1 (33.3) | 0 (0.0) | 1 (100.0) |
|
IMiD-based (Thal/Len/Pom) | 0 (0.0) | 7 (43.8) | 2 (66.7) | 1 (100.0) | 0 (0.0) |
|
Anti-CD38 monoclonal
antibody | 0 (0) | 0 (0) | 0 (0) | 1 (100) | 0 (0) |
| ASCT
(transplantation) | 0 (0) | 1 (6.2) | 0 (0) | 0 (0) | 0 (0) |
Among the 24 patients (mean age 64±6 years), 3
patients [two with monoclonal gammopathy of undetermined
significance (MGUS) and one newly diagnosed MM] were female and the
remaining 21 patients were male. For the quantification of DNA
methylation (5-mC and 5-hmC) at a specific CCGG site, a subset of
four patients (samples W01-W04) was selected from the primary
cohort. The selection was based on the availability of sufficient
amounts of high-quality genomic DNA and the requirement to include
representative samples from distinct disease stages (newly
diagnosed MM, remission and relapse). As a result, the final subset
consisted exclusively of male patients, as the available samples
from female patients did not meet the quality and/or quantity
requirements for this restriction enzyme-based assay. The
clinicopathological characteristics of these 4 patients are
presented in Table SI.
MM cell lines
In total, 5 different MM cell lines were used:
RPMI8226, U266/B1, OPM-2, KMS12-PE and KMS12-BM. The cell lines
RPMI8226 (cat. no. CCL155), U266/B1 (cat. no. TIB-196) and OPM-2
(cat. no. ACC 50) were purchased from the American Type Culture
Collection and KMS12-BM (cat. no. JCRB0429) and KMS12-PE (cat. no.
JCRB0430) cell lines were obtained from the Japanese Cancer
Research Resources Bank (National Institute of Biomedical
Innovation). To determine their authenticity, the KMS12-BM and
KMS12-PE cell lines were assessed using the AmpF/STR™ IdentiFiler™
(Thermo Fisher Scientific, Inc.) for eight short tandem repeat
markers in DNA (Tables SII and
SIII). The cells were maintained
in RPMI-1640 medium supplemented with 10% or 15% FBS, respectively,
1% penicillin-streptomycin antibiotics, 1% L-glutamine and 100 mM
sodium pyruvate, at 37°C with 5% CO2. Under these
conditions, cell lines were treated with 0.2 and 0.5 µmol/l
5-azacytidine (AZA) and/or 5-aza-2′-deoxycytidine (decitabine; DAC)
for 48 h with 24 h of re-treatment. Cells treated with an
equivalent concentration of DMSO served as vehicle control. All
cell line experiments were conducted at the Department of Clinical
and Molecular Pathology, Faculty of Medicine and Dentistry, Palacky
University Olomouc (Olomouc, Czech Republic).
Reverse transcription-quantitative PCR
(RT-qPCR)
RNA preparation was performed from
CD138+-enriched BM cells using the Single Cell RNA
Purification Kit (Norgen Biotek Corp.) and from treated MM cell
lines with TRI Reagent® BD (Molecular Research Center,
Inc.). Reverse transcription of 100 ng of total RNA was performed
using the Transcriptor First Strand cDNA Synthesis Kit (Roche
Diagnostics), according to the manufacturer's protocol.
RT-qPCR was conducted with Taq-Man™ probes (cat. no.
4331182; Thermo Fisher Scientific) and Xceed qPCR Probe Mix (cat.
no. NPCR 10502 S; Xceed; iBioTech), using the Light
cycler® 480 System (Roche Diagnostics). The
thermocycling conditions were as follows: Initial denaturation at
95°C for 10 min, followed by 45 cycles of denaturation at 95°C for
15 sec and a combined annealing/extension step at 60°C for 60
sec.
The mRNA expression levels of TET1 (assay ID:
Hs04189344 g1), TET2 (assay ID: Hs00766782_s1) and
TET3 (assay ID: Hs00896441_m1) were quantified by RT-qPCR
from complementary DNA (cDNA) synthesized by reverse transcription
of mRNA and normalized to the expression of endogenous housekeeping
control β2-microglobulin (assay ID: Hs00984230_m1). All used probes
were provided by Thermo Fisher Scientific, Inc. qPCR data were
analyzed using the 2−ΔΔCq quantification method
(37), with untreated cells used
as the control group.
The human TET1 transcript NM_030625 is
located on chromosome 10 (GRCh38/hg38 assembly) at positions
68560337-68694487 on the plus strand. The promoter region was
operationally defined as 1 kb upstream and 1 kb downstream of the
transcription start site (TSS). The TET2 transcript
NM_017628.4 is located on chromosome 4 (GRCh38/hg38 assembly) at
positions 105145875-105242771 on the plus strand, with the promoter
defined at TSS ± 1 kb. The TET3 transcript NM_001287491.2 is
located on chromosome 2 (GRCh38/hg38 assembly) at positions
73984910-74108176 on the plus strand and its promoter was similarly
defined relative to TSS.
Western blotting
KMS12-PE and KMS12-BM cell lines were treated with
the DNA demethylating agents AZA or DAC at final concentrations of
0.2 and 0.5 µmol/l for 48 h, with retreatment after 24 h. Cells
treated with an equivalent concentration of DMSO served as vehicle
control.
Total protein lysates were prepared using
self-prepared RIPA lysis buffer (10 mM Tris-HCl pH 8.0, 1 mM EDTA,
0.5 EGTA, 140 mM NaCl, 1% Triton X-100, 0.1% sodium deoxycholate
and 0.1% SDS) supplemented with protease inhibitors (Roche
cOmplete™ Protease Inhibitor Cocktail Tablets; cat. no.
04693124001; Roche Diagnostics). Cells were incubated on ice for 30
min with occasional vortexing and lysates were clarified by
centrifugation at 14,000 × g for 15 min at 4°C. Protein
concentration was determined using the Bradford assay (Bio-Rad
Protein Assay Dye Reagent Concentrate; cat. no. 5000006; Bio-Rad
Laboratories, Inc.).
Equal amounts of protein (20 µg per lane) were mixed
with Laemmli sample buffer, boiled at 95°C for 5 min and resolved
by SDS-PAGE on precast 4–15% gradient polyacrylamide gels
(Mini-PROTEAN® TGX™; cat. no. 4561085; Bio-Rad
Laboratories, Inc.). The use of gradient gels allowed efficient
separation of proteins across a broad range of molecular weights
(TET1 ~235 kDa, TET2 ~130 kDa and GAPDH ~37 kDa).
Electrophoresis was performed at 100 V for ~120 min. Proteins were
transferred onto nitrocellulose membranes using semi-dry transfer
conditions (10 A for 50 min). The membranes were subsequently cut
according to molecular weight and processed separately for
incubation with the indicated antibodies. Membranes were then
blocked in 5% non-fat dry milk in TBS-T (TBS containing 0.1%
Tween-20) for 60 min at room temperature.
For detection of TET1, membranes were
incubated with rabbit polyclonal anti-TET1 antibody (cat.
no. ab191698; Abcam) diluted 1:1,000 in 5% milk/TBS-T overnight at
4°C. For detection of TET2, membranes were incubated with
rabbit polyclonal anti-TET2 antibody (cat. no. 21207-1-AP;
Proteintech Group, Inc.) diluted 1:1,000 in 5% milk/TBS-T overnight
at 4°C.
After primary antibody incubation, membranes were
washed 3 times in TBS-T and incubated with HRP-conjugated goat
anti-rabbit IgG secondary antibody (cat. no. 7074S; Cell Signaling
Technology, Inc.; 1:3,000) for detection of TET1 and
TET2 or with HRP-conjugated goat anti-mouse IgG secondary
antibody (cat. no. 7076S; Cell Signaling Technology, Inc.; 1:5,000)
for detection of GAPDH, both for 1 h at room temperature. Following
additional washing steps, immunoreactive bands were visualized
using the infrared LI-COR Odyssey Imaging System (LI-COR
Biosciences) and analyzed using Image Studio software (version 2.0;
LI-COR Biosciences). The expected molecular weights were ~235 kDa
for TET1 and 130 kDa for TET2. GAPDH was used as a
loading control.
Western blotting signals were evaluated
qualitatively based on band intensity. Densitometric analysis was
not performed, as the experiments were intended to provide
supportive determination of expression changes observed at the mRNA
level.
Isolation of genomic DNA and detection
of 5-hmC in MM cell line
Genomic DNA was isolated from the KMS12-PE cell line
using the Wizard® Genomic DNA Purification Kit (Promega
Corporation) according to the manufacturer's instructions. DNA
concentration and purity were assessed using a NanoDrop™
spectrophotometer (Thermo Fisher Scientific, Inc.) and samples were
stored at −20°C. The isolated genomic DNA was used for colorimetric
quantification of global 5-hmC using the MethylFlash™
Hydroxymethylated DNA 5-hmC Quantification Kit (Colorimetric; cat.
no. P-1036; EpigenTek Group, Inc.). This assay is based on an
ELISA-like format that specifically detects 5-hmC without
cross-reactivity to 5-mC or unmodified cytosine.
Genomic DNA (200 nm per well) was bound to the
light-affinity strip wells provided in the kit. After DNA binding
and washing, a primary capture antibody (cat. no. P-1036-96;
EpigenTek Group, Inc.; 1,1000) specific for 5-hmC and a
corresponding detection antibody (cat. no. P-1036-48; EpigenTek
Group, Inc.; 1:1,000), both provided within the MethylFlash™
Hydroxymethylated DNA 5-hmC Quantification Kit (Colorimetric; cat.
no. P-1036; EpigenTek Group, Inc.), were applied according to the
manufacturer's instructions. A colorimetric signal was generated
using the enhancer and developer solutions, and the absorbance was
read at 450 nm on microplate spectrophotometer to obtain optical
density (OD) values.
Each sample was measured in triplicate, together
with kit-provided negative and positive controls. A calibration
curve was generated from the positive control dilution series
according to the manufacturer's instructions to allow absolute
quantification of 5-hmC. The amount of 5-hmC (ng) in each sample
was calculated using the standard curve slope generated from linear
regression and the global percentage of 5-hmC relative to input DNA
was determined as follows: 5-hmC (ng)=(sample OD450-negative
control OD450)/slope ×5* and [5-hmC (%)=5-hmC (ng)/S] ×100, whereby
‘S’ refers to the amount of input sample DNA (ng) and ‘5*’ is a
factor to normalize 5-hmC in the positive control to 100%, as the
positive control contains only 20% of 5-hmC.
Restriction enzyme-based DNA
methylation analysis
Both 5-hmC and 5-mC levels at a particular CCGG site
were measured with a restriction enzyme-based assay, the EpiMark
5-hmC and 5-mC analysis kit (EpigenTek Group, Inc.) (26,38),
according to the manufacturer's instructions. The assay is based on
the differential susceptibility of methylated and hydroxymethylated
DNA to cleavage by HpaII and MspI. Genomic DNA (620
ng) was treated with 30 units of T4 β-glucosyltransferase and 80 µl
uridine diphosphate-glucose at 37°C for 16 h. Glucosylated DNA was
digested with 100 units of MspI, 50 units of HpaII or
no enzyme (mock digestion) at 37°C for 4 h, followed by treatment
with 1 µl proteinase K (20 mg/ml) at 40°C for 30 min.
For qPCR, 1 µl glycosylated/digested DNA was used
with promoter-specific primers. Primer sequences were as follows:
TET1 gl (−528): Forward (F), 5′-ACTCCCTGAGGTCTGTCCTG-3′ and
reverse (R), 5′-CAGGTAGGGCTGCATGACTT-3′; TET2 gl (−421) F,
5′-GAAGGTGGGCCGGGGCGG-3′ and R, 5′-GAGAGGGTGTGCTGCTGAAT-3′; and
TET3 gl (−816) F, 5′-AAAGGCCATGGTAGGAAGTG-3′ and R,
5′-TGAAGTAGCGCTGTCCAGAA-3′.
Pyrosequencing™ methylation analysis
of CpG sites
Genomic DNA was isolated from BM aspirates and
CD138+ sorted cells of patients with MM using a QIAamp
DNA Mini Kit (Qiagen GmbH). Bisulfite treatment of extracted
genomic DNA was conducted as aforementioned. PCR primers and
subsequent pyrosequencing reaction were designed using
PyroMark® Assay Design SW 2.0 (Qiagen GmbH).
Pyrosequencing primers were designed to the promoter regions of the
TET1 (genomic reference: NC_000010.11, −528 bp upstream of
the TSS), TET2 (genomic reference: NC_000004.12, −421 bp
upstream) and TET3 (genomic reference: NC_000002.12, −816 bp
upstream). The primer sequences used were as aforementioned.
In brief, 1 µl bisulfite-treated DNA was added to a
25 µl PCR reaction mixture containing 12.5 µl 1X PyroMark PCR
Master Mix (Qiagen GmbH), 1 µl 25 mM MgCl2, 2.5 µl 1X
CoralLoad Concentrate (Qiagen GmbH), 0.2 µl forward primer and 0.2
µl biotinylated reverse primer. For HotStartTaq Polymerase
activation, the PCR reaction mixture was initially denatured at
95°C for 15 min, followed by 45 cycles of denaturation at 94°C for
30 sec, annealing at 56°C for 30 sec, elongation at 72°C for 30 sec
and the final extension at 72°C for an additional 10 min after the
last cycle. The PCR products were verified by electrophoresis on a
2% agarose gel. The incurred biotinylated PCR product was
immobilized on Streptavidin Sepharose® High Performance
(GE Healthcare), precipitated with 70% ethanol, passed through a
denaturation step and then a washing step using PyroMark Q96 Vacuum
Workstation (Qiagen GmbH). The amplicons were transferred to each
well of the PyroMark Q96 plate containing 40 µl of 0.4 µM
sequencing primer diluted in annealing buffer (Qiagen GmbH).
Control samples (bisulfite unmethylated and methylated DNA; Qiagen
GmbH) were part of a set of analyzed samples from patients with MM.
The pyrosequencing analysis was performed using the PyroMark CpG
software (version 1.0.11; Qiagen GmbH). The methylation value was
quantified in terms of the methylation level (MtL) as the mean
percentage of cytosines methylated per CpG: MtL (%)=(Σ% methylated
cytosines)/no. of CpGs analyzed.
Quantification of DNA methylation of
5-mc and 5-hmC at a specific CCGG site
To identify DNA methylation changes associated with
MM pathogenesis, the 5-mC/5-hmC percentage abundance was
investigated in patients at three different stages of MM: i) Newly
diagnosed MM (samples W03 and W04); ii) MM in remission (sample
W01); and iii) MM in the relapsed stage (sample W02). Calculation
of the methylation status of inner C in CCGG sites was performed
using the following formula: ChmCGG (%)=[M2 ×
(C1/C2)]-M1]/C1 and CmCGG (%)=[H1-M2 × (C1/C2)]/C1.
Representative values used for these calculations are shown in
Table III.
| Table III.Representative example of default
values for percentage calculation of 5-mC and 5-hmC at 175 bp
promoter TET1, 236 bp promoter TET2 and 160 bp
promoter TET3 regions in the W02 sample of CD138+
sort cell population of relapsing patients with MM. |
Table III.
Representative example of default
values for percentage calculation of 5-mC and 5-hmC at 175 bp
promoter TET1, 236 bp promoter TET2 and 160 bp
promoter TET3 regions in the W02 sample of CD138+
sort cell population of relapsing patients with MM.
| Sample | Target | Reference Cq
value | Target/reference Cq
value | Normalized ∆∆Cq
value |
|---|
| W02
TET1 | Control | 29.947 M2 | 30.547 M1 | 1.00 |
| W02 | Control | 29.782 H2 | 29.943 H1 | 0.74/hmC |
| W02 | Control | 29.609 C2 | 30.780 C1 | 1.49/hmC + mC |
| W02
TET2 | Control | 24.937 M2 | 25.323 M1 | 1.00 |
| W02 | Control | 27.234 H2 | 27.976 H1 | 1.28/hmC |
| W02 | Control | 25.542 C2 | 26.365 C1 | 1.35/hmC + mC |
| W02
TET3 | Control | 31.739 M2 | 33.292 M1 | 1.00 |
| W02 | Control | 35.747 H2 | 35.339 H1 | 0.26/hmC |
| W02 | Control | 30.509 C2 | 32.291 C1 | 1.17/hmC + mC |
In the calculations (Table SI), the parameters were: M2
(5-hmC), normalized Cq values as target unknown, Tube 1; H2 (5-mC +
5-hmC), normalized Cq values as target unknown, Tube 2; C2,
normalized Cq values as target poscalibrator, Tube 3; M1,
normalized Cq values as reference unknown, Tube 4; H1, normalized
Cq values as reference unknown, Tube 5; C1-normalized Cq values as
reference poscalibrator, Tube 6.
The percentages of 5-hmC, 5-mC and cytosine were
calculated using the comparative Cq method (Table III) when the HpaII- and
MspI-resistant fraction was normalized to the mock digestion
control (C2 and C1). The 5-hmC levels were determined directly from
the fraction resistant to MspI digestion (M1 and M2), as
MspI is inhibited by the presence of 5-hmC but cleaves both
unmethylated cytosine and 5-mC. The 5-mC (H2 and H1) levels were
obtained by subtracting the 5-hmC contribution from the total
HpaII resistance.
Library preparation and nanopore
sequencing
Genomic DNA was extracted from the KMS12-PE cell
line after the AZA and/or DAC (0.2 and 0.5 µmol/l) treatments using
the QIAGEN Blood and Cell Culture DNA Kit (Qiagen GmbH) following
the manufacturer's protocol. DNA quality and concentration were
assessed using a Qubit® Fluorometer (Invitrogen; Thermo
Fisher Scientific, Inc.). Sequencing libraries were prepared using
the Oxford Nanopore Technologies Native Barcoding Kit 96 V14 (cat.
no. SQK-NBD114.96; Oxford Nanopore Technologies plc) and VAHTS TGS
DNA Library Prep Kit for (Vazyme Biotech Co., Ltd.) following the
manufacturer's protocol with modifications, including omission of
intermediate clean-up steps and adjustment of input DNA and
reaction volumes as specified below. The DNA input used was 1,000
ng per sample and end-repair and barcode ligation were performed
without intermediate clean-up. After barcode ligation, 2 µl EDTA
was added to each sample to stop the reaction prior to pooling.
Samples were then pooled and cleaned using AMPure XP beads (cat.
no. A63880; Beckman Coulter, Inc.). Adapter ligation was performed
using Oxford Nanopore Technologies reagents. DNA concentration was
measured with the Qubit® dsDNA HS Assay Kit (Thermo
Fisher Scientific, Inc.) and adjusted as needed. For sequencing, 5
µl of the library was included in a final loading mix with total
volume 32 µl, which was loaded onto an R10.4.1 flow cell
(FLO-PRO114) and sequenced on the PromethION platform (Oxford
Nanopore Technologies plc).
Basecalling and 5-mC methylation calling in a CpG
context were performed using the Dorado basecaller within the
wf-human-variation pipeline (version 2.6.0; Oxford Nanopore
Technologies plc). Reads were aligned to the GRCh38 human reference
genome using the minimap2 software (version 2.24; Heng Li,
Dana-Farber Cancer Institute) and methylation frequencies were
generated using the modkit software (version 0.3.3; Oxford Nanopore
Technologies plc) with default probability thresholds. Basic
quality control was performed to determine high data integrity with
a median mapping accuracy of 99%, a read N50 of 39.3 kb and mean
sequencing coverage of 4.05× across targeted regions. Analysis of
methylation levels was specifically focused on standardized
promoter regions of the TET1, TET2 and TET3 genes
(chromosome 10: 68570336-68595336, chromosome 4:
105105874-105319803 and chromosome 2: 73943630-74175498). Amplicons
were designed to cover these coordinates. Methylation levels were
calculated per CpG site and summarized for each promoter region,
following the coordinates presented in Table SIV.
Chromatin immunoprecipitation (ChIP)
and ChIP-qPCR assays
ChIP assays were performed using the Magna
ChIP® A/G Chromatin Immunoprecipitation Kit (cat. no.
17-10085; Merck KGaA) according to the manufacturer's instructions.
Sonicated chromatin prepared from KMS12-PE cells (5×10⁶
cell equivalents per immunoprecipitation) was incubated overnight
at 4°C with gentle rotation with 2 µg anti-SP1 (cat. no. ab13370;
Abcam) or anti-SP3 (cat. no. ab227856; Abcam) antibodies (diluted
in a total volume of 515 µl). Normal rabbit IgG (cat. no. 2729S;
Cell Signaling Technology, Inc.; 2 µg) was used as a negative
control under the same conditions. Immunoprecipitated DNA was
purified using the Magna ChIP® A/G Chromatin
Immunoprecipitation Kit (cat. no. 17-10085; Merck KGaA) according
to the manufacturer's instructions and subsequently analyzed by
qPCR. The ChIP-qPCR conditions were identical to those described
above for RT-qPCR. Primers specific for the promoter regions of
TET1 (genomic reference: NC_000010.11; −528 bp upstream of
TSS), TET2 (genomic reference: NC_000004.12; −421 bp
upstream) and TET3 (genomic reference: NC_000002.12; −816 bp
upstream) were used for ChIP-qPCR. The primer sequences used for
ChIP-qPCR were as aforementioned. The two methods used for
ChIP-qPCR data normalization were fold enrichment and percent of
input. Fold enrichment is a signal-to-noise ratio comparing the
amount of target sequence measured in the immunoprecipitate isolate
to the amount measured in a negative control isolate (39). The percent input method compares
the amount of target sequence measured in the immunoprecipitate
isolate to the total amount of the target sequence in the input
isolate (40).
Statistical analysis
Statistical analysis was performed using Statistica
software (version 14.0.0.15; TIBCO Software, Inc.). Data are
expressed as the mean ± SD. Patient samples were analyzed in
technical triplicates and MM cell lines experiments were performed
in both biological and technical triplicates. Due to the small
sample size and limited number of biological replicates,
non-parametric statistical methods were applied. Differences
between groups were evaluated using the Kruskal-Wallis test
followed by Bonferroni post hoc tests for pairwise comparisons.
P<0.05 was considered to indicate a statistically significant
difference and the adjusted significance level after Bonferroni
correction was set at P<0.005.
Results
mRNA expression and DNA methylation
profiles of TET genes in sorted plasma cells
In the CD138+ sorted plasma cells of both
newly diagnosed and relapsed patients with MM, TET1 mRNA
expression levels were increased when compared with that of
TET2 and TET3 (Figs.
1 and 2A). By contrast,
quantitative bisulfite pyrosequencing of the CD138+
purified plasma cell samples showed a decrease in DNA methylation
level at TET1 and TET2 selected promoter regions in
both newly diagnosed and relapsed patients with MM (Table SI), while increased levels of DNA
methylation at the TET3 gene promoter were determined using
the pyrosequencing method (Fig.
2B).
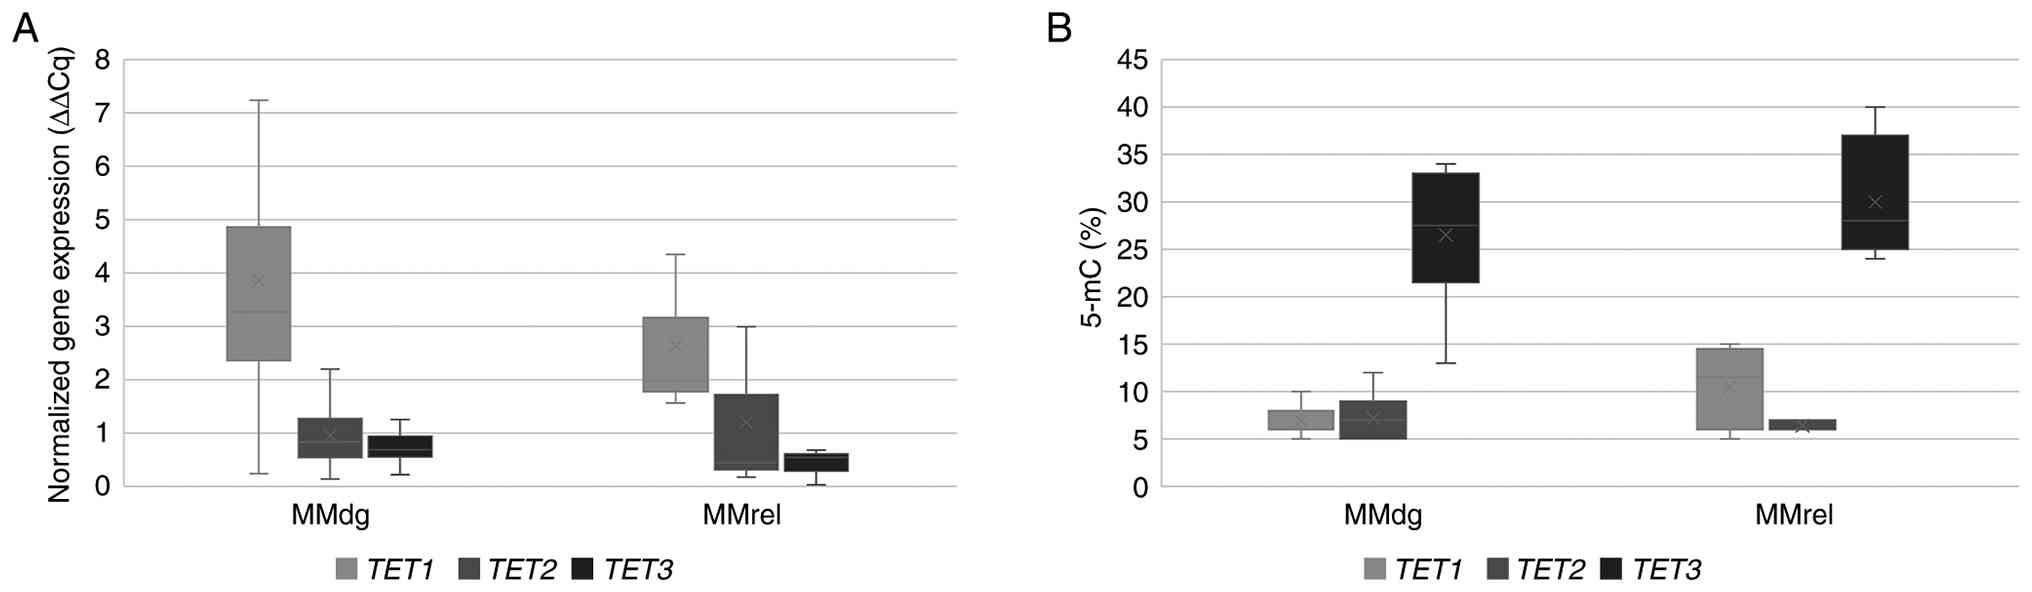 | Figure 2.Comparison of TET1, TET2 and
TET3 mRNA expression profiles and levels of CCGG site
methylation. (A) mRNA expression profiles of TET1, TET2 and
TET3 genes. (B) Percentage of 5-mC in CCGG sites of their
promoter regions. The CD138+ purified plasma cell
samples were compared between MMdg and MMrel patients. Regarding
mRNA expression levels, n=19 independent patients with MM (MMdg,
n=16; MMrel, n=3). For CCGG site methylation levels, n=17
independent patients with MM (MMdg, n=14; MMrel, n=3). Each patient
sample was measured in technical replicate and mean values were
used for analysis. 5-mC, 5-methylcytosine; TET, ten-eleven
translocation; MM, multiple myeloma; MGUS, monoclonal gammopathy of
undetermined significance; MMdg, newly diagnosed patients with MM;
MMrel, patients with MM in the relapsed stage; MMremis, MM patient
in remission. |
TET mRNA expression in demethylated
myeloma cell lines
Changes in the mRNA expression levels of TET
genes after treatment with both demethylating agents was determined
in all myeloma lines used, depending on the demethylation agents
(AZA and/or DAC) and concentration (0.2 µmol/l and/or 0.5 µmol/l;
Fig. 3). For both the KMS12-BM and
KMS12-PE cell lines, demethylation treatment altered the normalized
TET2 mRNA expression levels; however, a statistically
significant difference between TET1, TET2 and TET3
expression was observed only in the KMS12-PE cell line
(P<0.001). The mRNA levels of all three TET genes in the
U266/B1, RPMI and OMP2 cell lines were found not to be
significantly different (Fig.
S1). A further demethylation experiment with KMS12-BM and
KMS12-PE cell lines validated the results of the increased
normalized TET2 mRNA levels compared with the mRNA
expression values of TET1 and TET3 (Fig. 3). Increased normalized TET2
mRNA levels in KMS12-BM did not exhibit a statistical difference.
In the KMS12-PE cell line, the normalized value of TET2 mRNA
(5.146±0.29) was evaluated as significantly increased after 0.2
µmol/l AZA treatment compared with normalized TET1
(1.321±0.16; P<0.01) and TET3 (1.005±0.19; P<0.05)
mRNA expression levels (Fig.
3).
Western blotting analysis of TET1 and
TET2 enzymes
To evaluate the impact of AZA and DAC on the
epigenetic regulatory machinery in the KMS12-PE and KMS12-BM cell
lines, the protein expression levels of TET1 and TET2
were examined using western blotting analysis. Total protein lysate
analysis revealed distinct bands at the expected molecular weights
for both TET1 and TET2. Visual inspection of the
blots revealed that TET1 protein levels remained stable and
did not show an increase following treatment with either AZA or DAC
(0.2 and 0.5 µmol/l). By contrast, a marked and consistent increase
in TET2 band intensity was observed across all treatment conditions
in the KMS12-PE cell line compared with the DMSO control.
Representative blots demonstrating these changes are presented in
Fig. 3 and repetitive gel
experiments demonstrating these findings are provided in Fig. S2. In addition, the original
uncropped gels with molecular weight markers are provided in
Fig. S3.
Changes in global 5-hmC in the
KMS12-PE cell line
Changes in the percentage representation of 5-hmC
were evaluated in the KMS12-PE cell line following treatment with
demethylating agents AZA (0.2 and 0.5 µmol/l) and DAC (0.2 and 0.5
µmol/l). The percentage of 5-hmC increased from 0.15% in the DMSO
control to 0.29 and 0.26% after treatment with AZA at 0.2 and 0.5
µmol/l, respectively and to 0.39 and 0.63% after treatment with DAC
at 0.2 and 0.5 µmol/l (Fig. 4).
Statistically significant differences in 5-hmC levels were observed
across all tested groups (DMSO control, AZA 0.2/0.5 µmol/l and DAC
0.2/0.5 µmol/l; Kruskal-Wallis: P=0.01) and treatment with 0.5
µmol/l DAC differed significantly from the DMSO control (Dunn's
test with Bonferroni correction: α=0.005).
5-mC/5-hmC proportion in patients with
MM
To further investigate the increased TET1
mRNA expression levels and the levels of CCGG site methylation of
TET3 promoter in both the newly diagnosed patients with MM
and in relapsed stage (Fig. 1),
CCGG site methylation patterns of selected promoter TET
regions in CD138+ purified plasma cells of newly
diagnosed patients with MM (samples W03 and W04), MM patient in
remission (sample W01) and MM patient in relapsed stage (sample
W02) were investigated.
The adequacy of the dissociation curves shown in
Fig. 5 was determined by highly
specific and reproducible melting profiles. Each panel displays
overlapping curves from replicates, demonstrating a specific PCR
product. Since 5-mC and 5-hmC share the same DNA sequence, they
possess identical melting temperatures and thus produce a single
dissociation profile per locus. This specificity ensured reliable
Cq determination for the enzymatic digestion-based qPCR used to
calculate the relative percentages of 5-mC and 5-hmC.
In the newly diagnosed patients with MM, the
TET1 promoter region contained 4.98% (W03) and 7.33% (W04)
values of 5-mC without the presence of 5-hmC; whereas 5-hmC was
detected in both patients in remission, W01 (6.64%) and patient in
relapsed stage W02 (1.92%). Similarly, in the newly diagnosed
patients with MM, the TET2 promoter showed 3.80% (W03) and
11.31% (W04) 5-mC percentage values and in the TET3,
increased percentage values 34.93% (W03) and 16.59% (W04) as
compared with that of TET1 were determined. The 5-hmC
abundance was not found in samples of the newly diagnosed patients
(W03 and W04). For all three TET1, TET2 and TET3
genes investigated, it was determined that the highest 5-hmC levels
were in the patient MM in remission (W01) group: 6.64, 8.29 and
1.49% respectively; while patients in the relapsed stage (W02)
showed low levels of 5-hmC: 1.92, 1.63 and 1.70% for TET1,
TET2 and TET3 respectively. In comparison with both W01
and W02 patients, the highest incidence of DNA methylation changes
in the promoter of all tested TET genes was found in both
newly diagnosed patients with MM (W03 and W04; Fig. 5A).
Methylation frequencies (5-mC) of TET
genes after demethylation of myeloma cells
Analysis of DNA methylation patterns in the
TET genes of the KMS12-PE cell line demonstrated a
significant reduction in methylation levels in samples treated with
demethylating agents compared with that of the untreated control.
The control group exhibited a mean methylation frequency ~37% in
the TET1 gene, 41% in TET2 and 41% in TET3,
with minimal variability as determined by Nanopore sequencing and
methylation calling (Fig. 6B). By
contrast, samples treated with AZA and DAC showed markedly
decreased methylation levels across all three genes. The
methylation frequencies for 0.2 µmol/l AZA were ~20% (TET1),
12% (TET2) and 20% (TET3), while for cells treated
with 0.5 µmol/l AZA, the frequencies were 16% (TET1), 18%
(TET2) and 14% (TET3), all showing high variability.
After treatment with 0.2 µmol/l DAC, the frequency of methylation
was ~22% (TET1), 14% (TET2) and 19% (TET3).
The percentage of methylation after 0.5 µmol/l DAC treatment was
27% (TET1), 8% (TET2) and 16% (TET3), also
with high variability.
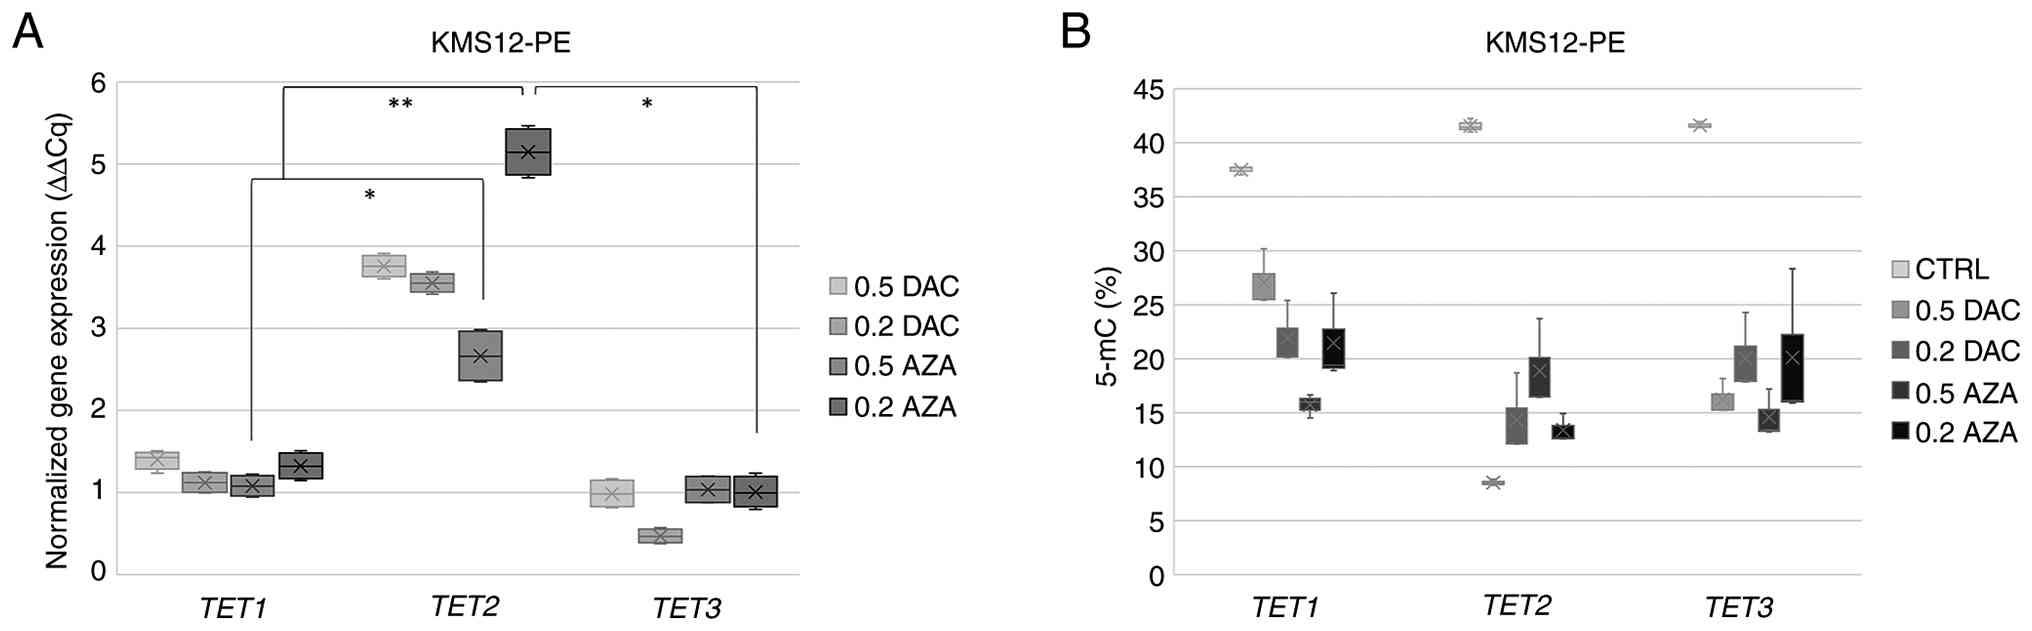 | Figure 6.Comparison of TET mRNA
expression and CCGG site methylation levels in the KMS12-PE cell
line. (A) Normalized TET mRNA expression (ΔΔCq) in KMS12-PE
cell line after treatment with AZA (0.2 and 0.5 µmol/l) and/or (0.2
and 0.5 µmol/l). Cells were treated for 48 h, with retreatment
after 24 h. Data are normalized to the DMSO control, with
β2-microglobulin used as the reference gene. (B) Percentage of
methylation in KMS12-PE myeloma cell lines after treatment with AZA
(0.2 and 0.5 µmol/l) and/or DAC (0.2 and 0.5 µmol/l) for 48 h, with
retreatment after 24 h. Methylation levels targeting TET
gene promoter regions were determined by Oxford Nanopore
Technologies sequencing. Experiments were performed in independent
biological and technical replicates. Data are presented as the mean
± SD. The significance was assessed using the Kruskal-Wallis test
with Bonferroni correction for pairwise comparisons. *P<0.05 and
adjusted P<0.0125; **P<0.01 and P<0.0025. TET, ten-eleven
translocation; MM, multiple myeloma; 5-mC, 5-methylcytosine; MMdg,
newly diagnosed patients with MM; AZA, 5-azacytidine; DAC,
5-aza-2′-deoxycytidine; CTRL, control. |
Specific binding of Sp1/Sp3 TFs and
genes encoding TET enzymes
ChIP analysis was performed with KMS12-PE cells to
determine the specific binding of Sp1/Sp3 to the individual
promoter sequence of TET genes under previously applied
demethylation conditions (AZA and/or DAC at concentrations of 0.2
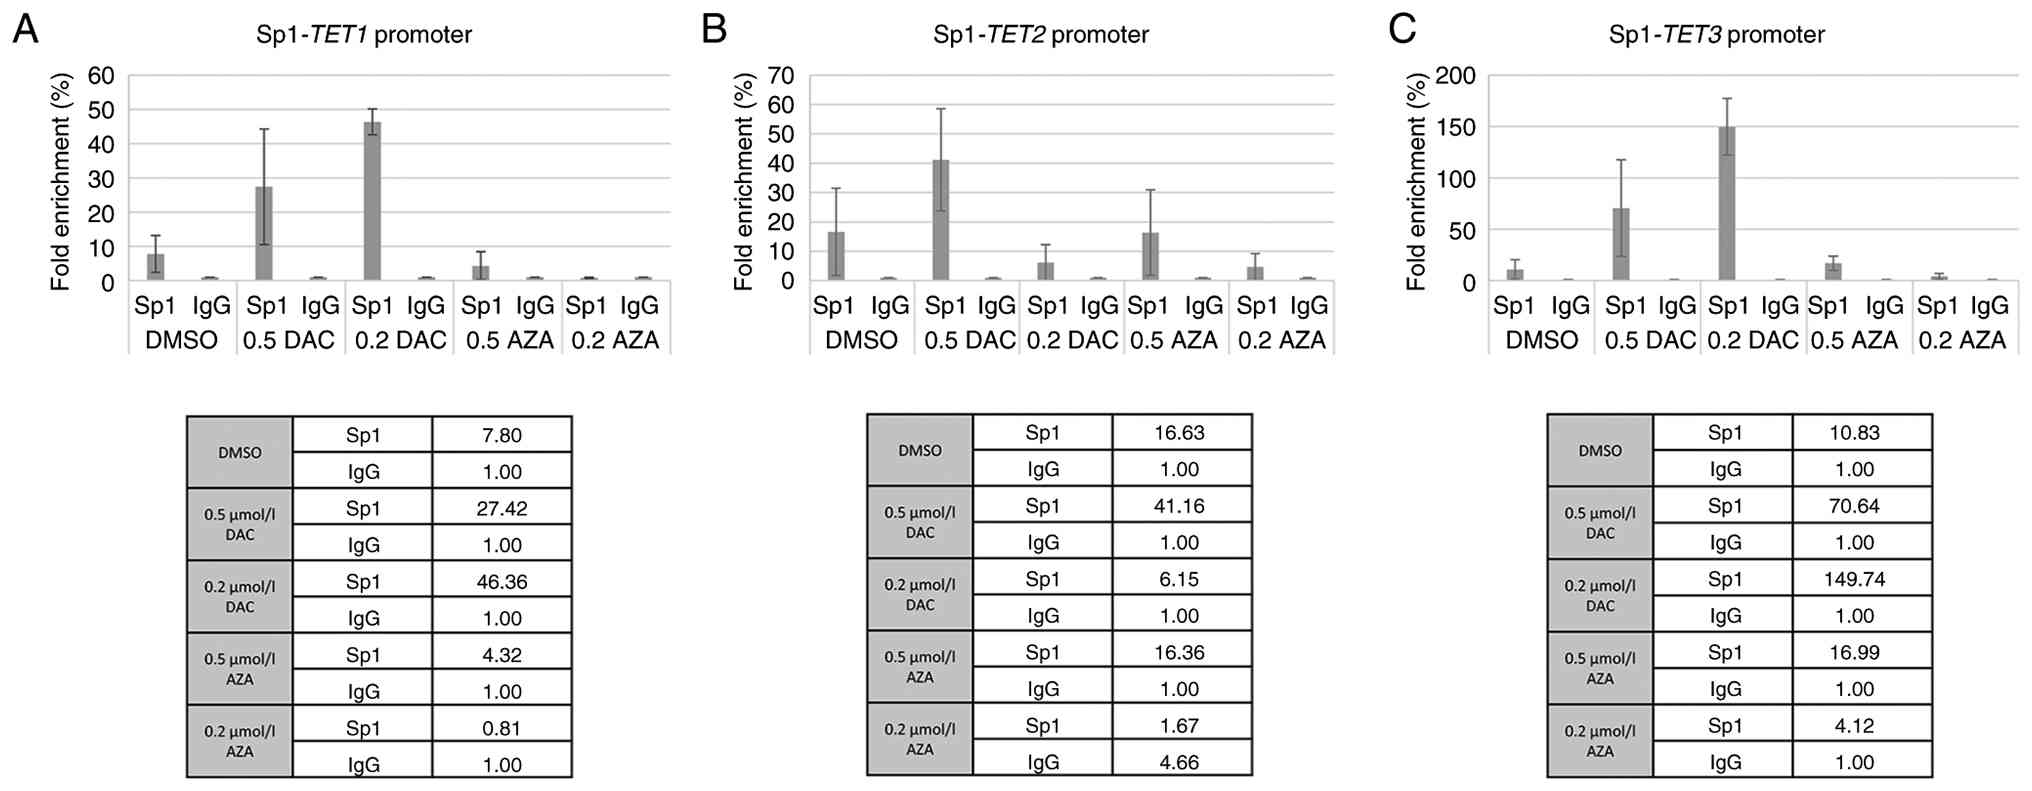
µmol/l and/or 0.5 µmol/l). Fig. 7
shows that Sp1 recruitment to the TET1 and TET3
promoters significantly increased following DAC treatment, peaking
at 0.2 µmol/l DAC for both. While Sp1 binding to the TET2
promoter remained low at 0.2 µmol/l DAC, a notable increase was
observed at 0.5 µmol/l DAC. In addition, 0.5 µmol/l AZA treatment
moderately enhanced Sp1 binding across all three TET
promoters, whereas the 0.2 µmol/l AZA dose resulted in negligible
enrichment.
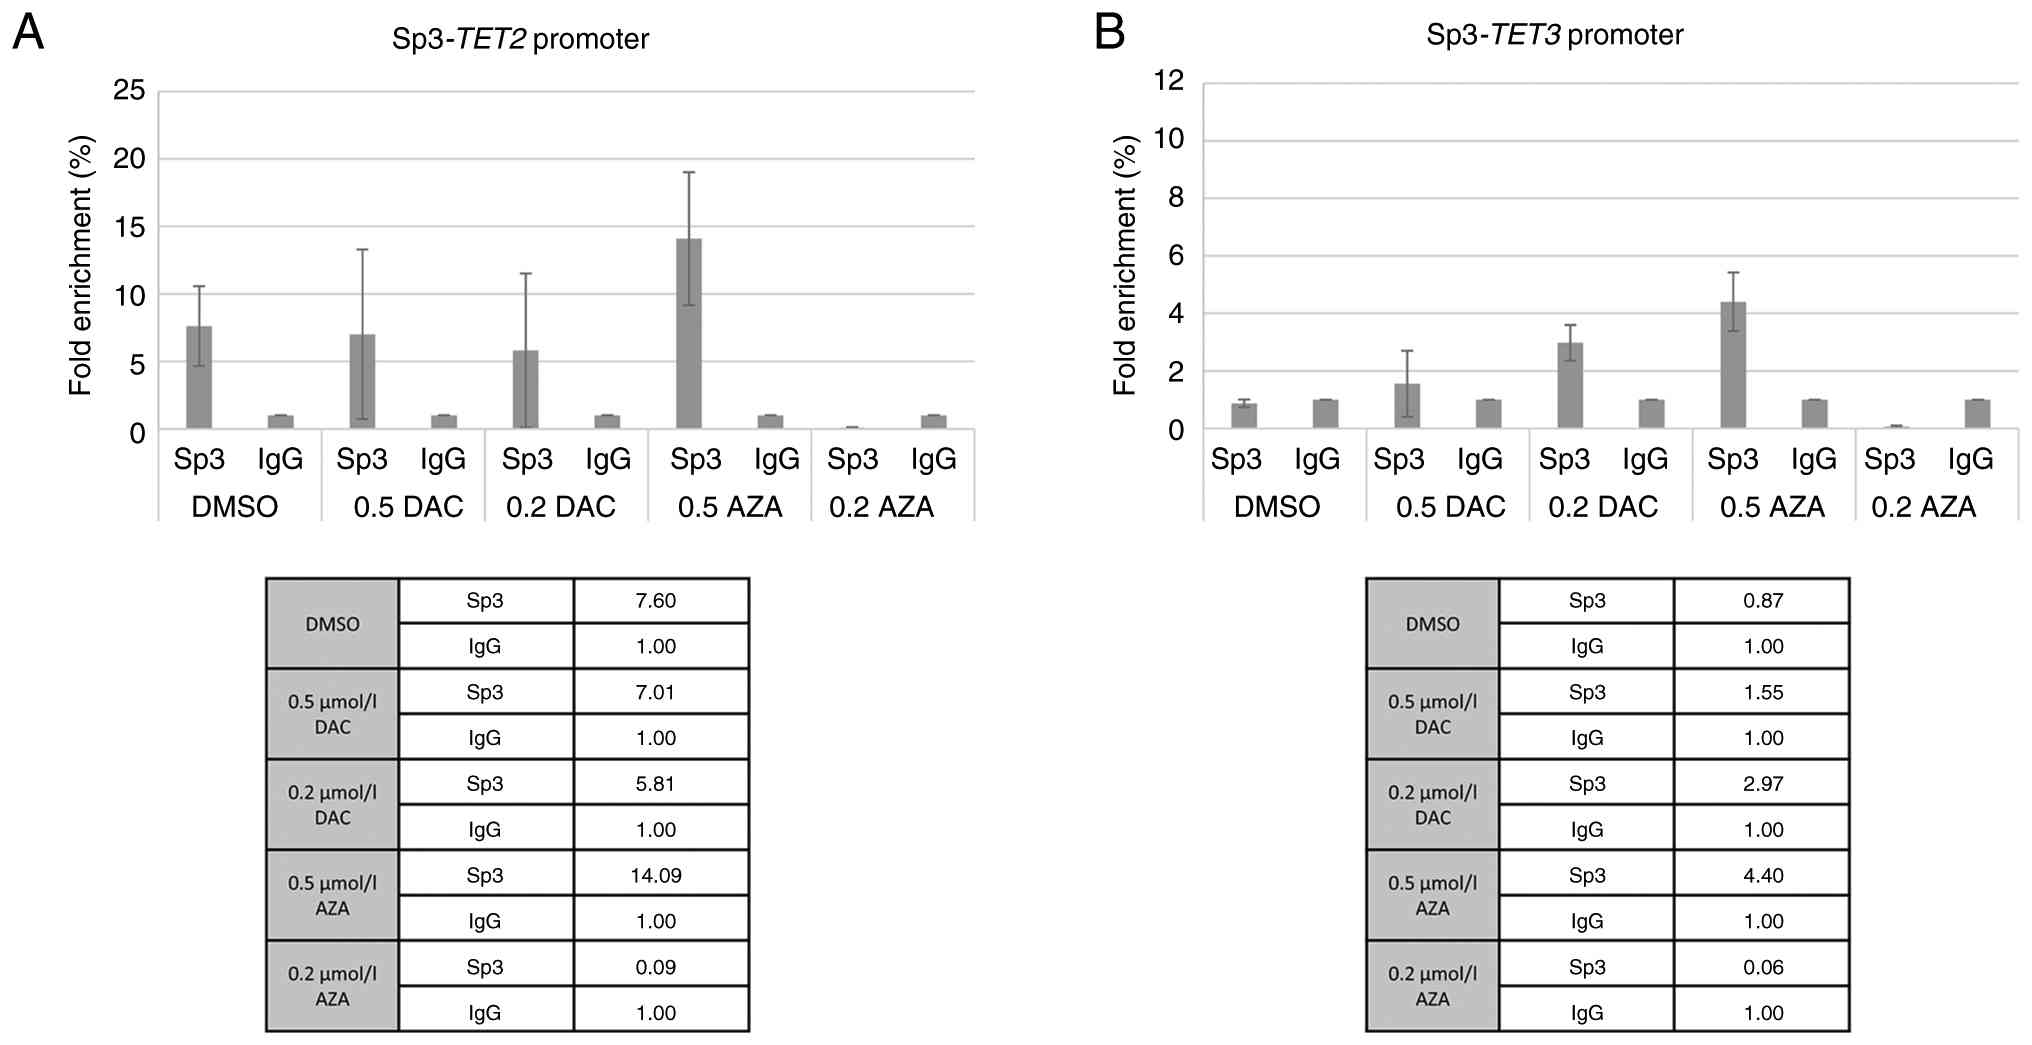
By contrast to Sp1, Sp3 exhibited a more pronounced
response to AZA treatment at the higher concentration (0.5 µmol/l),
which resulted in the highest enrichment for both genes TET2
and TET3. DAC treatment led to a slight, dose-dependent
increase in Sp3 binding at the TET3 promoter but had minimal impact
on TET2 (Fig. 8).
Discussion
TET gene mRNA expression profiles in
CD138+ sorted plasma cells of patients with MM showed an
increased mRNA expression level of the TET1 gene in both
newly diagnosed and relapsed patients. However, in previous
studies, TET1 was shown to be downregulated in numerous
types of cancer, such as breast cancer, oral squamous cell
carcinoma, lymphoma and non-small cell lung carcinoma (7,41–43).
By contrast to the frequent downregulation and key tumor suppressor
roles of TET genes observed in these types of cancer
(44), TET1 is a direct
target of mixed-lineage leukemia (MLL) fusion proteins and is
markedly upregulated in MLL-rearranged leukemia, leading to a
global increase of 5-hmC. Furthermore, while bisulfite
pyrosequencing in the present study cohort showed reduced DNA
methylation levels of the TET1 promoter, the increased
levels of 5-mC in the TET3 promoter corresponded to
TET3 reduced mRNA expression. It should be noted that among
the 24 patients with MM included in the present study, only three
were female (two with MGUS and one newly diagnosed MM), while the
remaining patients were male. Due to the small number of female
samples, potential sex-specific effects on TET expression
and methylation could not be assessed.
Lineage continuity and differentiation of
hematopoietic stem and progenitor stem cells are regulated by
transcriptional programming in interplay with DNA methylation and
histone modifications (4,35,45).
Aberrant DNA methylation patterns have been observed in almost all
types of hematopoietic malignancies, including myelodysplastic
syndromes, AML, diffuse large B-cell lymphoma and peripheral T-cell
lymphoma (46–49). Furthermore, somatic mutations of
DNA methylation regulators such as DNA methyltransferase 3A,
isocitrate dehydrogenase (IDH)-1, IDH2 and
TET2 further underscore the central role of epigenetic
dysregulation of these diseases (50). Therefore, TET2 could
function as a key epigenetic regulator of DNA methylation, as its
disruption is associated with a number of hematological
malignancies (51,52).
The present study detected significantly increased
relative mRNA expression of the TET2 gene in two myeloma
cell lines, KMS12-PE and KMS12-BM. These findings suggested the
presence of methylation changes; particularly, the presence of 5-mC
in the CG dinucleotides of the promoter region of TET2 gene,
which was reduced by the following demethylation treatment. AZA and
DAC treatment led to demethylation in TET promoters, which
was reflected in changes in mRNA expression levels. Significantly
increased mRNA expression levels of TET2 in demethylated
myeloma cell lines suggested the potential of TET2
expression as a biomarker of the hypomethylation process in
association with a good prognosis of MM.
This upregulation was confirmed at the
translational level. The present western blotting analysis
demonstrated an increase in TET2 protein expression across
all treatment conditions in the KMS12-PE cell line, consistent with
the mRNA data. By contrast, TET1 protein levels remained
stable after treatment with demethylating agents.
TET enzymes are directly responsible for the
conversion of 5-mC to 5-hmC and increased TET expression
(26) is therefore expected to be
accompanied by elevated 5-hmC levels. Similarly, treatment of
KMS12-PE cells with AZA and DAC resulted in an increase in the
percentage representation of 5-hmC compared with the DMSO control,
with a statistically significant effect observed for 0.5 µmol/l
DAC, in the present study. These findings provided functional
support for the upregulation of TET2 expression observed in
the present study and suggested that increased TET2
transcript levels are reflected at the level of DNA
hydroxymethylation. However, this analysis was performed in a
single MM cell line (KMS12-PE), which was selected as it exhibited
the most pronounced increase in TET2 expression following
AZA/DAC treatment and validation in additional MM cell lines and
primary patient samples would further strengthen these
findings.
The KMS12-PE cell line used in the present study is
derived from extramedullary MM (pleural effusion), which represents
a biologically distinct form of the disease compared with
BM-resident myeloma. This cell line was established alongside
KMS12-BM from the same patient, documenting the progression from BM
involvement to a more advanced, extramedullary stage (53). Extramedullary myeloma often
exhibits distinct biological and therapeutic responses compared
with BM disease, potentially due to differences in
microenvironmental interactions, genetic and epigenetic profiles
and treatment sensitivity. These factors may contribute to the
divergent responses to DAC and AZA observed between KMS12-BM and
KMS12-PE samples in the present study. Therefore, while KMS12-PE
represents a relevant model for advanced and aggressive disease,
the findings may not fully capture the complete heterogeneity of
MM. Further validation in additional cell lines and primary patient
samples is warranted to demonstrate these observations across
different disease stages.
The present findings revealed a distinct mRNA
expression pattern that aligns with the recently proposed roles of
TET enzymes in hematological malignancies (54). Specifically, high mRNA expression
of TET1 were observed alongside low mRNA levels of
TET2 in primary patient samples, a phenotype that was
reversed upon treatment in cell lines, where TET2 (but not
TET1) was significantly upregulated. This inverse
association suggested that TET1 and TET2 serve
opposing roles in disease biology. Consistent with previous studies
regarding T-cell acute lymphoblastic leukemia and other hematologic
malignancies, TET1 has been implicated as a pro-oncogenic factor
associated with tumor maintenance and adverse prognosis, whereas
TET2 acts as a tumor suppressor. Notably, TET2 is the
most frequently mutated TET family member in hematological
diseases, with loss-of-function alterations representing early
events in disease development, in contrast to the rare mutations
observed in TET1 and TET3 (55). In MM however, TET2 mutations
are relatively rare (~1% of patients in the Myeloma XI trial),
although they have still been identified as early driver events in
disease development (8). Notably,
increased TET2 expression has been associated with improved
OS in MM, supporting its tumor-suppressive role in this context
(56).
Such observations are also consistent with a model
described in T-cell acute lymphoblastic leukemia, where TET1
acts as an oncogene required for tumor maintenance, while
TET2 functions as a potent tumor suppressor whose expression
is actively repressed by oncogenic drivers such as MYC (57). By contrast, the role of TET1 in MM
remains less clearly defined. Although increased expression of
TET1 has been associated with poor prognosis in certain
hematological malignancies, such as MLL-rearranged leukemia and
AML, context-dependent effects, including reports of TET1
hypermethylation, suggest that its function may vary across disease
types and remains to be fully elucidated in MM (55).
The reactivation of TET2 following
therapeutic intervention in the present KMS12-PE cell line
contrasted with its low baseline in patients, supported the
hypothesis that TET2 represents a key ‘therapeutic
vulnerability’. Therefore, while high TET1 levels may serve
as a marker of active disease biology and oncogenic maintenance,
the inducible response of TET2 suggests its role as a key
mediator of epigenetic reprogramming toward a tumor-suppressive
state.
Myelomagenesis is initiated through a pre-malignant
state known as MGUS. Aberrant DNA methylations have been observed
in almost all disease stages of MM, with the transition from MGUS
to MM characterized by genome-wide hypomethylation and
gene-specific hypermethylation (8,29).
Therefore, epigenetic dysregulation is thought to be involved in
the development and progression of plasma cell neoplasms (58) and a decreased percentage value of
5-hmC in patients with MM, which may reflect insufficient
demethylation of genes associated with disease progression.
The degree of aberrant DNA methylation may be an
important indicator for determining prognosis and selecting
treatment for MM. Malignant transformation is typically
characterized by a widespread reduction of genomic 5-hmC across
various tissue types. This epigenetic mark is generated by TET
hydroxylases, which catalyze the conversion of 5-mC to 5-hmC. In
line with this biochemical process, tumor samples exhibit a
depletion of 5-hmC relative to healthy tissues, with numerous
studies having associated diminished 5mhC levels with worse
clinical prognosis. Rather than being distributed evenly, this loss
of 5-hmC specifically targets genic regions, suggesting the
disruption of transcriptionally active chromatin in cancer cells
(59,60). The percentage abundance of 5-mC and
5-hmC in CD138+ sorted cells in newly diagnosed patients
with MM was evaluated in the present study. This exploratory
analysis suggested that 5-mC/5-hmC proportions may be present at
different MM stages. In particular, higher 5-hmC levels observed in
the remission stage of patients with MM samples may reflect
increased demethylation activity, whereas lower 5-hmC levels
detected in the relapsed stage sample may be associated with
renewed methylation of the TET gene promoters. While the
presence of 5-mC was observed in these patients, increased
percentage abundance of 5-hmC occurred in other stages of MM,
including the remission and relapsed stages. However, variations in
5-hmC abundance across disease stages require further validation in
larger, stage- and sex-balanced cohorts.
The results of nanopore sequencing demonstrated
that treatment with demethylating agents such as AZA and DAC led to
a significant reduction in the DNA methylation levels of TET
genes. In untreated control samples, TET genes exhibited
high levels of methylation, which were markedly reduced in the
samples treated with demethylating agents. The most notable
decrease in methylation occurred in the TET2 gene, which was
associated with increased mRNA expression of TET2. These
findings suggested that both AZA and DAC effectively inhibit DNA
methylation in TET2 gene regions, potentially restoring or
altering their epigenetic regulation. This reduction in methylation
may lead to increase expression of this gene, which is key for
maintaining DNA demethylation and regulating gene expression.
Detection and quantification of DNA methylation and
hydroxymethylation remain technically challenging. Common methods,
including bisulfite sequencing, pyrosequencing, microarray-based
approaches and emerging third-generation sequencing technologies
such as single molecule, real-time and Oxford Nanopore
Technologies, vary in sensitivity, resolution and applicability to
repetitive regions or low-abundance modifications (61,62).
While methods such as nanopore sequencing offer single-molecule
resolution and the ability to distinguish 5-mC from 5-hmC,
genome-wide profiling in clinical samples is still limited by
sample size and technical complexity. Furthermore, the present
study did not include orthogonal validation of 5-hmC signals using
methods such as TET-assisted bisulfite sequencing, which
represents a limitation and should be considered when interpreting
the modification profiles. In the context of MM, these
methodological limitations underscore the challenges of studying
epigenetic regulation in patient-derived cells. The present
findings of altered TET gene expression suggested that DNA
methylation dynamics may serve a role in the pathogenesis of MM.
Unlike genetic mutations, epigenetic modifications are potentially
reversible, highlighting DNA methylation and hydroxymethylation as
promising therapeutic targets. Enzyme-mediated detection of
cytosine derivatives could therefore provide valuable insights into
the epigenetic landscape of MM and guide future interventions.
According to the present findings, the
demethylation agents, AZA and DAC were associated with increased
binding of Sp1/Sp3 TFs to the studied TET enzymes in the
KMS12-PE cells. For Sp1, occupancy at the TET1 and
TET3 promoters increased notably following DAC treatment,
which suggested that these genes may be primary targets of Sp1 even
under conditions of DNA demethylation and be a part of the complex
activating the transcription mechanism accompanying tumor cell
proliferation. The particularly strong enrichment at TET3,
reaching up to 149-fold, may indicate that Sp1 binding is highly
responsive to DAC and AZA treatment and may be associated with
transcriptional activation of this locus. In contrast to the
initial assumption of a universal decrease, Sp1 binding at the
TET2 promoter showed a dose-dependent response;
specifically, a marked increase was observed after 0.5 µmol/l DAC
treatment (reaching a 41.16-fold enrichment). This suggests that
Sp1 may actively contribute to the restored TET2 gene
expression following demethylation, acting as a positive regulator
of this potential tumor suppressor.
By contrast, the Sp3, as a potential TF of the
inactive transcription, displayed a different binding profile. An
increase in Sp3 binding was observed at the TET2 promoter,
particularly following 0.5 µmol/l AZA treatment. This recruitment
of Sp3 is associated with the previously observed increase in
TET2 expression, suggesting that Sp3, alongside Sp1, may
serve a key role in the functional restoration of the TET2 tumor
suppressor pathway in KMS12-PE cells. Finally, the present findings
indicate differential patterns of Sp1 and Sp3 binding across
TET gene promoters, perhaps influenced by promoter
architecture, chromatin accessibility and cofactor interactions and
highlight the need for further studies to clarify their functional
impact. However, it is important to note that ChIP-qPCR enrichment
solely demonstrates physical occupancy at the promoters and does
not inherently prove transcriptional regulation. These results
provide a preliminary outline of Sp1/Sp3 involvement, which should
be further determined by functional assays, such as Sp1/Sp3
knockdown or luciferase reporter experiments, to demonstrate any
causal associations between TF recruitment and TET promoter
activity.
In summary, the present study provides a
promoter-focused view of TET gene regulation by combining
methylation analysis with Sp1/Sp3 promoter occupancy and cellular
response to AZA/DAC treatment. Notably, it was demonstrated that
demethylating agents not only upregulate TET2 expression but
are also associated with increased global 5-hmC levels, supporting
enhanced catalytic activity. The present results, showing
activation of TET2 upon treatment in comparison to its low
baseline expression in patient samples, suggest that TET2
may function as a tumor suppressor, the repression of which is key
in maintaining the malignant phenotype. This contrasts with
TET1, which appears to act as an oncogenic driver in the
active disease state. While the present study primarily addressed
epigenetic regulation of TET genes, the downstream
transcriptional programs associated with TET2 activation
remain to be defined. Elucidating these pathways may further
clarify the role of TET2 in MM biology.
Supplementary Material
Supporting Data
Supporting Data
Acknowledgements
The authors would like to thank Mr. Ondrej Brzoň
(NGS GEEKS Division, I.T.A.-Intertact s.r.o; Prague, Czech
Republic) for their help in evaluating the nanopore sequencing
results.
Funding
The present study received financial support from Palacky
University Olomouc (grant nos. IGA LF_2024_10 and IGA_LF2023_046),
RVO from University Hospital Olomouc (grant no. FNOL, 00098892),
the EXCELES programme (grant no. LX22NPO5102), the Czech Ministry
of Education (grant no. DRO 61989592) and the Czech Ministry of
Health (grant no. DRO FNOl 00098892).
Availability of data and materials
The sequencing data generated in the present study
may be found in the NCBI Sequence Read Archive under BioProject
accession number PRJNA1465408 or at the following URL: https://www.ncbi.nlm.nih.gov/sra/?term=PRJNA1465408.
Authors' contributions
LS performed the experiments, analyzed the data and
wrote the manuscript. MN and VF performed the experiments and
analyzed the data. DŠ performed the experiments. JMa performed the
clinical experiments and analyzed the clinical data. EK analyzed
the clinical data and revised the manuscript. JMi provided patient
samples, contributed to the acquisition and interpretation of
clinical data and critically revised the manuscript for important
intellectual content. KST analyzed the data and wrote the
manuscript. LS and KST confirm the authenticity of all the raw
data. All authors read and approved the final version of the
manuscript.
Ethics approval and consent to
participate
The present study was approved by the Ethics
Committee of University Hospital Olomouc (Olomouc, Czech Republic;
approval no. EK FNOL 112/17). Written informed consent was obtained
from the patients for this publication.
Patient consent for publication
Not applicable.
Competing interests
The authors declare that they have no competing
interests.
References
|
1
|
Rajkumar SV: Multiple myeloma: Every year
a new standard? Hematol Oncol. 37 (Suppl 1):S62–S65. 2019.
View Article : Google Scholar
|
|
2
|
Kulis M, Queirós AC, Beekman R and
Martín-Subero JI: Intragenic DNA methylation in transcriptional
regulation, normal differentiation and cancer. Biochim Biophys
Acta. 1829:1161–1174. 2013. View Article : Google Scholar : PubMed/NCBI
|
|
3
|
Lee ST, Xiao Y, Muench MO, Xiao J, Fomin
ME, Wiencke JK, Zheng S, Dou X, de Smith A, Chokkalingam A, et al:
A global DNA methylation and gene expression analysis of early
human B-cell development reveals a demethylation signature and
transcription factor network. Nucleic Acids Res. 40:11339–1151.
2012. View Article : Google Scholar : PubMed/NCBI
|
|
4
|
Kulis M, Merkel A, Heath S, Queirós AC,
Schuyler RP, Castellano G, Beekman R, Raineri E, Esteve A, Clot G,
et al: Whole-genome fingerprint of the DNA methylome during human B
cell differentiation. Nat Genet. 47:746–756. 2015. View Article : Google Scholar : PubMed/NCBI
|
|
5
|
Barwick BG, Powell DR, Penaherrera D,
Skerget S, Keats JJ, Auclair D, Lonial S, Boise LH and Vertino PM:
Abstract 839: Whole genome DNA methylation analysis of multiple
myeloma identifies pervasive hypomethylation and biomarkers of
survival. Cancer Res. 79 (Suppl 13):S8392019. View Article : Google Scholar
|
|
6
|
Barwick BG, Scharer CD, Martinez RJ, Price
MJ, Wein AN, Haines RR, Bally APR, Kohlmeier JE and Boss JM: B cell
activation and plasma cell differentiation are inhibited by de novo
DNA methylation. Nat Commun. 9:19002018. View Article : Google Scholar : PubMed/NCBI
|
|
7
|
Agirre X, Castellano G, Pascual M, Heath
S, Kulis M, Segura V, Bergmann A, Esteve A, Merkel A, Raineri E, et
al: Whole-epigenome analysis in multiple myeloma reveals DNA
hypermethylation of B cell-specific enhancers. Genome Res.
25:478–487. 2015. View Article : Google Scholar : PubMed/NCBI
|
|
8
|
Yang T, Liu X, Kumar SK, Jin F and Dai Y:
Decoding DNA methylation in epigenetics of multiple myeloma. Blood
Rev. 51:1008722022. View Article : Google Scholar : PubMed/NCBI
|
|
9
|
Maneix L, Iakova P, Moree SE, Hsu JI,
Mistry RM, Stossi F, Lulla P, Sun Z, Sahin E, Yellapragada SV and
Catic A: Proteasome inhibitors silence oncogenes in multiple
myeloma through localized histone deacetylase 3 (HDAC3)
stabilization and chromatin condensation. Cancer Res Commun.
2:1693–1710. 2022. View Article : Google Scholar : PubMed/NCBI
|
|
10
|
Xian M, Cao H, Cao J, Shao X, Zhu D, Zhang
N, Huang P, Li W, Yang B, Ying M and He Q: Bortezomib sensitizes
human osteosarcoma cells to adriamycin-induced apoptosis through
ROS-dependent activation of p-eIF2α/ATF4/CHOP axis. Int J Cancer.
141:1029–1041. 2017. View Article : Google Scholar : PubMed/NCBI
|
|
11
|
Lipchick BC, Fink EE and Nikiforov MA:
Oxidative stress and proteasome inhibitors in multiple myeloma.
Pharmacol Res. 105:210–215. 2016. View Article : Google Scholar : PubMed/NCBI
|
|
12
|
Walker AR, Klisovic RB, Garzon R, Schaaf
LJ, Humphries K, Devine SM, Byrd JC, Grever MR, Marcucci G and Blum
W: Phase I study of azacitidine and bortezomib in adults with
relapsed or refractory acute myeloid leukemia. Leuk Lymphoma.
55:1304–1308. 2014. View Article : Google Scholar : PubMed/NCBI
|
|
13
|
Amodio N, Di Martino MT, Foresta U, Leone
E, Lionetti M, Leotta M, Gullà AM, Pitari MR, Conforti F, Rossi M,
et al: miR-29b sensitizes multiple myeloma cells to
bortezomib-induced apoptosis through the activation of a feedback
loop with the transcription factor Sp1. Cell Death Dis. 3:e4362012.
View Article : Google Scholar : PubMed/NCBI
|
|
14
|
Liu S, Liu Z, Xie Z, Pang J, Yu J, Lehmann
E, Huynh L, Vukosavljevic T, Takeki M, Klisovic RB, et al:
Bortezomib induces DNA hypomethylation and silenced gene
transcription by interfering with Sp1/NF-kappaB-dependent DNA
methyltransferase activity in acute myeloid leukemia. Blood.
111:2364–2373. 2008. View Article : Google Scholar : PubMed/NCBI
|
|
15
|
Li L and Davie JR: The role of Sp1 and Sp3
in normal and cancer cell biology. Ann Anat. 192:275–283. 2010.
View Article : Google Scholar : PubMed/NCBI
|
|
16
|
Suske G: The Sp-family of transcription
factors. Gene. 238:291–300. 1999. View Article : Google Scholar : PubMed/NCBI
|
|
17
|
Pagliuca A, Gallo P and Lania L:
Differential role for Sp1/Sp3 transcription factors in the
regulation of the promoter activity of multiple cyclin-dependent
kinase inhibitor genes. J Cell Biochem. 76:360–367. 2000.
View Article : Google Scholar : PubMed/NCBI
|
|
18
|
Ammanamanchi S and Brattain MG: Sp3 is a
transcriptional repressor of transforming growth factor-beta
receptors. J Biol Chem. 276:3348–3352. 2001. View Article : Google Scholar : PubMed/NCBI
|
|
19
|
Safe S: Specificity Proteins (Sp) and
cancer. Int J Mol Sci. 24:51642023. View Article : Google Scholar : PubMed/NCBI
|
|
20
|
Wang F, Ma YL, Zhang P, Shen TY, Shi CZ,
Yang YZ, Moyer MP, Zhang HZ, Chen HQ, Liang Y and Qin HL: SP1
mediates the link between methylation of the tumour suppressor
miR-149 and outcome in colorectal cancer. J Pathol. 229:12–24.
2013. View Article : Google Scholar : PubMed/NCBI
|
|
21
|
Guan H, Cai J, Zhang N, Wu J, Yuan J, Li J
and Li M: Sp1 is upregulated in human glioma, promotes
MMP-2-mediated cell invasion, and predicts poor clinical outcome.
Int J Cancer. 130:593–601. 2012. View Article : Google Scholar : PubMed/NCBI
|
|
22
|
Jiang NY, Woda BA, Banner BF, Whalen GF,
Dresser KA and Lu D: Sp1, a new biomarker that identifies a subset
of aggressive pancreatic ductal adenocarcinoma. Cancer Epidemiol
Biomarkers Prev. 17:1648–1652. 2008. View Article : Google Scholar : PubMed/NCBI
|
|
23
|
Maurer GD, Leupold JH, Schewe DM, Biller
T, Kates RE, Hornung HM, Lau-Werner U, Post S and Allgayer H:
Analysis of specific transcriptional regulators as early predictors
of independent prognostic relevance in resected colorectal cancer.
Clin Cancer Res. 13:1123–1132. 2007. View Article : Google Scholar : PubMed/NCBI
|
|
24
|
Wang L, Wei D, Huang S, Peng Z, Le X, Wu
TT, Yao J, Ajani J and Xie K: Transcription factor Sp1 expression
is a significant predictor of survival in human gastric cancer.
Clin Cancer Res. 9:6371–6380. 2003.PubMed/NCBI
|
|
25
|
Ko M, An J, Pastor WA, Koralov SB,
Rajewsky K and Rao A: TET proteins and 5-methylcytosine oxidation
in hematological cancers. Immunol Rev. 263:6–21. 2015. View Article : Google Scholar : PubMed/NCBI
|
|
26
|
Ito S, Shen L, Dai Q, Wu SC, Collins LB,
Swenberg JA, He C and Zhang Y: Tet proteins can convert
5-methylcytosine to 5-formylcytosine and 5-carboxylcytosine.
Science. 333:1300–1303. 2011. View Article : Google Scholar : PubMed/NCBI
|
|
27
|
Tahiliani M, Koh KP, Shen Y, Pastor WA,
Bandukwala H, Brudno Y, Agarwal S, Iyer LM, Liu DR, Aravind L and
Rao A: Conversion of 5-methylcytosine to 5-hydroxymethylcytosine in
mammalian DNA by MLL partner TET1. Science. 324:930–935. 2009.
View Article : Google Scholar : PubMed/NCBI
|
|
28
|
Deaton AM and Bird A: CpG islands and the
regulation of transcription. Genes Dev. 25:1010–1022. 2011.
View Article : Google Scholar : PubMed/NCBI
|
|
29
|
Walker BA, Wardell CP, Chiecchio L, Smith
EM, Boyd KD, Neri A, Davies FE, Ross FM and Morgan GJ: Aberrant
global methylation patterns affect the molecular pathogenesis and
prognosis of multiple myeloma. Blood. 117:553–562. 2011. View Article : Google Scholar : PubMed/NCBI
|
|
30
|
Sharma A, Heuck CJ, Fazzari MJ, Mehta J,
Singhal S, Greally JM and Verma A: DNA methylation alterations in
multiple myeloma as a model for epigenetic changes in cancer. WIREs
Syst Biol Med. 2:654–669. 2010. View Article : Google Scholar : PubMed/NCBI
|
|
31
|
Morey Kinney SR and Pradhan S: Ten Eleven
Translocation Enzymes and 5-Hydroxymethylation in mammalian
development and cancer. Adv Exp Med Biol. 754:57–83. 2013.
View Article : Google Scholar : PubMed/NCBI
|
|
32
|
Amodio N, D'Aquila P, Passarino G, Tassone
P and Bellizzi D: Epigenetic modifications in multiple myeloma:
Recent advances on the role of DNA and histone methylation. Expert
Opin Ther Targets. 21:91–101. 2017. View Article : Google Scholar : PubMed/NCBI
|
|
33
|
Mason MJ and Chiu BC: Racial disparities
in multiple myeloma: Biological heterogeneity, treatment access,
and prognostic implications. Leuk Lymphoma. 67:27–39. 2026.
View Article : Google Scholar : PubMed/NCBI
|
|
34
|
Joshi K, Liu S, Breslin SJP and Zhang J:
Mechanisms that regulate the activities of TET proteins. Cell Mol
Life Sci. 79:3632022. View Article : Google Scholar : PubMed/NCBI
|
|
35
|
Joshi K, Zhang L, Breslin SJP, Kini AR and
Zhang J: Role of TET dioxygenases in the regulation of both normal
and pathological hematopoiesis. J Exp Clin Cancer Res. 41:2942022.
View Article : Google Scholar : PubMed/NCBI
|
|
36
|
Rajkumar SV: Multiple myeloma: 2022 update
on diagnosis, risk stratification, and management. Am J Hematol.
97:1086–1107. 2022. View Article : Google Scholar : PubMed/NCBI
|
|
37
|
Livak KJ and Schmittgen TD: Analysis of
relative gene expression data using real-time quantitative PCR and
the 2(−Delta Delta C(T)) method. Methods. 25:402–408. 2001.
View Article : Google Scholar : PubMed/NCBI
|
|
38
|
Kennedy BE, Hundert AS, Goguen D, Weaver
IC and Karten B: Presymptomatic alterations in amino acid
metabolism and DNA methylation in the cerebellum of a murine model
of Niemann-Pick type C disease. Am J Pathol. 186:1582–1597. 2016.
View Article : Google Scholar : PubMed/NCBI
|
|
39
|
Solomon ER, Caldwell KK and Allan AM: A
novel method for the normalization of ChIP-qPCR data. MethodsX.
8:1015042021. View Article : Google Scholar : PubMed/NCBI
|
|
40
|
Nagaki K, Talbert PB, Zhong CX, Dawe RK,
Henikoff S and Jiang J: Chromatin immunoprecipitation reveals that
the 180-bp satellite repeat is the key functional DNA element of
Arabidopsis thaliana centromeres. Genetics. 163:1221–1225. 2003.
View Article : Google Scholar : PubMed/NCBI
|
|
41
|
Good CR, Panjarian S, Kelly AD, Madzo J,
Patel B, Jelinek J and Issa JJ: TET1-mediated hypomethylation
activates oncogenic signaling in triple-negative breast cancer.
Cancer Res. 78:4126–4137. 2018. View Article : Google Scholar : PubMed/NCBI
|
|
42
|
Li L, Li C, Mao H, Du Z, Chan WY, Murray
P, Luo B, Chan AT, Mok TS, Chan FK, et al: Epigenetic inactivation
of the CpG demethylase TET1 as a DNA methylation feedback loop in
human cancers. Sci Rep. 6:265912016. View Article : Google Scholar : PubMed/NCBI
|
|
43
|
Cimmino L, Dawlaty MM, Ndiaye-Lobry D, Yap
YS, Bakogianni S, Yu Y, Bhattacharyya S, Shaknovich R, Geng H,
Lobry C, et al: TET1 is a tumor suppressor of hematopoietic
malignancy. Nat Immunol. 16:653–662. 2015. View Article : Google Scholar : PubMed/NCBI
|
|
44
|
Huang H, Jiang X, Li Z, Li Y, Song CX, He
C, Sun M, Chen P, Gurbuxani S, Wang J, et al: TET1 plays an
essential oncogenic role in MLL-rearranged leukemia. Proc Natl Acad
Sci USA. 110:11994–11999. 2013. View Article : Google Scholar : PubMed/NCBI
|
|
45
|
McKinney-Freeman S, Cahan P, Li H, Lacadie
SA, Huang HT, Curran M, Loewer S, Naveiras O, Kathrein KL, Konantz
M, et al: The transcriptional landscape of hematopoietic stem cell
ontogeny. Cell Stem Cell. 11:701–714. 2012. View Article : Google Scholar : PubMed/NCBI
|
|
46
|
Langemeijer SM, Aslanyan MG and Jansen JH:
TET proteins in malignant hematopoiesis. Cell Cycle. 8:4044–4048.
2009. View Article : Google Scholar : PubMed/NCBI
|
|
47
|
Reddy A, Zhang J, Davis NS, Moffitt AB,
Love CL, Waldrop A, Leppa S, Pasanen A, Meriranta L,
Karjalainen-Lindsberg ML, et al: Genetic and functional drivers of
diffuse large B cell lymphoma. Cell. 171:481–494.e15. 2017.
View Article : Google Scholar : PubMed/NCBI
|
|
48
|
Jiang M, Bennani NN and Feldman AL:
Lymphoma classification update: T-cell lymphomas, Hodgkin
lymphomas, and histiocytic/dendritic cell neoplasms. Expert Rev
Hematol. 10:239–249. 2017. View Article : Google Scholar : PubMed/NCBI
|
|
49
|
Cruz-Rodriguez N, Combita AL and Zabaleta
J: Epigenetics in hematological malignancies. Methods Mol Biol.
1856:87–101. 2018. View Article : Google Scholar : PubMed/NCBI
|
|
50
|
Woods BA and Levine RL: The role of
mutations in epigenetic regulators in myeloid malignancies. Immunol
Rev. 263:22–35. 2015. View Article : Google Scholar : PubMed/NCBI
|
|
51
|
Nakajima H and Kunimoto H: TET2 as an
epigenetic master regulator for normal and malignant hematopoiesis.
Cancer Sci. 105:1093–1099. 2014. View Article : Google Scholar : PubMed/NCBI
|
|
52
|
Bowman RL and Levine RL: TET2 in normal
and malignant hematopoiesis. Cold Spring Harb Perspect Med.
7:a0265182017. View Article : Google Scholar : PubMed/NCBI
|
|
53
|
Lio CWJ, Yuita H and Rao A: Dysregulation
of the TET family of epigenetic regulators in lymphoid and myeloid
malignancies. Blood. 134:1487–1497. 2019. View Article : Google Scholar : PubMed/NCBI
|
|
54
|
Muylaert C, Van Hemelrijck LA, Maes A, De
Veirman K, Menu E, Vanderkerken K and De Bruyne E: Aberrant DNA
methylation in multiple myeloma: A major obstacle or an
opportunity? Front Oncol. 12:9795692022. View Article : Google Scholar : PubMed/NCBI
|
|
55
|
Pawlyn C, Kaiser MF, Heuck C, Melchor L,
Wardell CP, Murison A, Chavan SS, Johnson DC, Begum DB, Dahir NM,
et al: The spectrum and clinical impact of epigenetic modifier
mutations in myeloma. Clin Cancer Res. 22:5783–5794. 2016.
View Article : Google Scholar : PubMed/NCBI
|
|
56
|
Ohtsuki T, Yawata Y, Wada H, Sugihara T,
Mori M and Namba M: Two human myeloma cell lines, amylase-producing
KMS-12-PE and amylase-non-producing KMS-12-BM, were established
from a patient, having the same chromosome marker,
t(11;14)(q13;q32). Br J Haematol. 73:199–204. 1989. View Article : Google Scholar : PubMed/NCBI
|
|
57
|
Poole CJ, Zheng W, Lodh A, Yevtodiyenko A
and van Riggelen J: TET1 and TET2 maintain transcriptional profiles
of T-ALL cells in a MYC-dependent manner. Cancer Cell Int.
19:1842019.PubMed/NCBI
|
|
58
|
Ohya M, Nakazawa K and Kanno H: Lower
number of 5-hydroxymethylcytosine-expressing cells in plasma cell
myeloma than in reactive plasma cell hyperplasia: A useful
immunohistochemical approach for identification of neoplastic
plasma cells. Pathology. 51:81–85. 2019. View Article : Google Scholar : PubMed/NCBI
|
|
59
|
Li W and Xu L: Epigenetic function of TET
family, 5-methylcytosine, and 5-hydroxymethylcytosine in
hematologic malignancies. Oncol Res Treat. 42:309–317. 2019.
View Article : Google Scholar : PubMed/NCBI
|
|
60
|
Alberge JB, Magrangeas F, Wagner M, Denié
S, Guérin-Charbonnel C, Campion L, Attal M, Avet-Loiseau H, Carell
T, Moreau P, et al: DNA hydroxymethylation is associated with
disease severity and persists at enhancers of oncogenic regions in
multiple myeloma. Clin Epigenetics. 12:1632020. View Article : Google Scholar : PubMed/NCBI
|
|
61
|
Li Y and Tollefsbol TO: DNA methylation
detection: Bisulfite genomic sequencing analysis. Methods Mol Biol.
791:11–21. 2011. View Article : Google Scholar : PubMed/NCBI
|
|
62
|
Hu T, Chitnis N, Monos D and Dinh A:
Next-generation sequencing technologies: An overview. Hum Immunol.
82:801–811. 2021. View Article : Google Scholar : PubMed/NCBI
|
















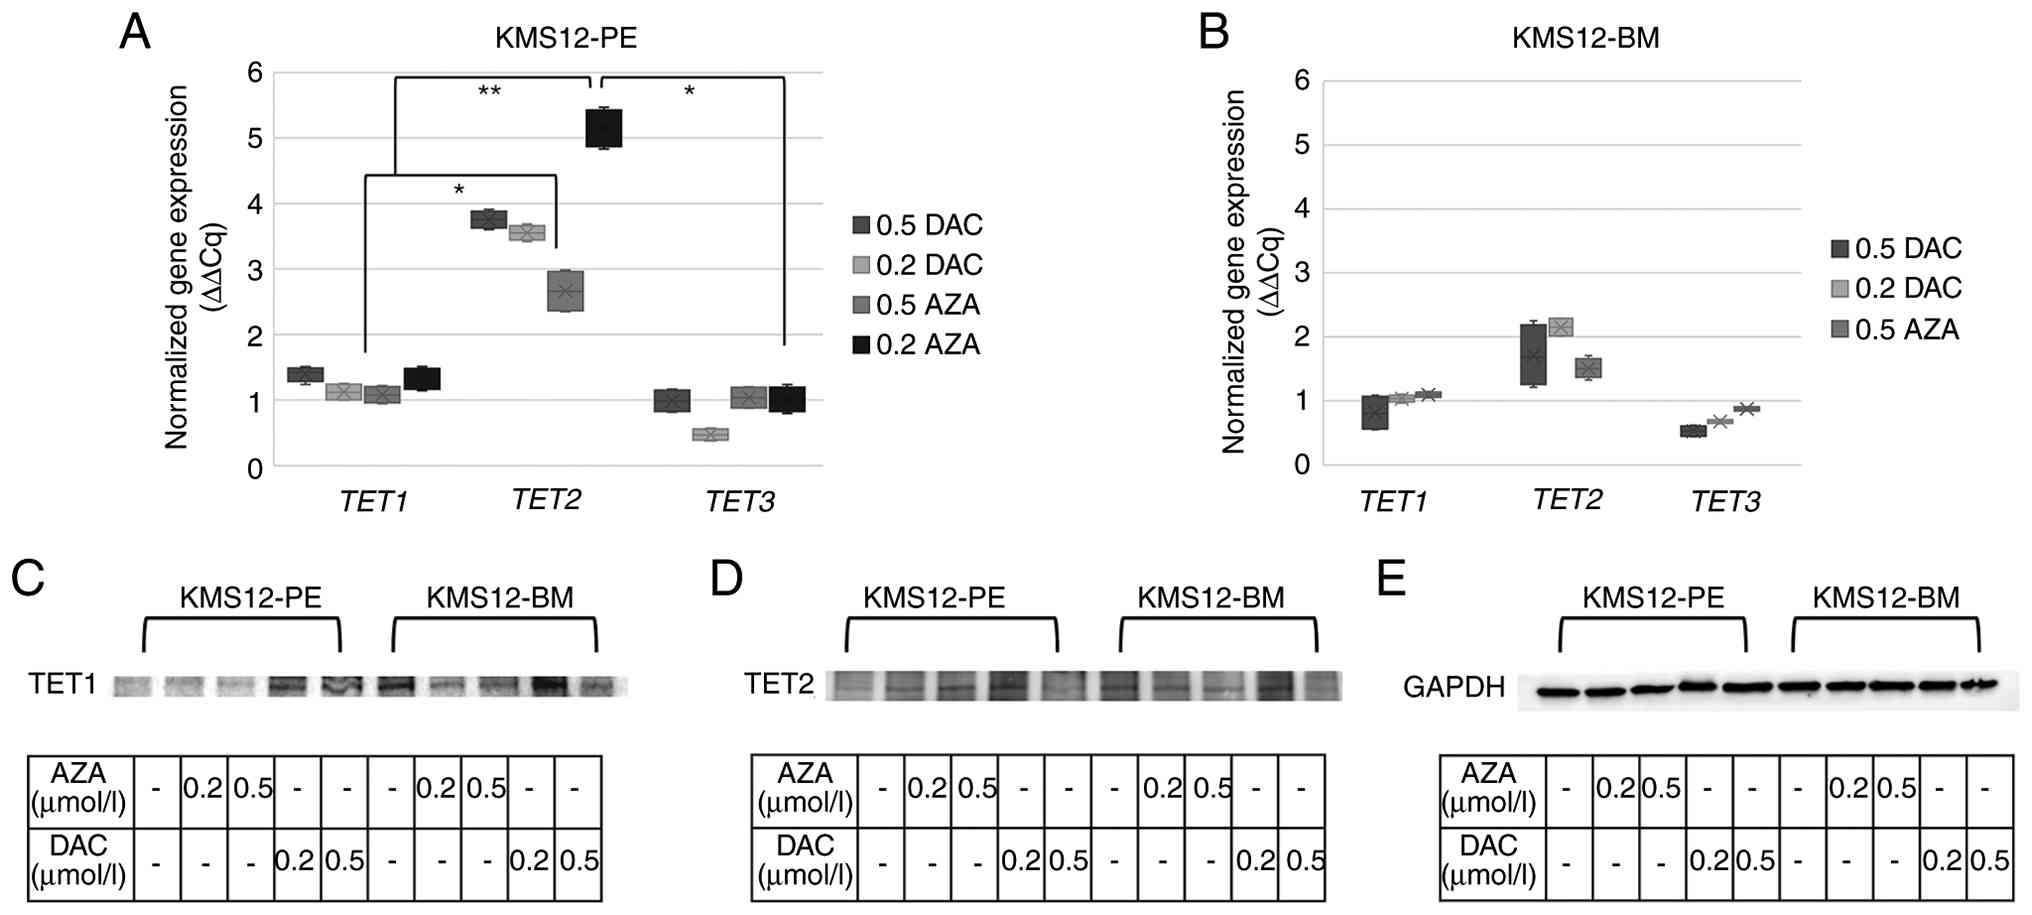
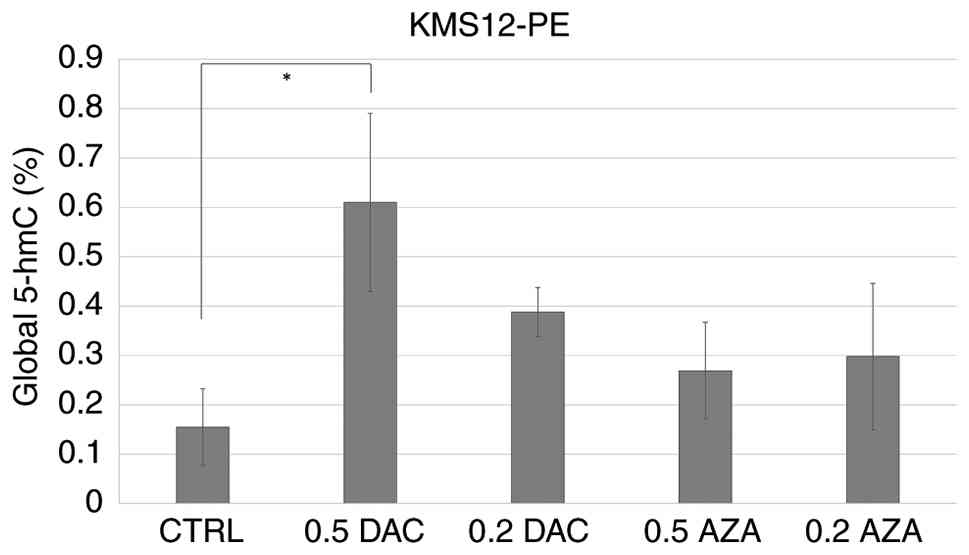
![Proportion of 5-mC and 5-hmC in
TET gene promoters in plasma cells from selected patients
with MM from the original cohort. (A) The 5-mC/5-hmC ratio in
promoter regions of TET genes was analyzed in
CD138+ purified plasma cells from newly diagnosed
patients with MM (W03 and W04), a patient with MM in remission
(W01) and a MM patient in the relapsed stage (W02). Dissociation
curves determined the specificity of qPCR amplification for each
analyzed TET promoter region, showing single melting peaks
corresponding to the expected amplicons. Each dissociation curve
represents a single qPCR reaction. Further 5-mC and 5-hmC
percentages were calculated from Cq values obtained after enzymatic
digestion-based qPCR using multiple digestion conditions [n=4
independent patients with MM (W01-W04)]. (B) Schematic
representation of the principle of 5-mC and 5-hmC discrimination
using HpaII and MspI digestion at CCGG sites within
TET1-3 promoter regions. HpaII cleaves unmethylated
CCGG sites but is inhibited by both 5-mC and 5-hmC, resulting in
the detection of the combined 5-mC and 5-hmC fraction. MspI
cleaves unmethylated and 5-mC sites but is inhibited by 5-hmC,
enabling selective detection of 5-mC. 5-mC levels were calculated
by subtracting the 5-hmC fraction from the total
HpaII-resistant fraction. TET, ten-eleven translocation; MM,
multiple myeloma; 5-mC, 5-methylcytosine; 5-hmC,
5-hydroxymethylcytosine; qPCR, quantitative PCR.](/article_images/mmr/34/2/mmr-34-02-13947-g04.jpg)