Introduction
Globally, lung cancer remains the principal cause of
cancer-related mortality; non-small cell lung cancer (NSCLC) in
particular has been shown to account for ~85% of lung cancer cases
(1–4). In patients with epidermal growth
factor receptor (EGFR)-mutant NSCLC, treatment with tyrosine kinase
inhibitors (TKIs) has been shown to markedly improve clinical
outcomes. However, despite notable initial treatment responses, the
majority of patients eventually develop disease progression driven
by acquired and adaptive resistance to TKI treatment (5–7).
In addition to genetically acquired resistance
mechanisms, a small subset of tumour cells has been shown to
survive initial EGFR-TKI exposure through reversible, non-genetic
adaptation mechanisms (8–10). These TKI-tolerant cells, which are
known as drug-tolerant persister (DTP) cells, do not initially
exhibit stable resistance mutations; however, these cells can serve
as a reservoir from which stable resistance eventually emerges
(11–13). As such, DTP cells have become
increasingly recognized as key contributors to minimal residual
disease and the subsequent relapse of NSCLC (14,15).
Previous studies have shown that DTP cells undergo
notable epigenetic and metabolic remodelling, such as chromatin
reprogramming, increases in reliance on oxidative phosphorylation
and the activation of stress-adaptation pathways (16–21).
However, to the best of our knowledge, a well-defined
transcriptional signature of the DTP state in EGFR-mutant lung
adenocarcinoma (LUAD) has yet to be elucidated, limiting efforts to
identify robust biomarkers and therapeutically actionable
vulnerabilities for this disease.
Since the DTP cell state is likely governed by
coordinated programs rather than single-gene programs, integrative
machine-learning approaches may be particularly useful for
identifying robust transcriptional signatures of EGFR-mutant NSCLC
persistence (22–25). To identify conserved features of
the persister state, the present study integrated publicly
available transcriptomic datasets and subsequently performed
experimental validation of these features in EGFR-mutant LUAD
models. To the best of our knowledge, such strategies have not yet
been systematically applied to define DTP-associated
transcriptional programs in the context of EGFR-mutant NSCLC.
Beyond defining the regulatory basis of the DTP cell
state, it is important to identify the vulnerabilities that can be
exploited to eliminate DTP cells (14). Increasing evidence suggests that
persister cells undergo mitochondrial rewiring and experience
elevated oxidative stress, raising the possibility that metabolic
overactivation may push these cells beyond their adaptive capacity.
As the mode of therapy-induced cell death may influence therapeutic
outcomes, the present study also investigated whether such
metabolic perturbation could promote gasdermin E (GSDME)-associated
pyroptotic elimination rather than apoptosis alone (26–30),
a possibility that, to the best of our knowledge, has not been
examined in EGFR-mutant TKI-induced persister cells.
The present study sought to define the
transcriptional signature associated with the DTP cell state in
EGFR-mutant LUAD and to determine whether this adaptive state
exposes therapeutically actionable metabolic vulnerabilities. The
present study used machine learning-based transcriptomic analysis
together with experimental validation to identify a four-gene
transcriptional signature linked to the DTP phenotype. The present
study further investigated whether pharmacological modulation
mitochondrial metabolism using the peroxisome
proliferator-activated receptor γ coactivator-1α (PGC-1α) agonist
ZLN005 could enhance therapeutic vulnerability of DTP cells to
osimertinib. Together, these findings established a transcriptional
metabolic framework for the persister state and suggested a
potential strategy for eliminating DTP cells in EGFR-mutant
LUAD.
Materials and methods
Public gene expression omnibus (GEO)
dataset selection and transcriptomic analysis
Publicly available RNA-sequencing (RNA-seq) datasets
were downloaded from the GEO database. The GEO accession numbers
and basic characteristics of these datasets are summarized in
Table I (31–34).
Datasets were included according to the following criteria; i) Use
of tumour cell-based experimental models; ii) treatment with EGFR
inhibitors or other targeted agents within the receptor tyrosine
kinase (RTK)/RAS/MAPK pathway; iii) a clearly defined DTP state;
iv) the presence of an appropriate control group; and v)
availability of well-annotated transcriptomic data suitable for
downstream analysis. Datasets that did not meet these criteria were
excluded. For each included dataset, raw count matrices were
retrieved directly from the GEO repository. Quality control,
normalization and downstream analyses were performed in R (version
4.3.0; Posit Software, PBC) using standard bioinformatics
workflows. Differential gene expression analysis between
drug-treated and control samples was conducted separately for each
dataset using the ‘voom’ transformation in the ‘limma’ package
(version 3.58.1; Bioconductor) to model mean-variance
relationships. Raw P-values were adjusted using the
Benjamini-Hochberg false discovery rate (FDR) method. Genes with an
absolute log2(fold-change) ≥1 and an adjusted
P-value<0.05 were considered significantly differentially
expressed. Results from individual datasets were then
cross-compared to identify genes that were consistently upregulated
or downregulated across independent experiments. Visualisation and
statistical analyses were performed using the ‘ggplot2’ (version
3.5.2; CRAN) and ‘pheatmap’ packages (version 1.0.12; CRAN) in
R.
 | Table I.Summary of publicly available
transcriptomic datasets analysed to identify the DTP gene signature
in EGFR-mutant lung adenocarcinoma. |
Table I.
Summary of publicly available
transcriptomic datasets analysed to identify the DTP gene signature
in EGFR-mutant lung adenocarcinoma.
| A, GSE193258,
https;//ncbi.nlm.nih.gov/geo/query/acc.cgi?acc=GSE193258 |
|---|
|
|---|
| Cell line
(disease) | Replicates | Treatment
(dose) | Drug type | Duration |
|---|
| H1975 (lung
adenocarcinoma) |
|
|
| 21 days |
|
Control | 3 | N/A |
|
|
|
DTP | 3 | Osimertinib (500
nM) | EGFR T790M
inhibitor |
|
| HCC2935 (lung
adenocarcinoma) |
|
|
| 21 days |
|
Control | 3 | N/A |
|
|
|
DTP | 3 | Osimertinib (500
nM) | EGFR T790M
inhibitor |
|
| HCC827 (lung
adenocarcinoma) |
|
|
| 21 days |
|
Control | 3 | N/A |
|
|
|
DTP | 3 | Osimertinib (500
nM) | EGFR T790M
inhibitor |
|
| PC-9 (lung
adenocarcinoma) |
|
|
| 21 days |
|
Control | 3 | N/A |
|
|
|
DTP | 3 | Osimertinib (500
nM) | EGFR T790M
inhibitor |
|
|
| B,
GSE155341, https;//www.ncbi.nlm.nih.gov/geo/query/acc.cgi?acc=GSE155341 |
|
| Cell line
(disease) |
Replicates | Treatment
(dose) | Drug
type |
Duration |
|
| BT474 (invasive
breast carcinoma) |
|
|
| 14 days |
|
Control | 2 | N/A |
|
|
|
DTP | 2 | Lapatinib (2.5
µM) | EGFR inhibitor |
|
| EFM192A (invasive
breast carcinoma) |
|
|
| 14 days |
|
Control | 2 | N/A |
|
|
|
DTP | 2 | Lapatinib (2.5
µM) | EGFR inhibitor |
|
| HCC1419 (invasive
breast carcinoma) |
|
|
| 14 days |
| Control | 2 | N/A |
|
|
|
DTP | 2 | Lapatinib (2.5
µM) | EGFR inhibitor |
|
| SKBR3 (invasive
breast carcinoma) |
|
|
| 14 days |
|
Control | 2 | N/A |
|
|
|
DTP | 2 | Lapatinib (2.5
µM) | EGFR inhibitor |
|
|
| C,
GSE153183, https;//www.ncbi.nlm.nih.gov/geo/query/acc.cgi?acc=GSE153183 |
|
| Cell line
(disease) |
Replicates | Treatment
(dose) | Drug
type |
Duration |
|
| PC-9 (lung
adenocarcinoma) |
|
|
| 9 days |
|
Control | 2 | N/A |
|
|
|
DTP | 2 | Osimertinib (2
µM) | EGFR T790M
inhibitor |
|
|
| D,
GSE114647, https;//www.ncbi.nlm.nih.gov/geo/query/acc.cgi?acc=GSE114647 |
|
| Cell line
(disease) |
Replicates | Treatment
(dose) | Drug
type |
Duration |
|
| HCC827 (lung
adenocarcinoma) |
|
|
| 2–3 weeks |
|
Control | 3 | N/A |
|
|
|
DTP | 3 | Gefitinib (300
nM) | EGFR inhibitor |
|
| HCC4006 (lung
adenocarcinoma) |
|
|
| 2–3 weeks |
|
Control | 3 | N/A |
|
|
|
DTP | 3 | Gefitinib (300
nM) | EGFR inhibitor |
|
| H1975 (lung
adenocarcinoma) |
|
|
| 2–3 weeks |
|
Control | 3 | N/A |
|
|
|
DTP | 3 | WZ4002 (300
nM) | EGFR inhibitor |
|
| PC-9 (lung
adenocarcinoma) |
|
|
| 2–3 weeks |
|
Control | 2 | N/A |
|
|
|
DTP | 4 | Gefitinib (300
nM) | EGFR inhibitor |
|
| MGH119 (lung
adenocarcinoma) |
|
|
| 2–3 weeks |
|
Control | 2 | N/A |
|
|
|
DTP | 4 | Gefitinib (300
nM) | EGFR inhibitor |
|
|
| E, GSE89127,
https;//www.ncbi.nlm.nih.gov/geo/query/acc.cgi?acc=GSE89127 |
|
| Cell line
(disease) |
Replicates | Treatment
(dose) | Drug
type |
Duration |
|
| A375
(melanoma) |
|
|
| 7 days |
|
Control | 3 | N/A |
|
|
|
DTP | 3 | Vemurafenib (1
µM) | RAF inhibitor |
|
| A549 (lung
adenocarcinoma) |
|
|
| 7 days |
|
Control | 3 | N/A |
|
|
|
DTP | 3 | GSK1120212 (200
nM) | MEK inhibitor |
|
| H3122 (lung
adenocarcinoma) |
|
|
| 7 days |
|
Control | 3 | N/A |
|
|
|
DTP | 3 | Crizotinib (250
nM) | ALK tyrosine
kinase |
|
| N87 (tubular
stomach adenocarcinoma) |
|
|
| 7 days |
|
Control | 3 | N/A |
|
|
|
DTP | 3 | Lapatinib (100
nM) | EGFR inhibitor |
|
| PC-9 (lung
adenocarcinoma) |
|
|
| 7 days |
|
Control | 3 | N/A |
|
|
|
DTP | 3 | Erlotinib (1
µM) | EGFR inhibitor |
|
| RT112 (bladder
urothelial carcinoma) |
|
|
| 7 days |
|
Control | 3 | N/A |
|
|
|
DTP | 3 | BGJ398 (1 µM) | FGFR inhibitor |
|
|
| F,
GSE100751, https;//www.ncbi.nlm.nih.gov/geo/query/acc.cgi?acc=GSE100751 |
|
| Cell line
(disease) |
Replicates | Treatment
(dose) | Drug
type |
Duration |
|
| PC-9 (lung
adenocarcinoma) |
|
|
| 8 days |
|
Control | 3 | N/A |
|
|
|
DTP | 3 | Erlotinib (1
µM) | EGFR inhibitor |
|
As the present study was based on the retrospective
analysis of publicly available datasets rather than prospectively
enrolled subjects, a formal a priori sample size calculation
was not applicable. Instead, all eligible samples meeting the
predefined inclusion criteria were included to ensure the efficient
use of available data, enhance the statistical robustness of the
analysis and minimize selection bias. The integrated discovery
cohort used for feature selection and receiver operating
characteristic (ROC) analysis comprised 56 control samples and 60
treated samples.
For the temporal expression analysis shown in
Fig. 1G, publicly available
time-course transcriptomic data from GSE193258 were further
analysed. The dataset included EGFR-mutant or TKI-responsive LUAD
cell lines, including H1975, HCC827, HCC2935 and PC-9, with samples
annotated according to the original metadata as untreated control,
acute TKI exposure, established DTP state and short- or long-term
drug-washout phases. Expression values were normalized to the
corresponding control group within each dataset before
comparison.
![Machine-learning identification of a
gene signature associated with the DTP state. (A)
Principal-component analysis of control and TKI-treated tumour
samples demonstrated distinct clustering of DTP cells, indicating a
conserved transcriptional reprogramming pattern. (B) Volcano plot
of differential gene expression [log2(fold-change) vs,
log10(adj.P-value)] showing significantly upregulated
genes (BTG1, ING4, CALCOCO1 and PNRC1) in DTP cells
compared with control cells. (C) Heatmap of the expression of
candidate genes across datasets revealed consistent upregulation in
DTP samples. (D) Feature-selection curves from LASSO, random forest
and SVM-RFE analyses showing variable-importance scores and
cross-validation error. (E) Venn diagram illustrating overlap among
the three algorithms, identifying BTG1, ING4 and
KLHL24 as core genes common to all approaches. (F)
Receiver-operating characteristic curves evaluating the predictive
performance of key genes identified in the integrated model (AUC,
0.96–0.99) for identifying DTP cells. (G) Cross-dataset comparative
expression Cross-dataset comparative expression analysis showing
consistent upregulation of the core genes in TKI-treated/DTP
samples relative to the corresponding DMSO/control samples after
within-dataset normalization. DTP, drug-tolerant persister; PC1,
principal component 1; PC2, principal component 2; LogFC,
logarithmic fold change; LASSO, least absolute shrinkage and
selection operator; SVM-RFE, support vector machine-recursive
feature elimination; AUC, area under the curve; TKI, tyrosine
kinase inhibitor; adj.P-value, adjusted P-value; BTG1, B-cell
translocation gene 1; ING4, inhibitor of growth family member 4;
CALCOCO1, calcium-binding and coiled-coil domain-containing protein
1; PNRC1, proline-rich nuclear receptor coactivator 1; KLHL24,
Kelch-like protein 24.](/article_images/mmr/34/5/mmr-34-05-14017-g00.jpg) | Figure 1.Machine-learning identification of a
gene signature associated with the DTP state. (A)
Principal-component analysis of control and TKI-treated tumour
samples demonstrated distinct clustering of DTP cells, indicating a
conserved transcriptional reprogramming pattern. (B) Volcano plot
of differential gene expression [log2(fold-change) vs,
log10(adj.P-value)] showing significantly upregulated
genes (BTG1, ING4, CALCOCO1 and PNRC1) in DTP cells
compared with control cells. (C) Heatmap of the expression of
candidate genes across datasets revealed consistent upregulation in
DTP samples. (D) Feature-selection curves from LASSO, random forest
and SVM-RFE analyses showing variable-importance scores and
cross-validation error. (E) Venn diagram illustrating overlap among
the three algorithms, identifying BTG1, ING4 and
KLHL24 as core genes common to all approaches. (F)
Receiver-operating characteristic curves evaluating the predictive
performance of key genes identified in the integrated model (AUC,
0.96–0.99) for identifying DTP cells. (G) Cross-dataset comparative
expression Cross-dataset comparative expression analysis showing
consistent upregulation of the core genes in TKI-treated/DTP
samples relative to the corresponding DMSO/control samples after
within-dataset normalization. DTP, drug-tolerant persister; PC1,
principal component 1; PC2, principal component 2; LogFC,
logarithmic fold change; LASSO, least absolute shrinkage and
selection operator; SVM-RFE, support vector machine-recursive
feature elimination; AUC, area under the curve; TKI, tyrosine
kinase inhibitor; adj.P-value, adjusted P-value; BTG1, B-cell
translocation gene 1; ING4, inhibitor of growth family member 4;
CALCOCO1, calcium-binding and coiled-coil domain-containing protein
1; PNRC1, proline-rich nuclear receptor coactivator 1; KLHL24,
Kelch-like protein 24. |
Additional public datasets used for cross-context
validation of the four-gene signature were also included, including
GSE162045, GSE103021 and GSE229070. These datasets contained kinase
inhibitor-treated cell lines, including PC-9, SK-MEL-28, NCI-H358,
H23 and H358 cells, and were used to examine whether the four-gene
expression pattern was observed across different RTK/RAS/MAPK
pathway inhibition contexts.
Cancer Dependency Map (DepMap)-based
transcriptomic and pharmacogenomic analysis
DepMap-based analyses were performed using the
publicly available DepMap Portal (Broad Institute https;//depmap.org/portal/) and the DepMap Public 25Q4
release, which integrates cancer cell-line molecular profiling
data, including gene-expression datasets, and pharmacological
response data from the PRISM Repurposing secondary screen. As these
analyses were performed directly through the DepMap Portal, no
individual external dataset accession numbers were applicable.
Single-sample gene set enrichment analysis (ssGSEA)
scores were obtained using the pathway activity analysis module
available in the DepMap Portal based on DepMap gene-expression
profiles. These scores were used to evaluate pathway activity
associated with the four-gene signature. Cell lines were stratified
into high- and low-signature-expression groups according to the
combined expression score of BTG1, ING4, PNRC1 and CALCOCO1.
Pathway activity differences between high- and
low-signature-expression groups were evaluated to identify
biological programs associated with the DTP-associated
transcriptional state.
For DepMap analyses, LUAD and breast cancer cell
lines were selected based on their biological relevance to the
present study and the availability of well-annotated models. Breast
cancer cell lines were included because the integrated
transcriptomic discovery datasets contained lapatinib-treated
breast cancer persister models, thereby allowing evaluation of
whether the identified four-gene signature and associated
pharmacological vulnerabilities were reproducible across multiple
targeted-therapy-associated tumour contexts. Cell lines were ranked
according to the expression of the four-gene signature, which
comprised B-cell translocation gene 1 protein (BTG1),
inhibitor of growth protein 4 (ING4), proline-rich nuclear
receptor coactivator 1 (PNRC1) and calcium-binding and
coiled-coil domain-containing protein 1 (CALCOCO1). The top
25 and bottom 25 cell lines in each cancer type were defined as the
high- and low-signature groups, respectively, to enable robust
contrast of drug-response data between cell lines of variable
gene-signature expression while maintaining sufficient sample size
for downstream analyses. Drug sensitivity was assessed using area
under the curve (AUC) values from the Profiling Relative Inhibition
Simultaneously in Mixtures (PRISM) repurposing secondary screen
dataset available through the DepMap Portal. Cell lines with
ambiguous lineage annotation or duplicated or incomplete records
were excluded. Group comparisons were conducted using the DepMap
portal (https;//depmap.org) via the ‘Custom
Analysis’ module using the ‘Two class comparison’ setting. For each
compound, the analysis returned an effect size, P-value and q-value
drug-response profiles between the high- and
low-signature-expression cell-line groups. The q-value was used to
control for multiple testing, and compounds with q≤0.05 were
considered statistically significant. Because lower AUC values
correspond with increased drug sensitivity, a negative effect size
was interpreted as an indicator of enhanced sensitivity. Therefore,
compounds showing significantly lower AUC values in the
high-signature-expression cell lines compared with
low-signature-expression cell lines were considered selectively
effective and prioritized for experimental validation.
Gene set enrichment analysis
(GSEA)
Differentially expressed genes were ranked by
log2(fold-change) (treatment vs. control) and analysed
using the ‘clusterProfiler’ package (version 4.8.3; Bioconductor)
in R (version 4.3.0; Posit Software, PBC). Multiple curated gene
set collections from the Molecular Signatures Database (MSigDB;
https;//www.gsea-msigdb.org/gsea/msigdb) (35) were used, including C2; CP; Kyoto
Encyclopedia of Genes and Genomes MEDICUS (release 7.4), C3; TFT
(release 2023.1. Homo sapiens (Hs)), C5; Gene Ontology (release
7.4) and C6; Oncogenic Signatures (release 2023.1.Hs). Gene
enrichment was computed using the ‘GSEA’ function with default
parameters, and statistical significance was determined based on
normalised enrichment scores and adjusted P-values
(Benjamini-Hochberg FDR<0.25). Visualisation of the top enriched
pathways was performed using the ‘gseaplot2’ function in the
enrichplot R/Bioconductor package (version 1.28.4; Bioconductor),
showing the top five positively and negatively enriched
pathways.
Machine learning analysis
To identify robust genetic features distinguishing
DTP cells from control samples, three complementary
machine-learning algorithms were implemented in R (version 4.5.0;
Posit Software, PBC); i) Least absolute shrinkage and selection
operator (LASSO); ii) random forest; and iii) support vector
machine-recursive feature elimination (SVM-RFE). Differentially
expressed genes from GEO-derived datasets were transposed into a
sample-by-gene matrix, and class labels (control vs. treatment)
were extracted from sample names. LASSO regression was performed
using the ‘glmnet’ package (family, ‘binomial’; α, 1; version 4.1;
CRAN) with 10-fold cross-validation, and genes exhibiting non-zero
coefficients at the optimal penalty (‘lambda.min’) were retained.
Random forest classification was conducted with the ‘randomForest’
package (version 4.7; CRAN) using 500 trees, followed by refinement
to the tree number corresponding to the minimum out-of-bag error.
Variable importance was ranked by mean decrease in Gini index, and
genes with importance scores >2 were defined as random
forest-selected features. SVM-RFE was implemented using the ‘e1071’
package (version 1.7; CRAN) and a recursive feature elimination
wrapper script (k, 10; ‘halve.above’, 50) to iteratively remove the
least informative genes until the minimal cross-validation error
was achieved. The intersection of the three feature lists obtained
from LASSO, random forest and SVM-RFE analyses was defined as the
consensus machine-learning signature. Model performance and feature
stability were evaluated by cross-validation error curves and
variable importance plots generated in ‘ggplot2’ (version 4.0;
CRAN), and reproducibility was ensured by setting random seeds
[‘set.seed(123)’ and ‘set.seed(12345)’].
Prognostic analysis
The prognostic significance of the four-gene
signature, comprising BTG1, ING4, PNRC1 and CALCOCO1,
was evaluated using the Kaplan-Meier plotter online database
(https;//kmplot.com) (36). Clinical and transcriptomic data for
LUAD were obtained from the integrated GEO, European Genome-phenome
Archive (EGA) and The Cancer Genome Atlas (TCGA) datasets within
the Kaplan-Meier Plotter platform. Patients were included if
expression data for all four genes were available and were
stratified into high- and low-expression groups according to the
combined expression score of the four-gene signature, as
implemented in the platform.
For the primary survival analysis, the lung cancer
mRNA dataset was filtered for LUAD/adenocarcinoma cases, and
survival endpoints included overall survival (OS), post-progression
survival (PPS) and first progression (FP). The ‘auto select best
cutoff’ option was used to determine the optimal threshold. This
option systematically tested all possible cut-offs between the
lower and upper quartiles of expression and applied
Benjamini-Hochberg FDR correction to the data to reduce
multiple-testing bias. The cut-off value yielding the lowest FDR
was selected for survival analysis; if multiple cut-off values
showed equal significance, the one with the highest hazard ratio
(HR) was chosen. Kaplan-Meier survival curves were generated for
overall survival (OS), post-progression survival (PPS) and first
progression (FP), and HRs with 95% confidence intervals (CIs) and
log-rank P-values were obtained from the platform. The selected
cut-off values and the corresponding grouping parameters for each
analysis are provided in Table
II.
| Table II.Kaplan-Meier plotter parameters and
selected cut-off values used for survival analyses of the four-gene
signature. |
Table II.
Kaplan-Meier plotter parameters and
selected cut-off values used for survival analyses of the four-gene
signature.
| Analysis | KM plotter
module | Dataset type | Endpoint | Disease/histology
filter | Subgroup
filter | Cut-off option | Selected cut-off
value (range) | Follow-up
restriction |
|---|
| Primary OS | Lung cancer | mRNA | OS |
LUAD/adenocarcinoma | None | Auto select best
cutoff | 694 | 180 months |
| Primary PPS | Lung cancer | mRNA | PPS |
LUAD/adenocarcinoma | None | Auto select best
cutoff | 758.4 | 180 months |
| Primary FP | Lung cancer | mRNA | FP |
LUAD/adenocarcinoma | None | Auto select best
cutoff | 997.2 | 180 months |
| Male subgroup | Lung cancer | mRNA | OS |
LUAD/adenocarcinoma | Male | Auto select best
cutoff | 1469.5 | 180 months |
| Female
subgroup | Lung cancer | mRNA | OS |
LUAD/adenocarcinoma | Female | Auto select best
cutoff | 1481.5 | 180 months |
| Smoker
subgroup | Lung cancer | mRNA | OS |
LUAD/adenocarcinoma | Smokers;
never-smokers excluded | Auto select best
cutoff | 1469.5 | 240 months |
| Stage I | Lung cancer | mRNA | OS |
LUAD/adenocarcinoma | Stage I | Auto select best
cutoff | 1550.5 | 240 months |
| Stage II | Lung cancer | mRNA | OS |
LUAD/adenocarcinoma | Stage II | Auto select best
cutoff | 2208 | 240 months |
| Stage III | Lung cancer | mRNA | OS |
LUAD/adenocarcinoma | Stage III | Auto select best
cutoff | 2430.25 | 240 months |
In addition, subgroup survival analyses were
performed using the same Kaplan-Meier plotter platform to further
validate the prognostic relevance of the four-gene signature in
clinically relevant subsets of patients with LUAD, including; i)
Male patients; ii) female patients; iii) smokers after exclusion of
never-smokers; and iv) patients with stage I, stage II or stage III
disease. OS was compared between the high- and low-expression
groups according to the grouping settings provided by the platform,
and HRs with log-rank P-values were obtained directly from the
Kaplan-Meier plot output. The dataset module, endpoint, subgroup
filters, selected cut-off values and grouping parameters used for
the primary and subgroup analyses are summarized in Table II.
Comparative expression analysis
Comparative expression analysis between tumour and
normal tissues was conducted using the tumour-normal-metastatic
plot (TNMplot, V2) web platform (https;//tnmplot.com/analysis/) (37). TNMplot is a web-based
transcriptomic analysis platform that integrates public tumour and
normal tissue datasets, including TCGA, Genotype-Tissue Expression
(GTEx) and GEO dataset. For the present analysis, the ‘RNA-seq
(TCGA + GTEx)’ analysis mode was selected to evaluate the
expression patterns of the four-gene signature in LUAD. No
individual datasets were manually selected or downloaded, and no
search terms were used to identify datasets. Instead, the analysis
was performed by selecting the LUAD tumour-normal comparison within
the predefined RNA-seq (TCGA + GTEx) module of the TNMplot V2
platform and entering BTG1, ING4, PNRC1 and CALCOCO1. According to
the TNMplot platform description and reference, RNA-seq data within
the platform are processed using a DESeq2-based normalization
pipeline for cross-cohort comparison; however, no raw data were
downloaded and no local R, DESeq2 or other statistical software was
used in the present study for this analysis. Statistical
differences in gene expression between tumour and normal samples
were assessed using the non-parametric Mann-Whitney U-test, as
implemented by the TNMplot platform, and P<0.05 was considered
statistically significant. Combined signature expression was
visualised as a boxplot, whereas the median expression levels of
individual genes were illustrated using radar plots comparing
normal and tumour tissues.
TCGA-based clinicopathological and
survival analyses
Clinical, transcriptomic and survival data for
TCGA-LUAD were obtained from the UCSC Xena Browser TCGA-LUAD
cohort, including the TCGA-LUAD.star_tpm.tsv.gz,
TCGA-LUAD.clinical.tsv.gz and TCGA-LUAD.survival.tsv.gz files
(https;//xenabrowser.net/datapages/).
Cases with available gene expression data, OS data and
clinicopathological annotations were included. Only primary tumour
samples, defined by TCGA sample type code ‘01’, were retained for
expression-based analyses. Ensembl gene identifiers were converted
to gene symbols using the AnnotationDbi and org.Hs.eg.db
Bioconductor packages. A weighted four-gene signature based on
BTG1, ING4, PNRC1 and CALCOCO1 was calculated by
multiplying the z-score-standardized expression of each gene by its
corresponding coefficient from single-gene Cox proportional hazards
regression and summing the resulting weighted components across
genes. The resulting composite score was then standardized to
express the final signature score on a per-standard-deviation scale
for downstream Cox regression, subgroup analysis and visualization.
This second standardization was applied to the composite weighted
score and did not alter the relative ranking of patients. Patients
were classified into high- and low-score groups using the
cohort-specific median standardized weighted score unless otherwise
specified.
OS was assessed by Kaplan-Meier analysis using the
log-rank test, and HRs with 95% CIs were estimated using Cox
proportional hazards models. Univariate Cox analysis was used to
evaluate the weighted score as continuous variable and to assess
the prognostic effect of each individual signature gene.
Multivariable Cox regression was subsequently performed with
adjustments for age and disease-stage groupings. Stage groups were
categorized as early [American Joint Committee on Cancer (AJCC)
stage I–II] or advanced (AJCC stage III–IV) (https;//training.seer.cancer.gov.) and age subgroups
were defined by the cohort-specific median age at diagnosis; the
younger age subgroup was defined by patients below the median age,
whereas the older subgroup included patients whose age was equal or
greater than the median cohort age.
Correlations between the weighted score and
continuous clinical variables were evaluated using Spearman's
correlation analysis, whereas group comparisons were performed
using the Wilcoxon rank-sum test for two-group comparisons or the
Kruskal-Wallis test for comparisons involving more than two groups.
The Kruskal-Wallis test was used as a global test, and no post hoc
pairwise comparisons were performed because no pairwise group
differences were interpreted. Subgroup and interaction analyses
were conducted according to age group and stage group, and the
proportional hazards assumption was assessed using time-varying
coefficient analysis. Unless otherwise specified, P<0.05 was
considered statistically significant. All TCGA-based analyses were
performed in R (version 4.6.0; R Foundation for Statistical
Computing) using the following packages; data.table (1.18.4), dplyr
(1.2.1), tidyr (1.3.2), stringr (1.6.0), ggplot2 (4.0.3), survival
(3.8.6), survminer (0.5.2), broom (1.0.13), forcats (1.0.1),
AnnotationDbi (1.74.0) and org.Hs.eg.db (3.23.1).
Reagents
DMEM (cat. no. 12100046) and RPMI-1640 medium (cat.
no. 31800022) were purchased from Thermo Fisher Scientific, Inc.
Foetal bovine serum was obtained from PAN-Biotech GmbH (cat. no.
P30-3302), and penicillin-streptomycin solution (100X) was obtained
from Bio-Channel/Nanjing Shenghang Biotechnology Co., Ltd. (cat.
no. BC-CE-007). Trypsin was purchased from Thermo Fisher
Scientific, Inc. (cat. no. 27250018). Propidium iodide was obtained
from Beijing Solarbio Science & Technology Co., Ltd. (cat. no.
P8080), Calcein acetoxymethyl ester (Calcein-AM) was obtained from
Shanghai Macklin Biochemical Co., Ltd. (cat. no. C794029), and
DCFH-DA was obtained from MedChemExpress (cat. no. HY-D0940).
Z-DEVD-FMK was purchased from MedChemExpress (cat. no. HY-12466).
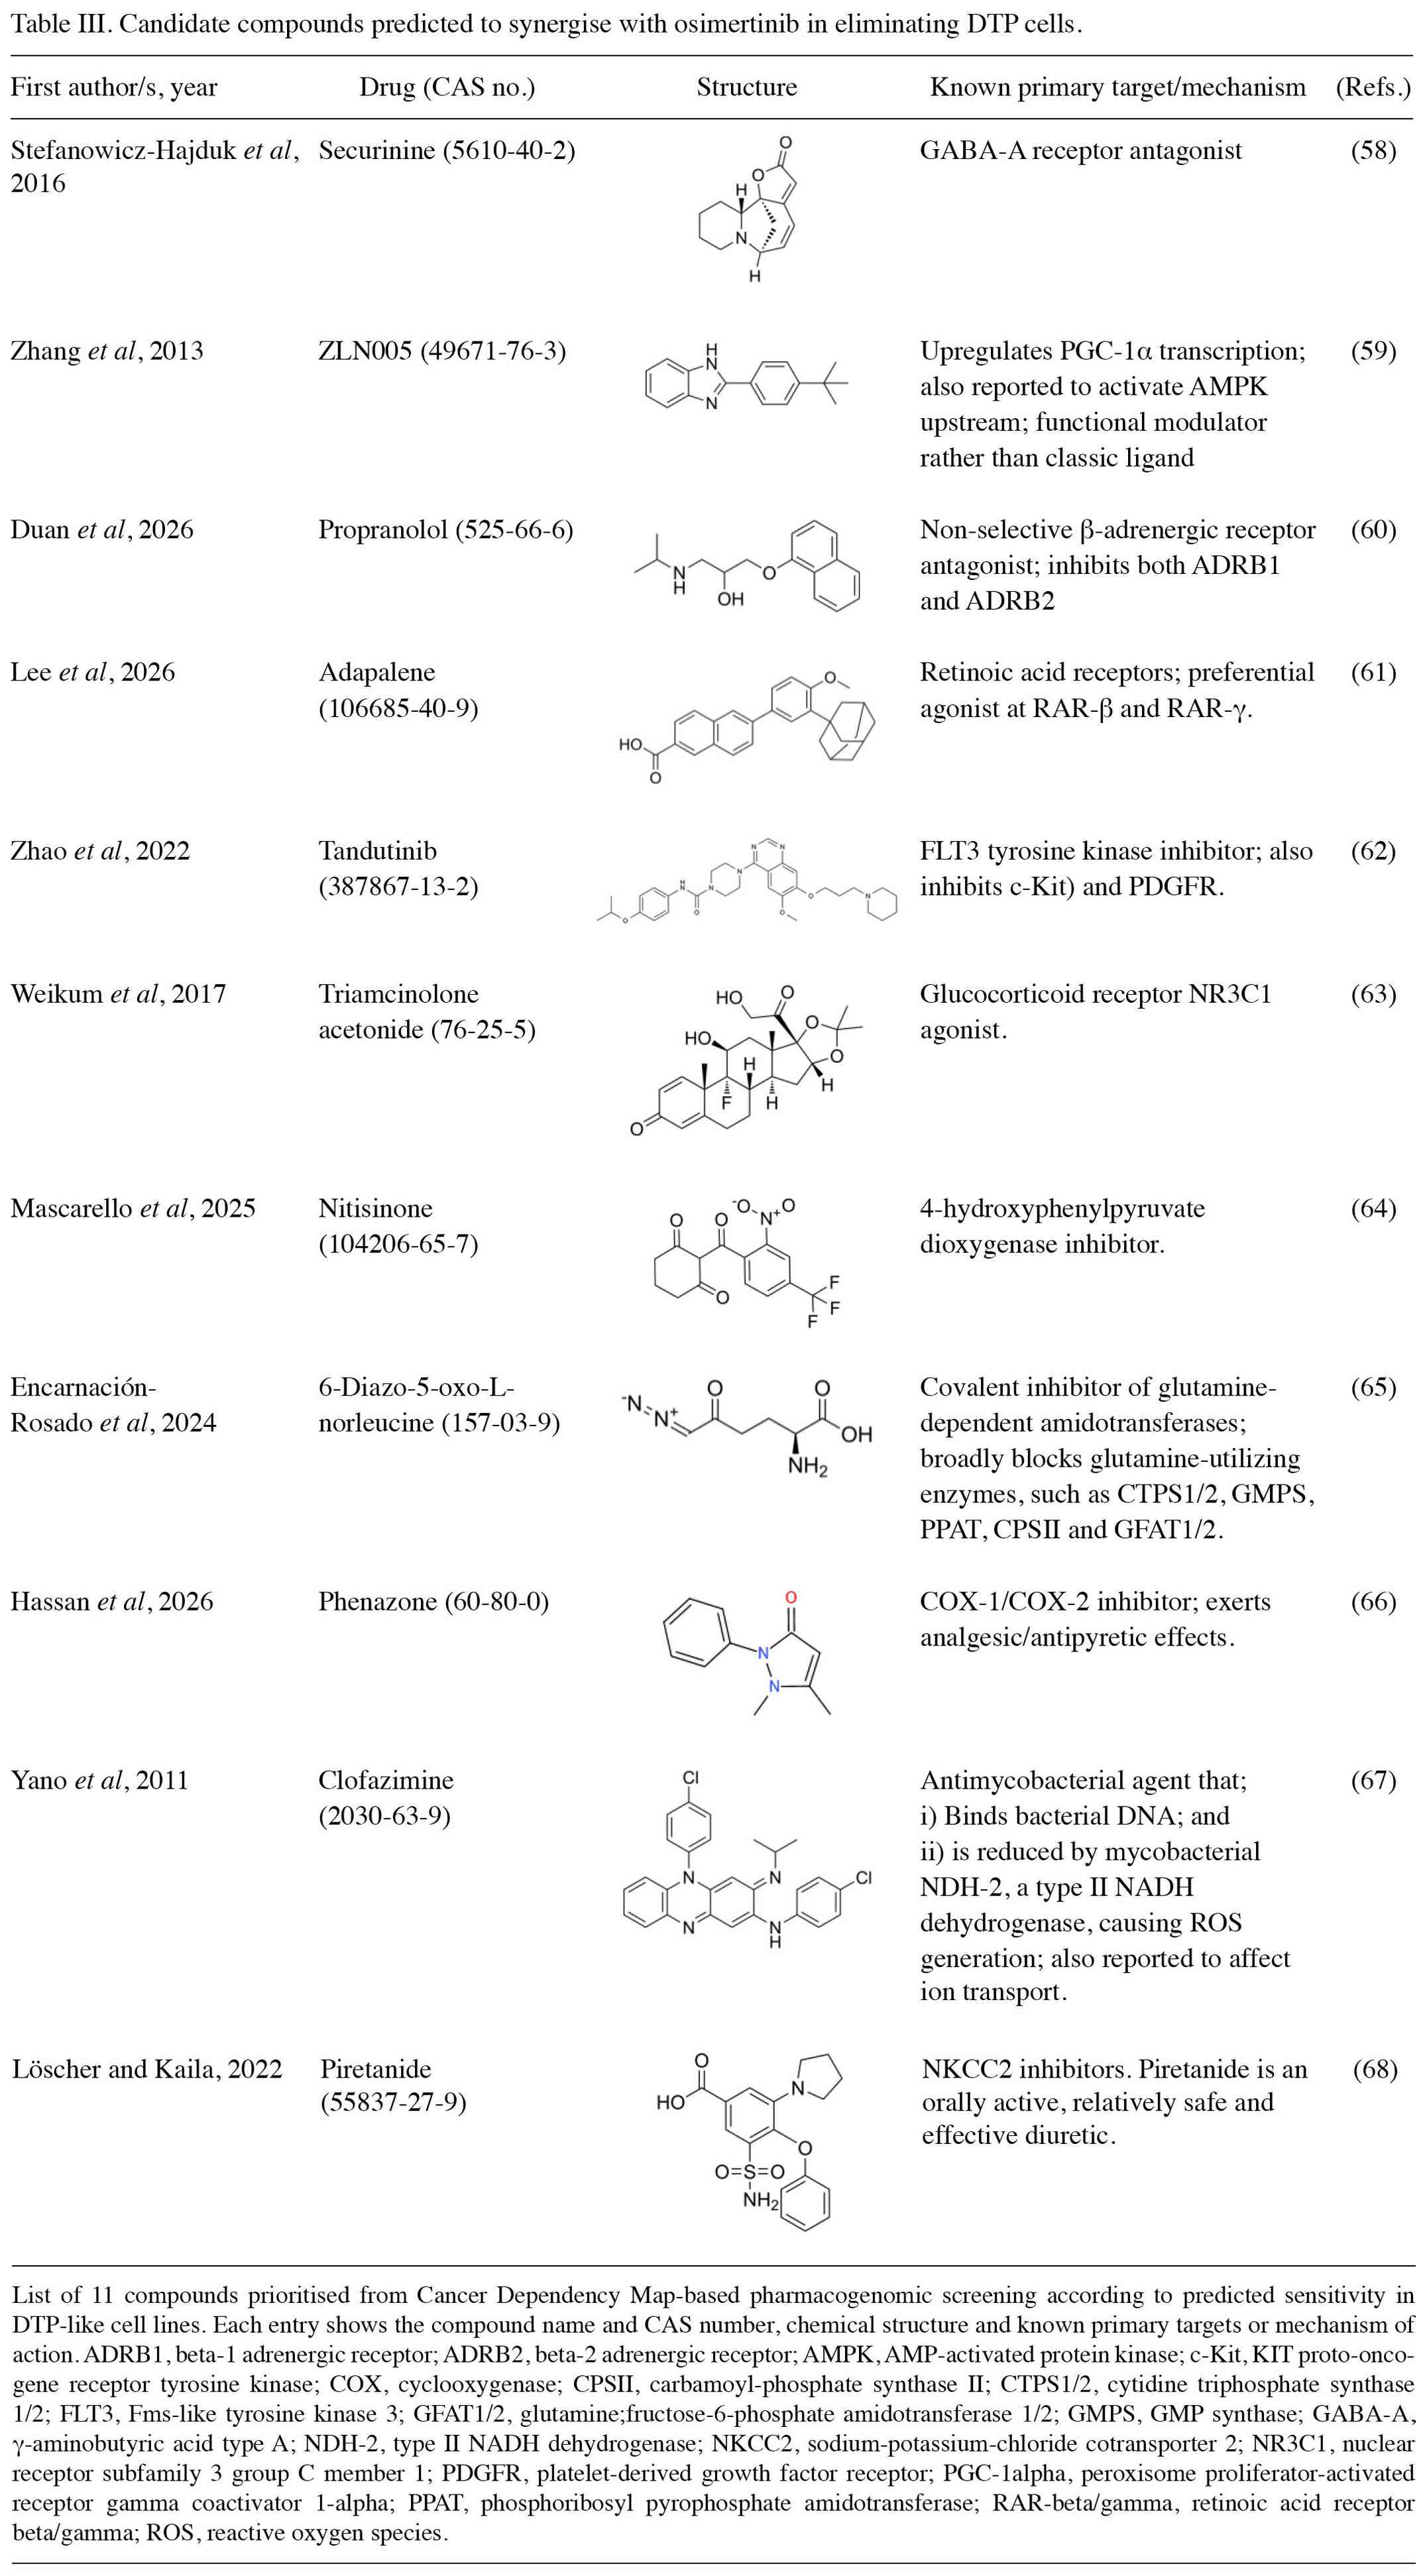
Securinine (cat. no. S861357), 6-diazo-5-oxo-L-norleucine (cat. no.
D915139; CAS no. 157-03-9) and clofazimine (cat. no. C830484) were
obtained from Shanghai Macklin Biochemical Co., Ltd. ZLN005 (cat.
no. Z170591), propranolol (cat. no. P612948) and triamcinolone
acetonide (cat. no. T101294) were obtained from Shanghai Aladdin
Biochemical Technology Co., Ltd. Adapalene (cat. no. BD17446),
tandutinib (cat. no. BD152374), nitisinone (cat. no. BD61457) and
phenazone (cat. no. BD01397972) were obtained from Shanghai Bide
Pharmatech Co., Ltd. Piretanide was obtained from TargetMol
Chemicals Inc. (cat. no. T19788).
Cell culture
The human PC-9 (cat. no. SCSP-5085) and HCC827 (cat.
no. TCHu153) cell lines, which contain deletions in EGFR
exon 19 (E746-A750del and E746-A750del, respectively), were
obtained from the Cell Bank of the Chinese Academy of Sciences
(http;//www.cellbank.org.cn). Cells were
maintained in RPMI-1640 medium (Gibco; Thermo Fisher Scientific,
Inc.) supplemented with 10% foetal bovine serum (PAN-Biotech GmbH),
100 U/ml penicillin and 100 µg/ml streptomycin at 37°C in a
humidified incubator with 5% CO2. All cell lines were
authenticated by short tandem repeat profiling and routinely tested
negative for mycoplasma contamination. Cells were used within 20
passages after thawing to ensure genomic stability and
reproducibility.
Sodium dodecyl sulphate-polyacrylamide
gel electrophoresis (SDS-PAGE) and immunoblotting
Parental PC-9 cells or PC-9 Tet-on-shCALCOCO1
cells were cultured and lysed in lysis buffer containing 50 mM
Tris-HCl (pH 7.4) and 1% SDS. Lysates were placed on an ice-water
mixture and sonicated at 20% power using cycles of 2 sec on and 4
sec off for a total sonication time of 2 min to ensure complete
protein solubilization. Cell debris was removed by centrifugation
at 17,000 × g for 15 min at room temperature. Protein
concentrations were determined using a Bicin-choninic Acid protein
kit (BCA, cat. no. WB6501, NCM Biotech) and the resulting
supernatants (~2 mg/ml total protein) were collected for analysis.
Equal amounts of protein (50 µg per line) were mixed with 6X SDS
sample buffer, boiled at 95°C for 10 min and separated by SDS-PAGE
on gels of 10% acrylamide concentration. Proteins were then
transferred onto PVDF membranes using a wet transfer system
operated at 100 V for 1 h at 4°C. Membranes were blocked with 5%
bovine serum albumin (BSA, cat. no. abs9157; Absin Bioscience Inc.)
in PBS containing 0.1% Tween-20 (PBST) for 1 h at room temperature
to prevent non-specific binding. Blots were subsequently incubated
overnight at 4°C with primary antibodies diluted in PBST with 5%
BSA. After washing three times with PBST for 10 min each, membranes
were incubated with HRP-conjugated secondary antibodies for 1 h at
room temperature. Excess antibodies were removed by three
additional PBST washes for 10 min each. Protein bands were
visualised using the SuperSignal West Pico PLUS Chemiluminescent
Substrate (cat. no. 34578; Thermo Fisher Scientific, Inc.). GAPDH
served as the internal loading control to ensure equal protein
loading.
Antibodies and dilutions used in the present study
were as follows; GAPDH (1;100,000; cat. no. AC033; ABclonal Biotech
Co., Ltd.), goat anti-rabbit HRP (1;5,000; cat. no. 31460; Thermo
Fisher Scientific, Inc.), goat anti-mouse HRP (1;5,000; cat. no.
AS003; ABclonal Biotech Co., Ltd.), poly(ADP-ribose) polymerase
(PARP; 1;1,000; cat. no. 9532S; Cell Signaling Technology, Inc.,
recognizing full-length PARP1 and cleaved PARP1), gasdermin D
(GSDMD; 1;1,000; cat. no. 39754S; Cell Signaling Technology, Inc.),
GSDME (1;1,000; cat. no. F1701; Selleck Chemicals, recognizing
full-length GSDME and the N-terminal cleavage fragment), caspase-3
(1;1,000; cat. no. 9662S; Cell Signaling Technology, Inc.,
recognizing full-length and cleaved caspase-3) and caspase-8
(1;1,000; cat. no. HA722181; HUABIO, recognizing full-length and
cleaved caspase-8).
Phase-contrast microscopy
Cells were treated with osimertinib, the indicated
candidate compounds or their combinations as described for the
corresponding cell viability experiments. After treatment, cell
morphology was examined using an inverted phase-contrast microscope
(Olympus CKX53; Olympus Corporation), and representative images
were captured to assess morphological changes, including cell
detachment, rounding and membrane rupture.
Propidium iodide (PI) and calcein
acetoxymethyl ester (calcein-AM) staining
PC-9 cells were seeded in 6-well plates at an
initial density of 20–30% confluency 1 day before drug treatment.
Cells were then treated for 48 or 72 h with osimertinib (0.5 µM;
cat. no. HY-15772; MedChemExpress), ZLN005 (5, 10 or 20 µM; cat.
no. Z170591; Shanghai Aladdin Biochemical Technology Co., Ltd.),
propranolol (10 µM; cat. no. P612948; Shanghai Aladdin Biochemical
Technology Co., Ltd.), tandutinib (5 µM; cat. no. BD152374;
Shanghai Bide Pharmatech Co., Ltd.), nitisinone (10 µM; cat. no.
BD61457; Shanghai Bide Pharmatech Co., Ltd.) and phenazone (10 µM;
cat. no. BD01397972; Shanghai Bide Pharmatech Co., Ltd.). Following
treatment, cells were maintained at 37°C in a humidified incubator
with 5% CO2 for the indicated time periods. At each
designated time point, both the culture supernatant and adherent
cells were collected to ensure the inclusion of floating dead
cells. The cell suspension was centrifuged at 450 × g for 5 min at
room temperature, and the resulting pellet was gently resuspended
in PBS containing PI (4 µg/ml) and calcein-AM (1 µg/ml). The
suspension was then returned to the corresponding well and
incubated at 37°C for 30 min in the dark. After this staining step,
cells were washed once with PBS to remove excess dye and
immediately visualized using a fluorescence microscope. Calcein-AM
selectively labelled viable cells with green fluorescent signals,
whereas PI was used to stain membrane-compromised or dead cells
with red fluorescence.
Flow cytometry for PI staining of
cells
For quantitative assessment of cell death, PC-9
cells were treated with vehicle control (0.1% (v/v) DMSO),
osimertinib (0.5 µM; cat. no. HY-15772; MedChemExpress), or
osimertinib in combination with ZLN005 (5 µM; cat. no. Z170591;
Shanghai Aladdin Biochemical Technology Co., Ltd.), propranolol (10
µM; cat. no. P612948; Shanghai Aladdin Biochemical Technology Co.,
Ltd.), tandutinib (5 µM; cat. no. BD152374; Shanghai Bide
Pharmatech Co., Ltd.), nitisinone (10 µM; cat. no. BD61457;
Shanghai Bide Pharmatech Co., Ltd.) or phenazone (10 µM; cat. no.
BD01397972; Shanghai Bide Pharmatech Co., Ltd.) for 72 h at 37°C in
a humidified incubator with 5% CO2. After treatment,
both adherent and floating cells were collected, washed twice with
PBS and resuspended in 500 µl PBS containing 2 µg/ml PI. Cells were
incubated at room temperature for 30 min in the dark to allow for
dye uptake. Fluorescence intensity was measured using a flow
cytometer (BD FACSCanto II; BD Biosciences), with PI-positive cells
representing membrane-compromised or pyroptotic populations. Data
acquisition and analysis were performed using FlowJo software
(version 10.8.1; BD Biosciences).
Flow cytometry for reactive oxygen
species (ROS)
PC-9 cells were seeded in 6-well plates at ~25%
confluency and cultured for 24 h at 37°C in a humidified incubator
with 5% CO2. The cells were then treated with DMSO
(vehicle control), 0.5 µM osimertinib, 10 µM ZLN005 or a
combination of 0.5 µM osimertinib and 10 µM ZLN005 for 5 h at 37°C
in a humidified incubator with 5% CO2. After treatment,
cells were harvested by trypsinization 1 min at 37°C in a
humidified incubator with 5% CO2 and the collected cells
incubated with 2 µM 2′,7′-dichlorodihydrofluorescein diacetate
(DCFH-DA), a cell-permeable probe used to detect intracellular ROS,
at room temperature for 30 min in the dark. The cell suspension was
subsequently filtered through a 300-mesh nylon membrane to remove
aggregates prior to analysis. Intracellular ROS levels were
determined using a flow cytometer (BD FACSCanto™ II; BD
Biosciences), and data were processed using FlowJo software
(version 10.8.1; BD Biosciences).
Lactate dehydrogenase (LDH)
cytotoxicity assay
Cell death was evaluated using an LDH Cytotoxicity
Detection Kit (cat. no. C0017; Beyotime Biotechnology) according to
the manufacturer's instructions. Briefly, cells were seeded in
12-well plates and pre-incubated with or without the caspase-3
inhibitor Z-DEVD-FMK (50 µM; cat. no. HY-12466; MedChemExpress) for
1 h, followed by potential co-treatment with ZLN005 (10 µM; cat.
no. Z170591; Shanghai Aladdin Biochemical Technology Co., Ltd.) and
osimertinib (0.5 µM; cat. no. HY-15772; MedChemExpress) for 48 h at
37°C in a humidified incubator with 5% CO2. At the end
of the treatment period, the culture plates were centrifuged at 400
× g for 5 min at 4°C to pellet cell debris. The supernatant was
then collected, and 120 µl from each sample was transferred into a
fresh 96-well plate. After incubation with the LDH reaction working
solution for 30 min at room temperature in the dark, the absorbance
was measured at 490 nm using a microplate reader (Cytation 3 Cell
Imaging Multi-Mode Reader; BioTek Instruments; Agilent
Technologies, Inc.). The percentage of LDH release in each
treatment group was calculated as a measure of cell death rate
using the following formula; LDH release (%)=[optical density
(OD)490 of sample-medium blank]/(OD490 of
maximum enzyme activity-medium blank) ×100.
Tetracycline (Tet)-on inducible short
hairpin RNA (shRNA) knockdown
293T cells (obtained from the National Collection of
Authenticated Cell Cultures) were used for lentiviral packaging.
Cells were cultured in DMEM supplemented with 10% fetal bovine
serum and 1% penicillin/streptomycin at 37°C in a humidified
incubator with 5% CO2. A second-generation lentiviral
packaging system was used. 293T cells were co-transfected with
Tet-inducible shRNA or sh-negative control (NC) plasmids
(Tet-pLKO-puro; cat. no. 21915; Addgene, Inc.), the packaging
plasmid psPAX2 (cat. no. 12260; Addgene, Inc.), and the envelope
plasmid VSV-G (cat. no. 14888; Addgene, Inc.) using
polyethyleneimine (PEI; cat. no. 24765-1; Polysciences, Inc.)
according to the manufacturer's protocol. For each 6-cm dish, a
total of 5 µg plasmid DNA was used at a shRNA plasmid;
psPAX2;pMD2.G ratio of 5;3;1. Transfected cells were maintained at
37°C in a 5% CO2 incubator, and viral supernatants were
collected 48 h after transfection. The supernatants were clarified
by centrifugation at 500 × g for 10 min at 4°C and filtered through
a 0.45-µm membrane filter before use.
PC-9 cells were transduced with lentiviral particles
encoding Tet-inducible shRNA constructs targeting human ING4,
BTG1, PNRC1 or CALCOCO1. The shRNA oligonucleotide
sequences were as follows; CALCOCO1,
5′-CAGGAGAACCATCACTTAAAT-3′; PNRC1,
5′-CATACTTGAGAGGTATATTAT-3′; BTG1,
5′-GGAGCTGCTGGCAGAACATTA-3′; ING4,
5′-GCTAGGTGTGATCAACACTTT-3′; and control,
5′-CAACAAGATGAAGAGCACCAA-3′. Following lentiviral transduction at a
multiplicity of infection (MOI) of 5 in the presence of 8 µg/ml
polybrene (cat. no. HY-112735; MedChemExpress) at 37°C for 24 h.
Following transduction, cells were allowed to recover in fresh
medium for 24 h before the addition of puromycin. Stably transduced
PC-9 cells were selected with puromycin (1 µg/ml) for 7 days. To
induce shRNA expression, cells were treated with doxycycline (1
µg/ml) for 48 h at 37°C in a humidified incubator with 5%
CO2, whereas cells cultured in the absence of
doxycycline served as the uninduced control. Doxycycline was added
for 48 h to induce shRNA expression before all functional assays.
The total time from the start of lentiviral transduction to these
assays was approximately 10–12 days, which includes the
transduction, recovery, puromycin selection and doxycycline
induction periods.
Reverse transcription-quantitative PCR
(RT-qPCR)
Total RNA was isolated and purified using a custom
guanidinium isothiocyanate-silica column extraction method
developed in-house. Briefly, cells (PC-9 or HCC827) were lysed in
guanidinium isothiocyanate buffer (cat. no. G110926; Shanghai
Aladdin Biochemical Technology Co., Ltd.; final concentration, 4M),
followed by RNA adsorption onto a silicon-based spin column at room
temperature for 1 min, sequential washing to remove contaminants
and elution in RNase-free water. The purity and concentration of
RNA were determined spectrophotometrically (NanoDrop 2000, Thermo
Fisher Scientific, Inc.) [absorbance
(A)260/A280 and
A260/A230 ratios >2.0]. Complementary DNA
(cDNA) was synthesised from 1 µg total RNA using the
HiScript® II 1st Strand cDNA Synthesis Kit with gDNA
Wiper (cat. no. R212; Vazyme Biotech Co., Ltd.) to eliminate
genomic DNA contamination. Reverse transcription was performed
according to the manufacturer's recommended protocol. qPCR was
performed using the ChamQ Blue Universal SYBR qPCR Master Mix (cat.
no. Q312; Vazyme Biotech Co., Ltd.) on a StepOnePlus™
Real-Time PCR System (Applied Biosystems; Thermo Fisher Scientific,
Inc.). The thermocycling conditions were as follows; initial
denaturation at 95°C for 30 sec; 40 cycles of 95°C for 10 sec and
60°C for 30 sec; followed by a dissociation stage (95°C for 15 sec,
60°C for 1 min and 95°C for 15 sec) for melting curve analysis. The
relative expression levels of target genes were calculated using
the 2−ΔΔCq method (38), with β-actin serving as the internal
normalization control. Each reaction was performed in triplicate,
and data were obtained from three independent biological
replicates. Results are presented as mean ± SD. Primer specificity
was experimentally verified via melting curve analysis, which
demonstrated a single amplification peak for each primer under the
assay conditions. Primer sequences used for qPCR were as follows;
β-actin, forward 5′-CACCATTGGCAATGAGCGGTTC-3′, reverse
5′-AGGTCTTTGCGGATGTCCACGT-3′; BTG1, forward
5′-CATCTCCAAGTTTCTCCGCACC-3′, reverse
5′-GCGAATACAACGGTAACCCGATC-3′; CALCOCO1, forward
5′-TGCTGACGAAGGAAGTGGAGCT-3′, reverse 5′-TCCTGTTGTGCCACTTGGAGCT-3′;
ING4, forward 5′-CAGGAAGCCTATGGCAAGTGCA-3′, reverse
5′-TGAGATCAGCCTCAAAACGGGC-3′; and PNRC1, forward
5′-GCCAAACCCCCCTCAGGAAAG-3′, reverse
5′-GTGTATACCATGAACAAGCTGGC-3′.
Senescence-associated β-galactosidase
(β-gal) staining
To evaluate the DTP-like state,
senescence-associated β-gal staining was performed using a Cellular
Senescence β-Galactosidase Staining Kit (cat. no. C0602; Beyotime
Biotechnology) according to the manufacturer's instructions. PC-9
cells with stable knockdown of ING4, BTG1, PNRC1 or
CALCOCO1 were seeded in 6-well plates and treated with DMSO
or 1 or 2 µM osimertinib for 72 h at 37°C in a humidified incubator
with 5% CO2. The culture medium was then aspirated, and
cells were washed once with PBS. Cells were subsequently fixed with
1 ml fixation solution (provided with the kit; no further dilution
required) per well at room temperature for 15 min, followed by
three washes with PBS for 3 min each. After complete removal of the
washing buffer, 1 ml freshly prepared staining working solution was
added to each well, and cells were incubated overnight at 37°C in a
CO2-free environment. Following staining, the working
solution was aspirated and cells were rinsed with 2 ml PBS.
Representative images were then acquired via light microscopy
(Olympus CKX53, Olympus Corporation).
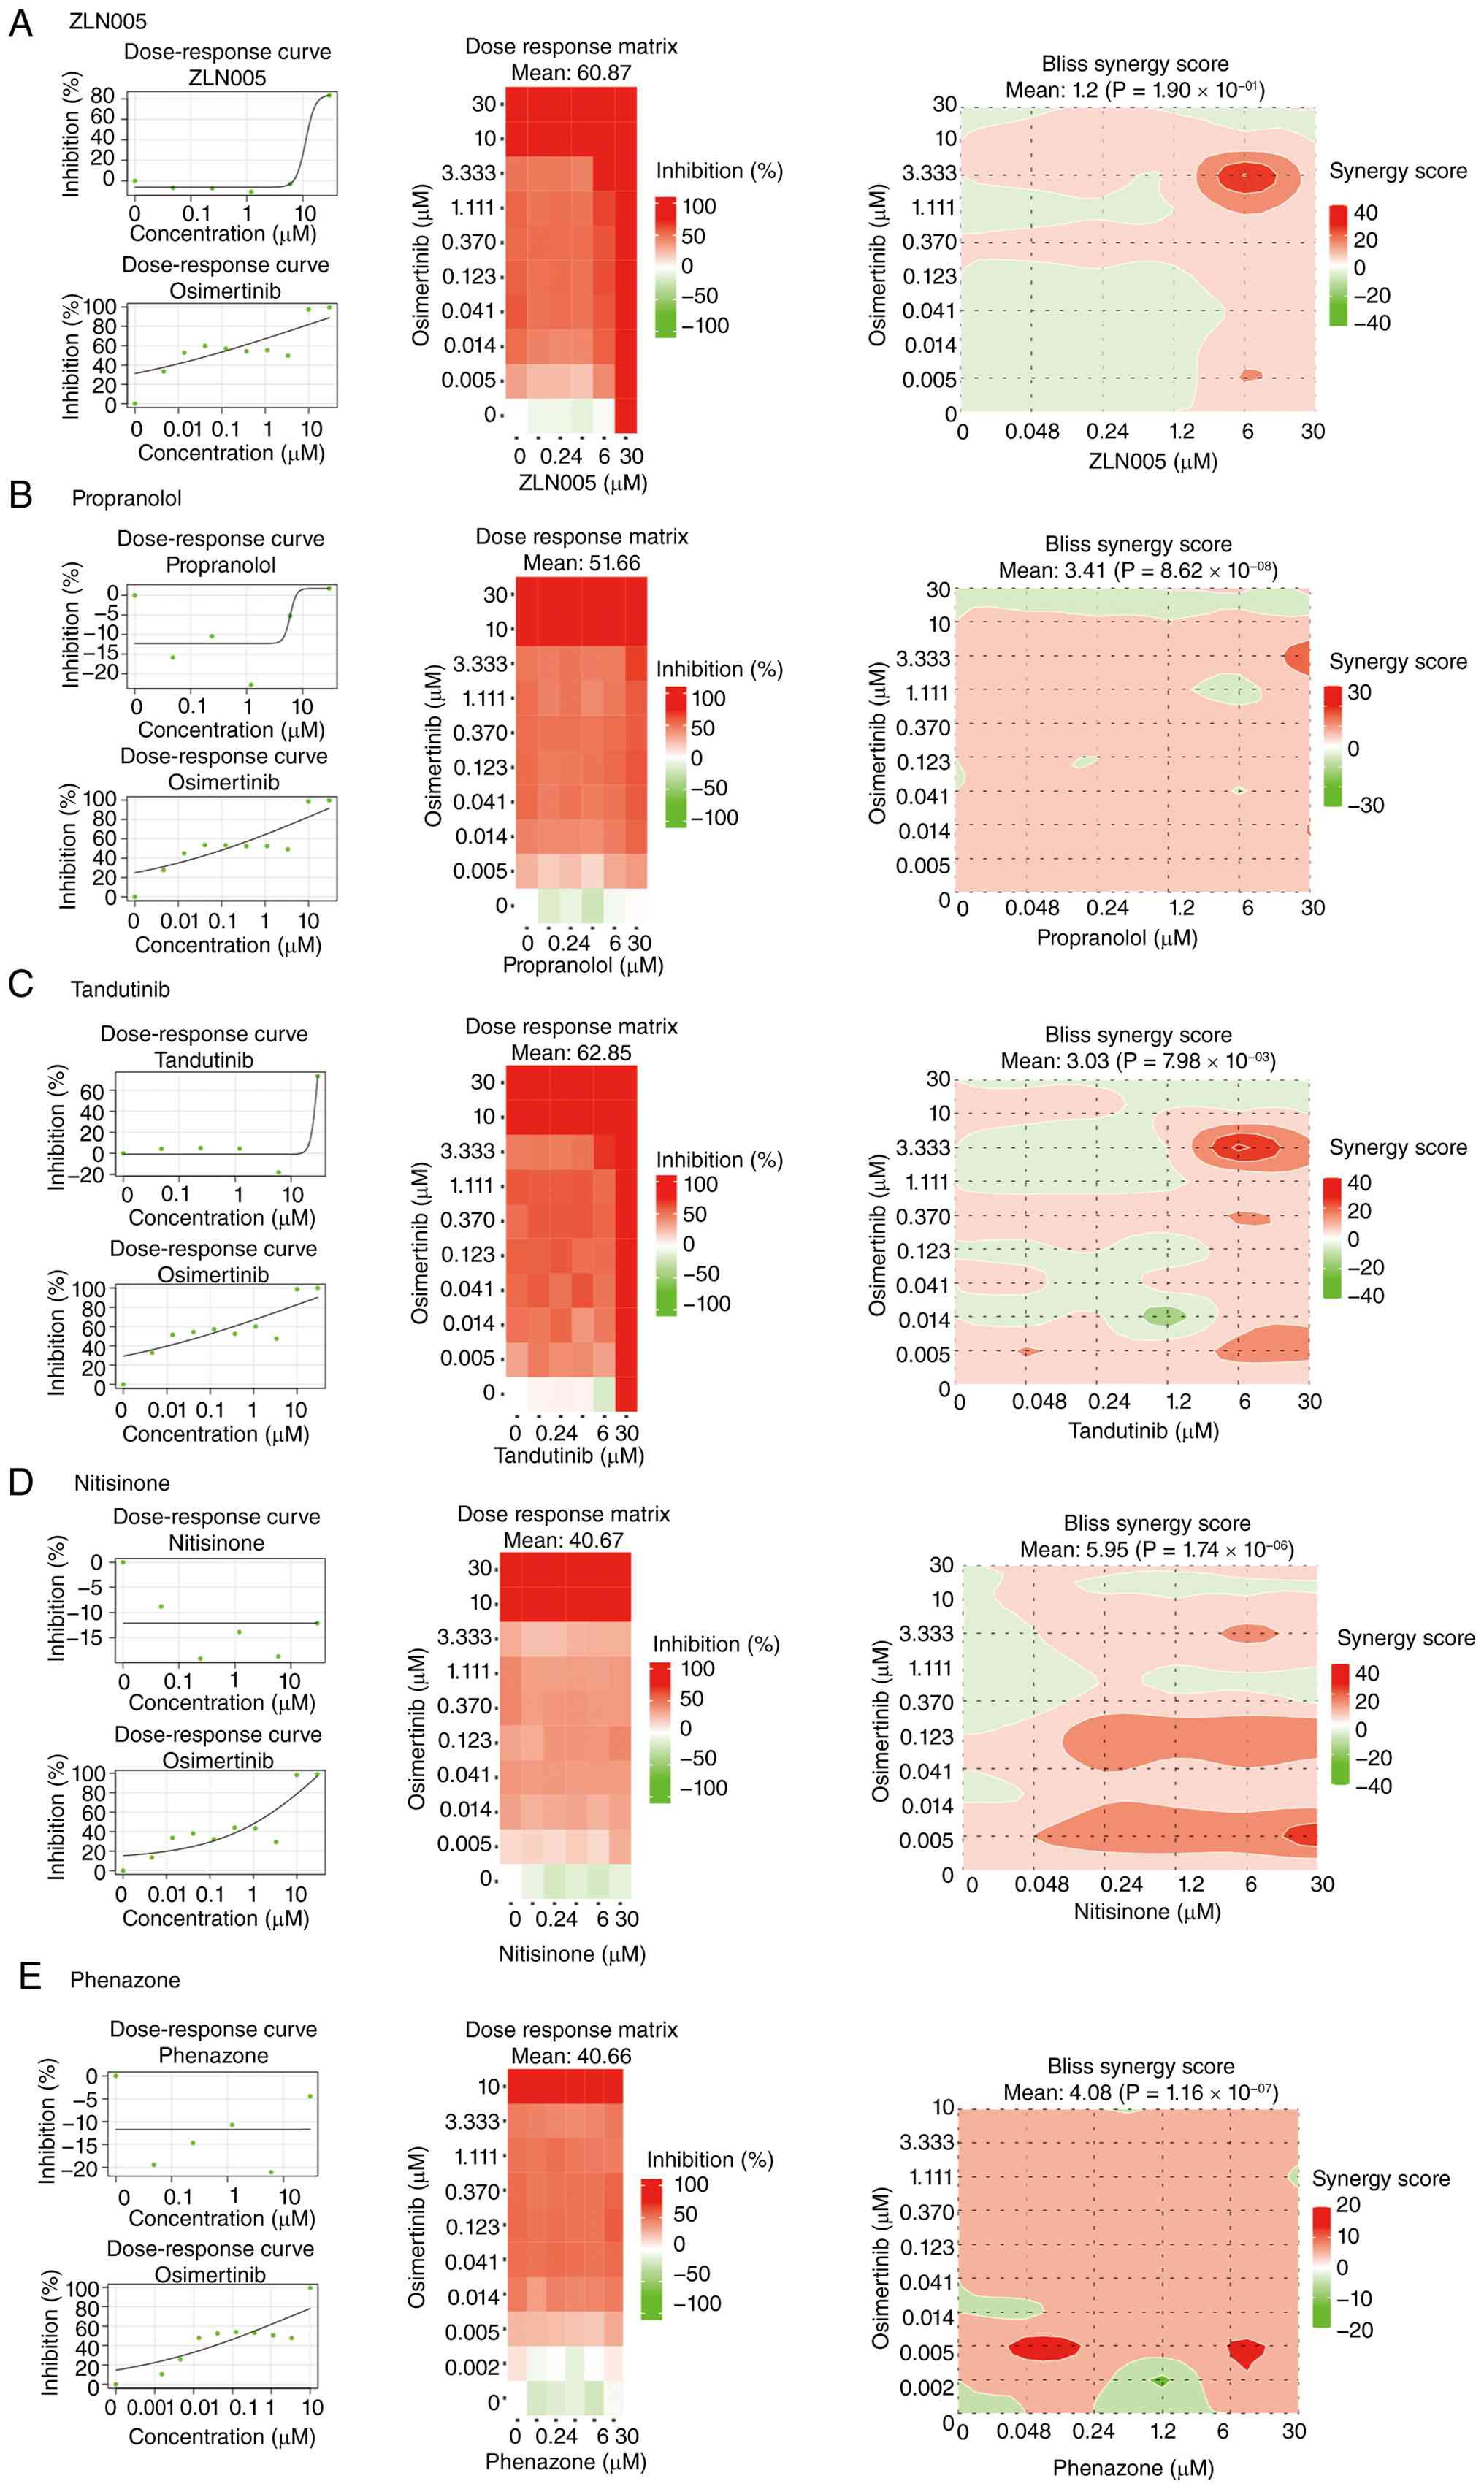
Drug synergy assay
A total of 10,000 PC-9 cells were seeded per well in
a 96-well plate, arranged in six rows and 10 columns. PBS was added
to the outermost wells to reduce edge effects. After 20–24 h, cells
were treated with osmertinib and co-treated with DMSO, ZLN005,
propranolol, tandutinib, nitisinone or phenazone at 37°C in a
humidified incubator with 5% CO2. Osimertinib was
serially diluted from the highest concentration (a top
concentration of 30 µM in combination with ZLN005, propranolol,
tandutinib or nitisinone, or a top concentration of 10 µM in
combination with phenazone) to 0 µM from right to left using a 1;3
dilution ratio, whereas the aforementioned drugs used for
co-treatment were serially diluted from 30 to 0 µM from bottom to
top using a 1;5 dilution ratio. DMSO was used as the vehicle
control, and the final concentration of DMSO in the culture medium
was maintained at 0.1% (v/v) in all experimental conditions. After
48 h of treatment, MTT assays were performed at a single timepoint
and the resulting purple formazan crystals were dissolved in DMSO
and OD values at 595 nm were measured using a microplate reader
(Cytation 3 Cell Imaging Multi-Mode Reader; BioTek Instruments;
Agilent Technologies, Inc.). Cell viability values were normalized
to vehicle control wells, and synergy scores were calculated using
the Bliss independence model implemented in SynergyFinder
(https;//synergyfinder.org/) (39). Drug concentrations used in
mechanistic and validation experiments were selected based on
preliminary dose-response and synergy-optimization analyses, aiming
to preserve robust combination activity while minimizing excessive
single-agent cytotoxicity.
Statistical analysis
Data are presented as the mean ± SD of at least
three independent biological replicates. For comparisons among
multiple groups involving one independent variable, one-way ANOVA
followed by Tukey's multiple-comparisons test was used. For
experiments involving two independent variables, two-way ANOVA was
performed, followed by Tukey's multiple-comparisons test. P<0.05
was considered to indicate a statistically significant difference.
All statistical analyses were performed using GraphPad Prism
software (version 10.4.1; Dotmatics).
Results
Machine-learning identification of a
core gene signature associated with the DTP state
To delineate the molecular basis of the DTP
phenotype, a multi-algorithm machine-learning analysis was
conducted using publicly available RNA-seq datasets of TKI-treated
tumour cells (Table I).
Principal-component analysis of the integrated DTP vs. control
log2(fold-change) matrix showed that independent DTP models were
distributed according to similarities in their global
transcriptional responses across multiple types of cancer and
treatment contexts (Fig. 1A).
Differential-expression analysis identified numerous upregulated
genes in DTP cells [log2(fold-change)>2;
P<1×10⁻¹⁰]; several genes emerged as consistently
elevated across datasets (Fig.
1B). Heatmap visualization demonstrated the consistent
upregulation of these genes across independent cohorts (Fig. 1C), defining a reproducible
transcriptional signature of the TKI-induced persister state.
To assess the reproducibility of these
transcriptomic features across datasets, the present study
performed independent integrated pathway enrichment analyses.
Individual dataset-level enrichment analyses revealed conserved
patterns of metabolic quiescence, oxidative-stress adaptation and
transcriptional reprogramming (Fig.
S1A-C), whereas a combined meta-analysis of all DTP datasets
identified a core set of oxidative-phosphorylation and
stress-response pathways shared across DTP models (Fig. S2A-D). These results validated the
robustness of the dataset integration strategy used in the present
study and provided a mechanistic framework for subsequent
machine-learning-based feature selection.
Subsequently, three complementary machine-learning
algorithms, LASSO, random forest and SVM-RFE, were applied to
identify the most discriminative genes associated with the DTP
state (Fig. 1D). Each method
produced a ranked gene list, and the intersection of the three
models yielded a consensus subset comprising BTG1, ING4 and
Kelch-like protein 24 (KLHL24) (Fig. 1E). These genes showed the highest
feature-importance scores and minimal cross-validation errors,
indicating a strong predictive power for distinguishing DTP cells
from control cells. ROC curve analysis supported the notable
diagnostic accuracy of these genes, with AUC values ranging from
0.96 to 0.99 (Fig. 1F).
Lastly, comparative expression analysis showed that
these genes were markedly and consistently upregulated under DTP
vs. control conditions across multiple datasets, reinforcing the
reproducibility and potential relevance of these findings (Fig. 1G). Taken together, these results
identified a set of robust candidate genes associated with the
TKI-induced persister phenotype, providing a computational
foundation for defining a refined gene signature in subsequent
analyses.
Identified DTP gene signature is
persistently upregulated during the formation and maintenance of
DTP cells
To determine the temporal dynamics of the candidate
genes identified by the machine-learning pipeline in the present
study, publicly available time-course transcriptomic data from
GSE193258 were analysed throughout the course of DTP cell formation
and recovery. This dataset included four EGFR mutant or
TKI-responsive LUAD cell lines (H1975, HCC827, HCC2935 and PC-9),
with samples annotated according to the following sequential
phases; Untreated control, acute TKI exposure, established DTP
state and short and long drug-washout periods.
Heatmap visualisation revealed that the genes
identified by the three machine-learning algorithms (LASSO, random
forest and SVM-RFE) were rapidly and co-ordinately upregulated upon
acute TKI treatment; this high expression was maintained during the
DTP stage and remained partially elevated even after drug removal
(Fig. 2A). This pattern was
reproducible across all four cell lines, indicating that these
genes participated in a conserved stress-adaptive transcriptional
program rather than a transient response.
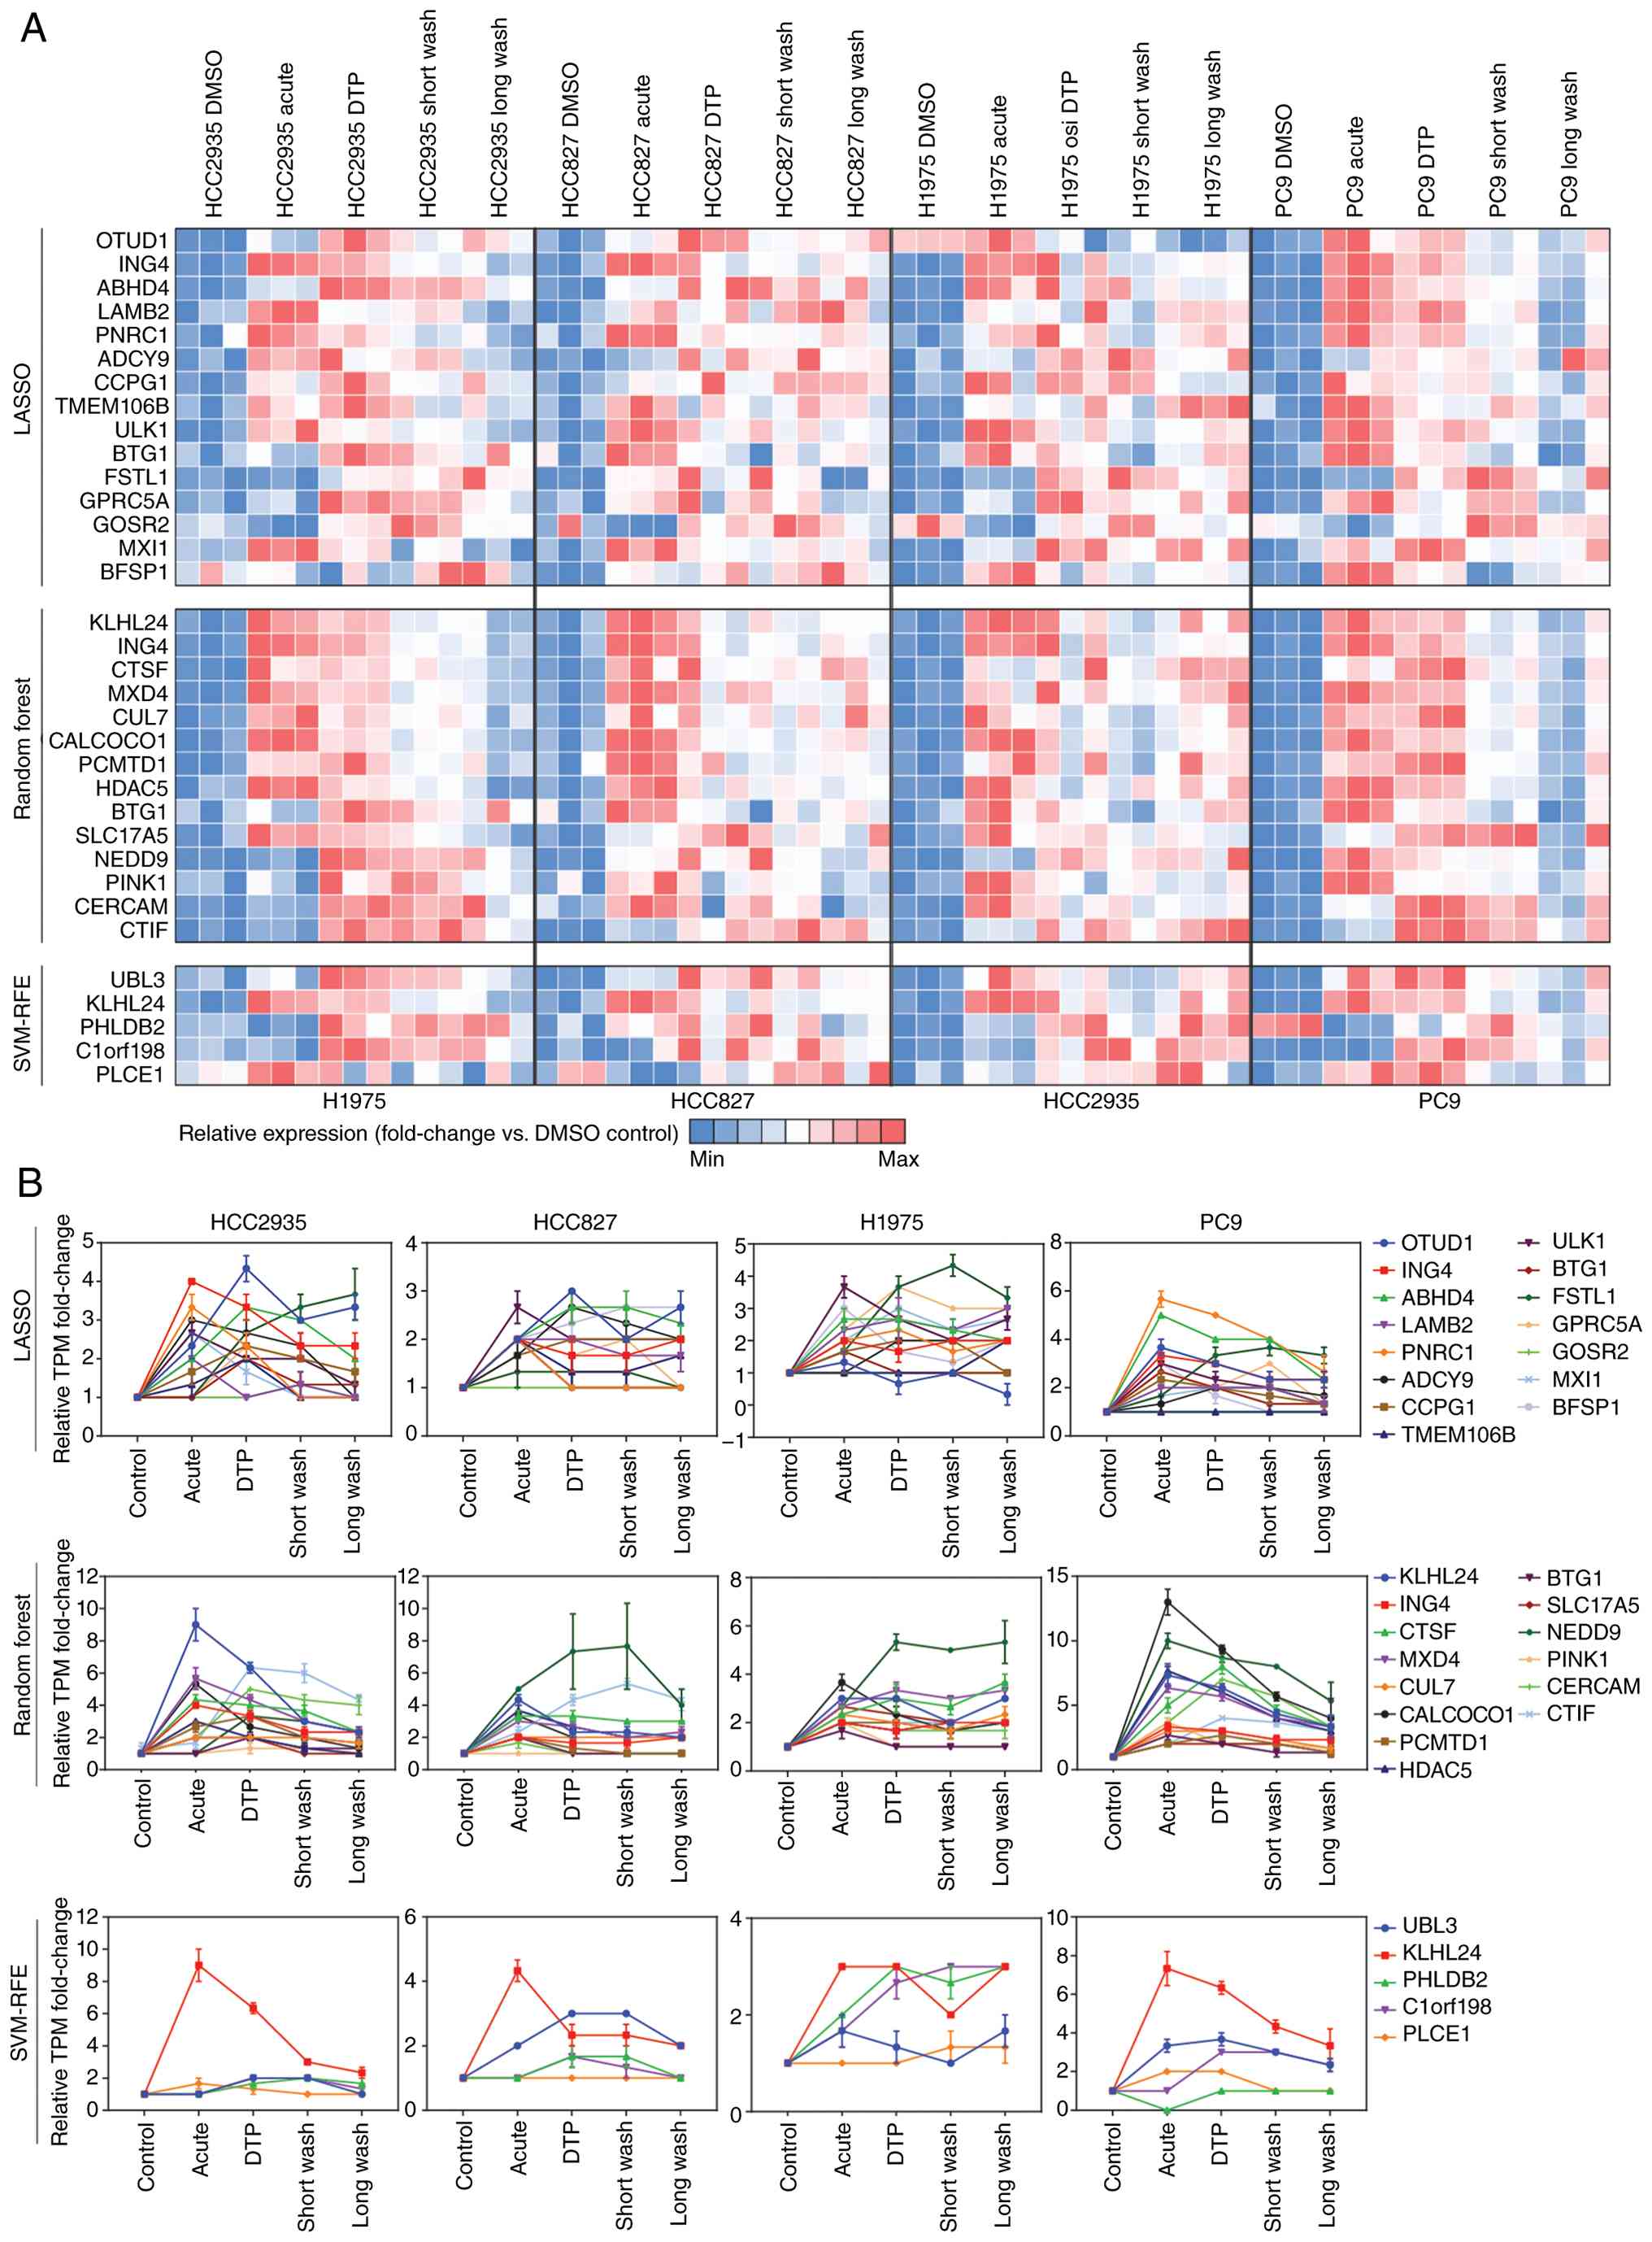 | Figure 2.Identified DTP gene signature is
persistently upregulated during the development and maintenance of
DTP cells. (A) Heatmaps showing the expression dynamics of
candidate genes identified by LASSO, random forest and SVM-RFE
analyses across four lung adenocarcinoma cell lines (H1975, HCC827,
HCC2935 and PC-9). Samples were collected at five stages of DTP
cell formation and recover; Control (DMSO), acute TKI treatment,
established DTP state and short- and long-washout phases. Red
indicates higher gene expression whereas blue indicates lower
expression (scaled TPM). (B) Line-plot representation of
gene-expression trajectories for top-ranked genes from each
machine-learning algorithm. Genes such as BTG1, ING4, KLHL24
and CALCOCO1 exhibited rapid upregulation upon TKI exposure
and a gradual decrease in expression throughout the DTP and washout
stages. Data represent mean ± SD from three biological replicates.
DTP, drug-tolerant persister; LASSO, least absolute shrinkage and
selection operator; SVM-RFE, support vector machine-recursive
feature elimination; BTG1, B-cell translocation gene 1; ING4,
inhibitor of growth family member 4; CALCOCO1, calcium-binding and
coiled-coil domain-containing protein 1; KLHL24, Kelch-like protein
24; TKI, tyrosine kinase inhibitor; TPM, transcripts per million.
SD, standard deviation. |
Quantitative expression profiling further supported
the persistent induction of BTG1, ING4, CALCOCO1, PNRC1 and
several other top-ranked genes in DTP cell formation across cell
lines (Fig. 2B). Notably, the
expression of these genes was induced during acute TKI exposure
and/or the established DTP state, and declined gradually upon
long-term drug withdrawal, suggesting their involvement in the
formation and maintenance of the persister phenotype. Collectively,
these results demonstrated that the transcriptional signature
identified by the multi-algorithm approach in the present study was
not only predictive of DTP identity but also dynamically engaged in
the establishment and maintenance of TKI tolerance.
A four-transcription-factor signature
defines the core transcriptional program of DTP cells
To refine the DTP-associated gene set and identify
key regulatory components, the present study integrated results
from multiple computational analyses. Differential gene-expression
profiling of DTP and control samples revealed a distinct
DTP-associated transcriptional landscape, with a subset of genes
showing notable and consistent upregulation across datasets
(Fig. 3A). By intersecting three
analytical approaches, including machine-learning analyses (LASSO,
random forest and SVM-RFE), individual-group differential analyses
and log2(fold-change) normalization, the present study
obtained a consensus set of 10 genes (Fig. 3B). For functional annotation and
subsequent signature refinement, these 10 consensus genes were
analysed together with BTG1, which was retained as a
machine-learning-prioritized gene supported by the preceding
expression analyses, resulting in 11 prioritized genes shown in
Fig. 3C. Functional annotation
clustered these genes into three biological categories; i) Protein
stability and post-translational modification, including
KLHL24, OTU domain-containing protein 1 and cathepsin F; ii)
signalling regulation, such as neural precursor cell expressed
developmentally downregulated protein 9 and follistatin-related
protein 1; and iii) transcriptional control, for example BTG1,
ING4, PNRC1 and CALCOCO1 (Fig. 3C).
![A four-transcription-factor signature
defines the core transcriptional program of DTP cells. (A) Heatmap
showing differential gene expression [log2(fold-change)]
between DTP and control samples across datasets, highlighting
persistently upregulated genes. (B) Venn diagram integrating three
analytical strategies (machine-learning analysis, individual-group
analysis and normalised fold-change filtering) to identify a
10-gene consensus set. (C) Functional classification of the 11
prioritized genes, including the 10-gene consensus set and BTG1,
into three modules; i) Protein stability and post-translational
modification; ii) signalling pathways; and iii) transcriptional
regulation. (D) Receiver-operating characteristic curves
demonstrating high predictive accuracy for BTG1, ING4, PNRC1
and CALCOCO1 for the DTP state. (E) Validation of
differential DTP-signature gene expression at different stages of
drug exposure in four lung adenocarcinoma cell lines (HCC2935,
HCC827, H1975 and PC-9) treated with osimertinib, showing notable
upregulation of signature genes during DTP formation and washout
phases. (F and G) Independent datasets showing similar trends of
transcriptional induction of the four-gene signature in cells
treated with gefitinib, dabrafenib, trametinib or ARS-1620,
indicating a conserved TKI-induced response. (H) Heatmap validation
of signature gene expression across additional TKI-treated cell
lines (H23 and H358). Data represent mean ± SD of biological
replicates. DTP, drug-tolerant persister; SD, standard deviation.
ING4, inhibitor of growth family member 4; CALCOCO1,
calcium-binding and coiled-coil domain-containing protein 1; PNRC1,
proline-rich nuclear receptor coactivator 1.](/article_images/mmr/34/5/mmr-34-05-14017-g02.jpg) | Figure 3.A four-transcription-factor signature
defines the core transcriptional program of DTP cells. (A) Heatmap
showing differential gene expression [log2(fold-change)]
between DTP and control samples across datasets, highlighting
persistently upregulated genes. (B) Venn diagram integrating three
analytical strategies (machine-learning analysis, individual-group
analysis and normalised fold-change filtering) to identify a
10-gene consensus set. (C) Functional classification of the 11
prioritized genes, including the 10-gene consensus set and BTG1,
into three modules; i) Protein stability and post-translational
modification; ii) signalling pathways; and iii) transcriptional
regulation. (D) Receiver-operating characteristic curves
demonstrating high predictive accuracy for BTG1, ING4, PNRC1
and CALCOCO1 for the DTP state. (E) Validation of
differential DTP-signature gene expression at different stages of
drug exposure in four lung adenocarcinoma cell lines (HCC2935,
HCC827, H1975 and PC-9) treated with osimertinib, showing notable
upregulation of signature genes during DTP formation and washout
phases. (F and G) Independent datasets showing similar trends of
transcriptional induction of the four-gene signature in cells
treated with gefitinib, dabrafenib, trametinib or ARS-1620,
indicating a conserved TKI-induced response. (H) Heatmap validation
of signature gene expression across additional TKI-treated cell
lines (H23 and H358). Data represent mean ± SD of biological
replicates. DTP, drug-tolerant persister; SD, standard deviation.
ING4, inhibitor of growth family member 4; CALCOCO1,
calcium-binding and coiled-coil domain-containing protein 1; PNRC1,
proline-rich nuclear receptor coactivator 1. |
Among these genes, four transcription factors,
BTG1, ING4, PNRC1 and CALCOCO1, emerged as central
and reproducible regulators of the DTP state, as these genes were
consistently enriched across multiple datasets and exhibited the
highest discriminative power for the DTP phenotype. ROC curve
analysis supported the strong predictive performance of this
four-gene signature, with AUC values ranging from 0.96 to 0.99
(Fig. 3D).
Subsequently, the present study validated the
expression of these four genes in DTP cells using multiple
independent datasets from TKI-treated cell lines. In LUAD models
(HCC2935, HCC827, H1975 and PC-9 cells) exposed to osimertinib, the
expression of BTG1, ING4, PNRC1 and CALCOCO1 was
rapidly induced during acute drug exposure and remained notably
elevated during the DTP and short-washout phases (Fig. 3E). Consistent upregulation of these
genes was also observed in other cancer types treated with
different TKIs, including gefitinib in PC-9 cells and dabrafenib in
the SKMEL28 melanoma cell line (Fig.
3F) This expression pattern was further examined in NCI-H358
cells treated with the KRAS G12C inhibitor ARS-1620 or the MEK
inhibitor trametinib, both of which target the RTK/RAS/MAPK
signalling axis (Fig. 3G). In an
additional dataset involving prolonged treatment of H23 and H358
cells with the KRAS G12C mutation inhibitor AMG510, ING4, PNRC1 and
CALCOCO1 showed a similar induction pattern, whereas BTG1 was
reduced, indicating context-dependent regulation of individual
genes within the four-gene signature (Fig. 3H). Collectively, these results
indicated that BTG1, ING4, PNRC1 and CALCOCO1 were conserved
transcriptional signatures that defined the TKI-induced persister
state, functioning as coordinated regulators that sustained
cellular survival under targeted therapy.
Functional validation of the four-gene
signature in mediating the osimertinib-induced DTP state
To validate the expression of the four transcription
factors (BTG1, ING4, PNRC1 and CALCOCO1) identified
as the core DTP signature, the present study examined their
transcriptional response to the third-generation EGFR-TKI
osimertinib in two EGFR-mutant LUAD cell lines (PC-9 and HCC827).
RT-qPCR analysis revealed that all four genes were rapidly and
robustly upregulated following osimertinib treatment in a
time-dependent manner (Fig. 4A and
B). The expression levels of these genes increased markedly
within 24 h and remained elevated at 72 h under both 1 and 2 µM
osimertinib concentrations, and demonstrated a dose-independent but
sustained activation pattern. These results were consistent with
the computational prediction that these genes acted as early
responders and transcriptional regulators in the DTP program.
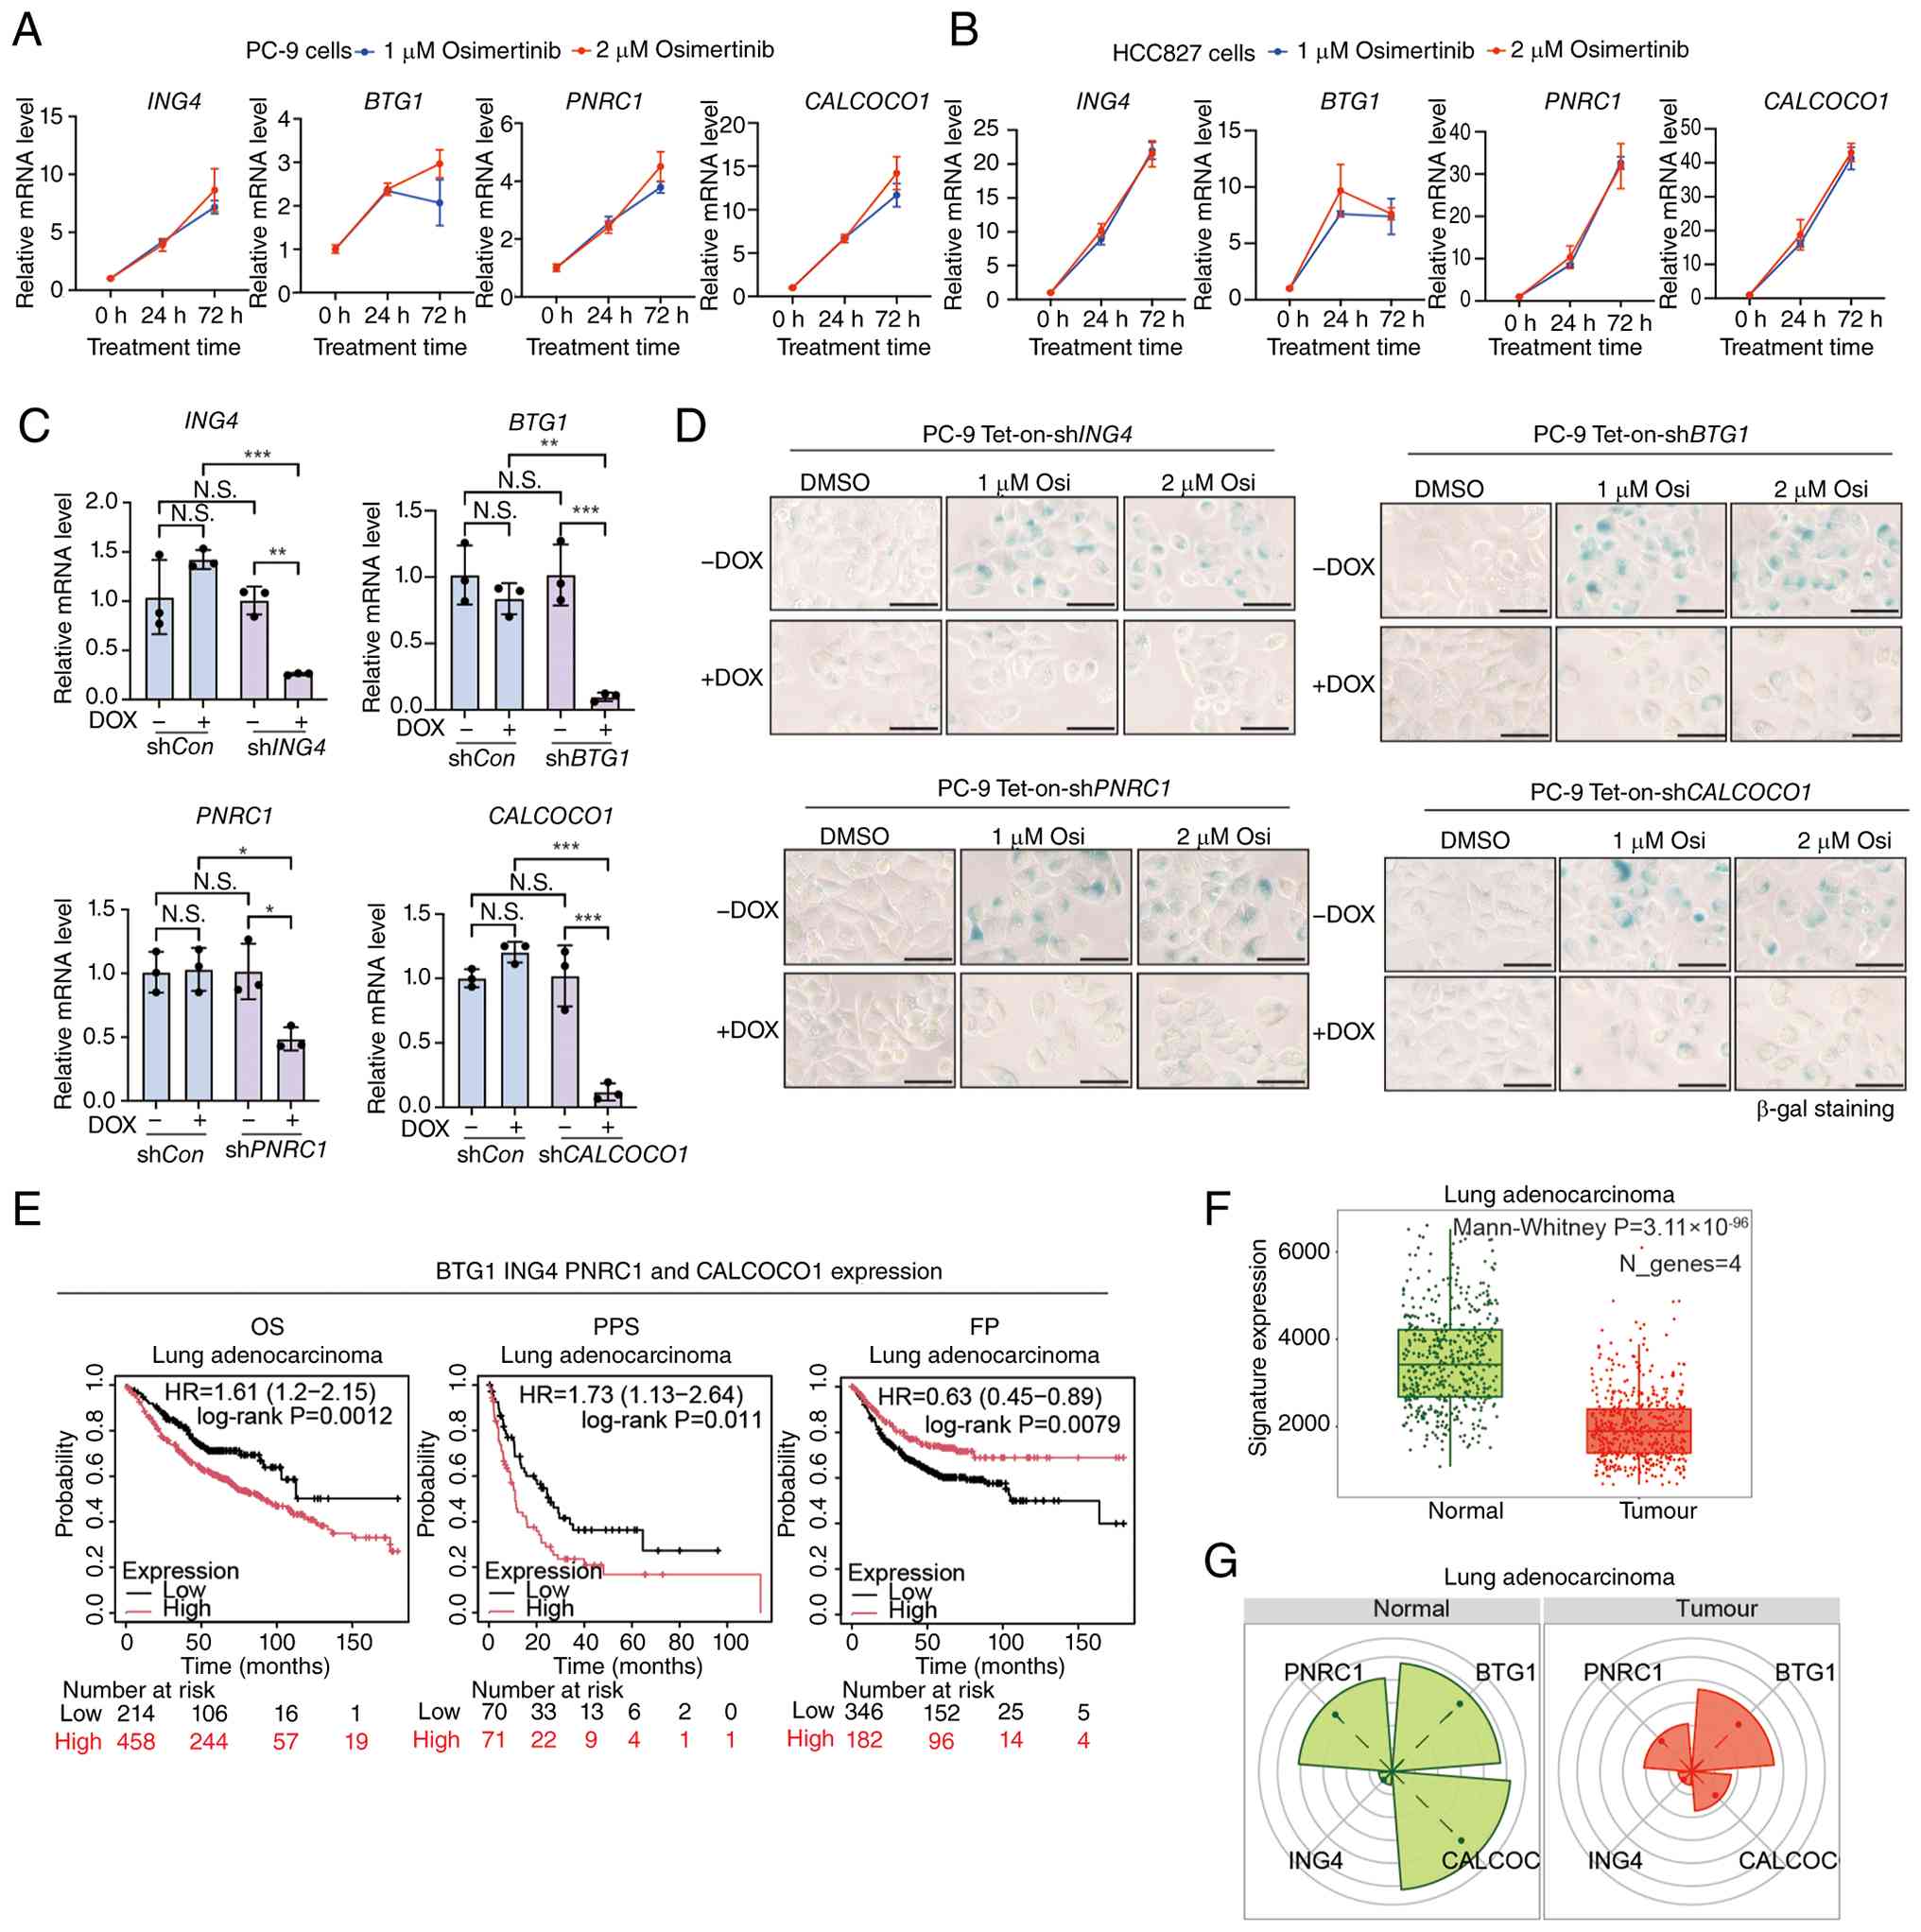 | Figure 4.Four-gene signature is upregulated in
osimertinib-treated lung adenocarcinoma cells and associates with
poor prognosis. (A) RT-qPCR analysis of ING4, BTG1, PNRC1
and CALCOCO1 expression in PC-9 cells treated with 1 or 2 µM
osimertinib for 24 and 72 h. (B) RT-qPCR validation in HCC827 cells
treated with 1 or 2 µM osimertinib for 24 and 72 h, showing
consistent upregulation of all four genes. (C) RT-qPCR analysis of
ING4, BTG1, PNRC1 and CALCOCO1 mRNA levels following
doxycycline-inducible Tet-on knockdown in PC-9 cells. Inducible
non-targeting shCon cells with and without doxycycline
treatment were included as controls. Doxycycline-induced expression
of the corresponding short hairpin RNA sequences resulted in
efficient target-gene knockdown, whereas doxycycline treatment
alone did not significantly alter gene expression in shCon
cells. Statistical significance was determined by two-way ANOVA
followed by Tukey's multiple-comparisons test. *P<0.05,
**P<0.01 and ***P<0.001. N.S., Not significant. (D)
Senescence-associated β-gal staining of PC-9 cells after knockdown
of DTP-signature genes followed by osimertinib treatment for 72 h.
β-gal-positive cells were characterised as DTP cells. Scale bar, 50
µm. (E) Kaplan-Meier survival analysis of patients with lung
adenocarcinoma in the TCGA cohort stratified by high vs. low
expression of the four-gene signature. High expression was
associated with significantly shorter OS, reduced PPS and shorter
FP intervals. (F) Boxplot comparison showing lower basal expression
of the four-gene signature in tumour vs. normal lung tissue. (G)
Radar plots illustrating differential expression profiles of
BTG1, ING4, PNRC1 and CALCOCO1 between normal and
tumour samples. Data represent mean ± SD from ≥3 biological
replicates. β-gal, beta-galactosidase; OS, overall survival; PPS,
post-progression survival; FP, first progression; SD, standard
deviation, ING4, inhibitor of growth family member 4; CALCOCO1,
calcium-binding and coiled-coil domain-containing protein 1; PNRC1,
proline-rich nuclear receptor coactivator 1, BTG1, B-cell
translocation gene 1. |
To directly test whether these genes were
functionally required for the establishment of the DTP state, the
present study knocked down these signature genes in PC-9 cells via
a doxycycline-induced Tet-on shRNA system targeting each of the
four genes. RT-qPCR confirmed the efficient knockdown of each
target gene (Fig. 4C).
Subsequently, the present study assessed the results of staining
with β-gal, a widely used surrogate marker for DTP cells, in
shRNA-treated cells after 72-h osimertinib treatments. As shown in
Fig. 4D, knockdown of any of the
four genes markedly reduced the proportion of β-gal-positive cells
compared with control cells, indicating that all four genes were
necessary for osimertinib-induced persister cell formation.
Collectively, these results supported the causal role of the
BTG1/ING4/PNRC1/CALCOCO1 gene signature
in mediating the DTP phenotype.
Clinical relevance and robustness of
the four-gene signature across independent cohorts
To assess the clinical relevance of this four-gene
signature, the present study analysed survival data using the
Kaplan-Meier plotter TCGA-LUAD cohort. Patients with a high
combined expression of BTG1, ING4, PNRC1 and CALCOCO1
exhibited significantly poorer OS (HR, 1.61; P=0.0012) and PPS (HR,
1.73; P=0.0110) than those with low expression (Fig. 4E). Notably, the high-expression
group also showed a shorter FP interval (HR, 0.63; P=0.0079) than
the low-expression group, indicating earlier disease relapse and
supporting the adverse prognostic role of the four-gene signature
in LUAD. In parallel, comparative expression analysis showed that
the expression of the overall four-gene signature was significantly
lower in tumour tissues than in normal lung tissues
(P=3.11×10−96) (Fig.
4F), suggesting that the marked induction of this signature may
be context-dependent and preferentially triggered under therapeutic
stress. Radar-plot analysis further showed that basal expression of
the four-gene signature was lower in LUAD tumour tissues than in
normal lung tissues (Fig. 4G).
Together with the TKI-treated cell-line analyses described above,
these findings suggest that this signature is not constitutively
activated in untreated tumour tissue, but may be induced under
therapeutic stress during DTP formation.
To further strengthen the clinical applicability of
the DTP-associated gene signature, the present study analysed the
TCGA-LUAD cohort using a weighted four-gene score. In this
independent cohort, patients with a high signature score
demonstrated significantly poorer OS (log-rank P=0.030; HR, 1.39;
95% CI, 1.03–1.86) compared with patients with a low signature
score (Fig. S3A). In the results
of the Cox regression analyses, the weighted signature score
remained associated with poorer survival and retained prognostic
value after adjusting for age and stage group, whereas advanced
stage was the strongest clinicopathological predictor (Fig. S3B and C). Notably, the weighted
signature score showed no significant correlation with age and no
significant difference between the early- and advanced-stage groups
(Fig. S3D and E), indicating that
the prognostic effect of this signature was not simply driven by
these baseline variables. Subgroup and interaction analyses further
supported the stability of this association, with no significant
interaction with age or stage (Fig.
S3F).
Additional clinicopathological analyses of TCGA-LUAD
further supported the robustness of the four-gene signature.
Individual genes did not consistently outperform the combined
signature score (Fig. S4A),
supporting the use of the integrated signature rather than any
single component alone. Furthermore, the weighted signature score
was not significantly associated with detailed American Joint
Committee on Cancer (AJCC) stage, pathological tumour (T) category
according to the AJCC tumour-node-metastasis (TNM) staging system
(Ref), sex or smoking exposure (Fig.
S4B-E), Using the optimal cut-off, patients with a high
weighted signature score showed significantly poorer OS than those
with a low score (HR, 1.44; P=0.018) (Fig. S4F). Stage-stratified analyses
showed a similar adverse trend associated with high signature
expression in both early- and advanced-stage subgroups, although
statistical significance was limited in these smaller subsets
(Fig. S4G and H). Analysis of
pathological nodal (N) and metastatic (M) categories showed that
advanced nodal involvement and metastatic disease were associated
with poorer OS compared with the corresponding reference groups
(Fig. S4I) The time-varying
coefficient analysis did not suggest a major violation of the
proportional hazards assumption (Fig.
S4J).
Lastly, external validation using Kaplan-Meier
plotter-based public datasets demonstrated that the adverse
prognostic effect of the four-gene signature was reproducible in
several clinically relevant subgroups, including male patients,
smokers and patients with stage I–III disease (Fig. S5). Collectively, these results
indicated that the
BTG1/ING4/PNRC1/CALCOCO1 signature was
rapidly induced by osimertinib, captured a clinically relevant
adaptive transcriptional state and provided prognostic information
beyond conventional clinicopathological variables in LUAD.
In silico drug screening identifies
compounds selectively effective in cells with high expression of
the four-gene signature
Given that high expression of the four-gene DTP
signature (BTG1, ING4, PNRC1 and CALCOCO1) was
associated with poor prognosis in patients with LUAD, the present
study sought to identify therapeutic compounds that could
selectively target this transcriptional phenotype. Using the DepMap
PRISM drug-sensitivity database, the transcriptomic and
pharmacological profiles of 50 LUAD and 50 breast carcinoma cell
lines were ranked by the expression levels of the four-gene
signature and compared.
Heatmap visualisation demonstrated distinct
transcriptional clustering between the high- and low-expression
groups in both cancer types, providing evidence that this signature
stratified the cell lines according to their transcriptional state
(Fig. 5A). Correlation analysis of
gene-signature expression revealed a strong concordance between
models with high and low expression of the four-gene set in the
DepMap-derived datasets, with these genes forming a distinct,
tightly correlated cluster that was clearly separated from the
other transcripts (Fig. 5B).
Notably, lung cancer cell lines exhibiting high expression of the
four-gene signature displayed increased metastatic potential in the
MetMap 500 dataset, particularly in lung, liver, kidney and brain
tissues (Fig. 5C), suggesting that
this transcriptional program may have also associated with
aggressive phenotypes.
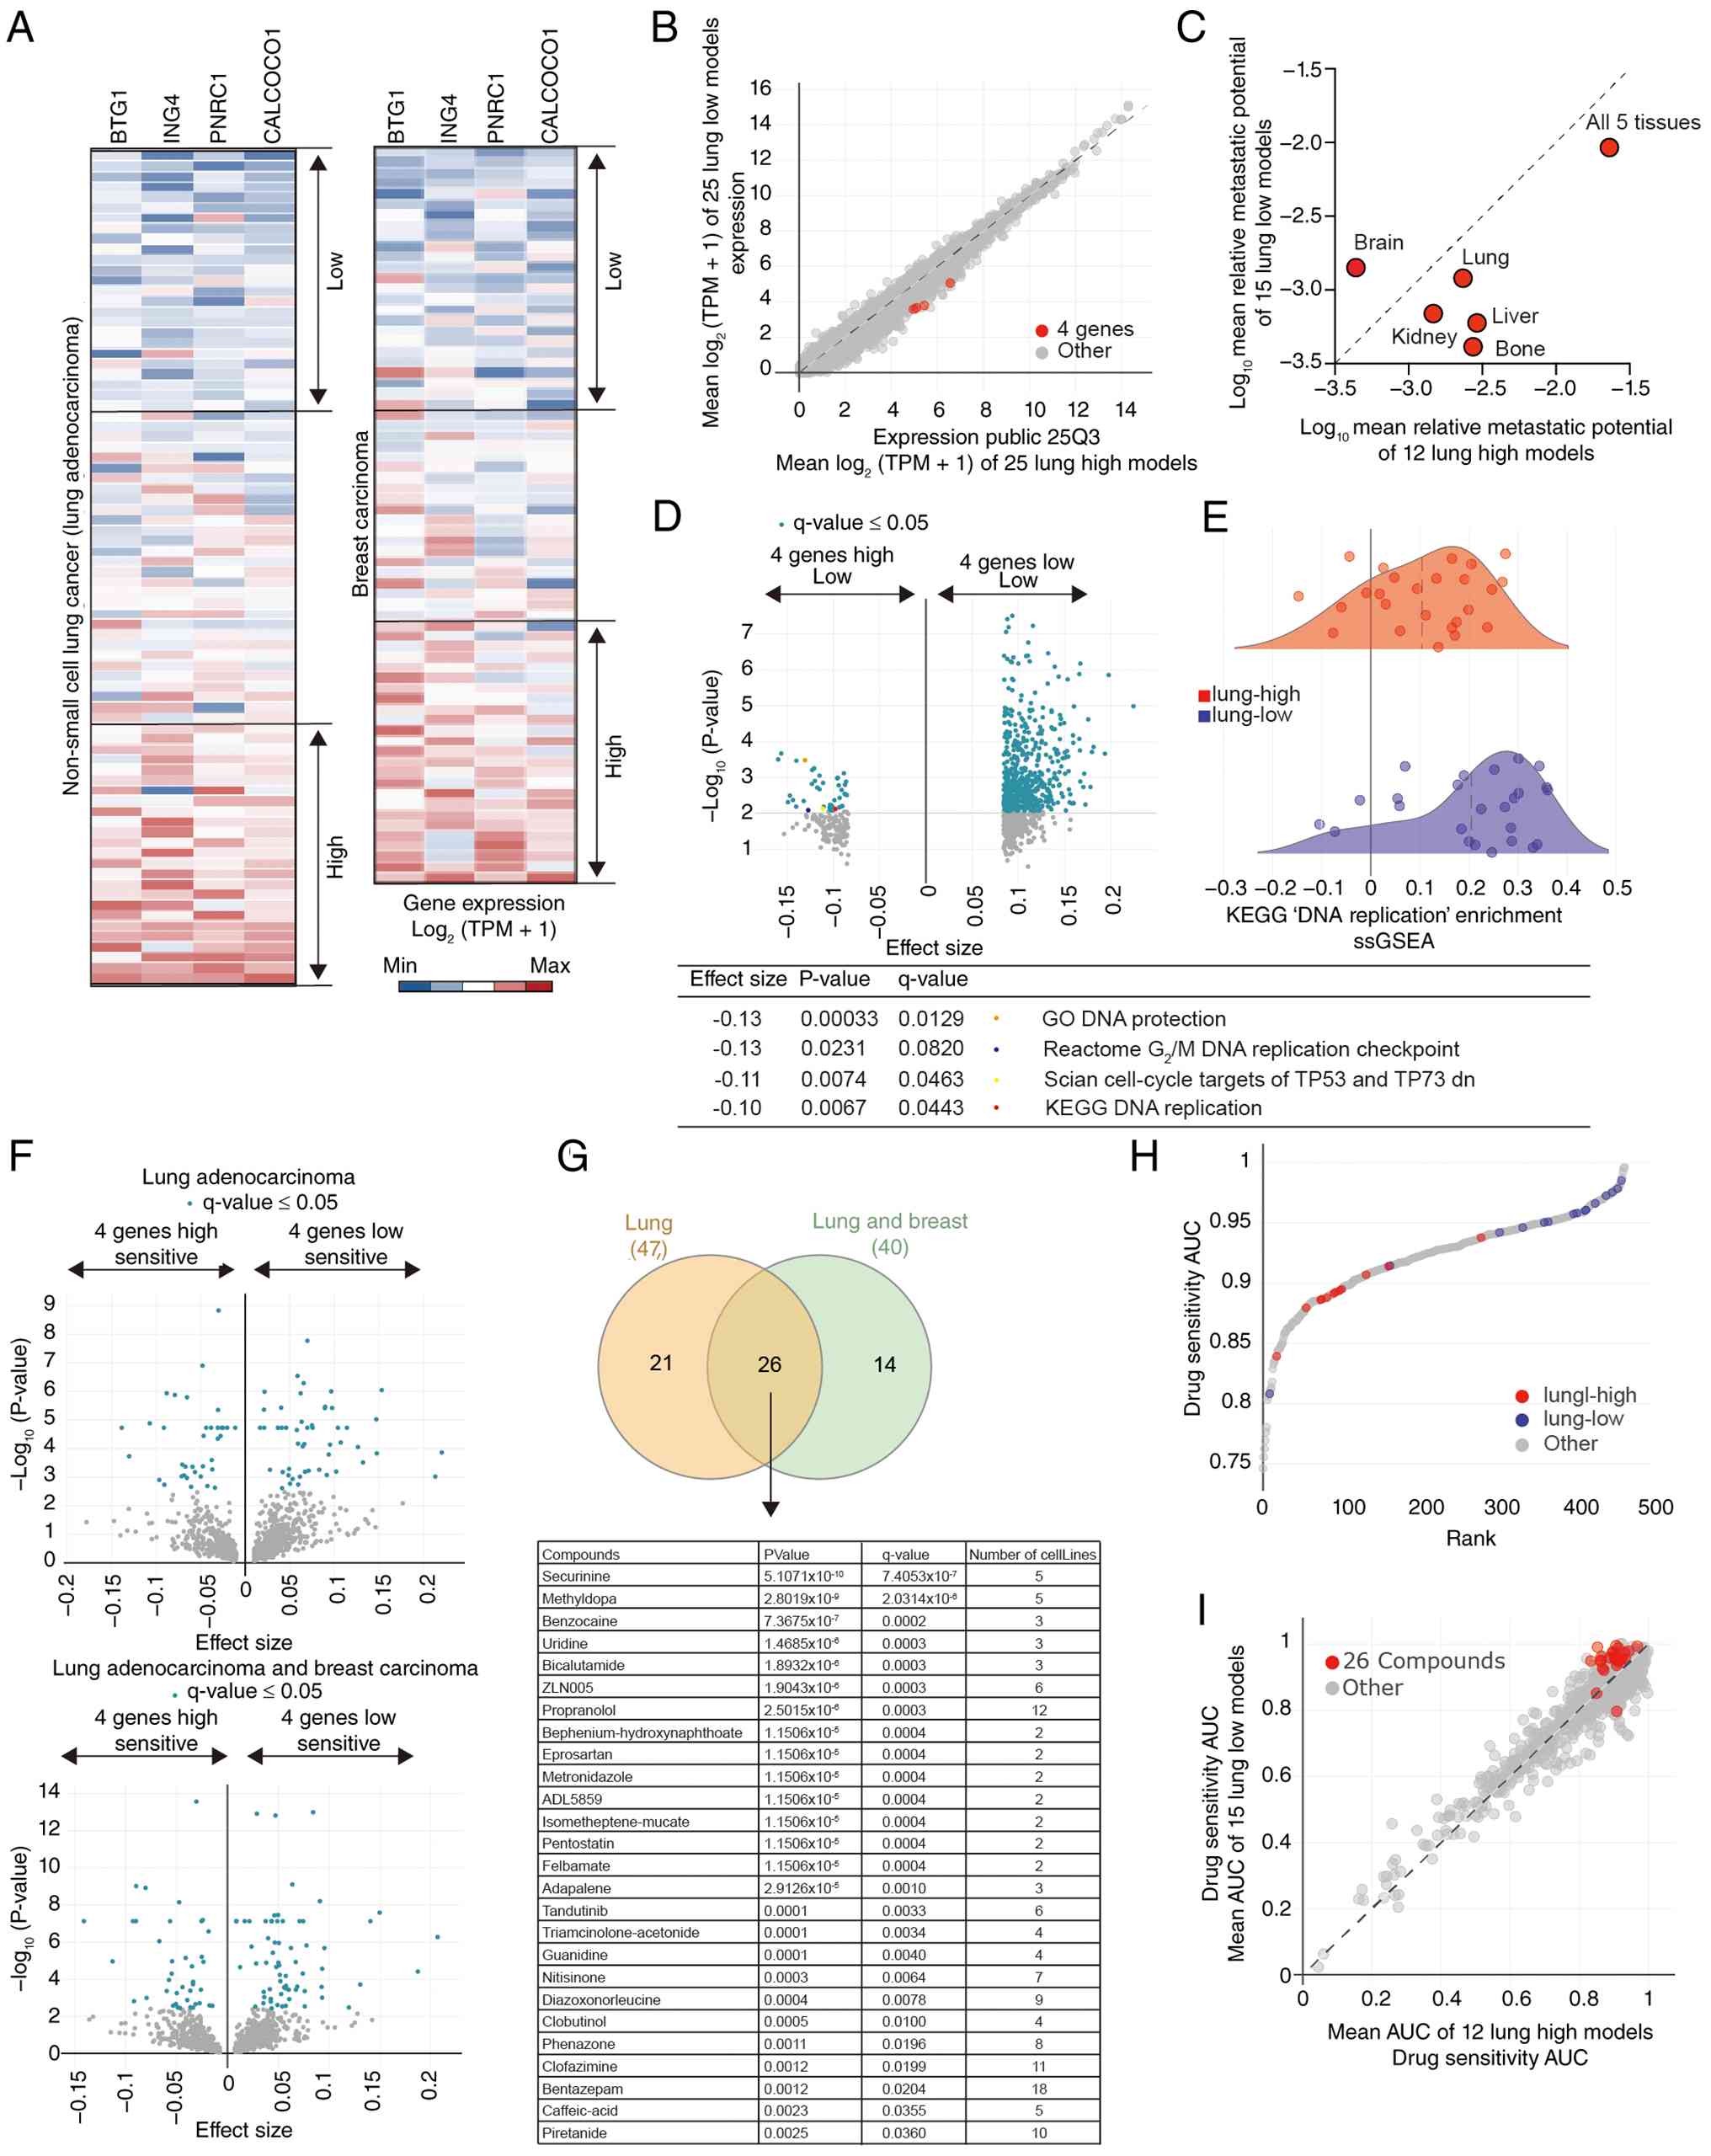 | Figure 5.In silico drug screening
identifies compounds that are selectively effective in cells with
high expression of the four-gene signature. (A) Heatmaps of the
expression levels of BTG1, ING4, PNRC1 and CALCOCO1
in high- and low-expression subgroups across non-small cell lung
cancer (left) and breast carcinoma (right) cell lines from the
Cancer Dependency Map database. (B) Correlation of mean
gene-signature expression between the top 25 ‘lung-high’ and
‘lung-low’ models from the Public 25Q3 dataset (Q3 2025 public
release), showing consistent clustering of the four genes across
datasets. (C) Comparison of metastatic potential among lung-high
vs. lung-low cell lines across organ-specific metastasis models
using data from the MetMap 500 dataset. (D and E) Differential
pathway enrichment analysis (based on the Public 24Q2 dataset, that
is, the public data release from Q2 2024) highlighting significant
enrichment of DNA replication and G2/M checkpoint
pathways in lung-high cell lines. (F) Volcano plots of drug
sensitivity AUC-value differences between high and low
signature-expression groups in lung (top) and lung and breast
combined (bottom) datasets. (G) Venn diagram showing 26 overlapping
compounds with selective sensitivity in both lung and breast
cancer; table lists representative hits including securinine,
metformin and ZLN005. (H) Drug-sensitivity ranking plot
illustrating enhanced sensitivity of four-gene-high models to the
identified 26 compounds. (I) Correlation of Profiling Relative
Inhibition Simultaneously in Mixtures repurposing secondary screen
results providing evidence that the 26 compounds (highlighted in
red) were more effective in four-gene-high cell lines than other
compounds. ING4, inhibitor of growth family member 4; CALCOCO1,
calcium-binding and coiled-coil domain-containing protein 1; PNRC1,
proline-rich nuclear receptor coactivator 1, BTG1, B-cell
translocation gene 1; AUC, area under the curve. |
Single-sample GSEA further revealed that DNA
replication-, G2/M checkpoint- and cell cycle-associated
pathways showed relatively higher enrichment in four-gene
low-expression models, whereas high-expression models displayed
relative reduction of these proliferative programs (Fig. 5D and E). These results indicated
that high-expression cells sustained a proliferative yet
stress-tolerant transcriptional state, which may have rendered them
particularly vulnerable to targeted therapeutic perturbations.
The present study subsequently performed a
computational drug sensitivity comparison between the top 25
four-gene high and four-gene low cell lines in both lung and breast
cancer datasets. Volcano plots highlighted a distinct subset of
compounds that displayed significantly lower AUC values in cell
lines with high signature expression compared with those with low
signature expression, which was indicative of higher drug
sensitivity in the high signature-expression groups (Fig. 5F). Cross-cancer integration of the
lung and breast datasets identified 26 overlapping compounds that
consistently exhibited selective toxicity toward the four gene-high
models (Fig. 5G). Notably, these
compounds included several metabolic and stress-modulating agents,
such as securinine, a γ-aminobutyric acid type A (GABA-A) receptor
antagonist, propranolol, a β-adrenergic receptor blocker, and
ZLN005, a PGC-1α activator.
Drug sensitivity ranking provided evidence that
these 26 candidate drugs demonstrated markedly enhanced efficacy in
the high-expression subgroup compared with the low-expression or
unrelated models (Fig. 5H and I).
Together, these analyses identified a distinct set of
pharmacological agents predicted to preferentially target tumour
cells characterized by elevated BTG1, ING4, PNRC1 and
CALCOCO1 expression, providing a rational framework for
combination treatment strategies against TKI-induced persister
cells.
ZLN005 synergizes with osimertinib to
induce cytotoxicity in LUAD cells
To experimentally validate the computational
predictions, 11 compounds were selected from the in silico
screen (Table III, chemical
structures and drug characteristics are referenced therein) and
their combinatorial effects with osimertinib in EGFR-mutant PC-9
LUAD cells were evaluated. Drug synergy was quantified using the
Bliss independence model based on cell viability assays across
multiple concentration gradients for each compound and
osimertinib.
Among the tested candidates, five compounds
exhibited positive synergy scores; ZLN005, propranolol, tandutinib,
nitisinone and phenazone (mean Bliss score >0; Fig. 6A-E). These results suggested
potential positive interactions with osimertinib, although the
magnitude of overall growth inhibition and the statistical support
for Bliss synergy varied among compounds. ZLN005 and tandutinib
produced the strongest overall combinatorial effects, achieving
mean inhibition rates of 60.87 and 62.85%, with corresponding Bliss
synergy scores of 1.2 (P=1.9×10⁻¹) and 3.03
(P=7.98×10⁻³), respectively. Propranolol, nitisinone and
phenazone also demonstrated positive mean Bliss synergy scores of
3.49 (P=8.62×10⁻³), 5.95 (P=1.74×10⁻⁶) and 4.08 (P=1.16×10⁻⁷),
respectively. Although nitisinone and phenazone showed
statistically supported positive Bliss scores, their overall mean
inhibition rates were lower than those of ZLN005 and tandutinib.
These results highlighted ZLN005 as a leading candidate for
synergistic metabolic activation of osimertinib response and
identified tandutinib as a potential dual-pathway sensitiser
through kinase inhibition.
The aforementioned dose-response analyses provided
evidence that ZLN005 alone exhibited minimal cytotoxicity at
concentrations below 10 µM; however, combined treatment with
osimertinib increased overall growth inhibition. Bliss synergy
matrix modelling identified a positive interaction window spanning
within the tested concentration grid most evident around 3.33 µM
osimertinib combined with 6 µM ZLN005, although the mean Bliss
synergy score for ZLN005 remained modest (1.20; P=1.90×10-¹). These
findings supported ZLN005 as a candidate for further experimental
validation based on its strong overall combinatorial inhibitory
effect with osimertinib, rather than statistically significant
global Bliss synergy.
Collectively, these results indicated that ZLN005
represented the most potent and selective synergistic partner of
osimertinib, providing a strong rationale for further mechanistic
and preclinical evaluation of this combination as a strategy to
eradicate DTP cells in EGFR-mutant lung cancer.
ZLN005 enhances osimertinib-induced
cell death in LUAD cells
To experimentally support the synergistic
cytotoxicity predicted by the aforementioned computational and
synergy analyses, the present study examined the cellular effects
of combining osimertinib with the top five candidate compounds
identified in Fig. 6.
Phase-contrast microscopy revealed that treatment with osimertinib
or each of the aforementioned compounds alone induced modest
morphological changes, whereas their combination markedly enhanced
cell death in PC-9 cells (Fig.
7A). Among all the combinations tested, ZLN005 and osimertinib
showed the most pronounced cytopathic phenotype, characterized by
extensive cell detachment, rounding and membrane rupture,
consistent with the loss of cell viability.
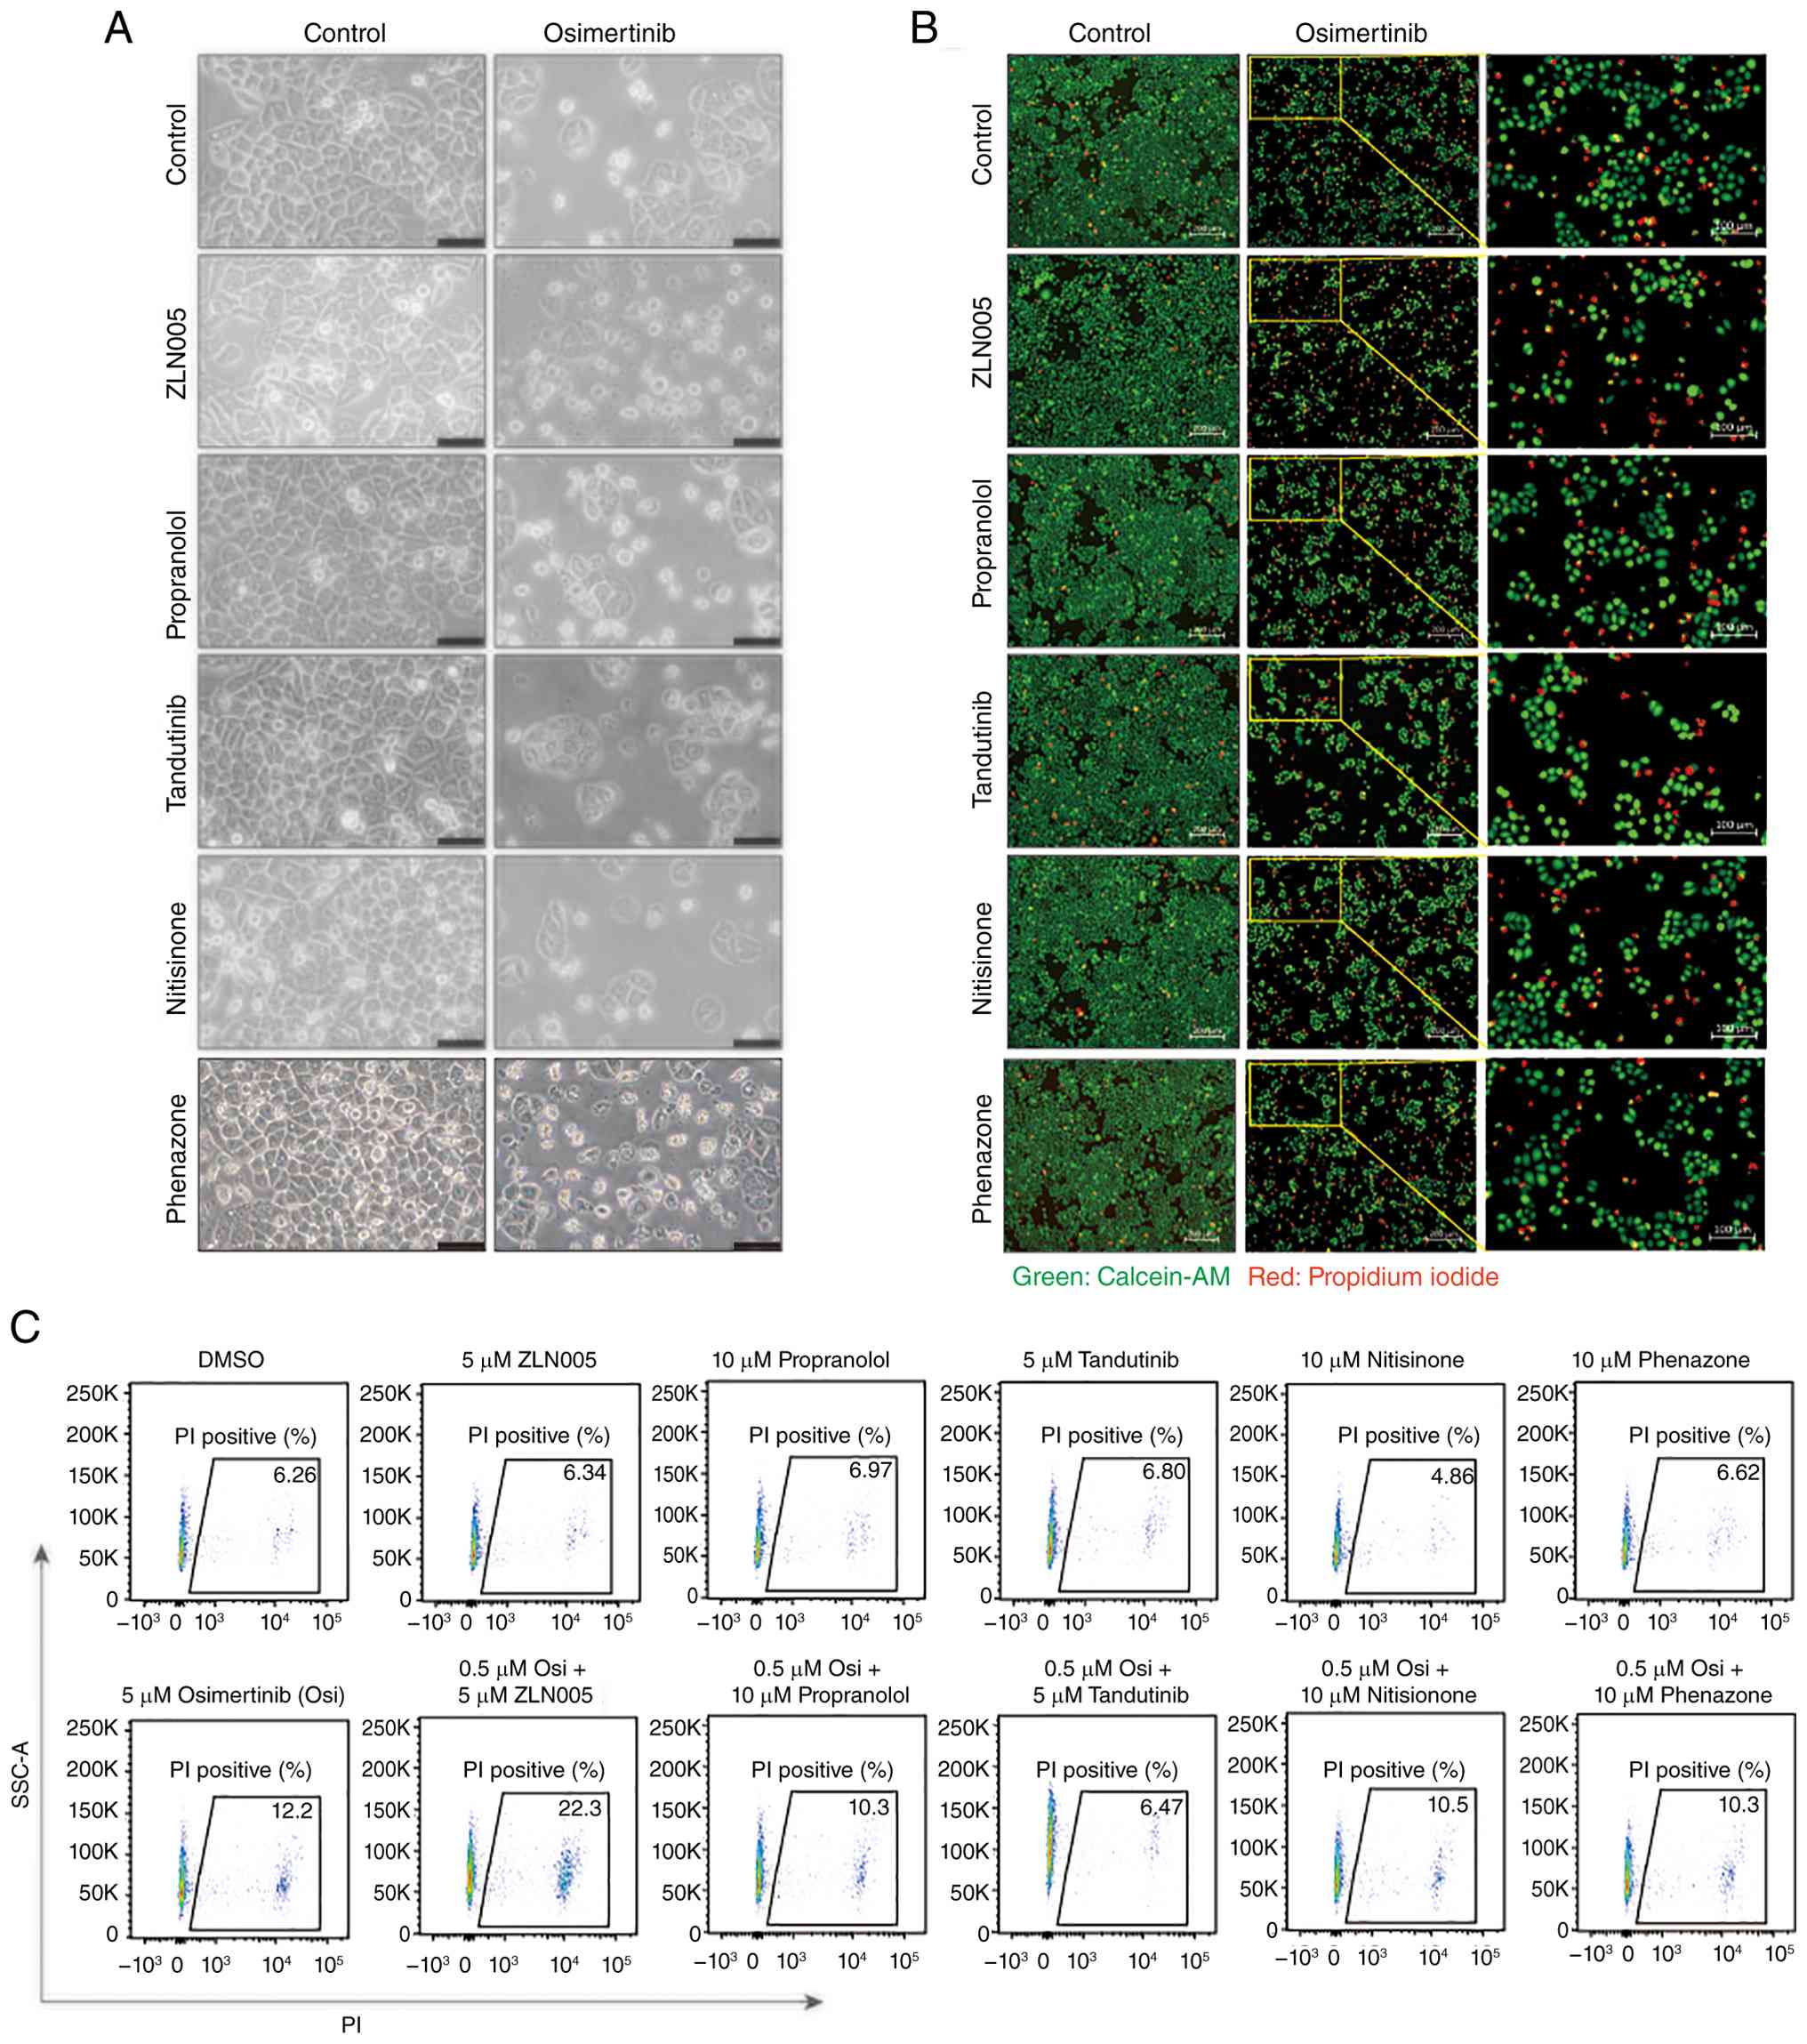 | Figure 7.ZLN005 enhances osimertinib-induced
cell death in lung adenocarcinoma cells. (A) Representative
phase-contrast images of PC-9 cells treated with vehicle control,
osimertinib (0.5 µM) or osimertinib combined with 5–10 µM of the
indicated compounds (ZLN005, propranolol, tandutinib, nitisinone or
phenazone) for 72 h. The combination of ZLN005 and osimertinib
induced pronounced cell death and detachment compared with other
treatments. Scale bar, 50 µm. (B) Calcein-AM (green) and PI (red)
staining of live and dead PC-9 cells under the aforementioned
treatment conditions. The osimertinib + ZLN005 combination
treatment markedly increased the proportion of PI-positive (dead)
cells. (Scale bar, 200 µm). Insets show magnified views of
representative regions. (Scale bar, 100 µm). (C) Flow cytometry
analysis of PI-stained cells. Quantification of PI-positive
fractions demonstrated that co-treatment with ZLN005 and
osimertinib markedly increased the proportion of dead cells
compared with treatment using either agent alone. Data represent
mean ± SD from three independent experiments. AM, acetoxymethyl
ester; PI, propidium iodide; Osi, osimertinib; DMSO, dimethyl
sulfoxide; SD, standard deviation; SSC-A, side scatter-area. |
To further verify these observations, dual staining
was performed using calcein-AM and PI to label viable and dead
cells, respectively. Fluorescence microscopy demonstrated that the
combination of osimertinib and ZLN005 led to a notable increase in
PI-positive (red) cells and a marked reduction in
calcein-AM-positive (green) cells compared with single-agent
treatment (Fig. 7B). Other tested
combinations, including osimertinib with propranolol, tandutinib,
nitisinone or phenazone, also increased PI-positive cell
populations to varying degree. Therefore, the relative potency of
the osimertinib and ZLN005 combination was further assessed by
quantitative PI flow cytometry (Fig.
7C).
Quantitative flow cytometry analysis corroborated
these results, showing that treatment with 0.5 µM osimertinib alone
increased PI-positive cells from 6.26% in DMSO-treated cells to
12.2%, whereas co-treatment with 5 µM ZLN005 further elevated this
proportion to 22.3% (Fig. 7C). By
contrast, the other combinations exhibited minimal increases in
PI-positive fractions. These data supported that ZLN005
synergistically augmented osimertinib-induced cytotoxicity, leading
to enhanced cell death in EGFR-mutant LUAD cells.
ZLN005 promotes osimertinib-induced
pyroptosis through GSDME activation
To investigate the mechanism underlying the
enhanced cytotoxicity of ZLN005 in combination with osimertinib,
the present study first assessed whether this drug combination
induced a lytic form of cell death characteristic of pyroptosis.
Calcein-AM/PI dual staining showed that treatment with either agent
alone resulted in only modest levels of cell death, whereas their
combination resulted in a marked, concentration-dependent increase
in PI-positive cells (Fig. 8A).
The proportion of PI-positive cells rose progressively with
increasing ZLN005 concentrations (5–20 µM), indicating that the
drug combination promoted promoted membrane-permeabilising cell
death as reflected by loss of membrane integrity and increased PI
uptake.
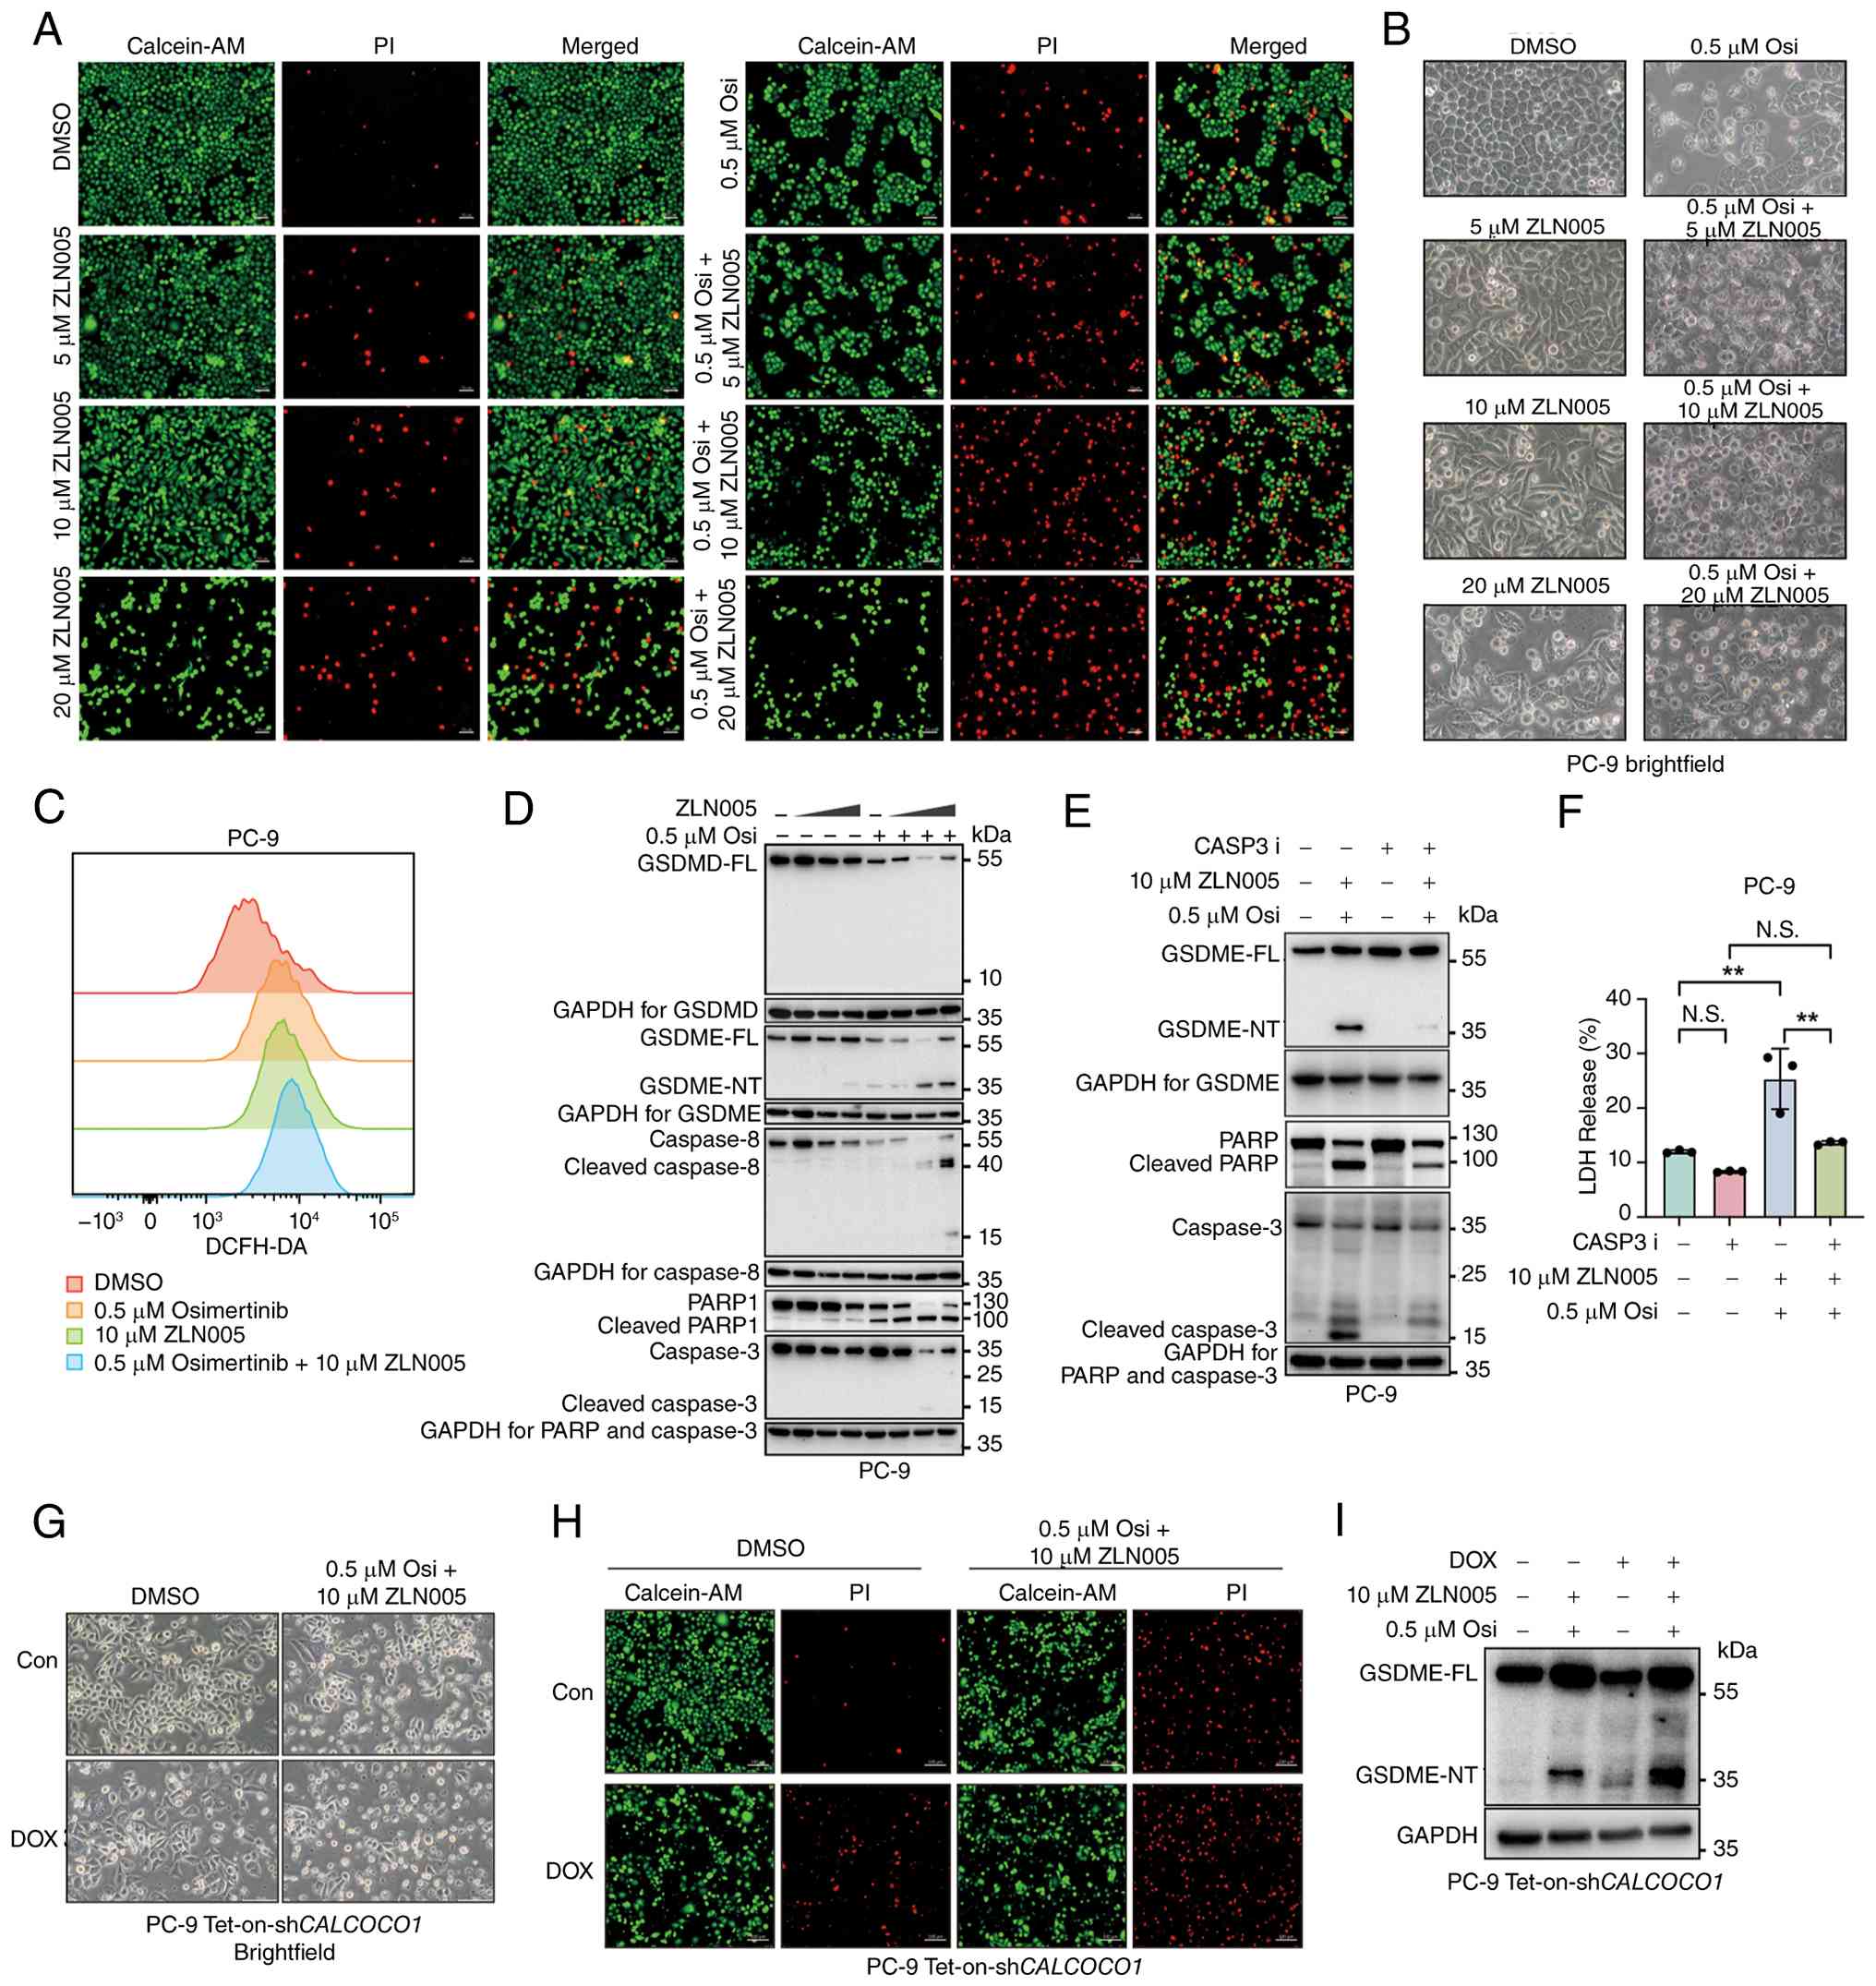 | Figure 8.ZLN005 promotes osimertinib-induced
pyroptotic cell death through GSDME activation. (A) Calcein-AM/PI
dual staining of PC-9 cells treated with increasing doses of ZLN005
(5–20 µM), osimertinib (0.5 µM) or their combination for 48 h.
Calcein-AM (green) signals mark viable cells; PI (red) signals mark
membrane-permeabilized or dead cells. Scale bar, 50 µm. (B)
Representative phase-contrast microscopy images showing
morphological changes characteristic of lytic cell death, including
swelling and membrane rupture, particularly under combination
treatment. Scale bar, 50 µm. (C) Flow cytometric detection of
intracellular ROS using DCFH-DA. Co-treatment with osimertinib and
ZLN005 showed a modest increase in fluorescence intensity compared
with single-agent treatment, suggesting increased intracellular ROS
levels. (D) Immunoblot analysis of apoptosis and pyroptosis
markers. Osimertinib and ZLN005 co-treatment enhanced PARP and
caspase-8 cleavage and robustly induced the active N-terminal
fragment of GSDME. Full-length GSDMD was reduced but not cleaved.
The involvement of caspase-3 in GSDME cleavage was further
supported by the caspase-3 inhibitor experiments shown in (E) and
(F). Target protein blots are grouped within the figure with GAPDH
blots from the corresponding membrane, which served as the loading
control. (E) Immunoblot analysis showing the effect of caspase-3
inhibition on GSDME and PARP cleavage. Treatment with Z-DEVD-FMK
suppressed the cleavage of PARP and GSDME induced by
osimertinib/ZLN005 co-treatment, indicating that caspase-3 acted
upstream of GSDME activation. GAPDH bands corresponding to each
membrane are grouped with their respective target protein blots as
loading controls. (F) LDH release assay under caspase-3 inhibition
and osimertinib/ZLN005 co-treatment. Z-DEVD-FMK reduced
osimertinib/ZLN005-induced cell death. Data are presented as mean ±
SD from three independent biological replicates. Statistical
significance was determined by one-way ANOVA followed by Tukey's
multiple-comparisons test. **P<0.01. (G) Representative
phase-contrast images of CALCOCO1 knockdown in PC-9 cells
treated with ZLN005 (10 µM) and osimertinib (0.5 µM) for 48 h.
CALCOCO1 knockdown enhanced cell death under combination
treatment. Scale bar, 100 µm. (H) Calcein-AM/PI staining of
CALCOCO1-knockdown PC-9 cells treated with
osimertinib/ZLN005 for 48 h. Calcein-AM (green) labelled viable
cells, whereas PI (red) labelled membrane-permeabilized or dead
cells. CALCOCO1 knockdown increased the fraction of
PI-positive cells under osimertinib/ZLN005 combination treatment.
Scale bar, 100 µm. (I) Immunoblot analysis of GSDME cleavage in
CALCOCO1-knockdown cells treated with osimertinib/ZLN005 for
48 h. AM, acetoxymethyl ester; PI, propidium iodide; Osi,
osimertinib; DMSO, dimethyl sulfoxide; ROS, reactive oxygen
species; DCFH-DA, 2′,7′-dichlorodihydrofluorescein diacetate; PARP,
Poly(ADP-ribose) polymerase; GSDME, gasdermin E; GSDMD, Gasdermin
D; NT, N-terminal fragment; FL, full-length; GAPDH, glyceraldehyde
3-phosphate dehydrogenase; CASP3i, caspase-3 inhibitor
(Z-DEVD-FMK); LDH, lactate dehydrogenase; CALCOCO1, calcium binding
and coiled-coil domain 1; ANOVA, analysis of variance; SD, standard
deviation. |
Phase-contrast microscopy further supported these
observations; Cells co-treated with osimertinib and ZLN005
exhibited the classical morphological features of pyroptosis,
including cell swelling, balloon-like membrane blebs and eventual
plasma-membrane rupture (Fig. 8B).
These morphological changes were consistent with gasdermin-mediated
lytic death rather than apoptosis alone.
Given that ZLN005 is a PGC-1α agonist known to
increase mitochondrial oxidative metabolism, the present study
subsequently quantified intracellular ROS levels to determine
whether mitochondrial stress contributed to the enhanced
cytotoxicity. DCFH-DA staining revealed a mild elevation in ROS
levels following single-agent treatments; however, the combined
treatment produced a slight right-shifted fluorescence peak,
indicating moderate increase (Fig.
8C). These findings suggested that ROS accumulation may
contribute, at least in part, to the enhanced cytotoxicity induced
by the combination of ZLN005 and osimertinib.
Immunoblotting was performed for canonical
apoptosis and pyroptosis markers to determine the molecular basis
of the observed cell death. Co-treatment markedly increased the
cleavage of PARP and caspase-8 relative to single agents and was
accompanied by caspase-3 processing, indicating activation of
apoptotic signalling (Fig. 8D).
Notably, this combination also induced robust cleavage of GSDME,
generating an N-terminal pore-forming fragment that directly drives
plasma-membrane rupture during pyroptosis. Although the cleaved
N-terminal form of GSDMD was not detected, full-length GSDMD levels
were markedly reduced following combination treatment, suggesting
potential degradation or non-canonical inactivation rather than
canonical inflammasome-mediated activation.
To support the causal role of caspase-3 in
mediating GSDME cleavage and cell death, the present study
pharmacologically inhibited caspase-3 using Z-DEVD-FMK. As shown in
Fig. 8E, caspase-3 inhibition
markedly suppressed the cleavage of both PARP and GSDME induced by
osimertinib/ZLN005 co-treatment, indicating that caspase-3 acted
upstream of GSDME activation. Consistent with these results, LDH
release assays revealed that caspase-3 inhibition significantly
reduced osimertinib/ZLN005-induced cell death (Fig. 8F), providing evidence that
caspase-3-dependent GSDME cleavage was functionally required for
the lytic phenotype.
Given that CALCOCO1 was identified as a core
component of the DTP-associated gene signature (Fig. 4), the present study tested whether
its loss sensitised cells to osimertinib/ZLN005-induced death.
Phase-contrast microscopy revealed that CALCOCO1 knockdown
markedly exacerbated cell death upon osimertinib/ZLN005
co-treatment, with increased cell rounding, detachment and lysis
observed (Fig. 8G). This was
further corroborated by calcein-AM/PI staining;
CALCOCO1-knockdown cells exhibited markedly higher
PI-positive cell fractions than control shRNA-treated cells
following osimertinib/ZLN005 co-treatment (Fig. 8H). Notably, immunoblotting showed
that CALCOCO1 knockdown enhanced the cleavage of GSDME
(Fig. 8I) without affecting total
GSDME levels, suggesting that CALCOCO1 acted as a negative
regulator of GSDME activation in DTP cells.
Together, these findings demonstrated that ZLN005
amplified osimertinib-induced cytotoxicity by promoting ROS-driven
activation of caspase-3 and the subsequent cleavage of GSDME,
thereby shifting cell death toward a membrane-permeabilising lytic
phenotype. This switch would be expected to enhance the elimination
of DTP-like cells because GSDME-mediated pore formation causes
irreversible plasma-membrane rupture, as reflected by increased PI
uptake, LDH release and pyroptosis-like morphology, rather than
allowing cells to remain in a drug-tolerant or non-lytic stressed
state. Notably, CALCOCO1 functioned as a key protective node
in the DTP program by limiting GSDME activation. Its depletion
removed this brake and further sensitised persister-like cells to
osimertinib/ZLN005-induced lytic death. Thus, the
metabolic-stress-associated switch toward GSDME-mediated pyroptosis
provided a mechanistic explanation for the enhanced elimination of
DTP cells following combined osimertinib and ZLN005 treatment.
Discussion
Targeted therapy with TKIs has transformed the
therapeutic management of oncogene-driven cancers, such as
EGFR-mutant LUAD; however, the emergence of DTP cells remains a
notable barrier to durable clinical remission (40). These cells survive initial TKI
exposure through reversible, non-genetic adaptations characterised
by transcriptional reprogramming and metabolic plasticity (14,21).
The present study combined machine-learning-based transcriptomic
profiling with functional validation to identify a four-gene
transcriptional signature, comprising BTG1, ING4, PNRC1 and
CALCOCO1, which was associated with the DTP state and
adverse clinical outcomes. The present study further demonstrated
that pharmacological activation of mitochondrial metabolism using
ZLN005, a PGC-1α agonist, synergistically enhanced
osimertinib-induced GSDME-associated pyroptotic cell death, thereby
facilitating the elimination of otherwise drug-tolerant cells
(Fig. 9).
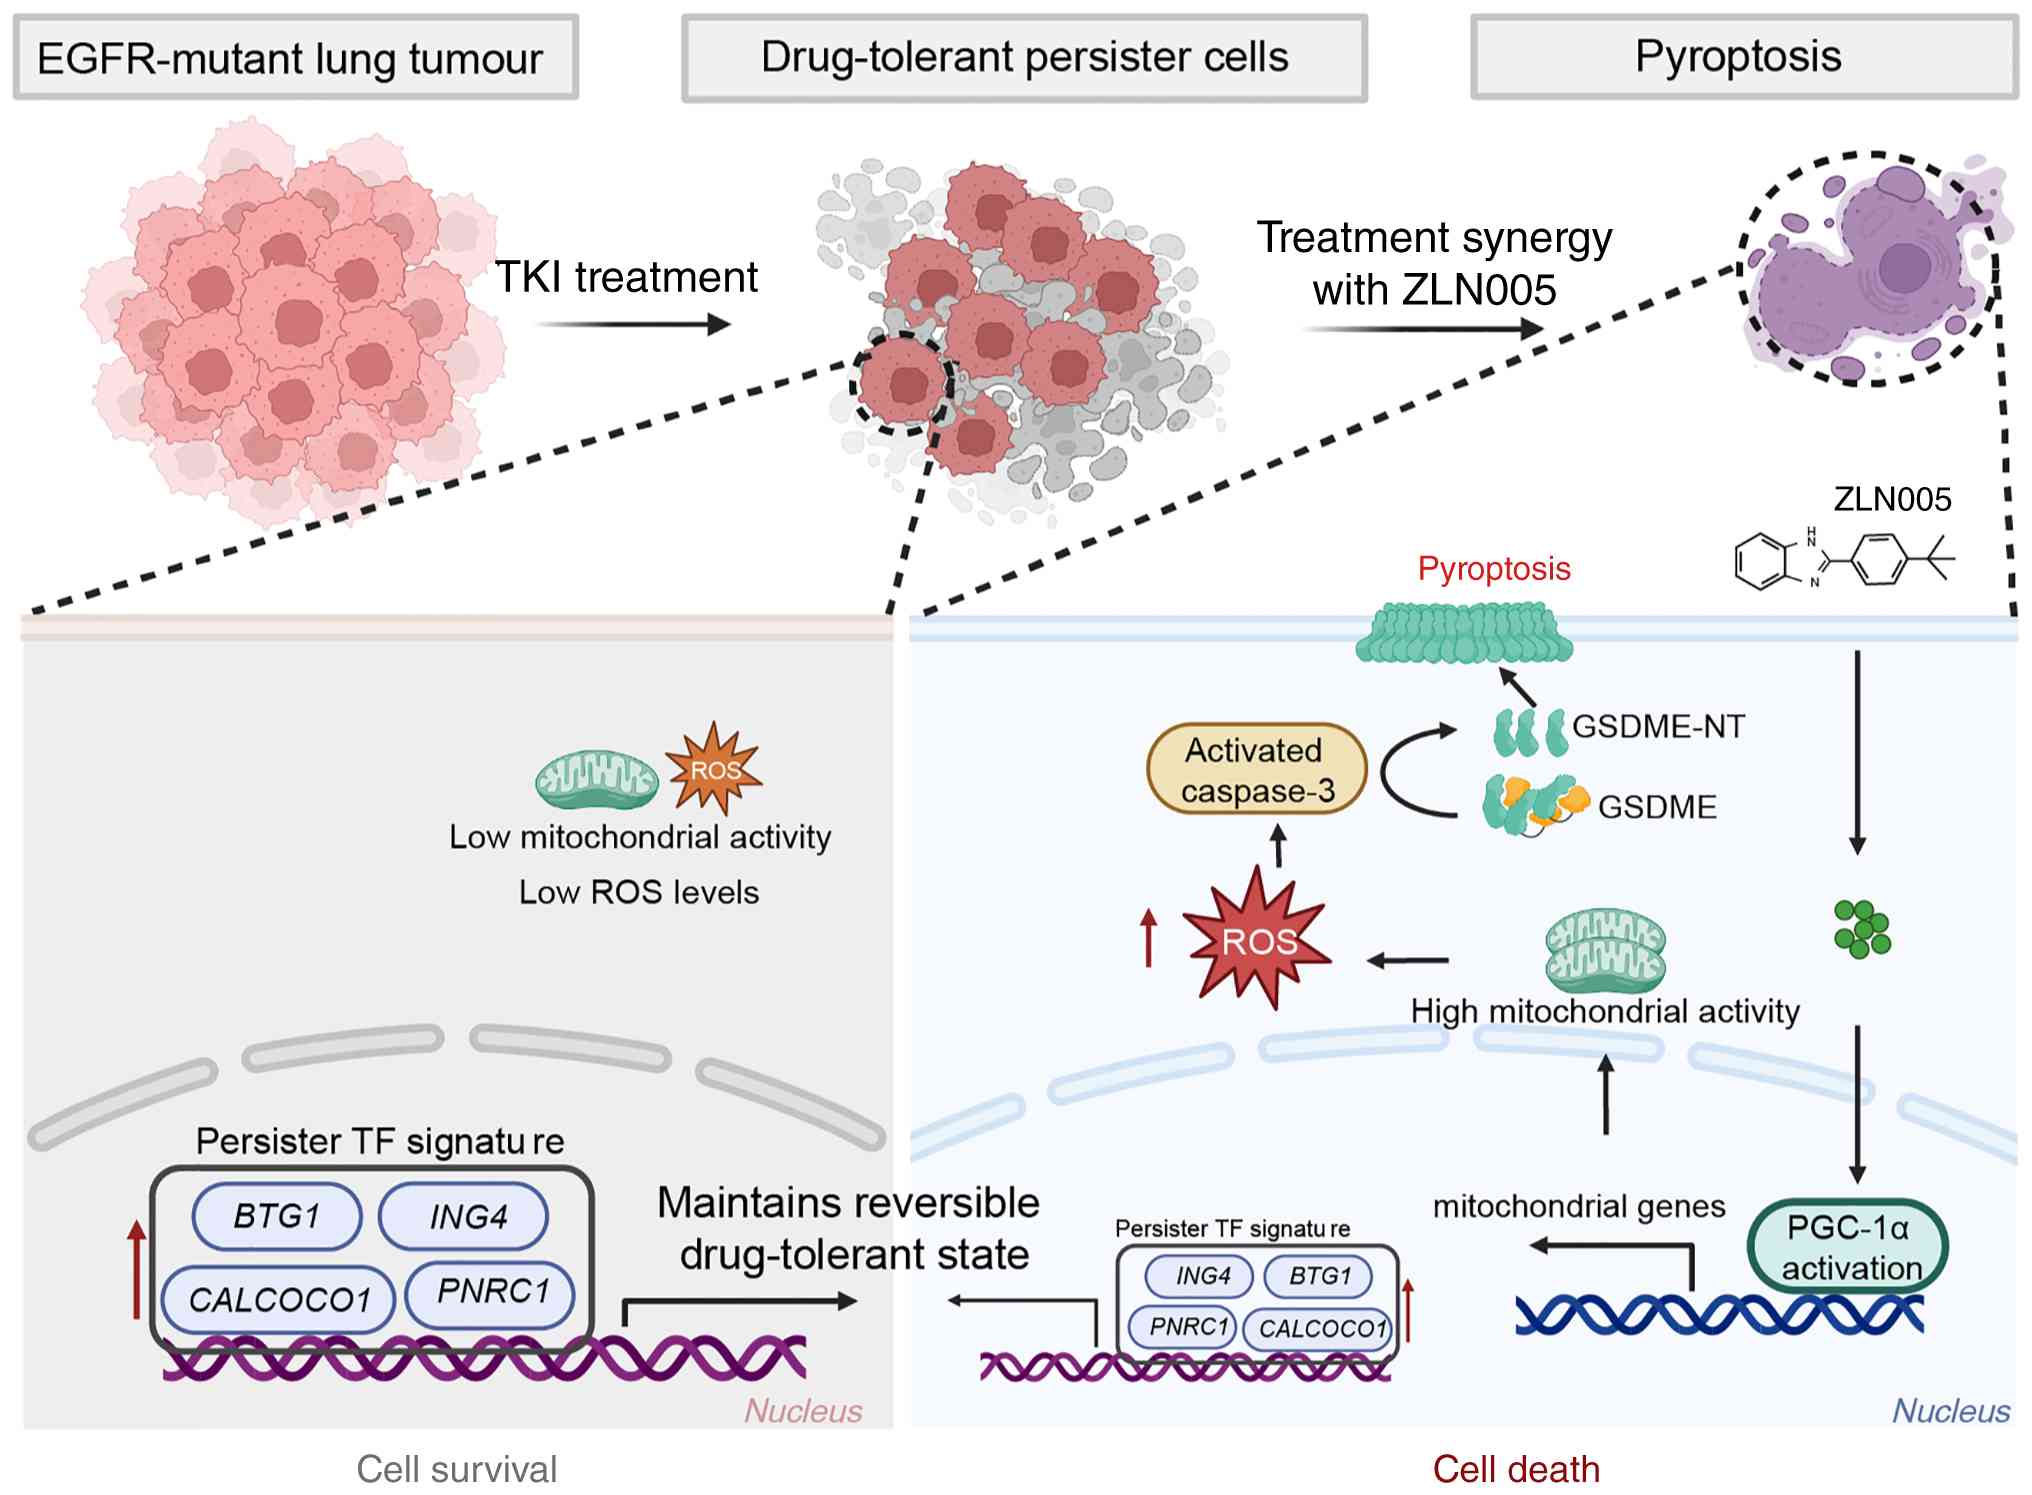 | Figure 9.Mechanistic model of TKI-induced
persister cells in EGFR-mutant lung cancer and their susceptibility
to ZLN005-induced pyroptosis. TKI treatment drives EGFR-mutant lung
tumour cells into a reversible drug-tolerant persister state
characterised by reduced mitochondrial activity, low ROS levels and
activation of a persister-specific transcriptional program,
comprising the upregulation of BTG1, ING4, CALCOCO1 and
PNRC1. Treatment with the PGC-1α agonist ZLN005 enhances
mitochondrial activity and ROS production, synergizing with
osimertinib treatment to trigger caspase-3 activation and GSDME
cleavage. This converts reversible drug tolerance into irreversible
pyroptotic cell death, revealing a metabolic vulnerability of
persister cells that can be exploited therapeutically. EGFR,
epidermal growth factor receptor; TKI, tyrosine kinase inhibitor;
ROS, reactive oxygen species; GSDME, gasdermin E; NT, N terminal;
BTG1, B-cell translocation gene 1; ING4, inhibitor of growth family
member 4; CALCOCO1, calcium binding and coiled-coil domain 1;
PNRC1, proline-rich nuclear receptor coactivator 1; PGC-1α,
peroxisome proliferator-activated receptor gamma coactivator
1-alpha; TF, transcription factor. |
The four genes comprising the identified signature,
BTG1, ING4, PNRC1 and CALCOCO1, are involved in
diverse cellular processes (41–44).
BTG1 and ING4 have been implicated in chromatin
remodelling, cell cycle arrest and stress-induced differentiation
(45–48). PNRC1 modulates nuclear
receptor signalling (43,49) and CALCOCO1 participates in
autophagy and calcium-dependent homeostasis (50,51).
In the present study, these genes were interpreted as components of
a transcriptional signature associated with the DTP state rather
than as a fully validated cooperative regulatory module. Their
coordinated upregulation suggested that the persister phenotype may
have involved a multilayered adaptive program that integrated
transcriptional control, metabolic adjustment and survival
signalling. However, further perturbation-based studies are
required to determine whether these factors interacted to regulate
DTP biology and the mechanisms behind these interactions.
Collectively, these observations suggested that a subset of tumour
cells may have adopted a transcriptionally coordinated adaptive
state that supported transient tolerance to TKI pressure while
preserving their capacity to resume proliferation upon the
cessation of treatment (21).
Clinically, high expression of the identified
signature associated with reduced OS and PPS in LUAD, providing
preliminary support for the potential relevance of this signature
as a biomarker of residual disease and risk of relapse. More
broadly, persister-associated transcriptional and metabolic states
have increasingly been linked to adverse therapeutic outcomes.
However, robust clinical validation of persister-cell biomarkers
remains limited (52–54). Accordingly, the prognostic
relevance of the four-gene signature in the present study should be
interpreted as supportive, but preliminary, pending validation in
independent clinical cohorts and longitudinal treatment-matched
samples.
The drug-sensitivity profiling results of the
present study revealed that cell lines with high expression of the
four-gene signature exhibited selective susceptibility to metabolic
modulators, including ZLN005, propranolol, tandutinib, nitisinone
and phenazone. This observation was consistent with previous
studies that have demonstrated that DTP cells frequently exhibited
an increased reliance on oxidative phosphorylation and
mitochondrial stress-response pathways for survival under targeted
therapy pressure (16,19,21,55).
In contrast to studies that have primarily described mitochondrial
dependence as a feature of the persister state (56), the findings of the present study
suggested that pharmacological mitochondrial overactivation may be
leveraged to expose a metabolic vulnerability and promote
elimination of the DTP state. Nevertheless, broader comparisons of
the effects of these modulators with other mitochondrial activators
and metabolic intervention strategies are limited, requiring
further investigation. Among the investigated candidates, ZLN005
emerged as the strongest synergistic partner of osimertinib.
Mechanistically, the data in the present study supported a model in
which ZLN005-mediated activation of PGC-1α enhanced mitochondrial
oxidative metabolism, which may have imposed metabolic overload on
DTP cells whose redox systems were already strained by TKI-induced
stress. This metabolic overactivation was accompanied by increased
production of ROS, a stress signal known to promote caspase-3
activation (57). Consistent with
this model, the combination treatment of ZLN005 and osimertinib
markedly increased intracellular ROS levels, enhanced caspase-3
cleavage and induced robust GSDME cleavage; however, GSDMD cleavage
was not notably affected, indicating the preferential activation of
the caspase-3/GSDME pyroptotic axis. Morphological and staining
assays supported this form of lytic cell death via observations of
membrane ballooning, rupture and PI uptake.
This selective engagement of GSDME-associated
pyroptosis carried important mechanistic implications and may have
exhibited translational relevance. Although pyroptotic cell death
can proceed through different gasdermin family members depending on
the cellular context (30), the
data in the present study did not demonstrate detectable GSDMD
activation under the conditions tested. Specifically, although
full-length GSDMD levels were reduced upon combination treatment,
its active N-terminal fragment was not detected, contradicting
canonical GSDMD-dependent pyroptosis. Instead, the observed cell
death phenotype was consistent with a GSDME-associated process,
which was supported by caspase-3 activation and robust GSDME
cleavage. Therefore, the absence of detectable GSDMD-N did not
exclude pyroptosis, but indicated that osimertinib/ZLN005-induced
lytic death was unlikely to proceed through canonical GSDMD
activation under the conditions tested. Instead, the concomitant
caspase-3 processing and robust GSDME cleavage supported
preferential engagement of the caspase-3/GSDME axis. Taken
together, the caspase-3/GSDME axis appeared to function as the
predominant execution pathway, likely through the release of the
GSDME N-terminal pore-forming domain and the resulting
plasma-membrane permeabilization. This mode of death may have been
immunogenic and could have promoted the release of
damage-associated molecular patterns, potentially influencing the
tumour microenvironment and facilitating immune clearance. Thus,
combining EGFR-TKIs with mitochondrial activators, such as ZLN005,
may not only enhance the elimination of persister cells but also
have immunomodulatory consequences, with potential implications for
future integration with immunotherapies. Although GSDME appeared to
be the predominant executioner in this setting, further studies on
GSDMD remain relevant because full-length GSDMD was reduced after
combination treatment despite the absence of detectable GSDMD-N.
Proteasome inhibition, epitope mapping or ubiquitination assays may
help determine whether this reduction reflects protein degradation,
alternative cleavage, epitope loss or other post-translational
regulation rather than canonical GSDMD activation.
A key conceptual advancement of the present study
was the identification of a potential mechanistic link between
mitochondrial metabolic rewiring and pyroptotic vulnerability in
DTP cells. Persister cells appeared to adopt a mitochondrial state
that supported oxidative phosphorylation, a metabolic configuration
that may have provided survival advantages under TKI pressure while
also rendering these cells sensitive to metabolic overactivation.
In this context, pharmacologic activation of PGC-1α by ZLN005 was
proposed to further increase mitochondrial respiration and
oxidative stress beyond a tolerable threshold. The present study
observed that the ROS increase resulting from ZLN005 treatment
coincided with caspase-3 activation and GSDME cleavage, supporting
a model in which mitochondrial oxidative stress acts upstream of
pyroptotic conversion. Although the data of the present study
supported this mechanistic interpretation, the causality
requirement of PGC-1α-dependent metabolic activation and ROS
accumulation for caspase-3/GSDME-mediated pyroptosis has not yet
been directly established through genetic perturbation experiments,
such as PPARGC1A knockdown or GSDME loss-of-function analysis.
These findings suggested that the metabolic flexibility enabling
DTP survival may also have exposed therapeutic vulnerabilities that
can be exploited through targeted metabolic overactivation.
Despite these insights, several important
limitations remain. First, the direct functional roles of BTG1,
ING4, PNRC1 and CALCOCO1 in the coordination of
drug-tolerance-associated transcriptional and metabolic programs
must be defined more rigorously. Furthermore, the functional
experiments of the present study were conducted exclusively in
vitro using cell line models, and the efficacy and mechanism of
action of the osimertinib/ZLN005 combination treatment therefore
remains yet to be validated in vivo. As such, the
conclusions of the present study have been based primarily on in
vitro and computational analyses, which cannot fully account
for tumour heterogeneity, microenvironmental influences or
treatment responses in more physiologically relevant settings. In
particular, microenvironmental factors, including immune cell
interactions, fibroblast-derived paracrine signalling,
extracellular matrix remodelling and inflammatory cues, may affect
the emergence, maintenance and therapeutic vulnerability of DTP
cells. Therefore, these factors could also modulate the efficacy
and mechanism of DTP cell response to the osimertinib/ZLN005
combination. Additionally, the restricted size of the available
transcriptomic datasets and the limited number of experimental
models included in a number of analyses may have affected the
robustness and generalizability of the findings of the present
study. Therefore, future studies using co-culture systems,
organoid-based models, patient-derived xenograft models and
immunocompetent mouse models are important for evaluating
antitumour efficacy and validating the mechanism of action of
treatments. These models are also necessary for defining how the
tumour microenvironment shapes DTP cell behaviour, host immune
responses and the therapeutic response to osimertinib/ZLN005
co-treatment in a more physiologically relevant context.
An additional and important limitation of the
present study is that longitudinal clinical specimens, particularly
paired pre- and post-EGFR-TKI treatment biopsies, were not
available in the present study to validate the four-gene signature.
Although the bioinformatic analyses and survival associations in
the present study provided preliminary support for the potential
clinical relevance of this signature, its dynamic behaviour during
EGFR-TKI treatment has not yet been validated in patient-matched
pre- and post-treatment samples. Such paired clinical specimens
would be particularly useful for evaluating whether changes in
BTG1, ING4, PNRC1 and CALCOCO1 expression can serve
as biomarkers can serve as biomarkers of adaptive drug tolerance
and treatment response in clinical settings. It is also important
to assess whether this EGFR-TKI treatment strategy is broadly
applicable across other oncogene-driven cancers that exhibit
drug-tolerant states.
In conclusion, the present study identified a
four-gene transcriptional signature associated with the DTP state
in EGFR-mutant LUAD and provided experimental evidence that
ZLN005-mediated metabolic overactivation enhanced
osimertinib-induced GSDME-associated pyroptosis in vitro.
These findings supported the concept that metabolic vulnerabilities
of DTP cells may be therapeutically exploitable. However,
additional mechanistic studies, in vivo validations and
clinical investigations are required before these findings can be
translated into therapeutic strategies.
Supplementary Material
Supporting Data
Acknowledgements
Not applicable.
Funding
The present study was sponsored and funded by the National
Natural Science Foundation of China (grant nos. 82373905, 82370051
and 82404687), the Jiangsu Specially-Appointed Professor Program,
the Starting Foundation for Talents of Xuzhou Medical University,
the Basic Science Research Project for Higher Education
Institutions in Jiangsu Province (grant nos. 23KJA310008,
23KJB310026 and 23KJB310029), the Young Scientists Fund of the
National Natural Science Foundation of Jiangsu (grant no.
BK20241045), the Medical research project for the Health Commission
of Jiangsu Province (grant no. Z2024023), the Postgraduate Research
and Practice Innovation Program of Jiangsu Province (grant no.
KYCX25_3253), the National Demonstration Centre for Experimental
Basic Medical Science Education (Xuzhou Medical University; grant
nos. 2024BMS30 and 2025BMS02) and the Student Science and
Technology Innovation Project (grant no. 202410313049Y).
Availability of data and materials
The data generated in the present study may be
requested from the corresponding author.
Authors' contributions
YS and PL designed the experiments and conceived
and supervised the study. FG, YT, PZ, YY and YM supervised the
studies and analysed the profiling data. WC and JY performed the
biochemistry and cell biology experiments with the assistance of
HZ, YY, YM, ML, WL, HY and CS. YS and PL analysed the experimental
data. YS and PL confirm the authenticity of all the raw data. YS,
PL and WC wrote the manuscript with input from all co-authors. All
authors read and approved the final manuscript.
Ethics approval and consent to
participate
Not applicable.
Patient consent for publication
Not applicable.
Competing interests
The authors declare that they have no competing
interests.
Glossary
Abbreviations
Abbreviations:
|
DTP
|
drug-tolerant persister
|
|
EGFR
|
epidermal growth factor receptor
|
|
RTK
|
receptor tyrosine kinase
|
|
TKI
|
tyrosine kinase inhibitor
|
|
NSCLC
|
non-small cell lung cancer
|
|
LASSO
|
least absolute shrinkage and
selection operator
|
|
SVM-RFE
|
support vector machine-recursive
feature elimination
|
|
ROC
|
receiver operating characteristic
|
|
AUC
|
area under the curve
|
|
OS
|
overall survival
|
|
PPS
|
post-progression survival
|
|
FP
|
first progression
|
|
HR
|
hazard ratio
|
|
ROS
|
reactive oxygen species
|
|
PBST
|
PBS containing 0.1% Tween-20
|
|
PI
|
propidium iodide
|
|
GSEA
|
gene set enrichment analysis
|
|
FDR
|
false discovery rate
|
|
TNMplot
|
tumour-normal-metastatic plot
|
References
|
1
|
Leiter A, Veluswamy RR and Wisnivesky JP:
The global burden of lung cancer: Current status and future trends.
Nat Rev Clin Oncol. 20:624–639. 2023. View Article : Google Scholar : PubMed/NCBI
|
|
2
|
Bray F, Laversanne M, Sung H, Ferlay J,
Siegel RL, Soerjomataram I and Jemal A: Global cancer statistics
2022: GLOBOCAN estimates of incidence and mortality worldwide for
36 cancers in 185 countries. CA Cancer J Clin. 74:229–263.
2024.PubMed/NCBI
|
|
3
|
Rojiani MV and Rojiani AM: Non-small cell
lung cancer-tumor biology. Cancers (Basel). 16:7162024. View Article : Google Scholar : PubMed/NCBI
|
|
4
|
Huang Q, Li Y, Huang Y, Wu J, Bao W, Xue
C, Li X, Dong S, Dong Z and Hu S: Advances in molecular pathology
and therapy of non-small cell lung cancer. Signal Transduct Target
Ther. 10:1862025. View Article : Google Scholar : PubMed/NCBI
|
|
5
|
Koulouris A, Tsagkaris C, Corriero AC,
Metro G and Mountzios G: Resistance to TKIs in EGFR-mutated
non-small cell lung cancer: From mechanisms to new therapeutic
strategies. Cancers (Basel). 14:33372022. View Article : Google Scholar : PubMed/NCBI
|
|
6
|
Sun R, Hou Z, Zhang Y and Jiang B: Drug
resistance mechanisms and progress in the treatment of EGFR-mutated
lung adenocarcinoma. Oncol Lett. 24:4082022. View Article : Google Scholar : PubMed/NCBI
|
|
7
|
Marin-Acevedo JA, Pellini B, Kimbrough EO,
Hicks JK and Chiappori A: Treatment strategies for non-small cell
lung cancer with common EGFR mutations: A review of the history of
EGFR TKIs approval and emerging data. Cancers (Basel). 15:6292023.
View Article : Google Scholar : PubMed/NCBI
|
|
8
|
Corvaja C, Passaro A, Attili I, Aliaga PT,
Spitaleri G, Signore ED and de Marinis F: Advancements in
fourth-generation EGFR TKIs in EGFR-mutant NSCLC: Bridging
biological insights and therapeutic development. Cancer Treat Rev.
130:1028242024. View Article : Google Scholar : PubMed/NCBI
|
|
9
|
Suda K and Mitsudomi T: Drug tolerance to
EGFR tyrosine kinase inhibitors in lung cancers with EGFR
mutations. Cells. 10:15902021. View Article : Google Scholar : PubMed/NCBI
|
|
10
|
Marine JC, Dawson SJ and Dawson MA:
Non-genetic mechanisms of therapeutic resistance in cancer. Nat Rev
Cancer. 20:743–756. 2020. View Article : Google Scholar : PubMed/NCBI
|
|
11
|
Dhanyamraju PK, Schell TD, Amin S and
Robertson GP: Drug-tolerant persister cells in cancer therapy
resistance. Cancer Res. 82:2503–2514. 2022. View Article : Google Scholar : PubMed/NCBI
|
|
12
|
Cabanos HF and Hata AN: Emerging insights
into targeted therapy-tolerant persister cells in cancer. Cancers
(Basel). 13:26662021. View Article : Google Scholar : PubMed/NCBI
|
|
13
|
Pfeifer M, Brammeld JS, Price S, Pilling
J, Bhavsar D, Farcas A, Bateson J, Sundarrajan A, Miragaia RJ, Guan
N, et al: Genome-wide CRISPR screens identify the YAP/TEAD axis as
a driver of persister cells in EGFR mutant lung cancer. Commun
Biol. 7:4972024. View Article : Google Scholar : PubMed/NCBI
|
|
14
|
Li H, Xu W, Cheng W, Yu G and Tang D:
Drug-tolerant persister cell in cancer: Reversibility,
microenvironmental interplay, and therapeutic strategies. Front
Pharmacol. 16:16120892025. View Article : Google Scholar : PubMed/NCBI
|
|
15
|
Krishna C, DiNatale RG, Kuo F, Srivastava
RM, Vuong L, Chowell D, Gupta S, Vanderbilt C, Purohit TA, Liu M,
et al: Single-cell sequencing links multiregional immune landscapes
and tissue-resident T cells in ccRCC to tumor topology and therapy
efficacy. Cancer Cell. 39:662–677.e6. 2021. View Article : Google Scholar : PubMed/NCBI
|
|
16
|
Mikubo M, Inoue Y, Liu G and Tsao MS:
Mechanism of drug tolerant persister cancer cells: The landscape
and clinical implication for therapy. J Thorac Oncol. 16:1798–1809.
2021. View Article : Google Scholar : PubMed/NCBI
|
|
17
|
Sharma SV, Lee DY, Li B, Quinlan MP,
Takahashi F, Maheswaran S, McDermott U, Azizian N, Zou L, Fischbach
MA, et al: A chromatin-mediated reversible drug-tolerant state in
cancer cell subpopulations. Cell. 141:69–80. 2010. View Article : Google Scholar : PubMed/NCBI
|
|
18
|
Wang Z, Hausmann S, Lyu R, Li TM, Lofgren
SM, Flores NM, Fuentes ME, Caporicci M, Yang Z, Meiners MJ, et al:
SETD5-coordinated chromatin reprogramming regulates adaptive
resistance to targeted pancreatic cancer therapy. Cancer Cell.
37:834–849.e13. 2020. View Article : Google Scholar : PubMed/NCBI
|
|
19
|
Zhang Z, Tan Y, Huang C and Wei X: Redox
signaling in drug-tolerant persister cells as an emerging
therapeutic target. EBioMedicine. 89:1044832023. View Article : Google Scholar : PubMed/NCBI
|
|
20
|
Zhang Z, Qin S, Chen Y, Zhou L, Yang M,
Tang Y, Zuo J, Zhang J, Mizokami A, Nice EC, et al: Inhibition of
NPC1L1 disrupts adaptive responses of drug-tolerant persister cells
to chemotherapy. EMBO Mol Med. 14:e149032022. View Article : Google Scholar : PubMed/NCBI
|
|
21
|
He J, Qiu Z, Fan J, Xie X, Sheng Q and Sui
X: Drug tolerant persister cell plasticity in cancer: A
revolutionary strategy for more effective anticancer therapies.
Signal Transduct Target Ther. 9:2092024. View Article : Google Scholar : PubMed/NCBI
|
|
22
|
Theodorakis N, Feretzakis G, Tzelves L,
Paxinou E, Hitas C, Vamvakou G, Verykios VS and Nikolaou M:
Integrating machine learning with multi-omics technologies in
geroscience: Towards personalized medicine. J Pers Med. 14:9312024.
View Article : Google Scholar : PubMed/NCBI
|
|
23
|
Kathad U, Kulkarni A, McDermott JR, Wegner
J, Carr P, Biyani N, Modali R, Richard JP, Sharma P and Bhatia K: A
machine learning-based gene signature of response to the novel
alkylating agent LP-184 distinguishes its potential tumor
indications. BMC Bioinformatics. 22:1022021. View Article : Google Scholar : PubMed/NCBI
|
|
24
|
Zeng X, Wei L, Lv L, Wu D, Shen Y, Lu X,
Kong X, Cai Z and Wang J: Revealing key regulatory factors in lung
adenocarcinoma: The role of epigenetic regulation of
autophagy-related genes from transcriptomics, scRNA-seq, and
machine learning. Front Pharmacol. 16:15423382025. View Article : Google Scholar : PubMed/NCBI
|
|
25
|
Nojima Y, Yao R and Suzuki T: Single-cell
RNA sequencing and machine learning provide candidate drugs against
drug-tolerant persister cells in colorectal cancer. Biochim Biophys
Acta Mol Basis Dis. 1871:1676932025. View Article : Google Scholar : PubMed/NCBI
|
|
26
|
Li M, Jiang P, Yang Y, Xiong L, Wei S,
Wang J and Li C: The role of pyroptosis and gasdermin family in
tumor progression and immune microenvironment. Exp Hematol Oncol.
12:1032023. View Article : Google Scholar : PubMed/NCBI
|
|
27
|
Wang Y, Gao W, Shi X, Ding J, Liu W, He H,
Wang K and Shao F: Chemotherapy drugs induce pyroptosis through
caspase-3 cleavage of a gasdermin. Nature. 547:99–103. 2017.
View Article : Google Scholar : PubMed/NCBI
|
|
28
|
Jiang M, Qi L, Li L and Li Y: The
caspase-3/GSDME signal pathway as a switch between apoptosis and
pyroptosis in cancer. Cell Death Discov. 6:1122020. View Article : Google Scholar : PubMed/NCBI
|
|
29
|
Zhang Z, Zhang Y, Xia S, Kong Q, Li S, Liu
X, Junqueira C, Meza-Sosa KF, Mok TMY, Ansara J, et al: Gasdermin E
suppresses tumour growth by activating anti-tumour immunity.
Nature. 579:415–420. 2020. View Article : Google Scholar : PubMed/NCBI
|
|
30
|
Bai Y, Pan Y and Liu X: Mechanistic
insights into gasdermin-mediated pyroptosis. Nat Rev Mol Cell Biol.
26:501–521. 2025. View Article : Google Scholar : PubMed/NCBI
|
|
31
|
Gogleva A, Polychronopoulos D, Pfeifer M,
Poroshin V, Ughetto M, Martin MJ, Thorpe H, Bornot A, Smith PD,
Sidders B, et al: Knowledge graph-based recommendation framework
identifies drivers of resistance in EGFR mutant non-small cell lung
cancer. Nat Commun. 13:16672022. View Article : Google Scholar : PubMed/NCBI
|
|
32
|
Guler GD, Tindell CA, Pitti R, Wilson C,
Nichols K, KaiWai Cheung T, Kim HJ, Wongchenko M, Yan Y, Haley B,
et al: Repression of stress-induced LINE-1 expression protects
cancer cell subpopulations from lethal drug exposure. Cancer Cell.
32:221–237.e13. 2017. View Article : Google Scholar : PubMed/NCBI
|
|
33
|
Rusan M, Li K, Li Y, Christensen CL,
Abraham BJ, Kwiatkowski N, Buczkowski KA, Bockorny B, Chen T, Li S,
et al: Suppression of adaptive responses to targeted cancer therapy
by transcriptional repression. Cancer Discov. 8:59–73. 2018.
View Article : Google Scholar : PubMed/NCBI
|
|
34
|
Raoof S, Mulford IJ, Frisco-Cabanos H,
Nangia V, Timonina D, Labrot E, Hafeez N, Bilton SJ, Drier Y, Ji F,
et al: Targeting FGFR overcomes EMT-mediated resistance in EGFR
mutant non-small cell lung cancer. Oncogene. 38:6399–6413. 2019.
View Article : Google Scholar : PubMed/NCBI
|
|
35
|
Liberzon A, Birger C, Thorvaldsdóttir H,
Ghandi M, Mesirov JP and Tamayo P: The molecular signatures
database (MSigDB) hallmark gene set collection. Cell Syst.
1:417–425. 2015. View Article : Google Scholar : PubMed/NCBI
|
|
36
|
Posta M and Győrffy B: Pathway-level
mutational signatures predict breast cancer outcomes and reveal
therapeutic targets. Br J Pharmacol. 182:5734–5747. 2025.
View Article : Google Scholar : PubMed/NCBI
|
|
37
|
Bartha Á and Győrffy B: TNMplot.com: A web
tool for the comparison of gene expression in normal, tumor and
metastatic tissues. Int J Mol Sci. 22:26222021. View Article : Google Scholar : PubMed/NCBI
|
|
38
|
Livak KJ and Schmittgen TD: Analysis of
relative gene expression data using real-time quantitative PCR and
the 2(−Delta Delta C(T)) method. Methods. 25:402–408. 2001.
View Article : Google Scholar : PubMed/NCBI
|
|
39
|
Zheng S, Wang W, Aldahdooh J, Malyutina A,
Shadbahr T, Tanoli Z, Pessia A and Tang J: SynergyFinder plus:
Toward better interpretation and annotation of drug combination
screening datasets. Genomics Proteomics Bioinformatics. 20:587–596.
2022. View Article : Google Scholar : PubMed/NCBI
|
|
40
|
Izumi M, Costa DB and Kobayashi SS:
Targeting of drug-tolerant persister cells as an approach to
counter drug resistance in non-small cell lung cancer. Lung Cancer.
194:1078852024. View Article : Google Scholar : PubMed/NCBI
|
|
41
|
Zheng HC, Xue H, Zhang CY, Shi KH and
Zhang R: The roles of BTG1 mRNA expression in cancers: A
bioinformatics analysis. Front Genet. 13:10066362022. View Article : Google Scholar : PubMed/NCBI
|
|
42
|
Shatnawi A, Abu Rabe DI and Frigo DE:
Roles of the tumor suppressor inhibitor of growth family member 4
(ING4) in cancer. Adv Cancer Res. 152:225–262. 2021. View Article : Google Scholar : PubMed/NCBI
|
|
43
|
Gaviraghi M, Vivori C, Pareja Sanchez Y,
Invernizzi F, Cattaneo A, Santoliquido BM, Frenquelli M, Segalla S,
Bachi A, Doglioni C, et al: Tumor suppressor PNRC1 blocks rRNA
maturation by recruiting the decapping complex to the nucleolus.
EMBO J. 37:e991792018. View Article : Google Scholar : PubMed/NCBI
|
|
44
|
Jordanovski D, Herwartz C, Pawlowski A,
Taute S, Frommolt P and Steger G: The hypoxia-inducible
transcription factor ZNF395 is controlled by IĸB kinase-signaling
and activates genes involved in the innate immune response and
cancer. PLoS One. 8:e749112013. View Article : Google Scholar : PubMed/NCBI
|
|
45
|
Kim SH, Jung IR and Hwang SS: Emerging
role of anti-proliferative protein BTG1 and BTG2. BMB Rep.
55:380–388. 2022. View Article : Google Scholar : PubMed/NCBI
|
|
46
|
Xue K, Wu JC, Li XY, Li R, Zhang QL, Chang
JJ, Liu YZ, Xu CH, Zhang JY, Sun XJ, et al: Chidamide triggers
BTG1-mediated autophagy and reverses the chemotherapy resistance in
the relapsed/refractory B-cell lymphoma. Cell Death Dis.
12:9002021. View Article : Google Scholar : PubMed/NCBI
|
|
47
|
Thompson Z, Anderson GA, Hernandez M,
Alfaro Quinde C, Marchione A, Rodriguez M, Gabriel S, Binder V,
Taylor AM and Kathrein KL: Ing4-deficiency promotes a quiescent yet
transcriptionally poised state in hematopoietic stem cells.
iScience. 27:1105212024. View Article : Google Scholar : PubMed/NCBI
|
|
48
|
Archambeau J, Blondel A and Pedeux R:
Focus-ING on DNA integrity: Implication of ING proteins in cell
cycle regulation and DNA repair modulation. Cancers (Basel).
12:582019. View Article : Google Scholar : PubMed/NCBI
|
|
49
|
Shen X, Peng X, Guo Y, Dai Z, Cui L, Yu W,
Liu Y and Liu CY: YAP/TAZ enhances P-body formation to promote
tumorigenesis. Elife. 12:RP885732024. View Article : Google Scholar : PubMed/NCBI
|
|
50
|
Kumar K, Chidambaram R, Parashar S and
Ferro-Novick S: RTN3L and CALCOCO1 function in parallel to maintain
proteostasis in the endoplasmic reticulum. Autophagy. 20:2067–2075.
2024. View Article : Google Scholar : PubMed/NCBI
|
|
51
|
Hoyer MJ, Capitanio C, Smith IR, Paoli JC,
Bieber A, Jiang Y, Paulo JA, Gonzalez-Lozano MA, Baumeister W,
Wilfling F, et al: Combinatorial selective ER-phagy remodels the ER
during neurogenesis. Nat Cell Biol. 26:378–392. 2024. View Article : Google Scholar : PubMed/NCBI
|
|
52
|
Ramirez M, Rajaram S, Steininger RJ,
Osipchuk D, Roth MA, Morinishi LS, Evans L, Ji W, Hsu CH, Thurley
K, et al: Diverse drug-resistance mechanisms can emerge from
drug-tolerant cancer persister cells. Nat Commun. 7:106902016.
View Article : Google Scholar : PubMed/NCBI
|
|
53
|
Hata AN, Niederst MJ, Archibald HL,
Gomez-Caraballo M, Siddiqui FM, Mulvey HE, Maruvka YE, Ji F, Bhang
HE, Krishnamurthy Radhakrishna V, et al: Tumor cells can follow
distinct evolutionary paths to become resistant to epidermal growth
factor receptor inhibition. Nat Med. 22:262–269. 2016. View Article : Google Scholar : PubMed/NCBI
|
|
54
|
Russo M, Chen M, Mariella E, Peng H,
Rehman SK, Sancho E, Sogari A, Toh TS, Balaban NQ, Batlle E, et al:
Cancer drug-tolerant persister cells: From biological questions to
clinical opportunities. Nat Rev Cancer. 24:694–717. 2024.
View Article : Google Scholar : PubMed/NCBI
|
|
55
|
Hangauer MJ, Viswanathan VS, Ryan MJ, Bole
D, Eaton JK, Matov A, Galeas J, Dhruv HD, Berens ME, Schreiber SL,
et al: Drug-tolerant persister cancer cells are vulnerable to GPX4
inhibition. Nature. 551:247–250. 2017. View Article : Google Scholar : PubMed/NCBI
|
|
56
|
Li Y, Chen H, Xie X, Yang B, Wang X, Zhang
J, Qiao T, Guan J, Qiu Y, Huang YX, et al: PINK1-mediated mitophagy
promotes oxidative phosphorylation and redox homeostasis to induce
drug-tolerant persister cancer cells. Cancer Res. 83:398–413. 2023.
View Article : Google Scholar : PubMed/NCBI
|
|
57
|
Yang C, Wang ZQ, Zhang ZC, Lou G and Jin
WL: CBL0137 activates ROS/BAX signaling to promote
caspase-3/GSDME-dependent pyroptosis in ovarian cancer cells.
Biomed Pharmacother. 161:1145292023. View Article : Google Scholar : PubMed/NCBI
|
|
58
|
Stefanowicz-Hajduk J, Sparzak-Stefanowska
B, Krauze-Baranowska M and Ochocka JR: Securinine from phyllanthus
glaucus induces cell cycle arrest and apoptosis in human cervical
cancer HeLa cells. PLoS One. 11:e01653722016. View Article : Google Scholar : PubMed/NCBI
|
|
59
|
Zhang LN, Zhou HY, Fu YY, Li YY, Wu F, Gu
M, Wu LY, Xia CM, Dong TC, Li JY, et al: Novel small-molecule
PGC-1α transcriptional regulator with beneficial effects on
diabetic db/db mice. Diabetes. 62:1297–1307. 2013. View Article : Google Scholar : PubMed/NCBI
|
|
60
|
Duan Y, Wang S, Liu J, Qin W, Shen Y, Hou
Y, Sun X, Lin Y, Hu Z, Dong B, et al: INSIG1/2 succination mediated
by the moonlighting function of ADSL promotes lipogenesis and liver
tumorigenesis. Nat Commun. 17:40022026. View Article : Google Scholar : PubMed/NCBI
|
|
61
|
Lee NH, Choi MJ, Ji SM, Kwak HJ and Cheon
HG: Adapalene, an RAR agonist, exerts anti-inflammatory effects by
regulating macrophage polarization through RAR[Formula: See
text]-mediated signaling pathways. Sci Rep. 16:113852026.
View Article : Google Scholar : PubMed/NCBI
|
|
62
|
Zhao JC, Agarwal S, Ahmad H, Amin K,
Bewersdorf JP and Zeidan AM: A review of FLT3 inhibitors in acute
myeloid leukemia. Blood Rev. 52:1009052022. View Article : Google Scholar : PubMed/NCBI
|
|
63
|
Weikum ER, Okafor CD, D'Agostino EH,
Colucci JK and Ortlund EA: Structural analysis of the
glucocorticoid receptor ligand-binding domain in complex with
triamcinolone acetonide and a fragment of the atypical coregulator,
small heterodimer partner. Mol Pharmacol. 92:12–21. 2017.
View Article : Google Scholar : PubMed/NCBI
|
|
64
|
Mascarello RB, Faverzani JL, Lopes FF,
Tedesco LMB, Böttcher AK, Wajner M and Vargas CR: Nitisinone
treatment protect hereditary tyrosinemia type I patients against
inflammation, DNA and protein oxidative damage by decreasing
succinylacetone levels. Metab Brain Dis. 40:2752025. View Article : Google Scholar : PubMed/NCBI
|
|
65
|
Encarnación-Rosado J, Sohn ASW, Biancur
DE, Lin EY, Osorio-Vasquez V, Rodrick T, González-Baerga D, Zhao E,
Yokoyama Y, Simeone DM, et al: Targeting pancreatic cancer
metabolic dependencies through glutamine antagonism. Nat Cancer.
5:85–99. 2024. View Article : Google Scholar : PubMed/NCBI
|
|
66
|
Hassan RA, Emam SH, Mikhail DS, Hassanin
SO, Khalil MG, Abdou AM and Osman EO: Design, synthesis, and
evaluation of antipyrine and nicotinic acid derivatives as
anti-inflammatory agents: In vitro and in vivo studies. Bioorg Med
Chem. 132:1184392026. View Article : Google Scholar : PubMed/NCBI
|
|
67
|
Yano T, Kassovska-Bratinova S, Teh JS,
Winkler J, Sullivan K, Isaacs A, Schechter NM and Rubin H:
Reduction of clofazimine by mycobacterial type 2 NADH:quinone
oxidoreductase: A pathway for the generation of bactericidal levels
of reactive oxygen species. J Biol Chem. 286:10276–10287. 2011.
View Article : Google Scholar : PubMed/NCBI
|
|
68
|
Löscher W and Kaila K: CNS pharmacology of
NKCC1 inhibitors. Neuropharmacology. 205:1089102022. View Article : Google Scholar : PubMed/NCBI
|