Introduction
Polycystic ovary syndrome (PCOS) is a prevalent
endocrine and metabolic disorder among women of reproductive age,
with a global occurrence estimated at approximately 15–20%,
contingent upon the diagnostic criteria employed (1). Clinically, PCOS is characterized by
androgen excess, ovulatory dysfunction, and polycystic ovarian
morphology. A significant proportion of affected individuals also
display metabolic abnormalities, with roughly 70% exhibiting
insulin resistance (IR), which may elevate the risk of
dyslipidemia, obesity, and type 2 diabetes (2). Moreover, PCOS is associated with a
range of conditions including infertility, metabolic syndrome,
impaired glucose tolerance, type 2 diabetes, cardiovascular
disease, depression, obstructive sleep apnea (OSA), endometrial
cancer, and metabolic dysfunction-associated steatotic liver
disease (MASLD) (3).
Obesity represents a significant factor that
exacerbates all hormonal and metabolic characteristics of PCOS, and
its prevalence is rising globally (4). Obesity-induced insulin resistance,
characterized by impaired cellular response to insulin signaling,
is considered a primary mechanism underpinning metabolic
complications associated with PCOS (5). Hyperinsulinemia, initially arising as
a compensatory response to insulin resistance, has been reported to
promote hyperandrogenemia and visceral adipose tissue (VAT)
dysfunction. Prolonged exposure to hyperinsulinemia contributes to
β-cell stress and eventual dysfunction (6). This phenomenon is frequently
accompanied by a reduction in hepatic SHBG levels in
insulin-resistant PCOS (7), which
is attributed to insulin directly stimulating steroidogenesis in
ovarian Theca cells via PI3K-dependent activation of
17α-hydroxylase (8). Furthermore,
oxidative stress and inflammation may diminish insulin signaling
and augment androgen excess, thereby potentially leading to
metabolic and reproductive disturbance in PCOS (9).
Given that the precise etiologies of PCOS remain
elusive, there is a need for experimental models that replicate all
reproductive and metabolic alterations associated with PCOS
(10). The in vivo model
induced by letrozole (LET) is widely used as a control for
assessing relevant physiological responses. LET, an aromatase
inhibitor, inhibits the conversion of androgens to estrogens,
resulting in persistent hyperandrogenemia and anovulation, which
mirror the primary endocrine symptoms of PCOS (11). Nevertheless, while the LET-induced
PCOS model predominantly mimics reproductive disturbances,
metabolic phenotypes such as insulin resistance and hepatic
steatosis may be less severe than those observed with
obesity-associated PCOS (12).
Recent evidence indicates that the addition of a high-fat diet
(HFD) to LET-induced PCOS yields an in vivo phenotype more
akin to obesity-associated PCOS, characterized by in increased body
mass, elevated testosterone levels, more profound impairment of
glucose and lipid metabolism, and exacerbated insulin resistance
compared to LET administration alone (13). Moreover, under these combined
conditions, decreased phosphorylation of proteins involved in
insulin signaling pathways, such as insulin receptor (INSR)/insulin
receptor substrate (IRS)/phosphoinositide 3-kinase (PI3K)/protein
kinase B (AKT) and extracellular signal-regulated kinase 1/2
(ERK1/2) was observed not only in typical insulin-sensitive tissues
but also in the ovaries, suggesting a potential mechanistic link
between systemic metabolic stress and ovarian dysfunction (13).
Various studies employing HFD+LET rats have
demonstrated that this combined model exhibits more severe
metabolic disturbances and a more detrimental inflammatory and
oxidative stress environment compared with the LV group.
Administration of HFD in LET-induced PCOS mice resulted in elevated
fasting insulin and blood glucose levels, increased HOMA-IR and
triglycerides, heightened testosterone and malondialdehyde (MDA)
levels, and a reduction in high-density lipoprotein (HDL)
cholesterol. These changes exacerbate insulin resistance,
dyslipidemia, and oxidative stress (14). Furthermore, the combination of HFD
and LET provoked significant oxidative stress and inflammatory
responses, culminating in the most profound impairment in metabolic
and hormonal parameters, along with heightened expression of
inflammatory genes and oxidative stress markers (15). Based on prior research, the HFD+LET
model more accurately stimulates obesity-related PCOS and is
valuable for investigating tissue-level molecular pathways linking
metabolic dysfunction to ovarian pathology. Nevertheless, despite
advancements in model development, there remains a paucity of
evidence concerning rat models that concurrently encompass
obesity-related metabolic disturbances and ovarian pathology.
Consequently, the objective of this study is to develop a rat model
that more faithfully mirrors the clinical manifestation of
obesity-related PCOS by incorporating metabolic stress factor such
as an HFD, and to perform multi-organ assessments of the liver,
VAT, pancreas, and ovaries to explore the evaluate the potential
utility of targeting the metabolic-reproductive axis in preclinical
PCOS research.
An unbalanced diet is a major environmental factor
affecting the onset and exacerbation of PCOS. To emulate this
condition in preclinical research, rodents are frequently
administered a HFD to induce obesity and insulin resistance,
thereby replicating associated metabolic characteristics (5). These findings suggest that the
combined effect of elevated fat intake and hyperandrogenemia may
compound adverse metabolic and reproductive outcomes, indicating
that disruption in insulin signaling and inflammation in metabolic
tissues could underpin the pathophysiology, as suggested by
(16). Nevertheless, the molecular
mechanism by which metabolic stress precipitates ovarian
dysfunction under these combined conditions remains insufficiently
understood. The liver, adipose tissue, and ovaries engage in
complex interactions, with insulin signaling pathways such as
IRS-1/AKT/glucose transporter 4 (GLUT4) recognized as critical
components of this relationship (8). Additionally, the pancreas may serve
as a pivotal nexus within this axis, since insulin secretion in
response to chronic metabolic stress can result in pancreatic
β-cell dysfunction, thereby intensifying systemic insulin
resistance and ovarian dysfunction, as indicated by (17).
Therefore, in this study, we hypothesized that the
combination of a HFD and LET administration would exacerbate
impaired insulin signaling in key metabolic tissues, resulting in a
concomitant aggravation of metabolic disorders and ovarian lesions.
Accordingly, we seek to evaluate how HFD exacerbates metabolic
dysfunction and ovarian lesions, elucidate the
metabolic-reproductive axis, and confirm the role of insulin
resistance in PCOS within the context of obesity. Furthermore, our
objectives include not only establishing a rat model of PCOS but
also to clarify how tissue-level impairment of insulin signaling is
associated with reproductive abnormalities.
Materials and methods
Animal experimental design
Seven-week-old female Sprague-Dawley (SD) rats were
purchased from Samtako (Osan, Korea). They were housed under
conditions of 23±2°C, 50±10% humidity, and a 12-h light and dark
cycle. They had free access to food and water. After 1 week of
adaptation, rats were randomly assigned to three groups (n=8):
control (CON), LET-induced PCOS with normal diet (LV), and
LET-induced PCOS with HFD (HLV). The CON group received oral
administration of distilled water once daily for 7 weeks. The LV
and HLV groups received oral administration of LET (112809-51-5,
MCE, New Jersey, USA) at a concentration of 1 mg/kg, suspended in
1% carboxymethylcellulose (CMC, 9004-32-4, DuKSAN, Yongin, Korea)
once daily for 7 weeks to induce PCOS. The HLV group was fed a HFD
(60 kcal% fat, 20 kcal% carbohydrate, and 20 kcal% protein, total
5.24 kcal/g, D12492, Samtako, Osan, Korea) for 7 weeks, while the
remaining groups were fed a normal diet. Upon completion of the
experiment, the rats were placed in a clean chamber for the
euthanasia procedure. The CO2 concentration was
gradually increased to 30%; once this level was reached, the rats
were allowed to lose consciousness before blood was collected by
cardiac puncture, followed by euthanasia via cervical dislocation.
Subsequently, the ovaries, uterus, liver, pancreas, and VAT were
harvested. The collected blood was centrifuged at 12,000 × g for 15
min to separate the serum, which was then stored at −80°C. All
procedures were approved by the Woosuk University Institutional
Animal Care and Use Committee (approval no. WS-2024-04; Jeonju,
South Korea).
Metabolic measurements
Body weight was recorded weekly during the
experiment. For the oral glucose tolerance test (OGTT), rats were
fasted for 12 h before the test, and then 2 g/kg of D-glucose was
orally administered. Blood glucose was measured via tail vein blood
at 0, 30, 60, 90, and 120 min after the test. Furthermore, for
fasting blood glucose measurement before necropsy, blood glucose
was measured using a portable blood glucose meter after a 12-h
fast.
Serum biochemical parameters
Serum aspartate aminotransferase (AST), alanine
aminotransferase (ALT), triglycerides (TG), total cholesterol (TC),
and high-density lipoprotein cholesterol (HDL-c) levels were
measured using commercially available kits (Fujifilm, Tokyo, Japan)
according to the manufacturer's instructions. Low-density
lipoprotein cholesterol (LDL-c) levels were calculated according to
the manufacturer's instructions. Absorbance was measured using a
DRI-CHEM NX500 analyzer (Fujifilm, Tokyo, Japan).
Histopathological examination
Tissue samples (liver, pancreas, VAT, ovary, and
uterus) were fixed in 10% neutral buffered formalin, embedded in
paraffin, and then sectioned at 4 µm thickness using a Micro-Tome
(HM325, Epredia, Michigan, USA). Three sections per animal were
analyzed for each tissue. The sections were stained with
hematoxylin and eosin (H&E) and examined under a light
microscope (Eclipse Ci-L Plus, Nikon, Tokyo, Japan). For ovarian
histology, H&E-stained sections were used to identify and count
corpora lutea, cystic follicles, and atretic follicles was measured
at ×40 magnification. Morphometric parameters (corpus luteum
volume, cystic follicle volume and ovarian volume) were also
measured using H&E images. For VAT, adipocyte diameter was
measured at ×200 magnification, and hepatic steatosis and liver
injury were assessed using Kleiner's non-alcoholic fatty liver
disease (NAFLD; now referred to as MASLD) activity score (18) modified to include the sum of four
histological components: Steatosis (0–3), lobular inflammation
(0–3), hepatocyte ballooning (0–2), and fibrosis stage (0–4),
yielding a total score ranging from 0 to 12 (Table I).
 | Table I.Histopathology score of hepatic
lesions. |
Table I.
Histopathology score of hepatic
lesions.
| Histological
criteria | Score |
|---|
| Steatosis |
|
|
<5% | 0 |
|
5–33% | 1 |
|
>34–66% | 2 |
|
>66% | 3 |
| Inflammation |
|
| No
foci | 0 |
| <2
foci/x200 | 1 |
| 2–4
foci/x200 | 2 |
| >4
foci/x200 | 3 |
| Hepatocyte
ballooning |
|
|
None | 0 |
| Few
balloon cells | 1 |
|
Prominent ballooning | 2 |
| Fibrosis stage |
|
|
None | 0 |
| Perisinusoidal or
periportal | 1 |
| Perisinusoidal and
portal/periportal | 2 |
|
Bridging fibrosis | 3 |
|
Cirrhosis | 4 |
Immunofluorescence (IF) staining
Paraffin-embedded ovarian and pancreatic tissues
were incubated with insulin (rabbit), anti-Müllerian hormone (AMH)
(mouse), and cytochrome P450 family 19 subfamily A member 1
(CYP19A1) (rabbit) antibodies (Santa Cruz Biotechnology, Dallas,
TX, USA) at a 1:500 dilution, followed by Alexa Fluor 488 and
594-conjugated rabbit and mouse IgG antibodies (Invitrogen, Thermo
Fisher Scientific, Waltham, MA, USA) at a 1:1,000 dilution.
Sections were then mounted using DAPI-containing mounting solution
(H-1500-10, Vector Laboratories, CA, USA). Images were captured
using an EVOS M5000 Imaging System (Thermo Fisher Scientific).
Fluorescence intensity was quantified using ImageJ software (NIH,
USA). Regions of interest (ROIs) were manually defined around
pancreatic islets, and mean fluorescence intensity was measured
after background subtraction. All images were captured using
identical exposure settings. For each animal, non-overlapping
fields were analyzed and averaged.
TUNEL assay
Apoptosis was assessed using the DeadEnd™
Fluorometric TUNEL System (G3250, Promega, WI, USA). Pancreatic
sections were deparaffinized with xylene, rehydrated with ethanol,
and then incubated with 20 µg/ml proteinase K at 37°C for 20 min.
The sections were then washed with PBS. A drop of detection
mixture, prepared according to the manufacturer's instructions, was
added and incubated at 37°C in the dark for 60 min. After washing
again with PBS, the sections were mounted using a mounting medium
containing DAPI (H-1500-10, Vector Laboratories, Newark, CA, USA).
TUNEL-positive nuclei were quantified using ImageJ software (NIH,
Bethesda, MD, USA). Pancreatic islets were manually delineated as
ROI, and DAPI-positive nuclei within each islet ROI were
identified. TUNEL fluorescence intensity was measured within each
nuclear ROI, and nuclei with fluorescence intensity exceeding a
predefined threshold were classified as TUNEL-positive. The same
threshold was applied to all images acquired under identical
exposure settings.
TUNEL-positive cells (%)=number of TUNEL-positive
DAPI nuclei/total number of DAPI-positive nuclei within the islet
ROI ×100.
Non-overlapping pancreatic islet fields per animal
were analyzed, and the averaged percentage was used as the
representative value for each animal.
Reverse transcription-quantitative PCR
analysis of metabolic disorder-related RNA expression in liver and
VAT
Total RNA was extracted from rat liver and VAT.
Briefly, 50 mg of tissues were homogenized in 1 ml of Easy Blue
Reagent (Intron Biotechnology, Seongnam, Korea) containing protease
inhibitor cocktail using a tissue homogenizer (T 10 basic, IKA,
Germany) on ice, then centrifuged at 12,000 × g for 15 min at 4°C,
and the supernatant was collected for RNA extraction using Easy
Blue Reagent (Intron Biotechnology, Seongnam, Korea) according to
the manufacturer's protocol. For each sample, 5 µg of RNA was
reverse transcribed into cDNA using the Prime Script RT Reagent Kit
(TaKaRa Biotech, Dalian, China), and quantitative PCR was performed
using TB Green PCR Master Mix (TaKaRa Biotech, Dalian, China). The
target genes were IRS-1, insulin receptor substrate 2 (IRS-2),
phosphoinositide 3-kinase (PI3K), carnitine palmitoyltransferase 1A
(CPT1a), acyl-CoA oxidase 1 (ACOX1), AKT, GLUT4, insulin receptor
(INSR), sterol regulatory element-binding protein 1c (SREBP-1c),
fatty acid synthase (FAS), acetyl-CoA carboxylase (ACC),
phosphoenolpyruvate carboxykinase (PEPCK), and
glucose-6-phosphatase (G6Pase), with β-actin used as an internal
control. Relative expression levels were calculated using the
2−ΔΔCq method with the CON group as the calibrator
(19) (Table II).
| Table II.List of rat primer sequences used in
quantitative PCR. |
Table II.
List of rat primer sequences used in
quantitative PCR.
| Gene | Forward primer
sequence, 5′-3′ | Reverse primer
sequence, 5′-3′ |
|---|
| β-actin |
TCGTGCGTGACATTAAAGAG |
ATTGCCGATAGTGATGACCT |
| IRS-1 |
GTGGAGTTGAGTTGGGCAGA |
CCTGTCCGCATGTCAGCATA |
| IRS-2 |
TCATACCCAGCCTCATCACTCA |
CTCAGGTCGGCCAACGAT |
| PI3K |
AATACACCTGGTGCTCGACAC |
CCTCTGATCTTGACCCTGAAC |
| INSR |
CAGTGTCGTGATCGGAAGTATT |
CTGAGGTACTCTGGGTTTGAAG |
| AKT |
CAGGCACCCCTTCCTTACAG |
GGTACACCACATCCCTCGAG |
| GLUT4 |
CCAGTATGTTGCGGATGCTATG |
TGGTTTCAGGCACTCTTAGGA |
| CPT1a |
TGGGGAAGAGACAGACACCA |
ATCGTGGTAGAGCCAGACCT |
| ACOX1 |
GGATGGCAGTCCGGAGAATA |
TGGCTTCGAGTGAGGAAGTT |
| SREBP-1c |
GACGACGGAGCCATGGATT |
GGGAAGTCACTGTCTTGGTTGTT |
| FAS |
TCCCAGGTCTTGCCGTGC |
TCGGATGCCTAGGATGTGTGC |
| ACC |
TCCTGCTGCTATTGCTACCCCA |
CAGTCCCAGCGCTCACATAA |
| PEPCK |
GGATGTGGCCAGGATCGAAA |
ATACATGGTGCGGCCTTTCA |
| G6Pase |
TTCCGGTGCTTGAATGTCGT |
GCAAGGTAGATCCGGGACAG |
| TNF |
GTCGTAGCAAACCACCAAGC |
TGTGGGTGAGGAGCACATAG |
| IL-1β |
GGGATGATGACGACCTGCTA |
TGTCGTTGCTTGTCTCTCCT |
| IL-18 |
GACAAAAGAAACCCGCCTG |
ACATCCTTCCATCCTTCACAG |
Statistical analysis
Statistical analyses were performed using GraphPad
Prism 9.0 (GraphPad Software, San Diego, CA, USA). All quantitative
data are presented as mean ± SD, with the exception of the NAFLD
activity score, which owing to its categorical/ordinal nature, is
presented as the median (interquartile range, IQR). Overall
differences among three groups (CON, LV, HLV) were analyzed using
one-way ANOVA, followed by Tukey's post hoc test for all pairwise
comparisons, including CON vs. LV, CON vs. HLV, and LV vs. HLV,
performed for every reported outcome, with the exception of the
NAFLD activity score. For the NAFLD activity score, overall
differences among the three groups were analyzed using the
Kruskal-Wallis test, followed by Dunn's multiple comparisons test
for all pairwise comparisons. For repeated-measures data (body
weight and OGTT time-course curves), a two-way mixed design ANOVA
(group × time) was used, with group as the between-subject factor
and time as within-subject factor, followed by Tukey's multiple
comparisons test performed at every time point for all three
pairwise comparisons, including LV vs. HLV. P<0.05 was
considered to indicate a statistically significant difference.
Results
Metabolic assessment
HFD treatment was associated with changes in body
weight and serum metabolic parameters (Fig. 1). Body weight increased throughout
the experimental period in both the LV and HLV groups. From week 3,
both the LV and HLV groups showed significantly higher body weights
compared with the CON group, with this difference becoming more
pronounced from week 4 onward. By week 8, body weight was
significantly higher in the LV group (330.70±24.06 g) and HLV group
(346.90±40.19 g) compared to the CON group (266.20±19.81 g,
P<0.0001), with no statistically significant difference between
the LV and HLV groups (Fig. 1A).
During the OGTT, glucose levels were elevated in both the LV and
HLV groups compared with the CON group. At 0 min, both the LV and
HLV groups showed significantly higher glucose levels than the CON
group (P<0.05 and P<0.01, respectively). At 30 min, the HLV
group had significantly higher glucose levels than the CON group
(P<0.001) and the LV group (P<0.05). At 60 min, glucose
levels were significantly higher in the LV group than in the CON
group (P<0.05) and further elevated in the HLV group compared
with both the CON (P<0.0001) and LV groups (P<0.01). At 90
and 120 min, the HLV group maintained significantly higher glucose
levels than the CON group (P<0.05), whereas no significant
difference between the LV and HLV groups was observed at these late
time points (Fig. 1B). Fasting
blood glucose levels were also significantly higher in the LV
(169.40±44.77 mg/dl), and HLV (194.10±42.70 mg/dl) groups than in
the CON group (110.10±11.94 mg/dl; P<0.05 and P<0.01), with
no significant difference between the LV and HLV groups (Fig. 1C).
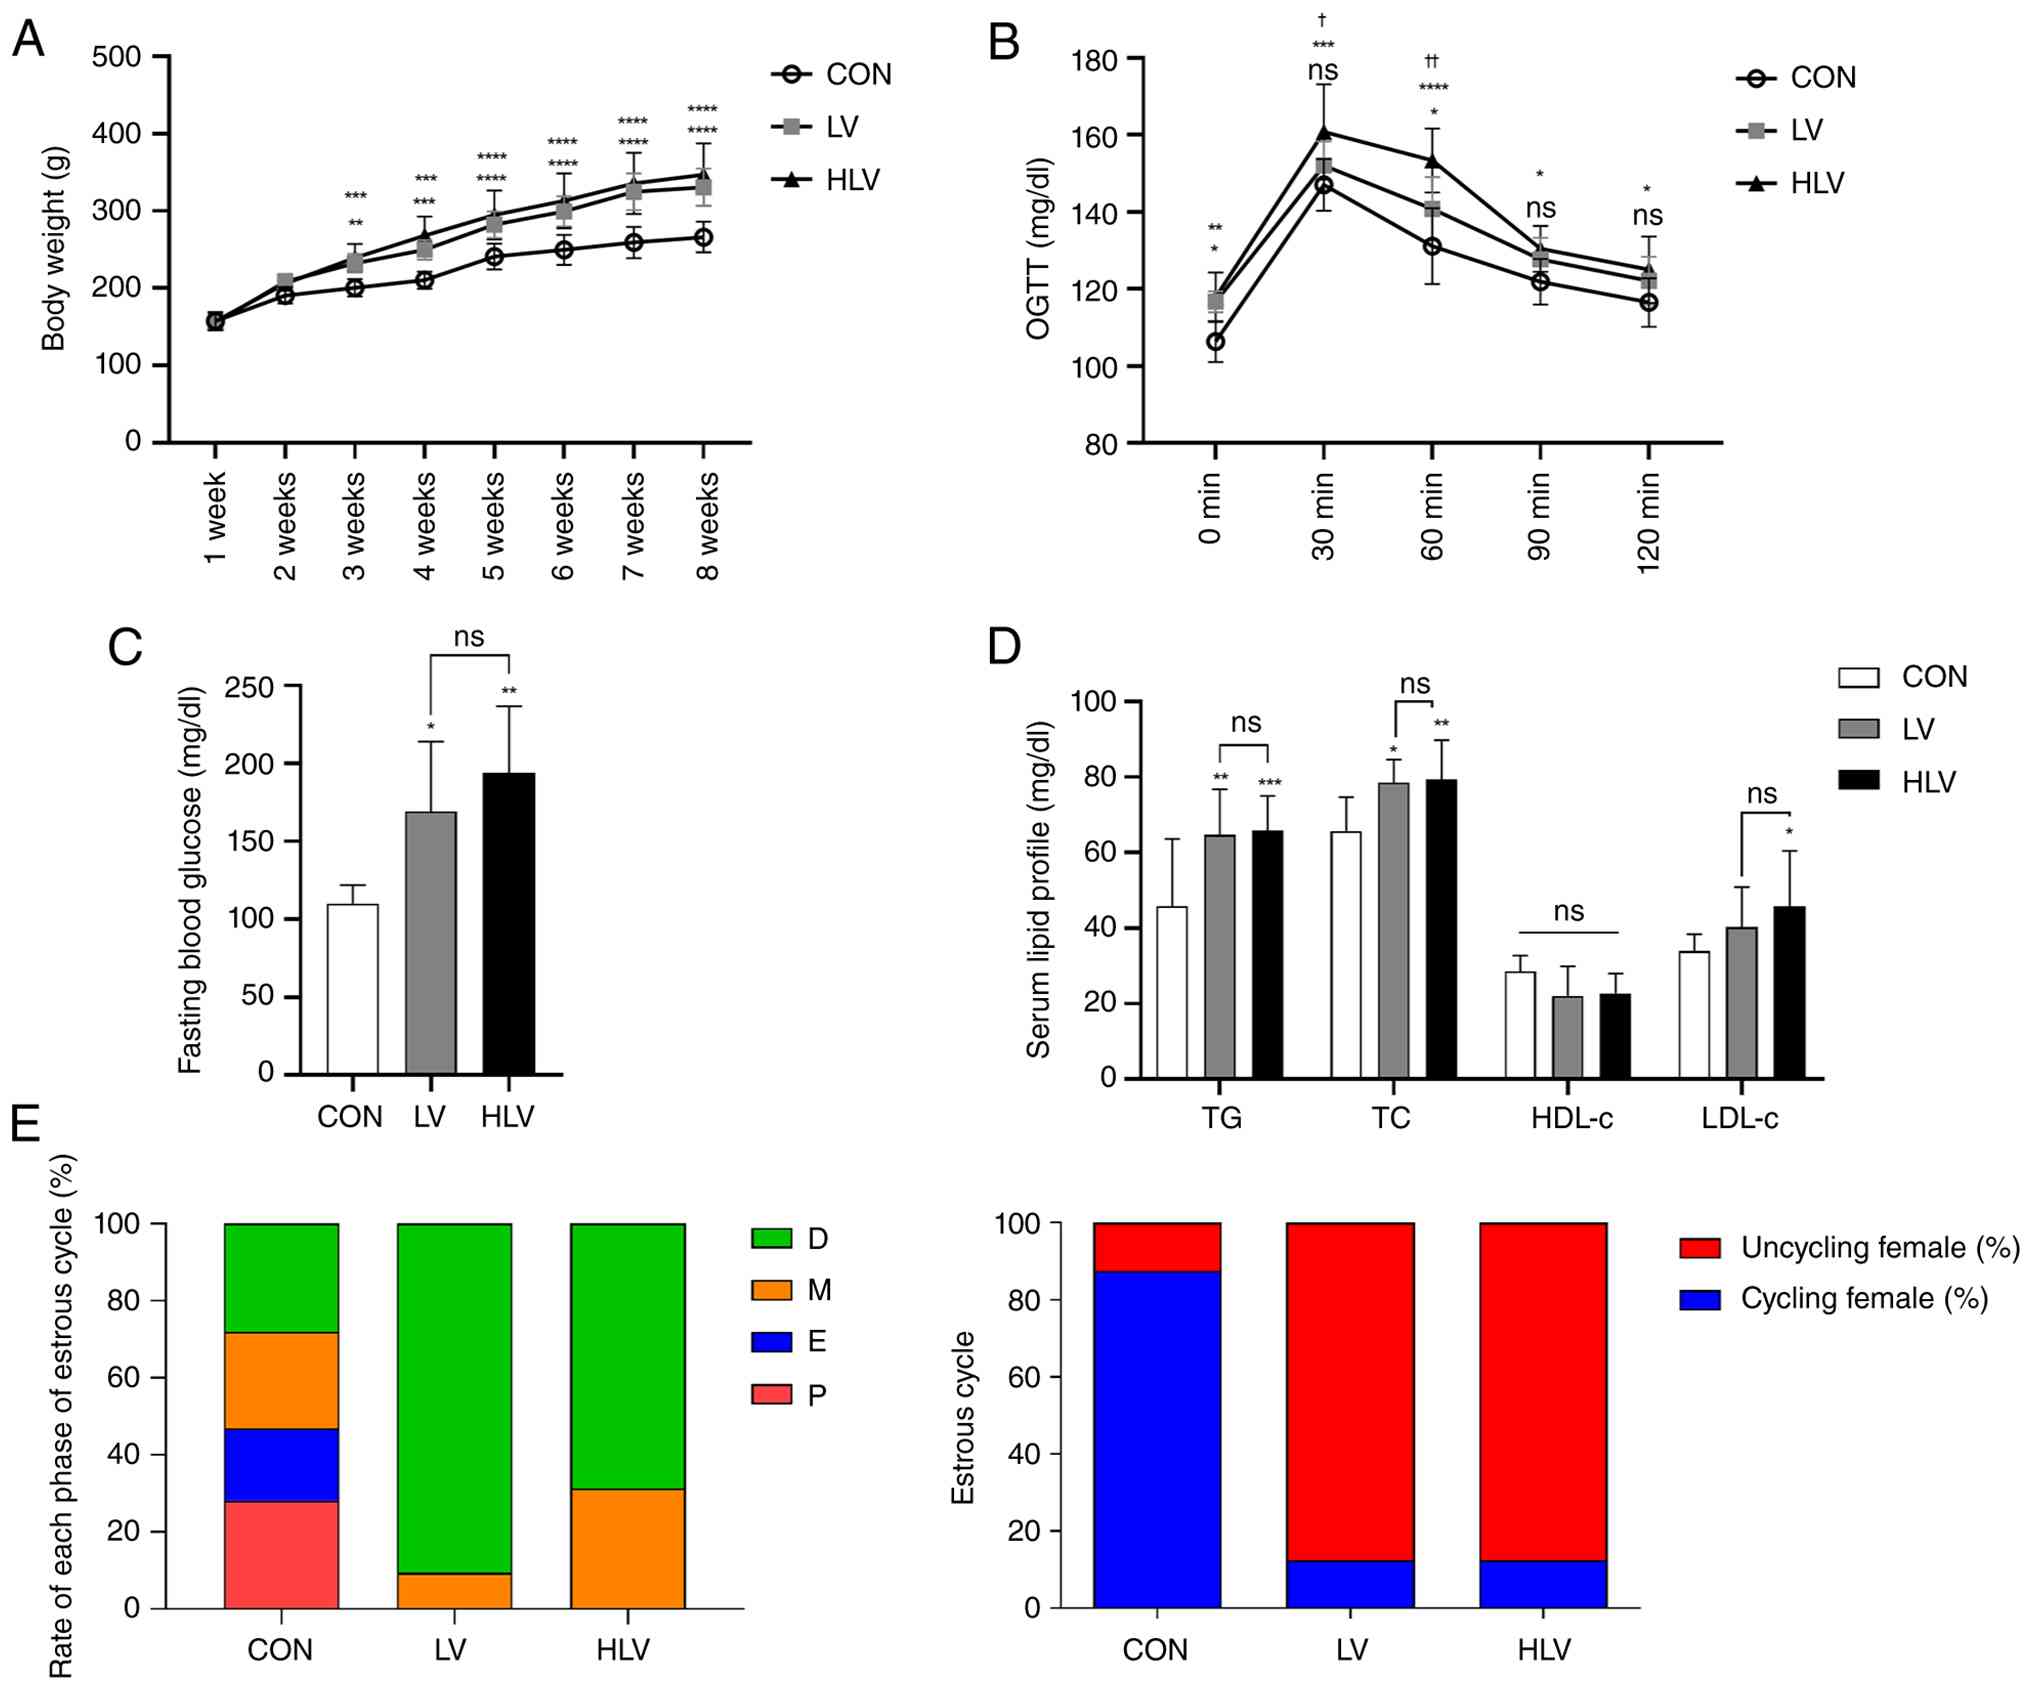 | Figure 1.Metabolic and reproductive
alterations in letrozole and HFD-induced PCOS rats. Rats were
assigned to three groups: CON, normal diet + distilled water
(p.o.); LV, LET (1 mg/kg, p.o.) with normal diet; and HLV, LET (1
mg/kg, p.o.) plus a HFD (60 kcal% fat). (A) Body weight changes
during the experimental period. (B) OGTT responses. (C) Fasting
blood glucose levels. (D) Serum lipid profile, including TG, TC,
HDL-c and LDL-c. (E) Estrous cycle distribution presented as the
ratio of time spent in each phase. Data are expressed as mean ± SD.
*P<0.05, **P<0.01, ***P<0.001 and ****P<0.0001 vs. CON;
†P<0.05 and ††P<0.01 LV vs. HLV; ns,
non-significant pairwise comparisons. D, diestrus; E, estrus;
HDL-c, high-density lipoprotein cholesterol; HFD, high-fat diet;
LDL-c, low-density lipoprotein cholesterol; LET, letrozole; M,
metestrus; OGTT, oral glucose tolerance test; P, proestrus; p.o.,
per os; TC, total cholesterol; TG, triglycerides. |
Serum TG and TC levels were higher in the LV (TG
64.71±14.96 mg/dl; TC 78.5±14.06 mg/dl) and HLV (TG 65.88±11.83
mg/dl; TC 79.38±15.8 mg/dl) groups than in CON (TG 45.8±18.67
mg/dl; TC 65.67±10.39 mg/dl; P<0.05, P<0.01, P<0.001).
HDL-c levels were lower in the LV (22.00±9.25 mg/dl) and HLV
(22.71±6.71 mg/dl) groups than in CON (28.57±4.11 mg/dl), whereas
LDL-c levels were higher in the LV (40.17±15.73 mg/dl) and HLV
(45.75±12.88 mg/dl) groups compared with CON (33.86±4.88 mg/dl;
Fig. 1D). No significant
difference between the LV and HLV groups was observed for any serum
lipid parameter.
Furthermore, analysis of the estrous cycle via
vaginal smear demonstrated regular periodicity in the CON group;
the four phases of the estrous cycles were evenly distributed in
contrast to the LV and HLV groups, which appeared to have ceased
the estrus cycle characterized by a predominant phase at one stage
and a diminished stage in the cycle. Moreover, it was confirmed
that the estrous cycles of the majority of rats in the LV and HLV
groups were disrupted, whereas the CON group exhibited a normal
estrus cycle (Fig. 1E).
Histopathological analysis
Histopathological analysis was conducted to
determine whether metabolic alterations were associated with
anomalies in reproductive tissues (Fig. 2). Gross morphological evaluation
revealed that both the LV and HLV groups exhibited enlarged ovaries
and an increased number of blister counts compared to the CON
group. This resulted in a statistically significant increase in
ovarian weight in the LV group (87.23±22.6 mg) and the HLV group
(89.59±14.2 mg) compared with the CON group (53.53±8.2 mg,
P<0.0001). H&E staining showed normal ovarian morphology in
the CON group, characterized by multiple developing follicles and
multiple corpora lutea. In contrast, both the LV and HLV groups
displayed hallmark features of polycystic ovaries, such as enlarged
follicles and diminished numbers of corpora lutea with the LV group
presenting an average of 4.87±1.2 and the HLV group (4.75±1.0, and
the CON group 9.97±1.8, P<0.001). Additionally, the number of
antral follicles was significantly lower in the LV group (1.25±0.5)
and the HLV group (0.875±0.4) compared to the CON group (3.43±0.9,
P<0.001 and P<0.0001, respectively). The prevalence of cystic
follicles was elevated in the LV (5.5±1.1) and HLV groups
(7.87±2.1) relative to the CON group (1.86±0.6, P<0.01 and
P<0.0001). Atretic follicles were similarly increased in the LV
(1.4±1.34) and HLV groups (2.5±1.22) vs. CON (0.86±0.38, P<0.01)
with the HLV group showing a significant increase compared to the
LV group (P<0.05). Volumetric analysis of corpora lutea and
cystic follicle indicated that luteal volume in the LV group
(177.34±78.42 mm3) was reduced relative to the CON group
(314.50±118.52 mm3, P<0.05). In contrast, the HLV
group exhibited a partial increase (339.12±212.65 mm3).
Cystic follicle volume was significantly higher in the LV
(174.73±82.47 mm3) and HLV groups (158.51±71.36
mm3) compared to the CON group (48.12±38.24
mm3, P<0.05, P<0.01; respectively, Fig. 2A).
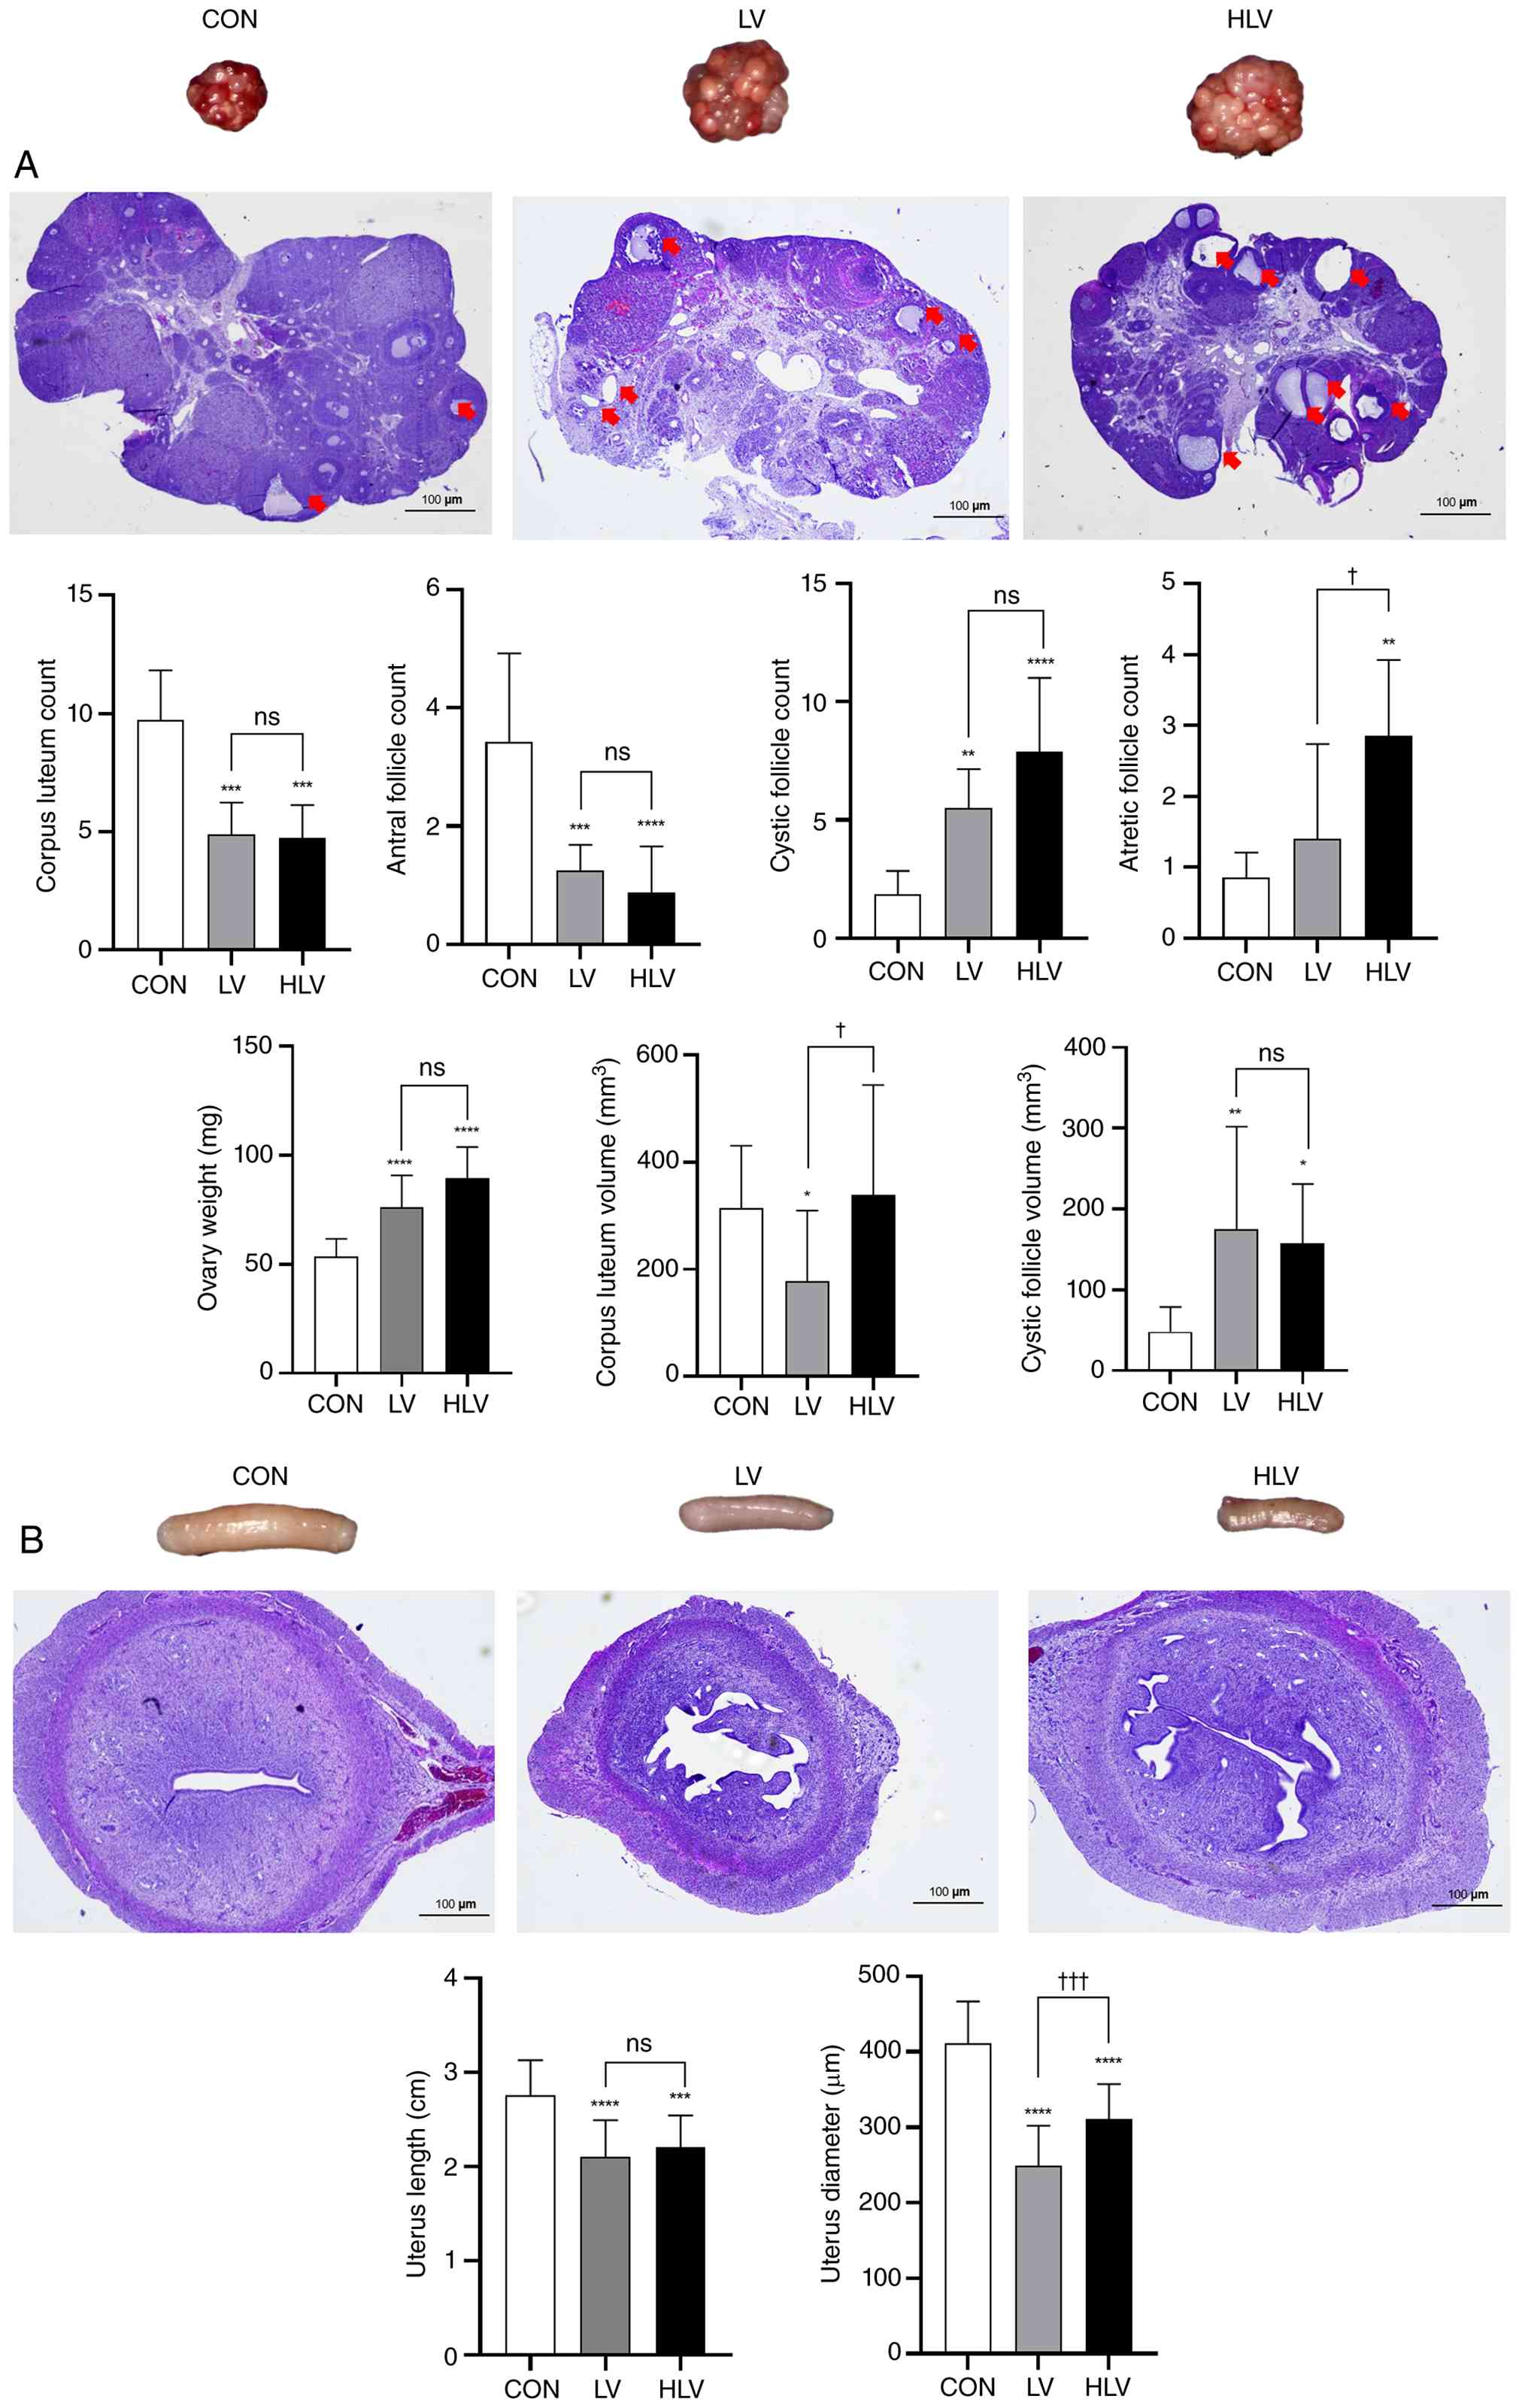 | Figure 2.Ovarian polycystic morphology and
uterine atrophy in letrozole and HFD-induced PCOS rats.
Representative gross morphology and H&E-stained sections of
reproductive tissues are shown for CON, normal diet + distilled
water (p.o.); LV, LET (1 mg/kg, p.o.) with normal diet; and HLV,
LET (1 mg/kg, p.o.) plus a HFD (60 kcal% fat). (A) Ovary: Gross
ovarian appearance, representative H&E images (magnification,
×40; scale bar=100 µm), and quantitative analysis of
follicle-related parameters, including corpus luteum count, antral
follicle count, cystic follicle count, and atretic follicle count,
as well as ovary weight and cystic follicle volume. Red arrows
indicate cystic follicles. (B) Uterus: Gross uterine appearance,
representative H&E images (magnification, ×20; scale bar=100
µm), and quantification of uterus length and uterus diameter. Data
are expressed as mean ± SD. *P<0.05, **P<0.01, ***P<0.001
and ****P<0.0001 vs. CON; †P<0.05 and
†††P<0.001 LV vs. HLV; ns, non-significant pairwise
comparisons. HFD, high-fat diet; LET, letrozole; p.o., per os. |
The gross morphology of the uterus indicated
pronounced uterine atrophy in the LV and HLV groups. Consistently,
uterine length was significantly reduced in the LV (2.10±0.8 cm)
and HLV groups (2.21±0.5 cm) compared with the CON group (2.76±0.4
cm, P<0.001, P<0.0001). Histological examination further
confirmed uterine atrophy. The uterine diameter was significantly
decreased in the LV (249.6±52.69 µm) and HLV groups (310.88±46.56
µm) compared with the CON group (410.84±55.91 µm, P<0.0001),
with the reduction being significantly less pronounced in the HLV
group compared with the LV group (P<0.05; Fig. 2B).
Metabolic structural changes in the liver, pancreas,
and VAT were observed sequentially (Fig. 3). The lobular architecture of the
liver remained intact in the CON group, while mild hepatocyte
cavitation and localized lipid droplets were observed in the LV
group. The HLV group exhibited more widespread fat deposition,
hepatocyte ballooning and increased inflammatory cell infiltration.
MASLD activity scores exhibited a significant increase in both the
LV (4.60±1.53) and HLV groups (6.67±0.52) relative to the CON group
(2.60±1.58, P<0.001, P<0.0001), with the HLV group presenting
a significantly higher MASLD activity score than the LV group
(P<0.05). In the pancreas, the cellular density and arrangement
within the islets appeared relatively uniform in the CON group. In
contrast, the LV and HLV groups exhibited reduced islet size,
increased intercellular spacing, and decreased cell density. In
particular, the HLV group exhibited more irregular islet contours,
with a tendency for the blurred boundaries between islets and
acini. VAT showed clear hypertrophy, with mean adipocyte diameter
increasing from 45.71±5.1 µm in the CON group to 57.38±7.5 µm in
the LV group and further to 79.09±6.8 µm in the HLV group
(P<0.0001), and the HLV group showing a significantly greater
adipocyte diameter compared to the LV group (P<0.0001). Based on
these observations, additional assessment of insulin
immunofluorescence staining in pancreatic sections was
conducted.
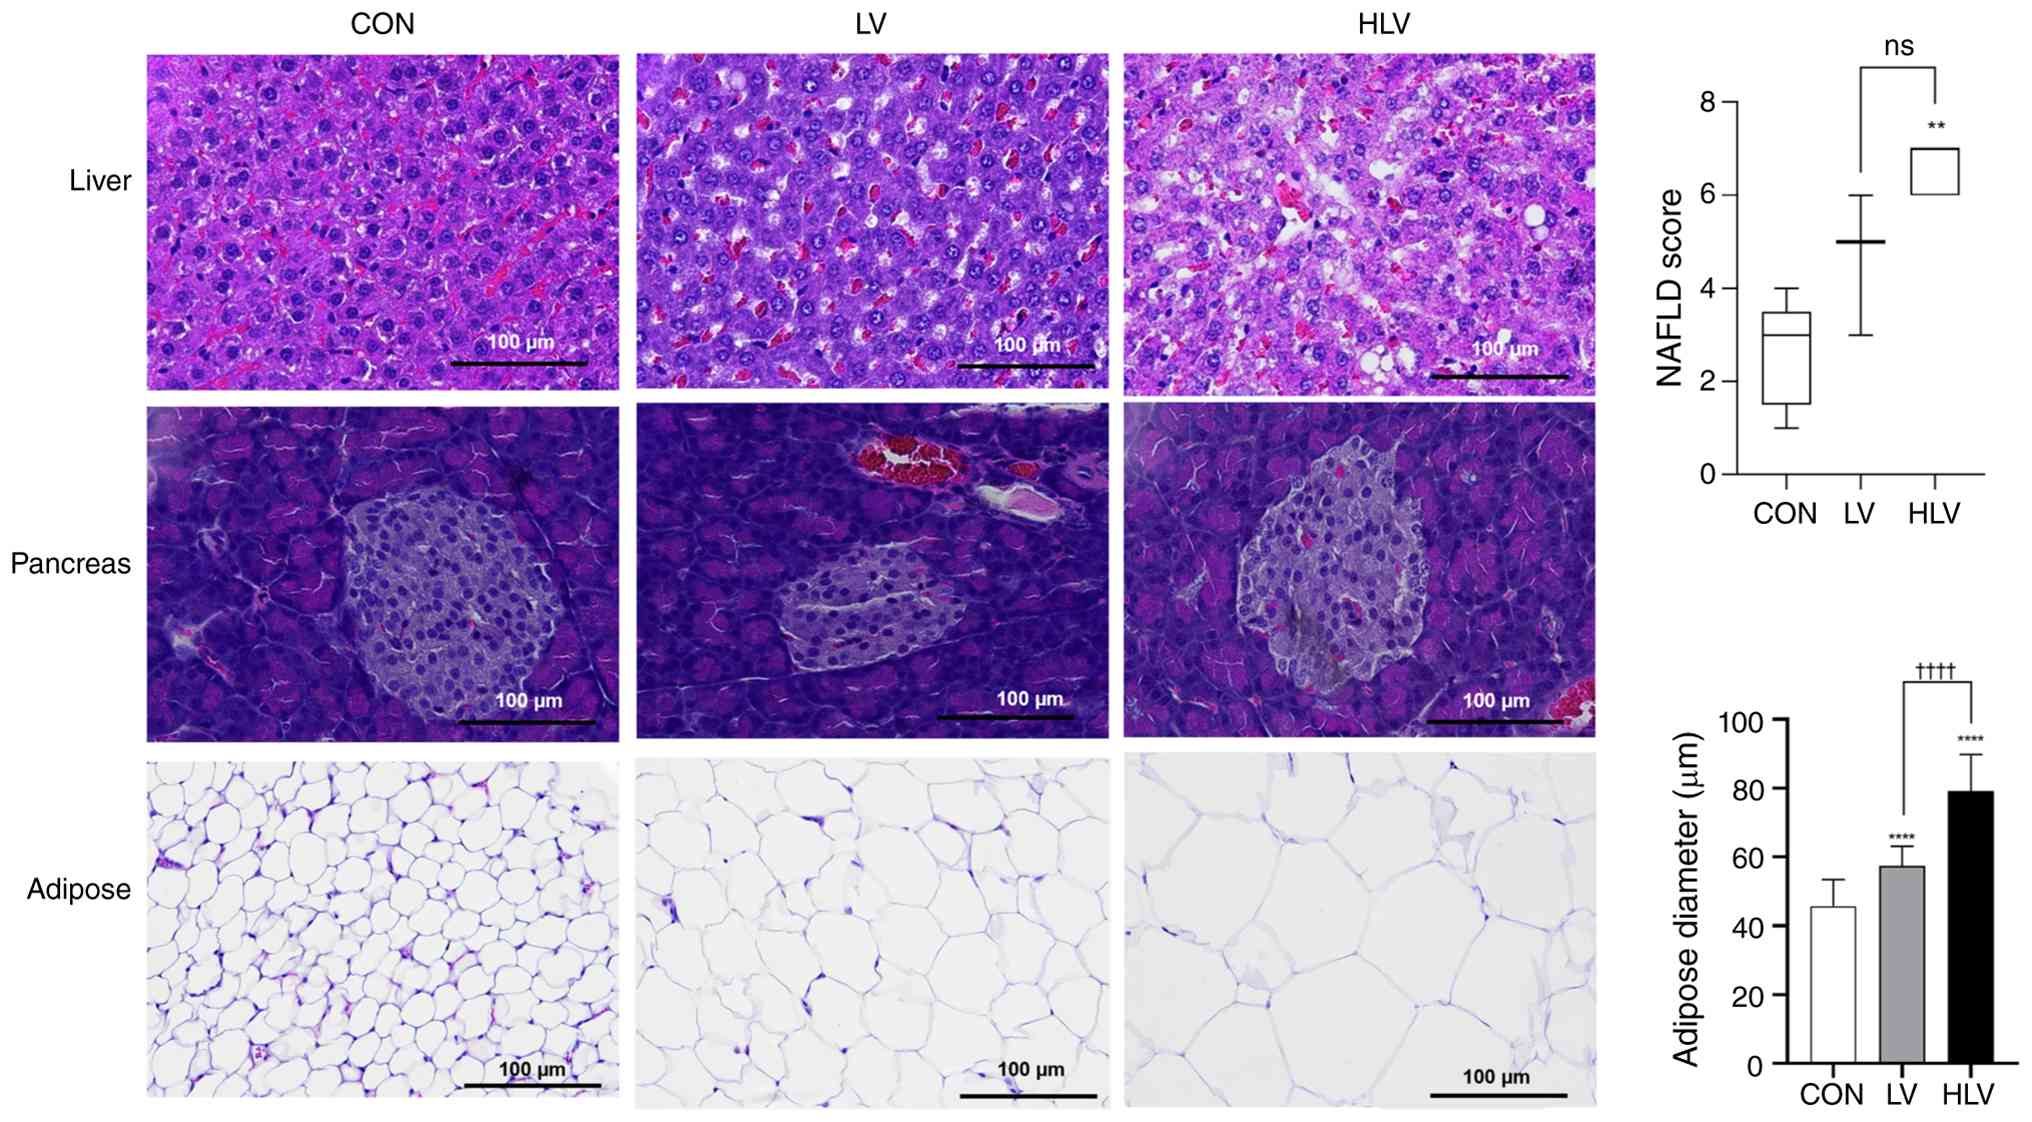 | Figure 3.Effects of letrozole and HFD on
histopathological changes in liver, pancreas, and adipose tissue in
PCOS-induced rats. Rats were assigned to the following groups: CON,
normal diet + distilled water (p.o.); LV, LET (1 mg/kg, p.o.) with
normal diet; and HLV, LET (1 mg/kg, p.o.) plus a HFD (60 kcal%
fat). Representative H&E-stained sections of liver, pancreas,
and VAT from each group are shown (magnification, ×200; scale
bar=100 µm). Quantitative analyses of NAFLD (now referred to as
metabolic dysfunction-associated steatotic liver disease) activity
score are presented as box-and-whisker plots showing the median and
interquartile range, with whiskers indicating the minimum and
maximum values, and were analyzed using the Kruskal-Wallis test
followed by Dunn's multiple comparisons test. VAT diameter data are
expressed as mean ± SD. **P<0.01, ****P<0.0001 vs. CON;
††††P<0.0001 LV vs. HLV; ns, non-significant pairwise
comparisons. HFD, high-fat diet; LET, letrozole; NAFLD,
nonalcoholic fatty liver disease; p.o., per os; VAT, visceral
adipose tissue. |
Pancreatic β-cell alteration and
apoptosis
To evaluate whether metabolic disorders altered
pancreatic β-cells, insulin immunofluorescence staining was
conducted (Fig. 4A). In the CON
group, islets showed strong, uniform insulin-positive staining with
well-defined structural integrity. Conversely, insulin fluorescence
intensity was markedly diminished in both the LV and HLV groups.
Additionally, islets appeared smaller than those in the CON group.
Quantitative analysis revealed a significant reduction in the
proportion of insulin-positive areas in the LV (31.24±3.09) and HLV
(30.98±6.95) groups comparison to the CON group (61.79±5.98,
P<0.0001). No significant difference in insulin-positive area
was observed between the LV and HLV groups.
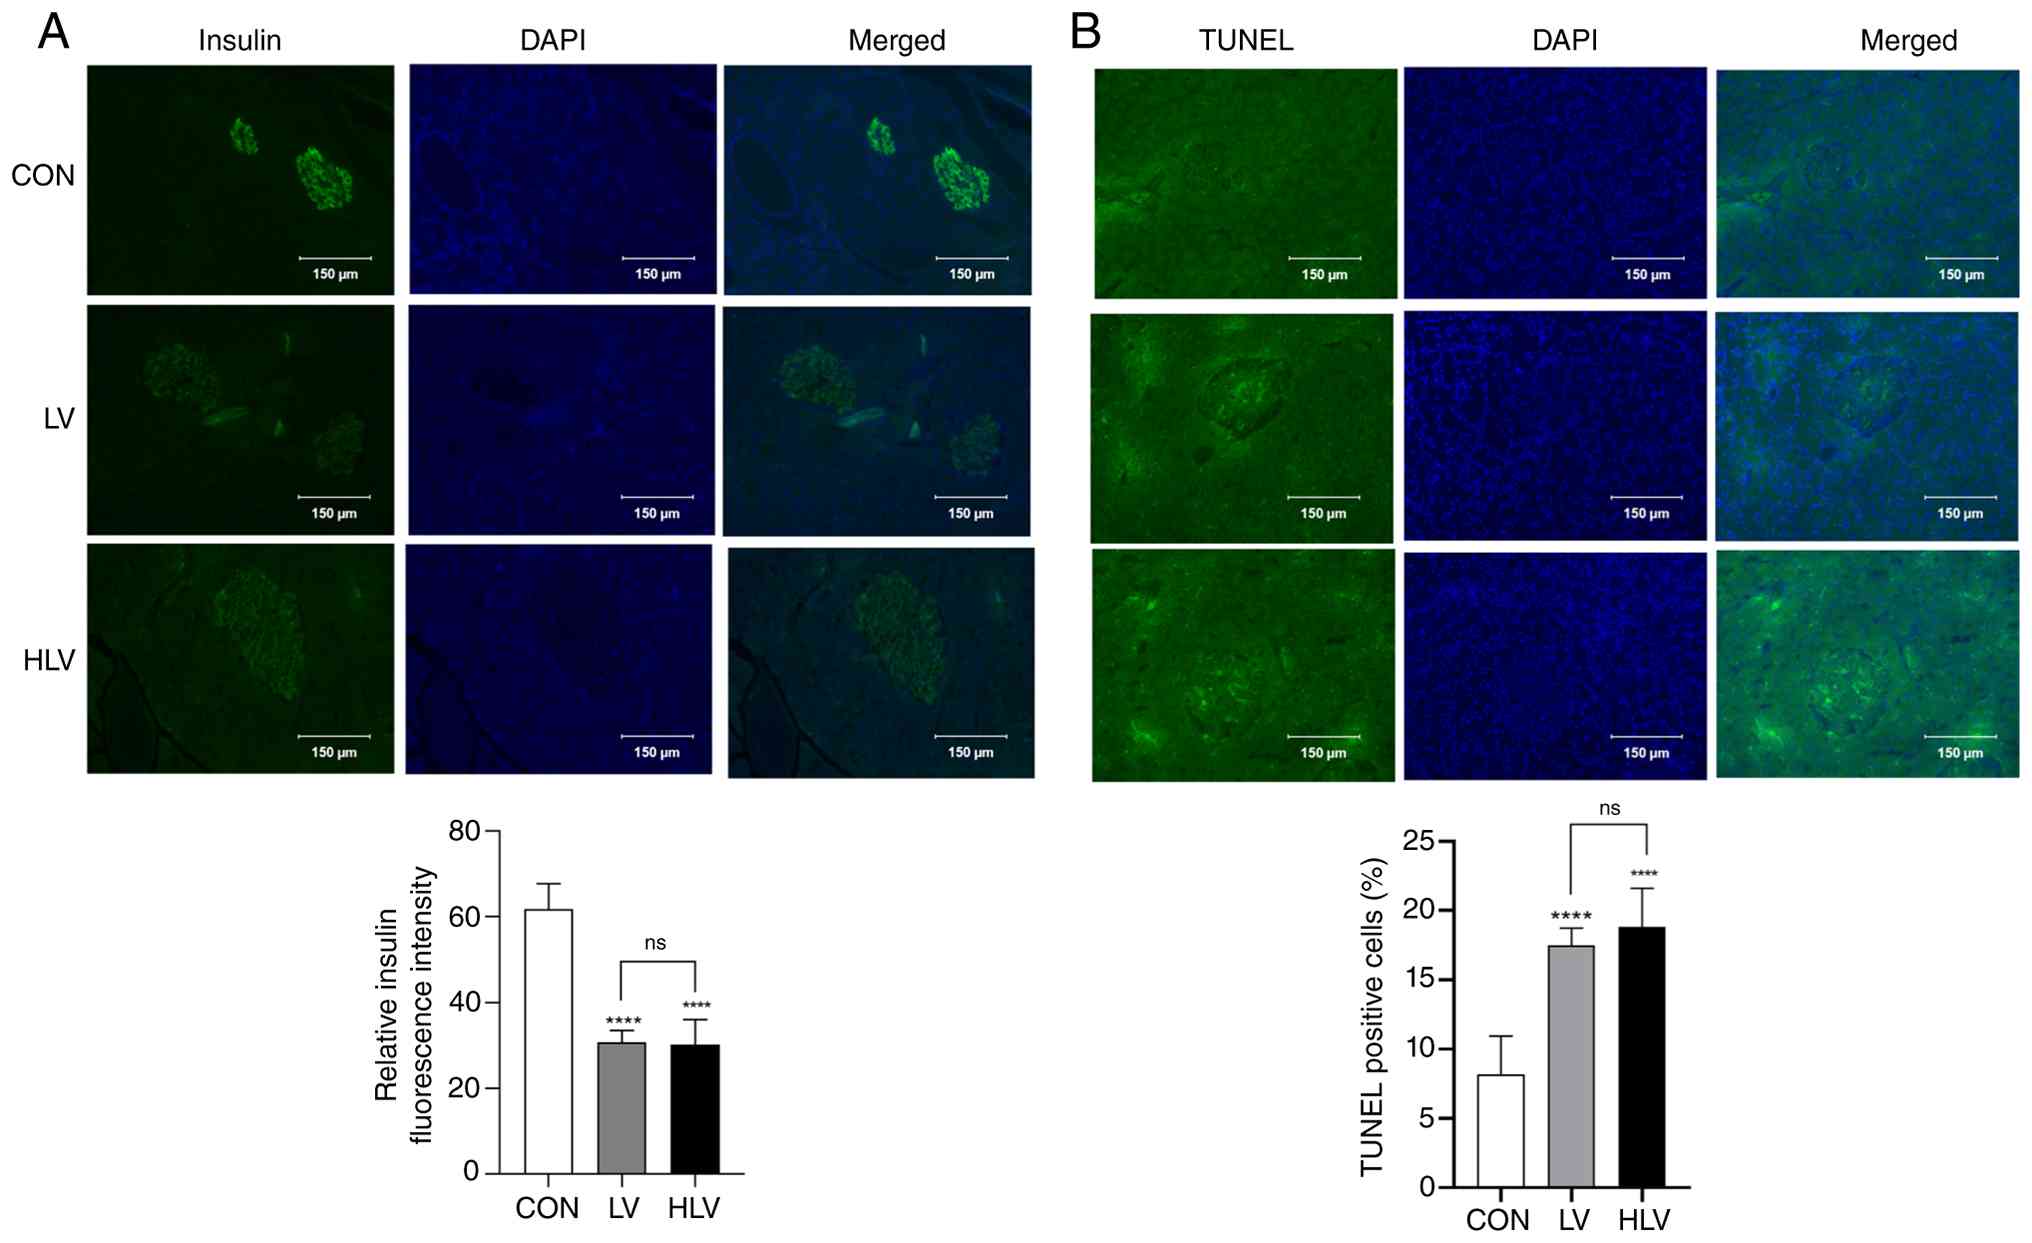 | Figure 4.Effects of letrozole and HFD on
pancreatic insulin expression and apoptosis in PCOS-induced rats.
Rats were assigned to the following groups: CON, normal diet +
distilled water (p.o.); LV, LET (1 mg/kg, p.o.) with normal diet;
and HLV, LET (1 mg/kg, p.o.) plus a HFD (60 kcal% fat). (A)
Representative insulin immunofluorescence images and quantitative
analysis of relative insulin expression intensity are shown
(magnification, ×200; scale bar=150 µm). (B) Representative TUNEL
staining images and quantitative analysis of the percentage of
TUNEL-positive cells. Data are expressed as mean ± SD.
****P<0.0001 vs. CON; ns, non-significant pairwise comparisons.
HFD, high-fat diet; LET, letrozole; p.o., per os. |
To evaluate apoptosis within the pancreatic islets,
TUNEL fluorescence staining was conducted (Fig. 4B). A minimal number of
TUNEL-positive nuclei were observed within the pancreatic islets of
the CON group, whereas a higher proportion of TUNEL-positive nuclei
was detected in the LV and HLV groups. Quantitative analysis
revealed that the percentage of TUNEL-positive cells was
significantly increased in the LV (17.49±1.44%) and HLV
(18.83±3.04%) groups compared with the CON group (8.20±3.07%,
P<0.0001). With no statistically significant difference between
the LV and HLV groups.
Ovarian immunofluorescence
To corroborate the alterations in steroid levels
induced by LV, ovarian tissue was subjected to immunofluorescence
staining for CYP19A1 and AMH (Fig.
5). In the ovaries of the CON group, CYP19A1 expression was
modest and predominantly localized within the corpus luteum.
However, in both the LV and HLV groups, the fluorescence intensity
of CYP19A1 was significantly increased throughout the follicular
region. Quantitative analysis revealed that CYP19A1 expression was
significantly increased in the LV (31.46±2.22) and HLV (41.80±3.27)
groups compared to the CON (18.17±0.84) group (P<0.01 and
P<0.0001, respectively), with the HLV group exhibiting
significantly higher CYP19A1 expression than the LV group
(P<0.01). AMH expression was also elevated in the LV and HLV
groups. In the ovaries of the CON group, moderate AMH staining was
observed, confined to the corpus luteum, in contrast, the AMH
signal was more intense and widespread in the LV (25.53±2.62) and
HLV (35.82±2.94) groups. Quantitative analysis further confirmed
that AMH fluorescence intensity was significantly increased in both
experimental groups relative to the CON (16.69±3.60, P<0.05 and
P<0.001) group, with a more pronounced elevation in the HLV
group than in the LV group (P<0.05).
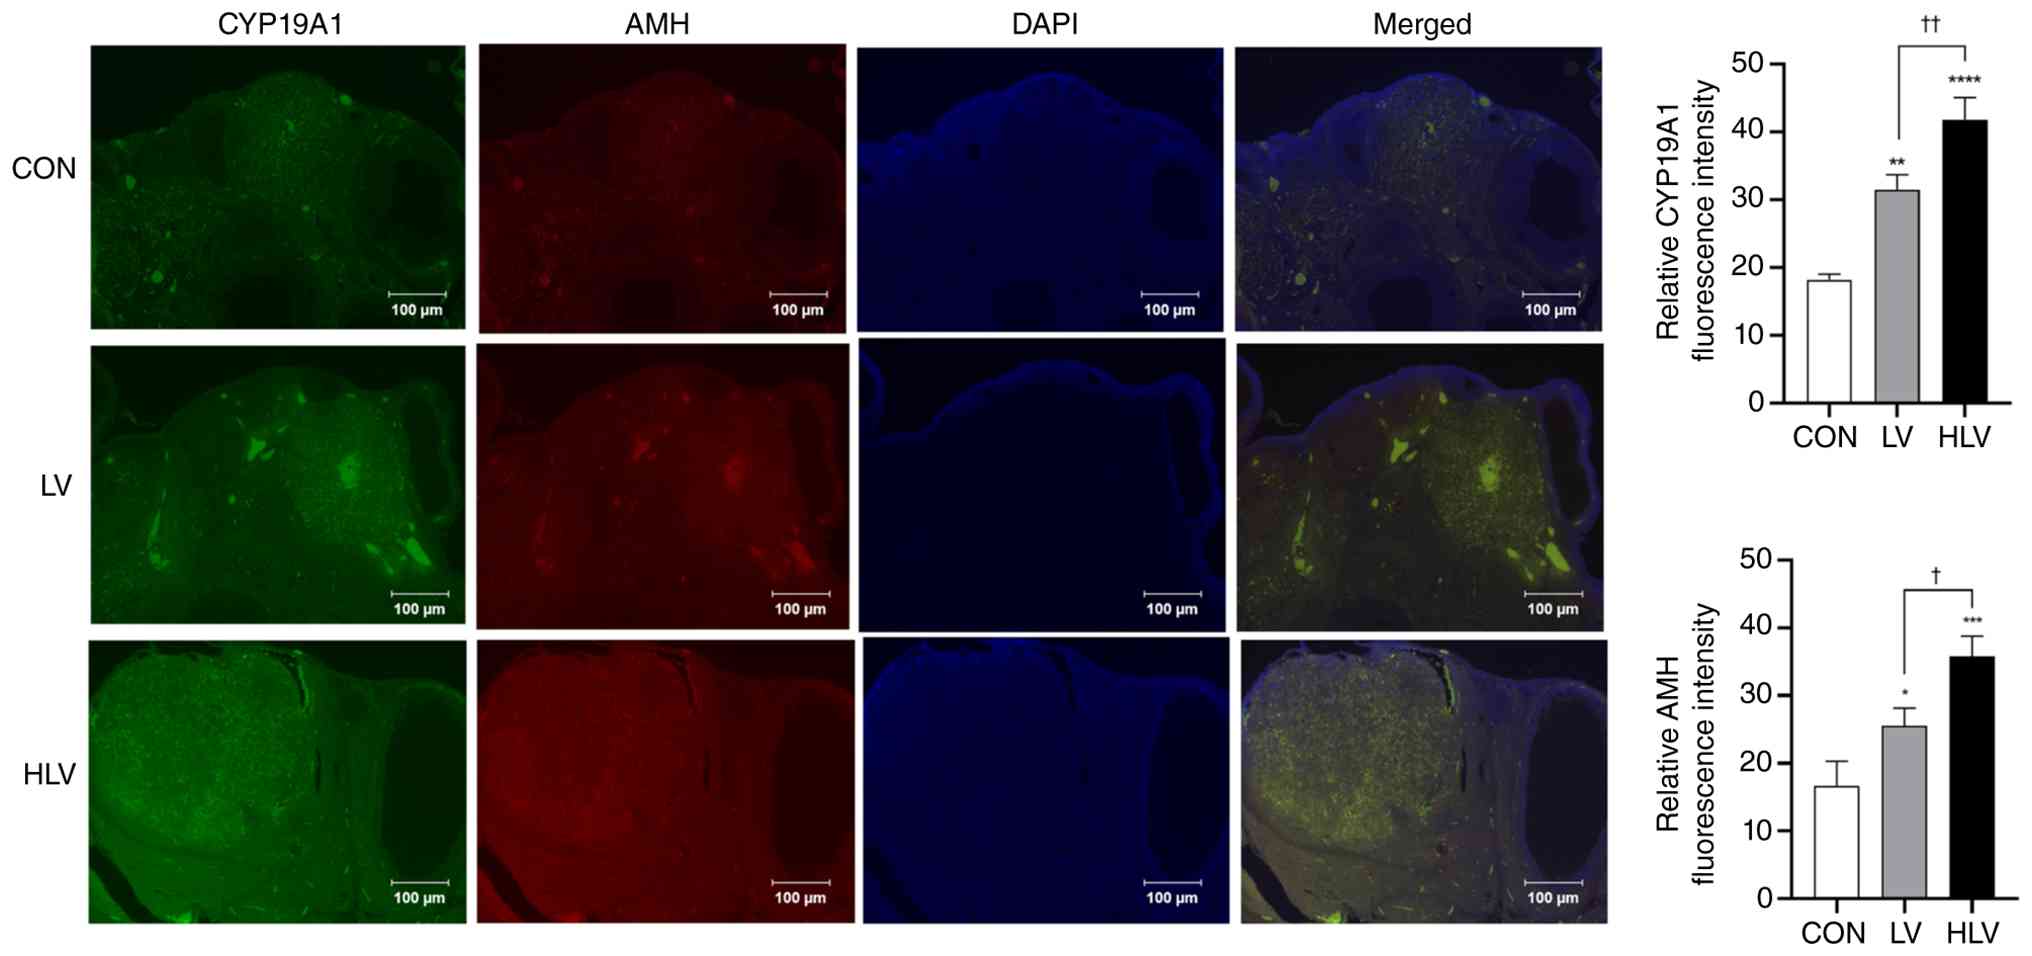 | Figure 5.Effects of letrozole and HFD on
ovarian CYP19A1 and AMH expression in PCOS-induced rats. Rats were
assigned to the following groups: CON, normal diet + distilled
water (p.o.); LV, LET (1 mg/kg, p.o.) with normal diet; and HLV,
LET (1 mg/kg, p.o.) plus a HFD (60 kcal% fat). Representative
immunofluorescence images of CYP19A1, AMH, DAPI, and merged ovarian
sections are shown (magnification, ×100; scale bar=100 µm),
together with quantitative analyses of relative CYP19A1 and AMH
fluorescence intensities. Data are expressed as mean ± SD.
*P<0.05, **P<0.01, ***P<0.001 and ****P<0.0001 vs. CON;
†P<0.05, ††P<0.01 LV vs. HLV; ns,
non-significant pairwise comparisons. AMH, anti-Müllerian hormone;
CYP19A1, cytochrome P450 family 19 subfamily A member 1; HFD,
high-fat diet; LET, letrozole; p.o., per os. |
Gene expression analysis of insulin
signaling, lipogenesis, and inflammation
Studies of hepatic insulin signaling have confirmed
consistent reductions in key signaling components relative to the
CON group. Specifically, INSR levels decreased from 1.00±0.09 in
CON to 0.57±0.21 in the LV group and further to 0.30±0.05 in the
HLV group (P<0.01 for LV vs. CON; P<0.0001 for HLV vs. CON).
IRS1 levels also decreased from 1.00±0.14 in CON to 0.64±0.07 in
the LV and to 0.53±0.06 in HLV (all P<0.01). IRS2, another key
adaptor in insulin signaling, decreased from 1.00±0.08 in the CON
group to 0.74±0.09 in the LV group and 0.56±0.07 in the HLV group
(P<0.05). AKT expression was also significantly decreased from
1.00±0.24 in the CON group to 0.67±0.05 in the LV group and to
0.47±0.24 in the HLV group (P<0.05). PI3K decreased from
1.00±0.18 to 0.69±0.11 in LV group and further to 0.46±0.09 in the
HLV group (P<0.01 for HLV vs. CON). GLUT4 levels were
significantly decreased in both LV and HLV groups (0.45±0.03 and
0.41±0.09, respectively) compared with CON group (1.00±0.12,
P<0.0001; Fig. 6A). However, no
significant difference between the LV and HLV groups was detected
for any of these insulin signaling genes (INSR, IRS1, IRS2, AKT,
PI3K, and GLUT4).
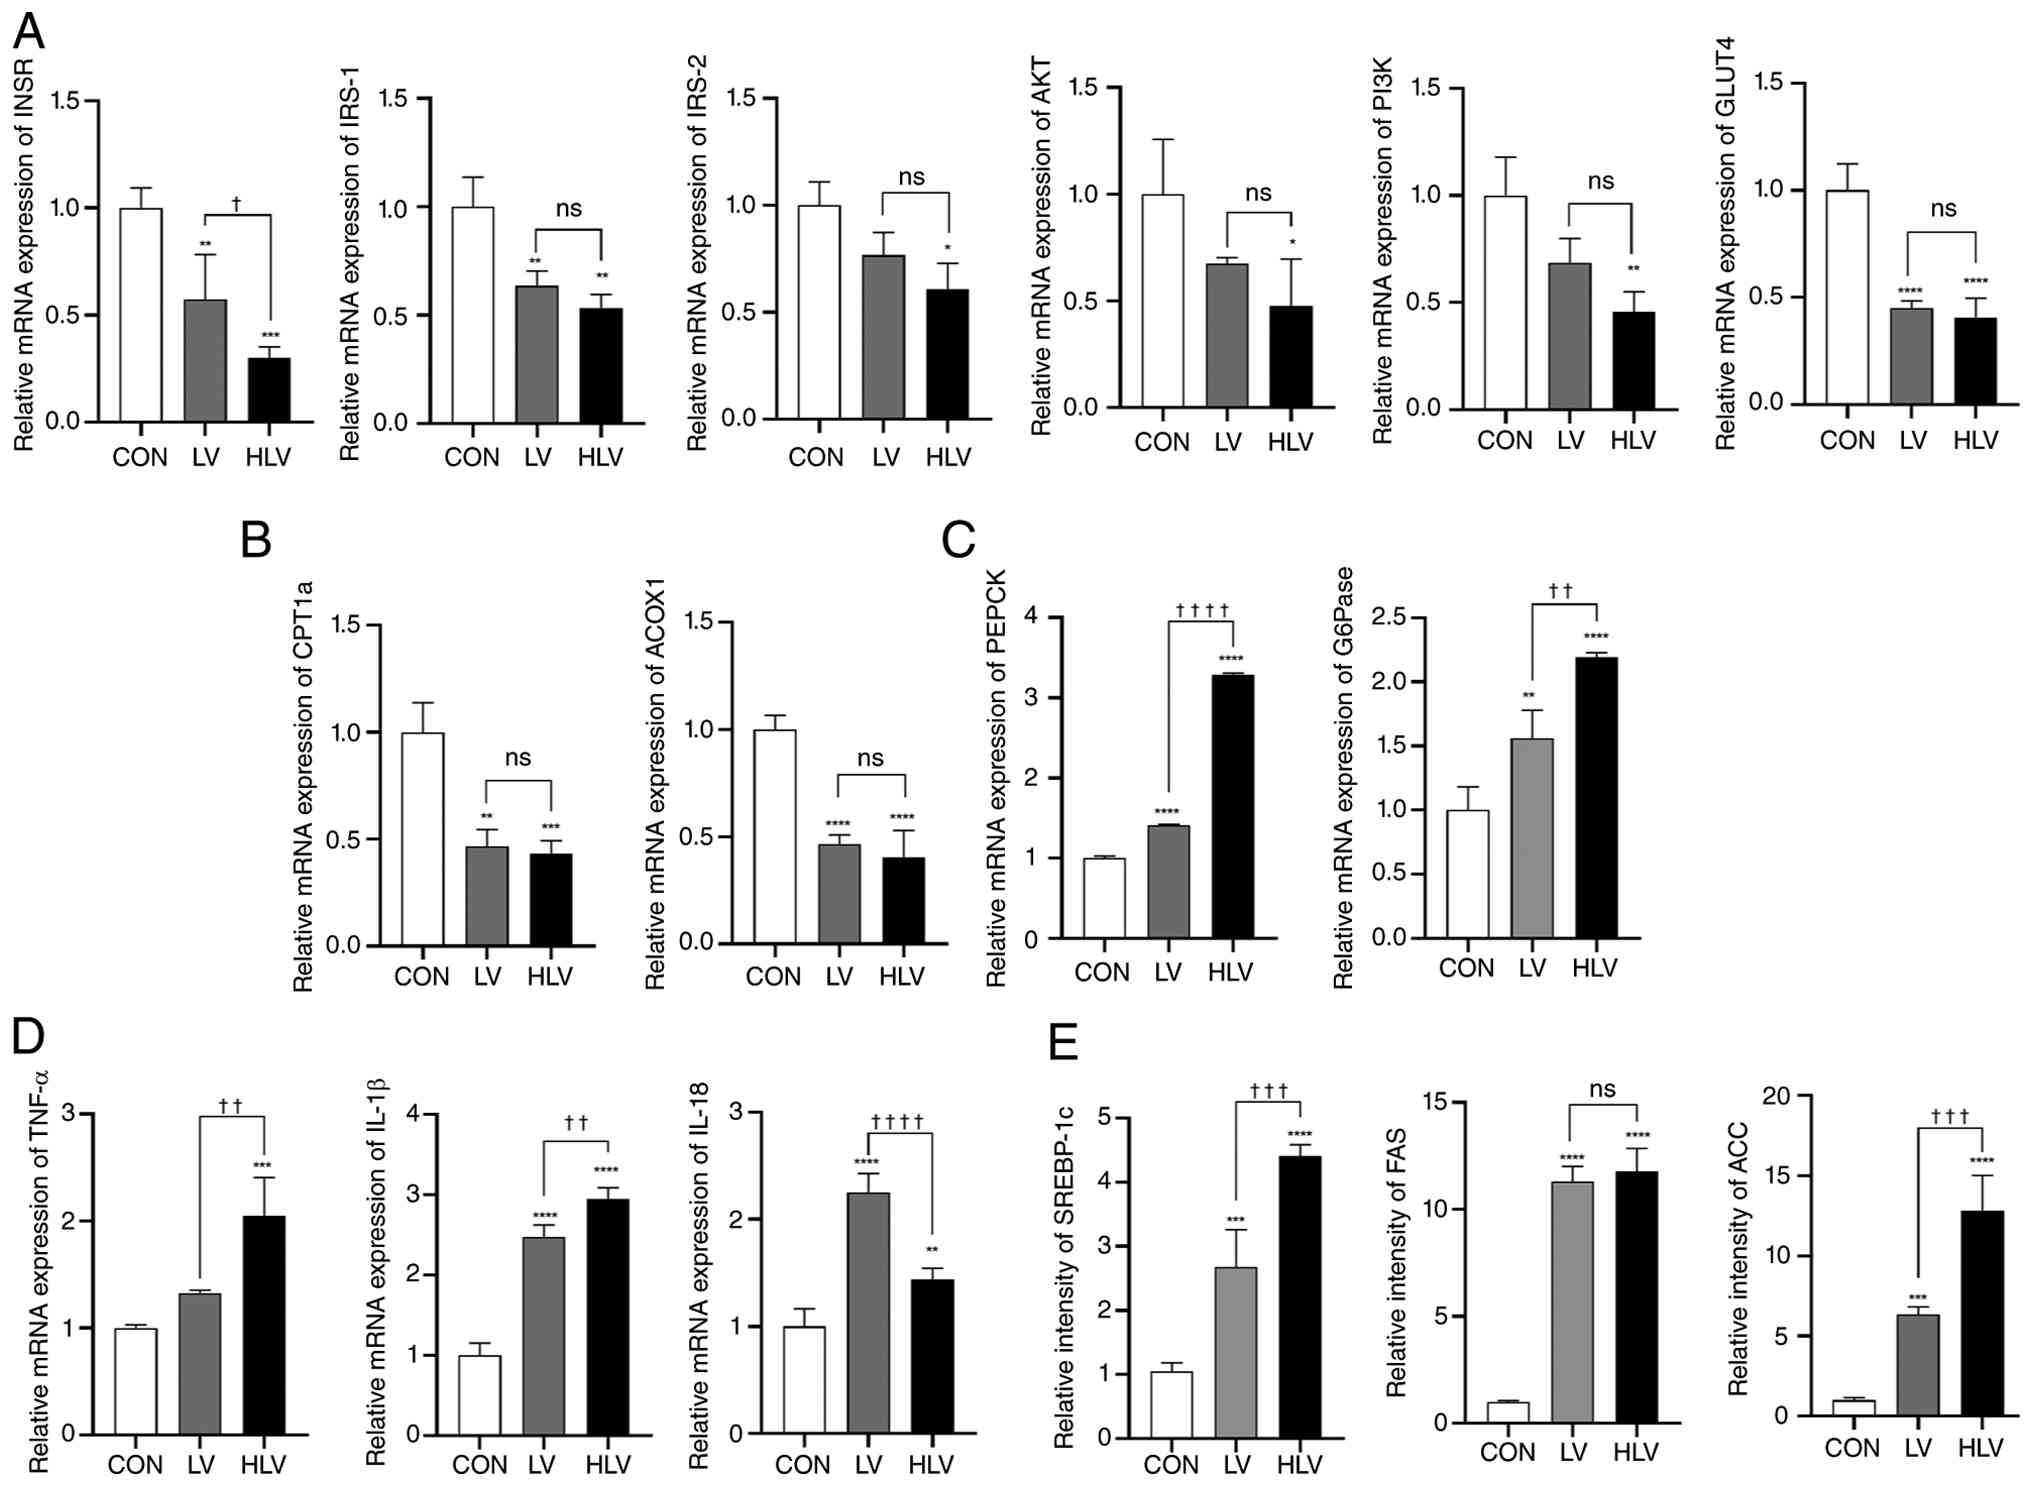 | Figure 6.Quantitative PCR analysis revealed
that HFD feeding profoundly altered hepatic and adipose mRNA
expression profiles associated with insulin signaling, lipid
metabolism, and inflammation. Rats were assigned to the following
groups: CON, normal diet + distilled water (p.o.); LV, LET (1
mg/kg, p.o.) with normal diet; and HLV, LET (1 mg/kg, p.o.) plus a
HFD (60 kcal% fat). (A) Relative mRNA expression levels of hepatic
insulin signaling-related genes are shown. (B) Relative mRNA
expression levels of hepatic fatty acid oxidation-related genes are
shown. (C) Relative mRNA expression levels of hepatic
gluconeogenesis-related genes are shown. (D) Relative mRNA
expression levels of hepatic pro-inflammatory cytokines are shown.
(E) Relative expression levels of adipose lipogenesis-related
markers are shown. Data are expressed as mean ± SD. *P<0.05,
**P<0.01, ***P<0.001 and ****P<0.0001 vs. CON;
†P<0.05, ††P<0.01,
†††P<0.001 and ††††P<0.0001 LV vs. HLV;
ns, non-significant pairwise comparisons. ACC, acetyl-CoA
carboxylase; ACOX1, acyl-CoA oxidase 1; AKT, protein kinase B;
CPT1a, carnitine palmitoyltransferase 1A; FAS, fatty acid synthase;
G6Pase, glucose-6-phosphatase; GLUT4, glucose transporter type 4;
HFD, high-fat diet; INSR, insulin receptor; IRS, insulin receptor
substrate; LET, letrozole; PEPCK, phosphoenolpyruvate
carboxykinase; PI3K, phosphoinositide 3-kinase; p.o., per os;
SREBP-1c, sterol regulatory element-binding protein 1c. |
CPT1a, a gene associated with fatty acid oxidation,
exhibited decreased levels, declining from 1.00±0.14 in the CON
group to 0.47±0.08 in the LV group and 0.43±0.06 in the HLV group
(P<0.01 for LV vs. CON; P<0.001 for HLV vs. CON). ACOX1
levels were also decreased from 1.00±0.07 to 0.47±0.04 in LV group
and 0.41±0.12 in HLV group (P<0.0001; Fig. 6B). No significant difference
between the LV and HLV groups was observed for CPT1a or ACOX1.
Meanwhile, PEPCK levels increased from 1.00±0.03 to 1.41±0.01 in LV
group and 3.29±0.02 in HLV group (all P<0.0001), with the HLV
group showing a significantly greater increase than the LV group
(P<0.0001). G6Pase level rose from 1.00±0.18 to 1.56±0.22 in the
LV group and 2.20±0.03 in the HLV group (P<0.01 for LV vs. CON;
P<0.001 for HLV vs. CON), and the HLV group also exhibited
significantly higher G6Pase expression than the LV group
(P<0.01; Fig. 6C). Liver
inflammatory cytokines were elevated in both LV and HLV groups.
TNF-α was increased from 1.00±0.04 in the CON group to 1.33±0.03 in
LV and 2.05±0.44 in HLV (P<0.001), with the HLV group showing a
significantly greater increase than the LV group (P<0.01). IL-1β
was also significantly increased from 1.00±0.19 in CON to 2.48±0.18
in LV and 2.95±0.17 in HLV (P<0.0001), with the HLV group
exhibiting a significantly higher IL-1β expression than the LV
group (P<0.01). IL-18 was increased from 1.00±0.20 in CON to
2.25±0.21 in LV and 1.44±0.12 in HLV (P<0.01; P<0.0001) with
the LV group exhibiting a significantly higher IL-18 expression
than the HLV group (P<0.0001; Fig.
6D).
VAT showed a marked increase in lipogenic gene
expression. SREBP-1c levels rose from 1.05±0.14 in CON to 2.68±0.58
in LV and 4.41±0.17 in HLV groups (P<0.001 for LV vs. CON;
P<0.0001 for HLV vs. CON), with the HLV group showing a
significantly greater increase compared to the LV group
(P<0.001). FAS expression was also significantly increased in
both LV and HLV groups (11.31±0.71 and 11.79±1.07 vs. 1.00±0.07,
P<0.0001); with no significant difference between the LV and HLV
groups. ACC levels increased from 1.00±0.15 in the CON group to
6.36±0.47 in LV and 12.84±2.19 in HLV groups (P<0.001 for LV vs.
CON; P<0.0001 for HLV vs. CON) and the HLV group also showed a
significantly higher ACC expression to the LV group (P<0.01;
Fig. 6E).
Discussion
In this study, a rat model of obese PCOS was
established through the combination of LET with an HFD. This
methodology is intended to better emulate the clinical spectrum of
obese PCOS, characterized by mutually reinforcing metabolic and
reproductive dysfunctions. While LET alone can induce
hyperandrogenism and ovarian dysfunction, the inclusion of an HFD
in this model resulted in more severe metabolic disturbances, such
as insulin resistance, β-cell dysfunction, hepatic steatosis, and
adipocyte hypertrophy (13,20).
Conversely, body weight and fasting blood glucose levels did not
differ significantly between the HLV and LV groups, suggesting that
these systemic parameters were primarily influenced by LET-induced
hyperandrogenism and were not further aggravated by HFD.
Histological assessment demonstrated notable liver fat
accumulation, cellular damage, and adipocyte hypertrophy.
Immunostaining of pancreatic tissue confirmed a reduction in
insulin-positive β-cell areas. Additionally, key components of the
insulin signaling pathway, including IRS-1, AKT, and GLUT4, were
showed significant reductions in liver and VAT at the molecular
level relative to CON group, indicating the presence of insulin
signaling disorders that were already evident in the LV group and
not significantly further intensified by HFD at the transcript
level, as no significant LV-HLV difference was detected for INSR,
IRS-1, IRS-2, AKT, PI3K, or GLUT4.
Concomitantly, the expression of genes involved in
adipogenesis SREBP-1c and ACC (significantly higher in HLV than LV)
and FAS (elevated vs. CON but not significantly different between
LV and HLV) and its synthesis (PEPCK, G6Pase) was increased,
indicating a more extensive regulatory defect in glucose and lipid
metabolism than observed in the LV group (21). In reproductive terms, this model
exhibited typical ovarian features of PCOS, including decreased
corpora lutea, increased follicular cysts, and abnormal ovarian
morphology, suggesting follicular inactivity. These phenomena
indicate an interaction between insulin resistance and ovarian
dysfunction, affirming this as a phenotypic hallmark of metabolic
PCOS (22). Consistent with prior
studies, HFD alone causes weight gain and impaired glucose
tolerance (23), while the
combination of HFD with LET significantly exacerbated insulin
resistance, as evidenced by elevated fasting glucose and insulin
levels (23). Notably, previous
research has demonstrated that the concurrent presence of HFD and
hyperandrogenism leads to a more severe impairment of insulin
sensitivity than either condition alone. Although earlier studies
indicated LET alone typically causes only mild insulin resistance
(13,24), our findings suggest that the
simultaneous administration of excessive dietary fat markedly
amplifies metabolic disturbances.
In the ovarian tissue of HLV rats, suppression of
follicle formation, increased follicular atresia, and decreased
corpora lutea were observed, consistent with a pattern similar to
that reported for LET-induced PCOS (25). Our results also confirmed the
potential for an HFD to exacerbate these reproductive
abnormalities, consistent with the notion that insulin resistance
impairs granulosa cell function and suppresses FSH receptor
signaling, thereby worsening ovarian function under metabolic
stress (26). To support these
results, ovarian immunofluorescence analysis revealed increased AMH
and CYP19A1 signals in both the LV and HLV groups, with the
strongest changes observed in the HLV group. Although these markers
do not independently contribute to ovarian steroid production, the
changes in their distribution and intensity suggest that the
combined effects of endocrine and metabolic stress may have altered
the follicular microenvironment.
The histological examination of liver tissues in the
HLV group revealed both microcellular and macrocellular fat
deposits that are characteristic of MASLD. This finding aligns with
previous research indicating that the PCOS-HFD model exacerbates
hepatic steatosis under combined metabolic and endocrine stress
conditions (27,28). Molecular analysis corroborated
these observations by demonstrating increased expression levels of
SREBP-1c and its downstream targets, FASN and ACC (29). These molecules serve as key
regulators of hepatic de novo lipogenesis and are closely linked to
lipid dysregulation observed in insulin resistance (30). It is noteworthy that administration
of LET alone induced only mild hepatic fat accumulation. However,
when combined with an HFD, it resulted in a more pronounced fatty
liver phenotype.
Pancreatic β-cell damage in HLV rats was evidenced
by a significant decrease in insulin-positive areas in both the LV
and HLV groups compared with CON, although neither parameter
differed significantly between the LV and HLV groups. These
findings indicate pancreatic islet alterations in the PCOS groups
but do not establish the functional state of insulin secretion or
its temporal progression. Previous studies have proposed that
compensatory hyperinsulinemia associated with insulin resistance
may contribute to hyperandrogenism and may eventually be followed
by β-cell dysfunction (31).
However, it is unclear whether this sequence occurred in this model
in practice, because circulating insulin and androgen levels were
not measured in the present study.
In VAT, adipocyte hypertrophy was observed in both
LV and HLV groups, with a more pronounced increase in the HLV
group, suggesting combined effects of excessive diet and a
hyperandrogenic environment. This observation was accompanied by
increased expression of adipogenic genes, including SREBP-1c, and
ACC (significantly higher in HLV than LV) and FAS (elevated vs. CON
but not significantly different between LV and HLV), indicating
accelerated fat accumulation and a tissue state associated with
local inflammation, hypoxia, and worsened systemic insulin
resistance (32). It is noteworthy
that our 7-week HFD protocol captures early VAT remodeling,
primarily hypertrophy and lipogenic gene activation, rather than
established inflammatory infiltration, which typically requires
prolonged HFD feeding (16+ weeks) to become histologically evident
(33). Collectively, these
findings suggest that early VAT remodeling contributes to systemic
insulin resistance within this model and may indirectly facilitate
the progression of ovarian failure. Genetic and protein data imply
that alterations in PI3K/AKT signaling in the liver and VAT of HLV
rats impaired insulin signaling. In VAT, the significant reduction
in GLUT4 expression indicates compromised insulin-stimulated
glucose uptake. In the liver, hepatocytes predominantly utilize
GLUT2 for bidirectional glucose transport (34). The decrease in GLUT4 mRNA may
reflect low-level hepatocyte expression or contributions from
hepatic non-parenchymal cell populations (35). This pattern supports broader
impairment of insulin signaling across metabolic tissues rather
than a specific hepatocyte glucose uptake.
This pathway is central to insulin-mediated
metabolic regulation, and its downregulation may lead to decreased
peripheral glucose uptake, increased hepatic glucose production,
and lipotoxicity (36).
Furthermore, increased expression of inflammatory cytokines, such
as TNF-α, IL-1β, and IL-18, in the liver may lead to inflammation
and fat accumulation in HLV rats, thereby further aggravating
hepatic insulin resistance and promoting a shift toward lipogenic
metabolism. Notably, TNF-α and IL-1β levels were significantly
higher in the HLV group than in the LV group (P<0.01 for both;
Fig. 6D), whereas IL-18 showed the
opposite pattern, with significantly higher levels in the LV group
(2.25±0.21) than in the HLV group (1.44±0.12; P<0.0001; Fig. 6D), although both PCOS groups
remained elevated relative to CON (1.00±0.20) although this LV-HLV
difference was statistically significant. Previous reports suggest
that elevated hepatic G6Pase and PEPCK levels indicate increased
endogenous glucose production (37). In this context, compensatory
hyperinsulinemia associated with impaired glucose regulation has
been proposed to promote ovarian androgen production and contribute
to follicular dysfunction (38).
However, as described above, whether a
hyperinsulinemia-hyperandrogenism pathway occurred in the HLV group
cannot be determined from the present study. Accordingly, the
pancreatic β-cell alterations observed in the HLV group should be
interpreted as structural evidence of islet injury rather than as
evidence of a defined temporal sequence involving earlier
hyperinsulinemia and subsequent β-cell decompensation. These
mechanisms demonstrate how metabolic and reproductive dysfunction
interlock in PCOS accompanied by obesity. Taken together, the HLV
rat model is thought to more clearly reproduce the metabolic and
reproductive abnormalities in obese PCOS, in contrast to the
conventional model that only uses LET. Furthermore, this model can
be a useful platform for preclinical evaluation of treatment
strategies targeting multiple pathologies simultaneously,
integrating insulin resistance, hepatic steatosis, dyslipidemia,
and PCOS into a complex phenotype (39). What is remarkable about this model
is that these changes are detected in multiple organs, including
the liver, VAT, pancreas, and ovaries, allowing the structural and
molecular aspects of the metabolism-reproduction axis to be
assessed in a single experimental system. Collectively, these
findings illustrate a coordinated multi-organ cascade underlying
the HLV phenotype. LET-induced hyperandrogenism and HFD-induced
metabolic stress jointly suppress hepatic and VAT insulin
signaling, as reflected by the concurrent downregulation of INSR,
IRS-1, and AKT in both tissues; this impairment is accompanied by
increased hepatic gluconeogenic (PEPCK, G6Pase) and lipogenic
(SREBP-1c, FASN, ACC) gene expression, promoting hepatic steatosis.
In contrast, VAT GLUT4 downregulation and adipocyte hypertrophy
further exacerbates peripheral insulin resistance (34–36).
In parallel, pancreatic islet alterations were observed, including
reduced insulin-positive area and increased apoptosis in both PCOS
groups, while ovarian abnormalities were reflected by altered
CYP19A1 and AMH expression, and disrupted follicular morphology.
Together, these hepatic alterations with the VAT, pancreas and
ovaries indicate a coordinated metabolic-reproductive phenotype in
the LET and HFD model. A schematic summary of the coordinated
metabolic and reproductive alterations observed in the HLV rat
model is presented in Fig. 7.
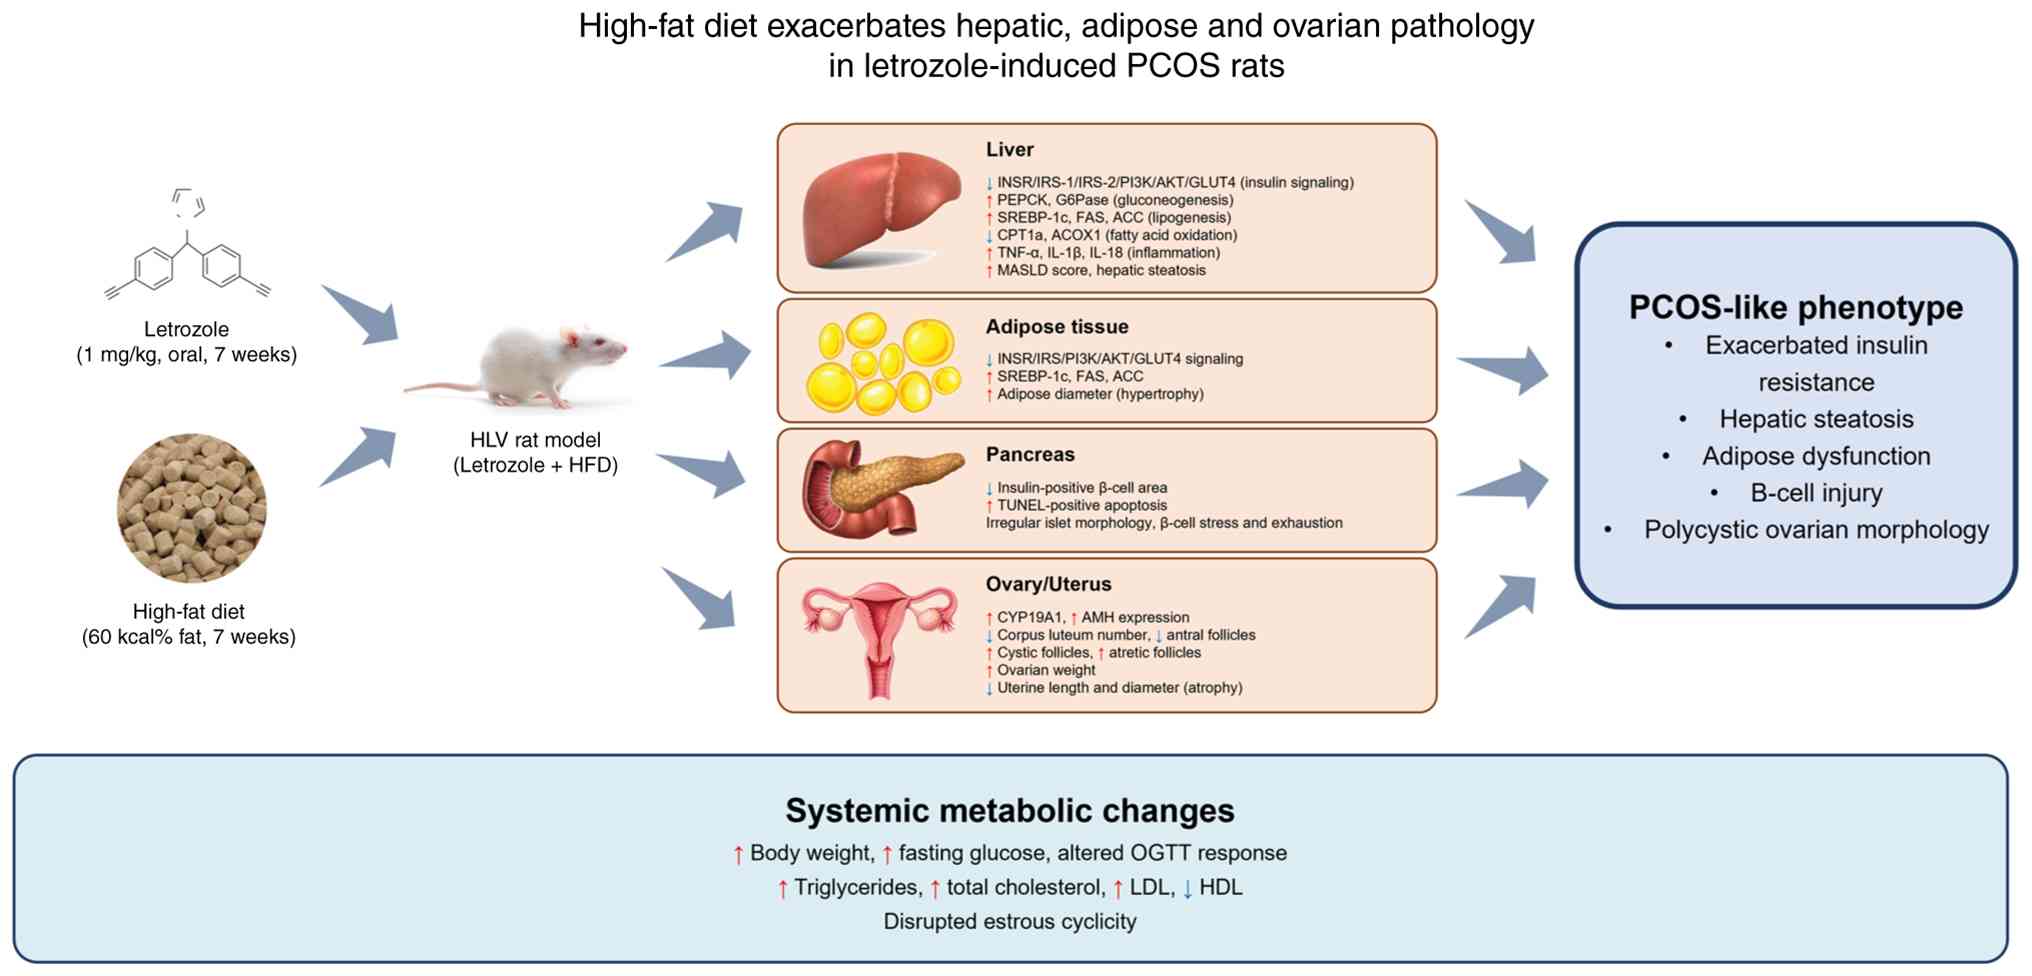 | Figure 7.Schematic overview of metabolic and
reproductive alterations in the HFD plus LET-induced PCOS rat
model. Rats were assigned to the following groups: CON, normal diet
+ distilled water (p.o.); LV, LET (1 mg/kg, p.o.) with normal diet;
HLV, LET (1 mg/kg, p.o.) + HFD (60 kcal% fat). Combined letrozole
administration and HFD feeding were associated with impaired
insulin signaling, altered glucose and lipid metabolism in the
liver and visceral adipose tissue, pancreatic islet alterations,
and ovarian and uterine abnormalities. Collectively, these
multi-organ alterations characterize the metabolic and reproductive
phenotype observed in the HLV group. HFD, high-fat diet; LET,
letrozole; PCOS, polycystic ovary syndrome; p.o., per os. |
Furthermore, beyond therapeutic screening, this
model may also be instrumental in investigating adipokine
imbalance, particularly decreased adiponectin and elevated leptin
and resistin that characterize PCOS-associated VAT dysfunction.
This dysfunction has been linked to endoplasmic reticulum stress
and mitochondrial disturbance, which have been shown to contribute
to the progression of metabolic and reproductive abnormalities in
PCOS (40,41). For example, developing diverse
therapeutic approaches, such as insulin-sensitizing agents like
metformin, endocrine-regulating and antioxidant therapies like
melatonin to alleviate oxidative stress, promoting ovarian follicle
development, and modulating the gut-liver-ovarian axis through
probiotics and natural product therapies-may enhance the potential
to simultaneously improve metabolic balance and reproductive
function (42–44). Despite these advantages, the
present study has several limitations. Direct clinical application
may be limited by physiological differences between rodents and
humans, notably in estrous cycle dynamics, ovarian physiology, and
fat distribution (45).
Furthermore, although pathway-related alterations at the mRNA and
protein levels have been identified, additional validation through
immunohistochemistry and phosphorylation-specific markers, such as
p-AKT and p-INSR, are necessary to substantiate our findings
regarding impaired insulin signaling (46). Serum insulin and androgen
concentrations and HOMA-IR were not directly measured in this
study; therefore, the proposed pathway from compensatory
hyperinsulinemia to hyperandrogenism remains hypothetical and
requires future validation through direct hormonal and metabolic
assessments. Finally, future studies should focus on the temporal
development and reversibility of the PCOS phenotype. Longitudinal
monitoring of hormonal profiles, fertility outcomes, ovarian
reserve markers such as AMH, and gut microbial communities will
facilitate the elucidation of underlying mechanisms and improve
cross-transferability of the findings.
In conclusion, this study effectively reproduces the
key metabolic features of PCOS with LET is administered in
combination with an HFD. This model provides useful experimental
evidence linking insulin signaling disorders to ovarian dysfunction
and may serve as a suitable preclinical platform for studying the
mechanism of obesity-related PCOS evaluating treatments. However,
the hypothesized pathway from compensatory hyperinsulinemia to
hyperandrogenism was not directly validated by serum insulin,
androgen, or HOMA-IR measurements in the present study; future
studies incorporating these direct hormonal and metabolic
assessments are warranted to confirm this temporal sequence.
Acknowledgements
Not applicable.
Funding
This work was supported by the National Research Foundation of
Korea (NRF) grant funded by the Korea government (MSIT) (grant no.
RS-2024-00338574).
Availability of data and materials
The data generated in the present study may be
requested from the corresponding author.
Authors' contributions
MHK contributed to conception and design of the
study. SS, SK and LYC analyzed and investigated the data. LYC, DYK
and MHK contributed to the histopathological evaluation and
interpretation of the experimental data. LYC, DYK and MHK confirm
the authenticity of all the raw data. SS drafted the manuscript.
MHK and DYK contributed to revising the manuscript and provided
supervision throughout the project. All authors read and approved
the final manuscript.
Ethics approval and consent to
participate
The animal study was reviewed and approved by the
Institutional Animal Care and Use Committee of Woosuk University
(approval no. WS-2024-04).
Patient consent for publication
Not applicable.
Competing interests
The authors declare that they have no competing
interests.
References
|
1
|
Daniele S, Chelucci E, Scarfò G and Artini
PG: Molecular research on polycystic ovary syndrome (PCOS).
Biomedicines. 11:13582023. View Article : Google Scholar : PubMed/NCBI
|
|
2
|
Sir-Petermann T, Echiburú B, Crisosto N,
Maliqueo M and Bravo FP: Metabolic features across the female life
span in women with PCOS. Curr Pharm Des. 22:5515–5525. 2016.
View Article : Google Scholar : PubMed/NCBI
|
|
3
|
Kempegowda P, Melson E, Manolopoulos KN,
Arlt W and O'Reilly MW: Implicating androgen excess in propagating
metabolic disease in polycystic ovary syndrome. Ther Adv Endocrinol
Metab. 11:20420188209343192020. View Article : Google Scholar : PubMed/NCBI
|
|
4
|
O'Connor A, Gibney J and Roche HM:
Metabolic and hormonal aspects of polycystic ovary syndrome: The
impact of diet. Proc Nutr Soc. 69:628–635. 2010. View Article : Google Scholar : PubMed/NCBI
|
|
5
|
Diamanti-Kandarakis E and Dunaif A:
Insulin resistance and the polycystic ovary syndrome revisited: An
update on mechanisms and implications. Endocr Rev. 33:981–1030.
2012. View Article : Google Scholar : PubMed/NCBI
|
|
6
|
Dunaif A: Insulin action in the polycystic
ovary syndrome. Endocrinol Metab Clin North Am. 28:341–359. 1999.
View Article : Google Scholar : PubMed/NCBI
|
|
7
|
Qu X and Donnelly R: Sex hormone-binding
globulin (SHBG) as an early biomarker and therapeutic target in
polycystic ovary syndrome. Int J Mol Sci. 21:81912020. View Article : Google Scholar : PubMed/NCBI
|
|
8
|
Dupont J and Scaramuzzi RJ: Insulin
signalling and glucose transport in the ovary and ovarian function
during the ovarian cycle. Biochem J. 473:1483–1501. 2016.
View Article : Google Scholar : PubMed/NCBI
|
|
9
|
Zeber-Lubecka N, Ciebiera M and Hennig EE:
Polycystic ovary syndrome and oxidative stress-from bench to
bedside. Int J Mol Sci. 24:141262023. View Article : Google Scholar : PubMed/NCBI
|
|
10
|
Walters KA, Allan CM and Handelsman DJ:
Rodent models for human polycystic ovary syndrome. Biol Reprod.
86:1491–12. 2012. View Article : Google Scholar : PubMed/NCBI
|
|
11
|
Maliqueo M, Sun M, Johansson J, Benrick A,
Labrie F, Svensson H, Lönn M, Duleba AJ and Stener-Victorin E:
Continuous administration of a P450 aromatase inhibitor induces
polycystic ovary syndrome with a metabolic and endocrine phenotype
in female rats at adult age. Endocrinology. 154:434–445. 2013.
View Article : Google Scholar : PubMed/NCBI
|
|
12
|
Woods SC, Seeley RJ, Rushing PA, D'Alessio
D and Tso P: A controlled high-fat diet induces an obese syndrome
in rats. J Nutr. 133:1081–1087. 2003. View Article : Google Scholar : PubMed/NCBI
|
|
13
|
Xu J, Dun J, Yang J, Zhang J, Lin Q, Huang
M, Ji F, Huang L, You X and Lin Y: Letrozole rat model mimics human
polycystic ovarian syndrome and changes in insulin signal pathways.
Med Sci Monit. 26:e9230732020. View Article : Google Scholar : PubMed/NCBI
|
|
14
|
Zheng YH, Xu Y, Ma HX, Liang CJ and Yang
T: Effect of high-fat diet on the intestinal flora in
letrozole-induced polycystic ovary syndrome rats. Evid Based
Complement Alternat Med. 2021:66749652021. View Article : Google Scholar : PubMed/NCBI
|
|
15
|
Mirseyyed SF, Zavareh S, Nasiri M and
Hashemi-Moghaddam H: An experimental study on the oxidative status
and inflammatory levels of a rat model of polycystic ovary syndrome
induced by letrozole and a new high-fat diet. Int J Fertil Steril.
18:45–53. 2023.PubMed/NCBI
|
|
16
|
Zhang H, Yi M, Zhang Y, Jin H, Zhang W,
Yang J, Yan L, Li R, Zhao Y and Qiao J: High-fat diets exaggerate
endocrine and metabolic phenotypes in a rat model of DHEA-induced
PCOS. Reproduction. 151:431–441. 2016. View Article : Google Scholar : PubMed/NCBI
|
|
17
|
Hasnain SZ, Prins JB and McGuckin MA:
Oxidative and endoplasmic reticulum stress in β-cell dysfunction in
diabetes. J Mol Endocrinol. 56:R33–R54. 2016. View Article : Google Scholar : PubMed/NCBI
|
|
18
|
Kleiner DE, Brunt EM, Van Natta M, Behling
C, Contos MJ, Cummings OW, Ferrell LD, Liu YC, Torbenson MS,
Unalp-Arida A, et al: Design and validation of a histological
scoring system for nonalcoholic fatty liver disease. Hepatology.
41:1313–1321. 2005. View Article : Google Scholar : PubMed/NCBI
|
|
19
|
Livak KJ and Schmittgen TD: Analysis of
relative gene expression data using real-time quantitative PCR and
the 2(−Delta Delta C(T)) method. Methods. 25:402–408. 2001.
View Article : Google Scholar : PubMed/NCBI
|
|
20
|
Decourt C, Watanabe Y, Evans MC, Inglis
MA, Fisher LC, Jasoni CL, Campbell RE and Anderson GM: Deletion of
androgen receptors from kisspeptin neurons prevents PCOS features
in a letrozole mouse model. Endocrinology. 164:bqad0772023.
View Article : Google Scholar : PubMed/NCBI
|
|
21
|
Knebel B, Haas J, Hartwig S, Jacob S,
Köllmer C, Nitzgen U, Muller-Wieland D and Kotzka J: Liver-specific
expression of transcriptionally active SREBP-1c is associated with
fatty liver and increased visceral fat mass. PLoS One.
7:e318122012. View Article : Google Scholar : PubMed/NCBI
|
|
22
|
Diamanti-Kandarakis E: Polycystic ovarian
syndrome: Pathophysiology, molecular aspects and clinical
implications. Expert Rev Mol Med. 10:e32008. View Article : Google Scholar : PubMed/NCBI
|
|
23
|
Liu Z, Patil IY, Jiang T, Sancheti H,
Walsh JP, Stiles BL, Yin F and Cadenas E: High-fat diet induces
hepatic insulin resistance and impairment of synaptic plasticity.
PLoS One. 10:e01282742015. View Article : Google Scholar : PubMed/NCBI
|
|
24
|
Skarra DV, Hernández-Carretero A, Rivera
AJ, Anvar AR and Thackray VG: Hyperandrogenemia induced by
letrozole treatment of pubertal female mice results in
hyperinsulinemia prior to weight gain and insulin resistance.
Endocrinology. 158:2988–3003. 2017. View Article : Google Scholar : PubMed/NCBI
|
|
25
|
Noorafshan A, Ahmadi M, Mesbah SF and
Karbalay-Doust S: Stereological study of the effects of letrozole
and estradiol valerate treatment on the ovary of rats. Clin Exp
Reprod Med. 40:115–121. 2013. View Article : Google Scholar : PubMed/NCBI
|
|
26
|
Robker RL, Akison LK, Bennett BD, Thrupp
PN, Chura LR, Russell DL, Lane M and Norman RJ: Obese women exhibit
differences in ovarian metabolites, hormones, and gene expression
compared with moderate-weight women. J Clin Endocrinol Metab.
94:1533–1540. 2009. View Article : Google Scholar : PubMed/NCBI
|
|
27
|
Lai H, Jia X, Yu Q, Zhang C, Qiao J, Guan
Y and Kang J: High-fat diet induces significant metabolic disorders
in a mouse model of polycystic ovary syndrome. Biol Reprod.
91:1272014. View Article : Google Scholar : PubMed/NCBI
|
|
28
|
Kanuri G and Bergheim I: In vitro and in
vivo models of non-alcoholic fatty liver disease (NAFLD). Int J Mol
Sci. 14:11963–11980. 2013. View Article : Google Scholar : PubMed/NCBI
|
|
29
|
Ferré P and Foufelle F: Hepatic steatosis:
A role for de novo lipogenesis and the transcription factor
SREBP-1c. Diabetes Obes Metab. 12 (Suppl 2):S83–S92. 2010.
View Article : Google Scholar : PubMed/NCBI
|
|
30
|
Dongiovanni P, Stender S, Pietrelli A,
Mancina RM, Cespiati A, Petta S, Pelusi S, Pingitore P, Badiali S,
Maggioni M, et al: Causal relationship of hepatic fat with liver
damage and insulin resistance in nonalcoholic fatty liver. J Intern
Med. 283:356–370. 2018. View Article : Google Scholar : PubMed/NCBI
|
|
31
|
De Leo V, Musacchio MC, Cappelli V,
Massaro MG, Morgante G and Petraglia F: Genetic, hormonal and
metabolic aspects of PCOS: An update. Reprod Biol Endocrinol.
14:382016. View Article : Google Scholar : PubMed/NCBI
|
|
32
|
Trayhurn P: Hypoxia and adipose tissue
function and dysfunction in obesity. Physiol Rev. 93:1–21. 2013.
View Article : Google Scholar : PubMed/NCBI
|
|
33
|
Turner N, Kowalski GM, Leslie SJ, Risis S,
Yang C, Lee-Young RS, Babb JR, Meikle PJ, Lancaster GI, Henstridge
DC, et al: Distinct patterns of tissue-specific lipid accumulation
during the induction of insulin resistance in mice by high-fat
feeding. Diabetologia. 56:1638–1648. 2013. View Article : Google Scholar : PubMed/NCBI
|
|
34
|
Chadt A and Al-Hasani H: Glucose
transporters in adipose tissue, liver, and skeletal muscle in
metabolic health and disease. Pflugers Arch. 472:1273–1298. 2020.
View Article : Google Scholar : PubMed/NCBI
|
|
35
|
Kurabayashi A, Furihata K, Iwashita W,
Tanaka C, Fukuhara H, Inoue K, Furihata M and Kakinuma Y: Murine
remote ischemic preconditioning upregulates preferentially hepatic
glucose transporter-4 via its plasma membrane translocation,
leading to accumulating glycogen in the liver. Life Sci.
290:1202612022. View Article : Google Scholar : PubMed/NCBI
|
|
36
|
Ramachandran V and Saravanan R: Glucose
uptake through translocation and activation of GLUT4 in PI3K/Akt
signaling pathway by asiatic acid in diabetic rats. Hum Exp
Toxicol. 34:884–893. 2015. View Article : Google Scholar : PubMed/NCBI
|
|
37
|
Sun Y, Liu S, Ferguson S, Wang L, Klepcyk
P, Yun JS and Friedman JE: Phosphoenolpyruvate carboxykinase
overexpression selectively attenuates insulin signaling and hepatic
insulin sensitivity in transgenic mice. J Biol Chem.
277:23301–23307. 2002. View Article : Google Scholar : PubMed/NCBI
|
|
38
|
Wu S, Divall S, Nwaopara A, Radovick S,
Wondisford F, Ko C and Wolfe A: Obesity-induced infertility and
hyperandrogenism are corrected by deletion of the insulin receptor
in the ovarian theca cell. Diabetes. 63:1270–1282. 2014. View Article : Google Scholar : PubMed/NCBI
|
|
39
|
Patel R and Shah G: High-fat diet exposure
from pre-pubertal age induces polycystic ovary syndrome (PCOS) in
rats. Reproduction. 155:141–151. 2018. View Article : Google Scholar : PubMed/NCBI
|
|
40
|
Zeng X, Huang Q, Long SL, Zhong Q and Mo
Z: Mitochondrial dysfunction in polycystic ovary syndrome. DNA Cell
Biol. 39:1401–1409. 2020. View Article : Google Scholar : PubMed/NCBI
|
|
41
|
Siemers KM, Klein AK and Baack ML:
Mitochondrial dysfunction in PCOS: Insights into reproductive organ
pathophysiology. Int J Mol Sci. 24:131232023. View Article : Google Scholar : PubMed/NCBI
|
|
42
|
Shpakov AO: Improvement effect of
metformin on female and male reproduction in endocrine pathologies
and its mechanisms. Pharmaceuticals (Basel). 14:422021. View Article : Google Scholar : PubMed/NCBI
|
|
43
|
Tamura H, Takasaki A, Taketani T, Tanabe
M, Kizuka F, Lee L, Tamura I, Maekawa R, Asada H, Yamagata Y and
Sugino N: Melatonin as a free radical scavenger in the ovarian
follicle. Endocr J. 60:1–13. 2013. View Article : Google Scholar : PubMed/NCBI
|
|
44
|
Basnet J, Eissa MA, Cardozo LLY, Romero DG
and Rezq S: Impact of probiotics and prebiotics on gut microbiome
and hormonal regulation. Gastrointest Disord (Basel). 6:801–815.
2024. View Article : Google Scholar : PubMed/NCBI
|
|
45
|
Chusyd DE, Wang D, Huffman DM and Nagy TR:
Relationships between rodent white adipose fat pads and human white
adipose fat depots. Front Nutr. 3:102016. View Article : Google Scholar : PubMed/NCBI
|
|
46
|
Thomas GV, Horvath S, Smith BL, Crosby K,
Lebel LA, Schrage M, Said J, De Kernion J, Reiter RE and Sawyers
CL: Antibody-based profiling of the phosphoinositide 3-kinase
pathway in clinical prostate cancer. Clin Cancer Res. 10:8351–8356.
2004. View Article : Google Scholar : PubMed/NCBI
|

















