Introduction
Although the majority of children with acute
lymphoblastic leukemia (ALL) are cured following intensive therapy,
the impressive outcomes are not without drawbacks, i.e., short- and
long-term morbidities. The identification of prognostic factors and
evolution of risk-adapted therapy for children with ALL is one of
the success stories in modern clinical oncology. Better indicators
means physicians are able to avoid over-treating ALL patients,
instead less aggressive protocols are adimistered, with equally
promising outcomes (1).
Prognostic models based mostly on pretreatment
factors were established and attempted to identify favorable- and
poor-prognosis patients to assign them to risk-adapted therapies.
Although achievement of a complete response (CR) remains the most
significant clinical endpoint for survival, criteria for CR are
arbitrarily defined. Apart from the questionable numerical cut-off
points that characterize CR, remission is not an all-or-none
phenomenon. The shorter the time to CR, the better is the long-term
outcome in chemotherapy-treated patients. Response during therapy
can therefore supplement pretreatment prognostic data (2).
A large number of clinical and biologic prognostic
factors were determined during the last 30 years and used to
stratify patients to risk-directed therapy. Clinical
characteristics included such factors as gender, age, presence of
lymphomatous features and white blood count (WBC) at diagnosis.
Biological characteristics, including immunophenotype, cytogenetics
and lymphoblast morphology, were also used to predict the
likelihood of relapse. However, with improved chemotherapy
regimens, a number of these traditional prognostic factors have
lost clinical significance.
Studies emphasized the significance of response to
initial therapy as measured by the reduction in peripheral
circulating lymphoblast count, early bone marrow response, and
detection of minimal residual disease at the end of induction. The
biological response of the malignant lymphoblast population to
chemotherapy is crucial to achieving a sustained complete remission
and cure (3).
Children receiving cytotoxic chemotherapy for ALL
present with significant variations in the incidence and severity
of hematologic and non-hematologic side effects, frequently causing
delays in scheduled therapy and reduced dose intensity. The
variation in side-effect profiles in individual patients remains to
be elucidated, apart from rare instances of inherited dysfunction
of key drug-metabolizing enzymes involved in cytotoxic drug
metabolism, such as thiopurine S-methyltransferase (4).
It is unknown whether the variation in the
individual response of non-malignant hematologic cells to
chemotherapy correlates with the risk of relapse or the response of
malignant lymphoblasts to chemotherapy in children with ALL
(3).
We aimed to improve relapse prediction in children
with ALL by evaluating the chemosensitivity of normal and malignant
cells early in the course of treatment and determining the
relationship between such chemosensitivity and risk of relapse.
Patients and methods
Patients
A retrospective analysis was conducted on a cohort
of 60 children with newly diagnosed ALL. The patients were
consecutively enrolled and treated on modified CCG 1991 protocol
for standard risk ALL and modified CCG 1961 protocol for high-risk
ALL during the period from 2004 to 2009. A total of 40 patients
were in complete remission for at least 4 years from the first CR
(group I) and 20 patients relapsed during or following treatment
(group II). The cut-off point of 4 years was selected as none of
the patients in group II had relapse-free survival (RFS) over 4
years and to allow more patients to be included in the study since
the modified CCG protocol was assigned in 2004 to be used as a
unified Egyptian protocol for treatment of childhood ALL.
Eligibility criteria included patient age between 1
and 15 years; adherence to the modified CCG 1991 protocol for
standard risk ALL and modified CCG 1961 protocol for high-risk ALL;
remission achieved after a 4-week induction regimen; and
appropriate available medical records.
Exclusion criteria included patient age <1 year
and >15 years; failure to achieve remission after a 4-week
induction regimen; death during induction; and incomplete or
unavailable medical records.
Data collection
A standardized data abstraction form was designed to
gather appropriate information from individual patient medical
records. The collected data included: i) pretreatment risk factors
such as age, clinical presentation, initial total leukocytic count
(TLC) and immunophenotyping; ii) the risk group of the patients
based on the above-mentioned pretreatment risk factors; iii)
complete blood count (CBC) results at diagnosis, during induction
and at the end of induction; iv) time to peripheral blood blast
clearance (PBBC); and v) RFS in patients of group II. Notably, the
absolute neutrophil count (ANC) is the sum of the number of mature
neutrophils and band forms expressed in cells per liter. Blast
clearance is defined as the time interval from diagnosis to the day
where no blast cells were detected in the differential count of
peripheral WBCs.
Statistical analysis
Data were entered, checked and analyzed using SPSS
version 15. Data were expressed as mean ± standard deviation (SD)
for quantitative variables or the number and percentage for
qualitative ones. The Chi-square or Fisher’s exact test, t test and
correlation coefficient test were utilized when appropriate.
Logistic regression was used for prediction of the probability of
occurrence of relapse by analysis of various predictor
variables.
Results
Pretreatment risk factors in the studied
groups
No statistical significant difference was noted
between groups I and II with regard to pretreatment risk factors
including age, gender, central nervous system (CNS) involvement,
TLC and immunophenotype (p=0.19, 1.00, 0.52, 0.21 and 0.23,
respectively). However, a statistically significant difference was
found between groups I and II regarding risk grouping (p=0.04), in
that 80% of patients in group I belonged to the standard risk
category and 20% belonged to the high-risk category, while 55% of
patients in group II were of standard risk and 45% were of
high-risk (Table I).
 | Table IComparison between study group I and
II regarding pretreatment risk factors and risk grouping. |
Table I
Comparison between study group I and
II regarding pretreatment risk factors and risk grouping.
| Pretreatment risk
factor | Group I | Group II | Valuea | P-value |
|---|
| Age (years) |
| Mean ± SD | 6.4±2.8 | 7.5±3.4 | t=1.3 | 0.19 |
| Range | 3–13 | 2–14 | | |
| Gender, n (%) |
| Male | 22 (55) | 11 (55) |
χ2=0.00 | 1.00 |
| Female | 18 (45) | 9 (45) | | |
| CNS, n (%) |
| −ve | 39 (97.5) | 18 (90) |
χ2=0.39 | 0.52 |
| +ve | 1 (2.5) | 2 (10) | | |
| TLC
(109/l) |
| Mean ± SD | 18.98±28.4 | 29.9±38.1 | t=1.25 | 0.21 |
| Range | 0.4–115 | 0.9–125 | | |
| IP |
| Pre-B-ALL | 33 (82.5) | 13 (65) |
χ2=1.41 | 0.23 |
| T-ALL | 7 (17.5) | 7 (35) | | |
| Risk |
| SR | 32 (80) | 11 (55) |
χ2=4.1 | 0.04b |
| HR | 8 (20) | 9 (45) | | |
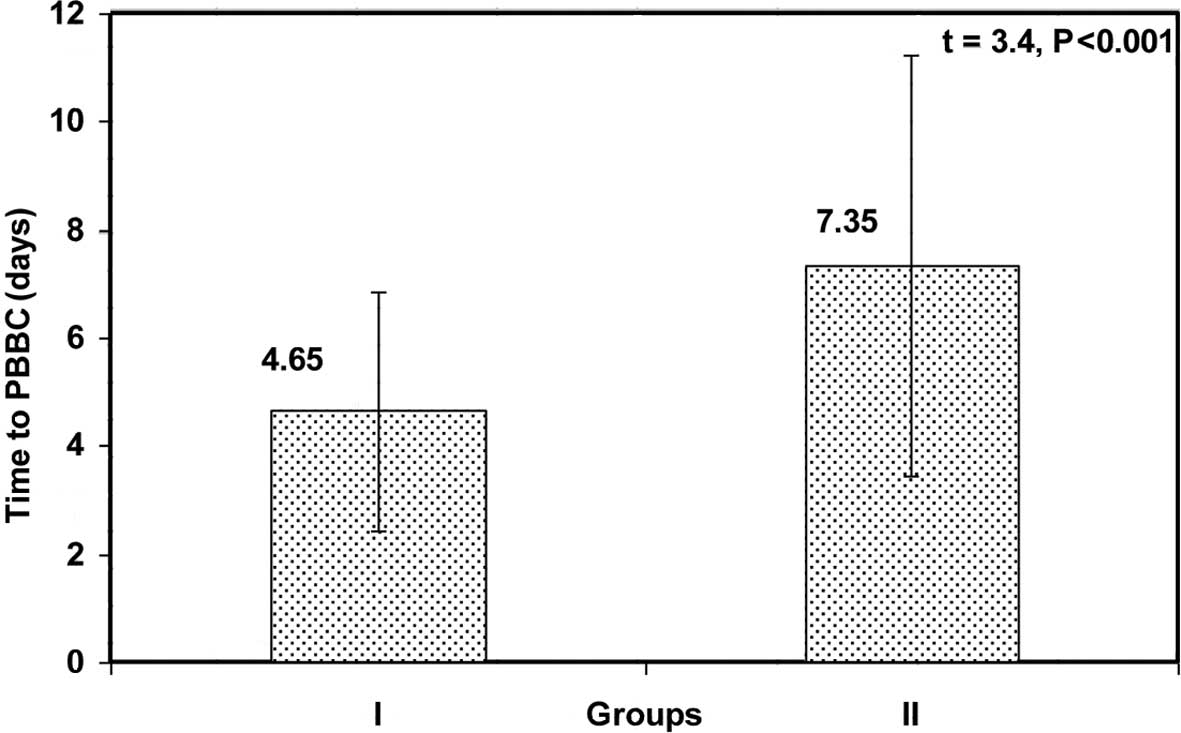
Time to PBBC in the study groups
Time to PBBC was significantly shorter in group I
than in group II (4.65±2.2 vs. 7.35±3.9 days, respectively;
p<0.001) (Fig. 1).
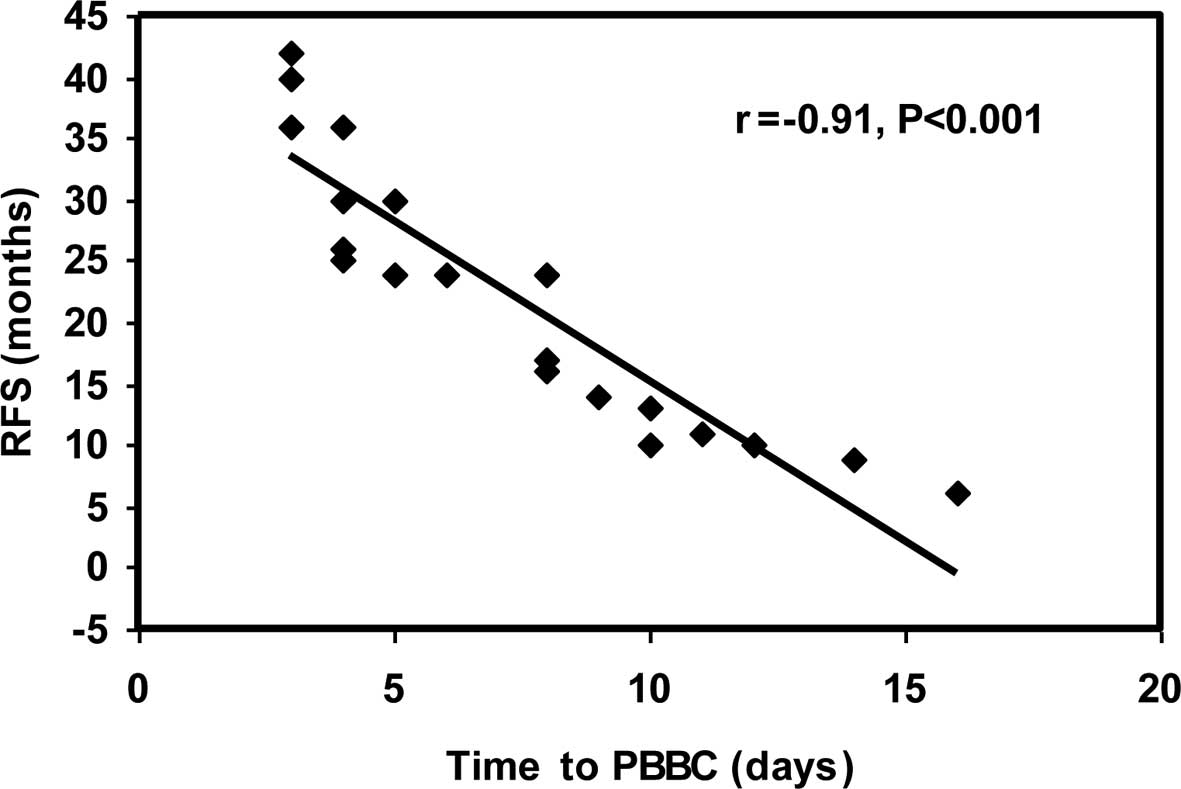
Correlation between time to PBBC and RFS
in group II
A highly significant negative correlation was noted
between time to PBBC and RFS in group II (r=−0.91 and p<0.001)
(Fig. 2).
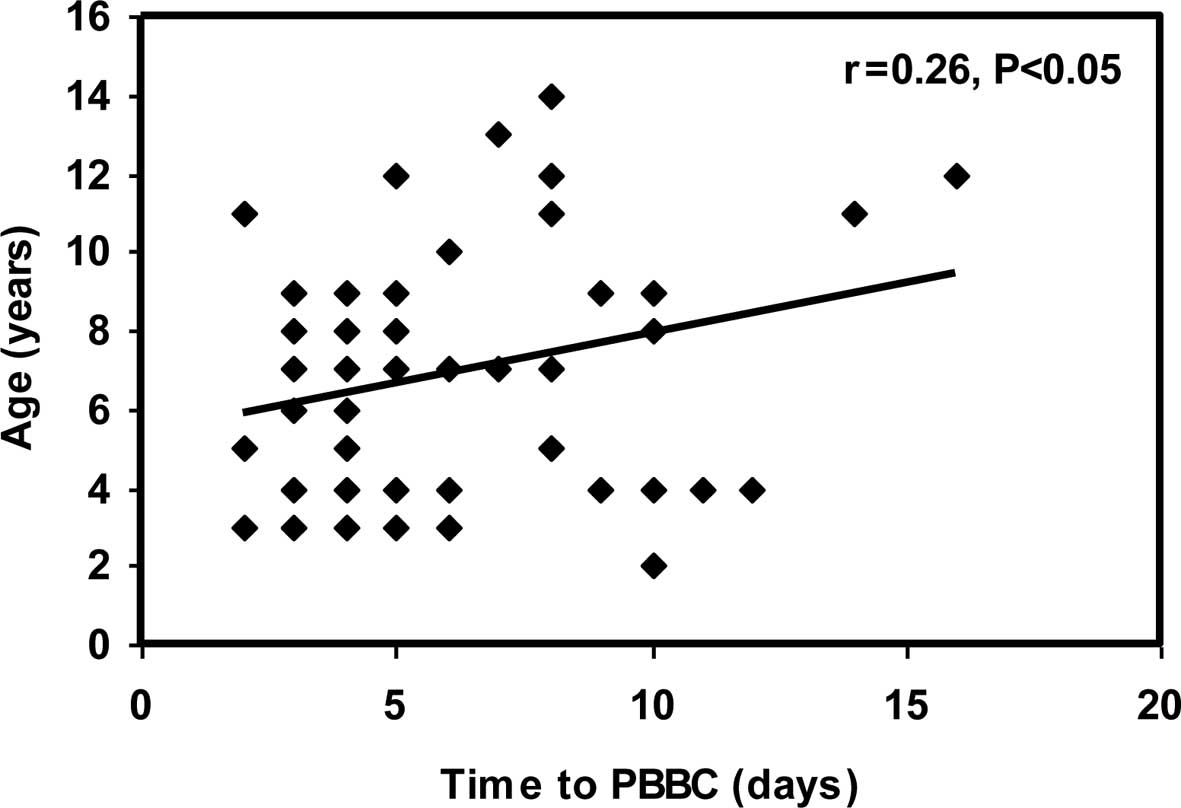
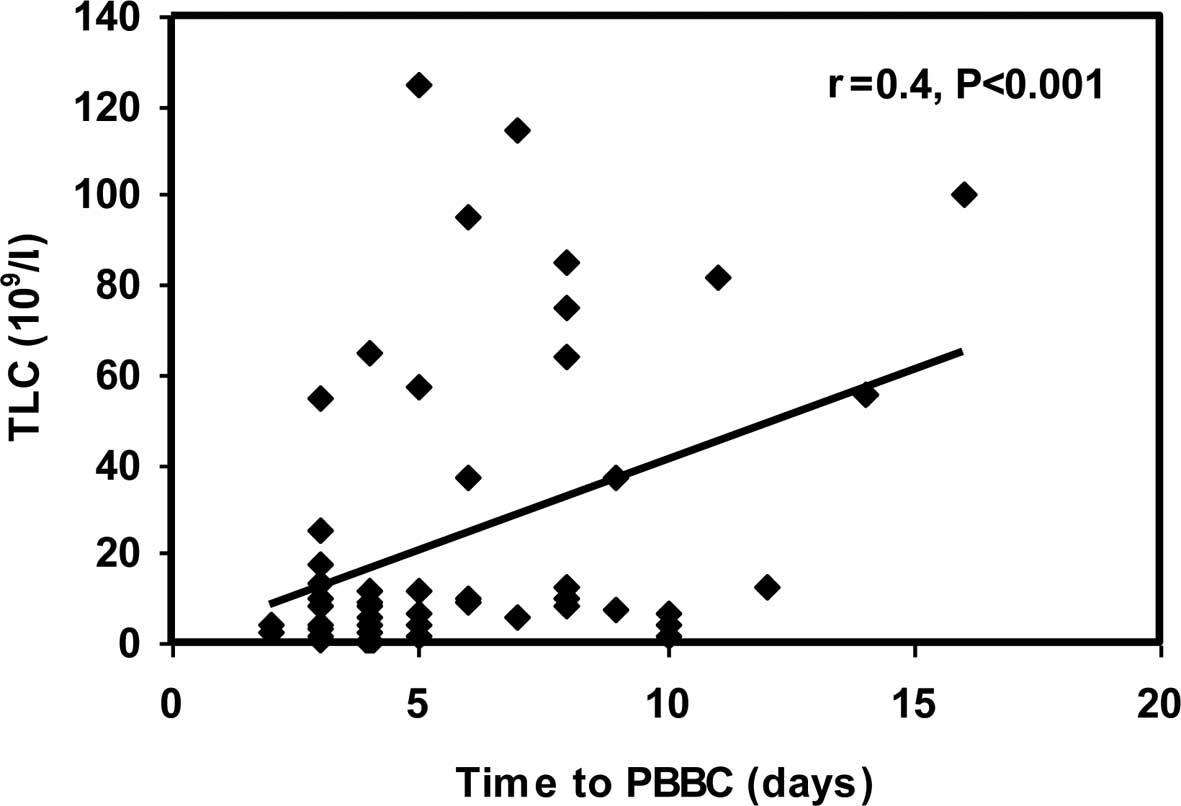
Correlation between time to PBBC and age
and TLC at initial diagnosis
A significant positive correlation was observed
between time to PBBC and age at initial diagnosis (r=0.26;
p<0.05). In addition, a highly significant positive correlation
between time to PBBC and TLC at initial diagnosis (r=0.40;
p<0.001) (Figs. 3 and 4) was noted.
Relationship between time to PBBC and
other pretreatment risk factors
A significant relationship was found between time to
PBBC and males, CNS +ve patients, patients with the T-cell
immunophenotype and high-risk patients (p=0.001, 0.005, 0.003 and
0.009, respectively), with time to PBBC being longer in the latter
patients (Table II).
| Table IIRelationship between time to PBBC and
other pretreatment risk factors. |
Table II
Relationship between time to PBBC and
other pretreatment risk factors.
| Pretreatment risk
factor | Mean ± SD
(range) | t-value | P-value |
|---|
| Gender |
| Male | 6.7±3.4 (3–16) | 3.50 | 0.001a |
| Female | 4.1±1.9 (2–10) | | |
| CNS |
| −ve | 5.3±2.8 (2–14) | 2.89 | 0.005b |
| +ve | 10.3±4.9 (7–16) | | |
| IP |
| Pre-B-ALL | 4.9±2.7 (2–14) | 3.07 | 0.003b |
| T-ALL | 7.6±3.4 (3–16) | | |
| Risk |
| SR | 4.9±2.4 (2–10) | 2.67 | 0.009b |
| HR | 7.2± 4 (2–16) | | |
CBC parameters at the end of induction
therapy in the studied groups
End-of-induction TLC and ANC were significantly
higher in group I than in group II (6.2±3.3 vs. 3.4±3.1
109/l, respectively, for TLC and 3.3±1.9 vs. 1.64±1.7,
respectively, for ANC). No difference was found between the two
groups with regard to hemoglobin level and platelet count at the
end-of-induction therapy (Table
III).
| Table IIIComparison between study group I and
II with regard to CBC parameters at end of induction therapy. |
Table III
Comparison between study group I and
II with regard to CBC parameters at end of induction therapy.
| Parameter | Group I | Group II | t-value | P-value |
|---|
| End-of-induction TLC
(109/l) |
| Mean ± SD | 6.2±3.3 | 3.4±3.1 | 3.19 | 0.001a |
| Range | 0.7–12.5 | 0.44–10.3 | | |
| End-of-induction ANC
(109/l) |
| Mean ± SD | 3.3±1.9 | 1.64±1.7 | 3.35 | 0.001a |
| Range | 0.28–6.8 | 0.11–5.2 | | |
| End-of-induction PLT
count (109/l) |
| Mean ± SD | 146.0±50.3 | 120.7±60.4 | 1.68 | 0.090 |
| Range | 81–265 | 44–285 | | |
| End-of-induction Hb
(g/dl) |
| Mean ± SD | 10.4±1.0 | 9.9±1.1 | 1.84 | 0.060 |
| Range | 7.8–11.7 | 7.9–11.8 | | |
Correlation between end-of-induction ANC
and RFS
A non-significant positive correlation was observed
between end-of-induction ANC and RFS (r=0.13; p>0.05).
Relationship between ANC and pretreatment
risk factors
Low ANC at the end of induction was significantly
correlated with the T-cell immunophenotype and high-risk patients
(p=0.019, 0.016, respectively). No differences in end-of-induction
ANC and other pretreatment risk factors including age, gender, TLC
and CNS involvement were noted (p=0.15, 0.85, 0.26 and 0.13,
respectively) (Table IV).
| Table IVRelationship between ANC and
pretreatment risk factors. |
Table IV
Relationship between ANC and
pretreatment risk factors.
| ANC | | |
|---|
|
| | |
|---|
| Pretreatment risk
factor | Low
n=14 | Average
n=46 | Valuea | P-value |
|---|
| Age (years) |
| Mean ± SD | 7.8±3.7 | 6.5±2.75 | t=1.43 | 0.150 |
| Gender, n (%) |
| Male | 8 (57.1) | 25 (54.3) |
χ2=0.03 | 0.850 |
| Female | 6 (42.9) | 21 (45.7) | | |
| CNS, n (%) |
| −ve | 12 (85.7) | 45 (97.8) |
χ2=1.26 | 0.260 |
| +ve | 2 (14.3) | 1 (2.2) | | |
| TLC
(109/l) |
| Mean ± SD | 33.8±39.7 | 19.2±29 | t=1.5 | 0.130 |
| IP, n (%) |
| Pre-B-ALL | 7 (50) | 39 (84.8) |
χ2=5.44 | 0.019b |
| T-ALL | 7 (50) | 7 (15.2) | | |
| Risk, n (%) |
| SR | 6 (42.9) | 37 (80.4) |
χ2=5.73 | 0.016b |
| HR | 8 (57.1) | 9 (19.6) | | |
Correlation between time to PBBC and CBC
parameters at end of induction
A non-significant negative correlation was observed
between time to PBBC and any of the CBC parameters at
end-of-induction therapy (p>0.05) (Table V).
| Table VCorrelation between time to PBBC and
CBC parameters at end-of-induction therapy. |
Table V
Correlation between time to PBBC and
CBC parameters at end-of-induction therapy.
| CBC parameters at
end of induction | r | P-value | Significance |
|---|
| TLC | −0.12 | >0.05 | NS |
| ANC | −0.16 | >0.05 | NS |
| PLT | −0.07 | >0.05 | NS |
| Hb | −0.11 | >0.05 | NS |
Predictors of relapse in our study
In univariate analyses, our results showed that
high-risk patients, longer time to PBBC, low end-of-induction TLC
and low end-of-induction ANC were significantly associated with
increased risk of relapse (p=0.04, 0.001, 0.001 and 0.001,
respectively). By applying logistic regression for prediction of
the probability of occurrence of relapse by analysis of these
predictors, we found that the time to PBBC was the only predictor
for occurrence of relapse (β ± standard error = 0.051±0.018;
p<0.001). However, risk categorization, end-of-induction TLC and
end-of-induction ANC were found not to add significance to this
model.
Discussion
Approximately 80% of children and adolescents with
ALL can be cured. To reduce the rate of relapses, but also to limit
treatment toxicity, risk-adapted treatment has been attempted
following the identification of the most specific prognostic
factors. In addition to clinical factors such as age and WBC, or
leukemia cell factors such as immunophenotype and cytogenetics, the
in vivo response to therapy has evolved as the most
significant predictor for relapse (1).
The rapidity with which leukemia cells are
eliminated following onset of treatment is associated with outcome,
as is the level of residual disease at the end of induction
therapy. Since treatment response is affected by the drug
sensitivity of leukemic cells and host pharmacodynamics and
pharmacogenomics (5), this measure
has strong prognostic significance. In the present study, the time
to PBBC was significantly shorter in group I than in group II
(4.65±2.2 vs. 7.35±3.9 days, respectively; p<0.001). This is in
agreement with previous studies conducted by Rautonen et al
(6) and Gajjar et al
(7) who concluded that persistence
of circulating blasts following 1 week of multiagent chemotherapy
confers a poor prognosis in childhood ALL. Similarly, Laughton
et al (3) studied the level
of chemoresponsiveness of ALL blasts in vivo and reported
that a time greater than a median of 4 days to the disappearance of
peripheral lymphoblasts was also associated with an increased risk
of relapse.
Our results showed that there was a highly
significant negative correlation between time to PBBC and RFS
(r=−0.91 and p<0.001), and a shorter time to PBBC was associated
with a longer RFS. Gajjar et al (7) found that patients with a more rapid
response in terms of PBBC had an RFS of 64 vs. 39% for slower
responders. The same finding was reported in a Pediatric Oncology
Group study conducted by Griffin et al (8). A study published by investigators from
Mayo Clinic and Northwestern University showed that, as in
childhood ALL, the time to clearance of circulating blasts from
peripheral blood also serves as an independent prognostic marker of
RFS and overall survival (OS) for AML (9).
In the present study, there was a highly significant
positive correlation between time to PBBC and TLC at initial
diagnosis (r=0.40 and p<0.001) as well as a significant positive
correlation between time to PBBC and age at initial diagnosis
(r=0.26 and p<0.05). Regarding other pretreatment risk factors,
there was a significant relationship between time to PBBC and
males, CNS +ve patients, patients with a T-cell immunophenotype and
high-risk patients (p=0.001, 0.005, 0.003 and 0.009, respectively)
with time to PBBC being longer in the latter patients. Gajjar et
al (7) found that patients with
a persistence of circulating blasts after 1 week of multiagent
chemotherapy were more likely to have adverse presenting features,
such as increased leukocyte count, mediastinal mass, CNS leukemia,
T-cell phenotype and lack of CDl0 expression, while no relationship
was found with patient age. In addition, Manabe et al
(10) reported that 25.6% of T-ALL
patients were classified in the Day8NoBlasts, whereas 34.0% of
B-ALL patients belonged to the Day8NoBlasts group.
Our study showed that end-of-induction TLC and ANC
were significantly higher in group I than in group II patients
(6.2±3.3 vs., 3.4±3.1 109/l, respectively, for TLC and
3.3±1.9 vs. 1.64±1.7, respectively, for ANC). Our results indicate
that a more rapid recovery of end-of-induction TLC and ANC
correlated with a reduced risk of relapse. Additional measures of
myelosuppression at the end of induction, including hemoglobin
level and platelet count, did not show any difference between the
studied groups. Our results corroborate those reported by Laughton
et al (3) who found a
significant association between risk of relapse and both low TLC
and ANC at the end of induction. These authors found that neither
hemoglobin level nor platelet count at the end of induction was
associated with increased risk of relapse. De Angulo and colleagues
(11), in their study on 171 de
novo ALL and AML patients ≤21 years of age, found that the
end-of-induction platelet count was not predictive of relapse in
ALL patients. However, these authors found that a platelet count of
≥100,000 on Day 28 was able to predict favorable OS for patients
with AML. Platelet recovery has also been reported to be a
prognostic marker in older adults with ALL (12).
The mechanism whereby a more rapid recovery of
end-of-induction ANC correlates with a reduced risk of later
relapse has yet to be elucidated. One possibility is that
end-of-induction ANC is a general marker of the ability of a
patient to exhibit normal hematologic cell recovery following
chemotherapy.
Although a highly significant negative correlation
was found between time to PBBC and RFS, we found a non- significant
positive correlation between end-of-induction ANC and RFS. Contrary
to our data, Laughton et al (3) found that end-of-induction ANC was
highly significantly associated with RFS (p<0.0001).
In the present study, low ANC at the end of
induction was significantly associated with T-cell immunophenotype
and high-risk patients. No differences in end-of-induction ANC and
other pretreatment risk factors including age, gender, TLC and CNS
affection were noted. Laughton et al (3) found that there were no differences in
patient characteristics at initial diagnosis, such as age or TLC,
for patients with a low ANC at end-of-induction therapy.
We investigated the correlation between time to
PBBC, which reflects the chemosensitivity of malignant
lymphoblasts, and the CBC parameters at end of induction, which
reflect the chemosensitivity of normal hematopoietic cells. We
found that these factors were not significantly correlated,
confirming that they behave independently in response to
chemotherapy. Laughton et al (3) reported that the early peripheral blast
response was not associated with the end-of-induction ANC.
In conclusion, we showed that time to PBBC as a
measure of chemosensitivity of malignant cells, and
end-of-induction TLC and ANC as a measure of chemosensitivity of
normal hematopoietic cells in ALL patients can improve prediction
of relapse, allowing for the modification of chemotherapy intensity
at an earlier time point during the course of therapy. A wider
prospective, randomized, controlled trial is required to confirm
our results.
References
|
1
|
Schrappe M: Prognostic factors in
childhood acute lymphoblastic leukemia. Indian J Pediatr.
7:817–824. 2003. View Article : Google Scholar
|
|
2
|
Faderl S and Estrov Z: Hematopoietic
recovery following induction therapy of acute leukemias: prognostic
implications and a new look at the definition of remission. Leuk
Lymphoma. 45:67–71. 2004. View Article : Google Scholar : PubMed/NCBI
|
|
3
|
Laughton SJ, Ashton LJ, Kwan E, Norris MD,
Haber M and Marshall GM: Early responses to chemotherapy of normal
and malignant hematologic cells are prognostic in children with
acute lymphoblastic leukemia. J Clin Oncol. 23:2264–2271. 2005.
View Article : Google Scholar : PubMed/NCBI
|
|
4
|
McLeod HL, Krynetski EY, Relling MV and
Evans WE: Genetic polymorphism of thiopurine methyltransferase and
its clinical relevance for childhood acute lymphoblastic leukemia.
Leukemia. 14:567–572. 2000. View Article : Google Scholar : PubMed/NCBI
|
|
5
|
Relling MV and Dervieux T:
Pharmacogenetics and cancer therapy. Nat Rev Cancer. 1:99–108.
2001. View
Article : Google Scholar
|
|
6
|
Rautonen J, Hovi L and Siimes MA: Slow
disappearance of peripheral blast cells: an independent risk factor
indicating poor prognosis in children with acute lymphoblastic
leukemia. Blood. 71:989–991. 1998.PubMed/NCBI
|
|
7
|
Gajjar A, Ribeiro R, Hancock ML, Rivera
GK, Mahmoud H, Sandlund JT, Crist WM and Pui CH: Persistence of
circulating blasts after 1 week of multiagent chemotherapy confers
a poor prognosis in childhood acute lymphoblastic leukemia. Blood.
86:1292–1295. 1995.PubMed/NCBI
|
|
8
|
Griffin TC, Shuster JJ, Buchanan GR,
Murphy SB, Camitta BM and Amylon MD: Slow disappearance of
peripheral blood blasts is an adverse prognostic factor in
childhood T cell acute lymphoblastic leukemia: a Pediatric Oncology
Group study. Leukemia. 14:792–795. 2000. View Article : Google Scholar : PubMed/NCBI
|
|
9
|
Elliott MA, Litzow MR, Letendre LL, Wolf
RC, Hanson QA, Tefferi A and Tallman MS: Early peripheral blood
blast clearance during induction chemotherapy for acute myeloid
leukemia predicts superior relapse-free survival. Blood.
110:4172–4174. 2007. View Article : Google Scholar
|
|
10
|
Manabe A, Ohara A, Hasegawa D, Koh K,
Saito T, Kiyokawa N, Kikuchi A, Takahashi H, Ikuta K, Hayashi Y,
Hanada R and Tsuchida M: Significance of the complete clearance of
peripheral blasts after 7 days of prednisolone treatment in
children with acute lymphoblastic leukemia: the Tokyo Children’s
Cancer Study Group Study L99-15. Haematologica. 93:1155–1160.
2008.PubMed/NCBI
|
|
11
|
De Angulo G, Yuen C, Palla SL, Anderson PM
and Zweidler-McKay PA: Absolute lymphocyte count is a novel
prognostic indicator in ALL and AML: implications for risk
stratification and future studies. Cancer. 112:407–415.
2008.PubMed/NCBI
|
|
12
|
Faderl S, Thall PF, Kantarjian HM and
Estrov Z: Time to platelet recovery predicts outcome of patients
with de novo acute lymphoblastic leukemia who have achieved a
complete remission. Br J Haematol. 117:869–874. 2002. View Article : Google Scholar : PubMed/NCBI
|