Introduction
Breast cancer is the most common type of cancer and
a leading cause of cancer-related mortality in women in developed
countries (1). Survival following
diagnosis is dependent upon a range of biological factors,
including tumor stage, lymph node involvement, pathological grade,
hormone receptors and Her2 status. Nevertheless, breast cancer
patients at the same stage of disease and sharing similar
pathological diagnoses can experience markedly different clinical
courses (2). Numerous beneficial
prognostic indicators were constructed in patients with early
breast cancer (EBC), including the Nottingham Prognostic Index
(3), St. Gallen criteria (4), NIH consensus guidelines (5) and Adjuvant! Online (6). However, molecular classification of
EBC with the use of minimal sets of genes expressed in the tumor
appears to be a more powerful tool for prognostication or
prediction of response than current prognostic indicators (7). The most widely clinically used test is
the 21-gene recurrence score assay (Oncotype DX), which
predicts risk of recurrence in patients with estrogen receptor
(ER)-positive EBC by measuring the expression of 21 genes in
paraffin-embedded tumor material (8). In Israel, Oncotype DX has been
funded by one or more of the four nationwide health care
organizations since 2006. Despite the obvious advantages of the
molecular classification of EBC, these studies usually require
sending specimens to a central laboratory, are costly and may delay
treatment decisions. The present study reports an analysis of the
use of three well-recognized immunohistochemical biomarkers,
cathepsin D, E-cadherin and Ki67, in patients with EBC.
Patients and methods
Study population
Following approval by the Institutional Review
Board, we searched our registry and computerized database to
identify patients who were diagnosed at the Soroka University
Medical Center (SUMC), Israel, with a first primary breast cancer
between January 1st, 1993 and December 31st, 2000. Patient medical
records were retrospectively reviewed, and demographical, clinical
and pathological data were recorded. Only patients with a
pathological diagnosis of the infiltrating-ductal carcinoma type,
for whom adequate pathological specimens and clinical data were
available, were included in the study. Patients with a previous
history of another primary tumor, or those who had previously
received chemotherapy and/or radiotherapy were excluded from the
study. Patients diagnosed with pure ductal carcinoma in
situ, lobular invasive or in situ tumors, as well as
patients with bilaterality were excluded from the study. The study
population included 270 patients who comprised 35% of the total
breast cancer patients screened for the study. SUMC is a regional
referral hospital providing chemo-and radiotherapy for the
population of southern Israel. Baseline clinicopathological data
included tumor size, local invasion and lymph node metastasis
according to American Joint Committee on Cancer classification for
breast cancer, 2002 version (9). In
all cases in which adequate surgery was performed, pathological
staging was a determining factor. Patients received chemotherapy,
radiotherapy and hormonal treatments according to standards of that
time-period. No patients with Her2-overexpressing disease received
trastuzumab in the adjuvant setting.
Histological examination
H&E-stained slides were reviewed for
confirmation of histopathological diagnosis and for selection of
adequate specimens for analysis. The histological identification of
breast cancer was determined as recommended by the World Health
Organization (WHO). Grade was determined according to the Allred
score applying the modified Scarff-Bloom-Richardson scoring system
(10) by a pathologist (N.S.V.) who
was blinded to the clinical data. In each case, a representative
paraffin block of the tumor was selected and sections were selected
for immunohistochemical studies.
Immunohistochemistry (IHC)
Immunohistochemical studies were performed on
formalin-fixed, paraffin-embedded tissue sections with the use of
standard techniques. The following immunohistochemical studies were
performed: ER and progesterone receptors (PgR), Her2, Ki67,
cathepsin D and E-cadherin. Expression for cases with a Her2
HercepTest score of 3 were scored as positive, and those of 0 or 1
were scored as negative, as described in the HercepTest (Dako)
protocol (11). Cases with Her2
scores of 2 were re-evaluated by fluorescence in situ
hybridization (FISH) assays. Table
I shows data regarding the antibodies used in the present
study.
 | Table IAntibodies, suppliers, dilutions and
techniques used for immunohistochemistry and the parameters
evaluated. |
Table I
Antibodies, suppliers, dilutions and
techniques used for immunohistochemistry and the parameters
evaluated.
| Antibody | Clone/Ab | Source | Dilution | Technique | Parameters
evaluated |
|---|
| Anti-human E-cadherin
mouse, monoclonal | NCH-38 | DakoCytomation,
Denmark | 1:100 | Ventana Benchmark,
Nexes | Percentage and
intensity |
| Anti-human Cathepsin
D mouse, monoclonal | DC2000 | DakoCytomation,
Denmark | 1:100 | Ventana Benchmark,
Nexes | Percentage and
intensity |
| Anti-human Ki-67
mouse, monoclonal | MIB-1 | DakoCytomation,
Denmark | 1:300 | Ventana Benchmark,
Nexes | Percentage and
intensity |
| Anti-human ER mouse,
monoclonal | NCL-ERp | Novocastra, Newcastle
upon Tyne, UK | 1:100 | Dako Autostained | Percentage and
intensity |
| Anti-human PgR mouse,
monoclonal | PgR636 | Novocastra, Newcastle
upon Tyne, UK | 1:200 | Dako Autostained | Percentage and
intensity |
| Anti-human Her2/NEU
mouse, monoclonal | TAB250 | Zymed, South San
Francisco, CA, USA | 1:100 | Dako Autostained | Percentage and
intensity |
Scoring of stained slides
The immunohistochemical localization of ER and PgR
as well as that of E-cadherin, cathepsin D and Ki67, was scored by
applying a semi-quantitative method, incorporating both the
intensity and the distribution of specific staining as described by
Detere et al (12). A
minimum of 500 tumor cells were counted. If differences occurred
between spot intensities, the most positive spot was considered.
The evaluations were recorded as percentages of positively stained
target cells in each of the four intensity categories, which were
denoted as 0 (no staining), 1+ (weak but detectable above control),
2+ (distinct) or 3+ (strong). For each tissue, a value designating
the H-Score was derived by adding the percentages of cells staining
at each intensity (Pi) multiplied by the
weighted intensity of staining, as in the formula: H-Score =
∑Pi (i + 1), where i = 1, 2,
3 and Pi varies from 0 to 100%.
Statistical analysis
Descriptive statistics were calculated as
frequencies to summarize clinicopathological characteristics.
Outcome measures for this study were breast cancer-related events
(BCREs), relapse-free and breast cancer-specific survival (RFS and
BCSS). RFS was defined as the time from the date of pathological
diagnosis to the first local, regional or distant recurrence or
death from breast cancer prior to a recorded relapse. Locoregional
recurrence was defined either as local recurrence in the original
tumor bed with the same histological features of the primary tumor,
or regional recurrence in the lymph nodes. Distant recurrence was
defined as the presence of metastatic disease in all other
locations.
For patients with multiple BCREs during follow-up,
only the first episode was considered in the analysis. New
ipsilateral breast cancer or other non-breast primary tumors were
considered as censoring events. In the absence of any of these
events, observation time was censored at the latest follow-up
visit. Only breast cancer-related death was considered in the
analysis for BCSS. Patients surviving to the end of the follow-up
period or those who succumbed during follow-up of any cause other
than breast cancer were censored from the BCSS analysis. The
χ2 and Mann-Whitney U tests were used as appropriate.
Hazard ratios for RFS and BCSS were assessed using a Cox model that
included characteristics such as age, menopausal status, tumor
stage (T), nodal stage (N), ER and PgR status, Her2 status, grade
and the scores of cathepsin D, E-cadherin and Ki67. Age was
considered as a binary variable with a cut-off value defined at 50
years. The cut-off value for T was >20 vs. ≤20 mm. The cut-off
value for N was >3 nodes involved vs. 0 or 1–3. The cut-off
value for ER and PgR was defined as >10 vs. ≤10%. The cut-off
value for grade was defined as high vs. intermediate or low. The
cut-off value for the three biomarkers, cathepsin D, E-cadherin and
Ki67, was dichotomized as the fourth quartile vs. the lower three
quartiles.
Univariate Cox proportional hazards regression
models were estimated by fitting a Cox regression model, and
statistically significant variables were included in the
multivariate Cox proportional hazards regression models using
stepwise selection. Survival curves were plotted as Kaplan-Meier
survivor functions. Follow-up was truncated at 130 months for the
purposes of plotting. Receiver operating characteristic (ROC)
analysis and corresponding area under the curve (AUC) statistics
were used for the discriminatory accuracy of models. The following
variables were included in the clinicopathological model: T, N,
grade, percentage of ER- and PgR-positive cells, and Her2 status.
Numerical H-Scores of each biomarker were analyzed as continuous
variables and were included in the two- and three-biomarker
models.
Statistical tests were two-sided and statistical
significance was defined as P<0.05. Statistical analyses were
conducted using SPSS version 17 for Windows (SPSS Inc., Chicago,
IL, USA). This study was written in accordance with the Reporting
Recommendations for Tumor Marker Prognostic Studies guidelines
(13).
Results
Table II shows the
frequencies of baseline characteristics, adjuvant treatments and
immunohistochemical markers of all breast cancer patients,
separated into two groups according to the occurrence of BCREs.
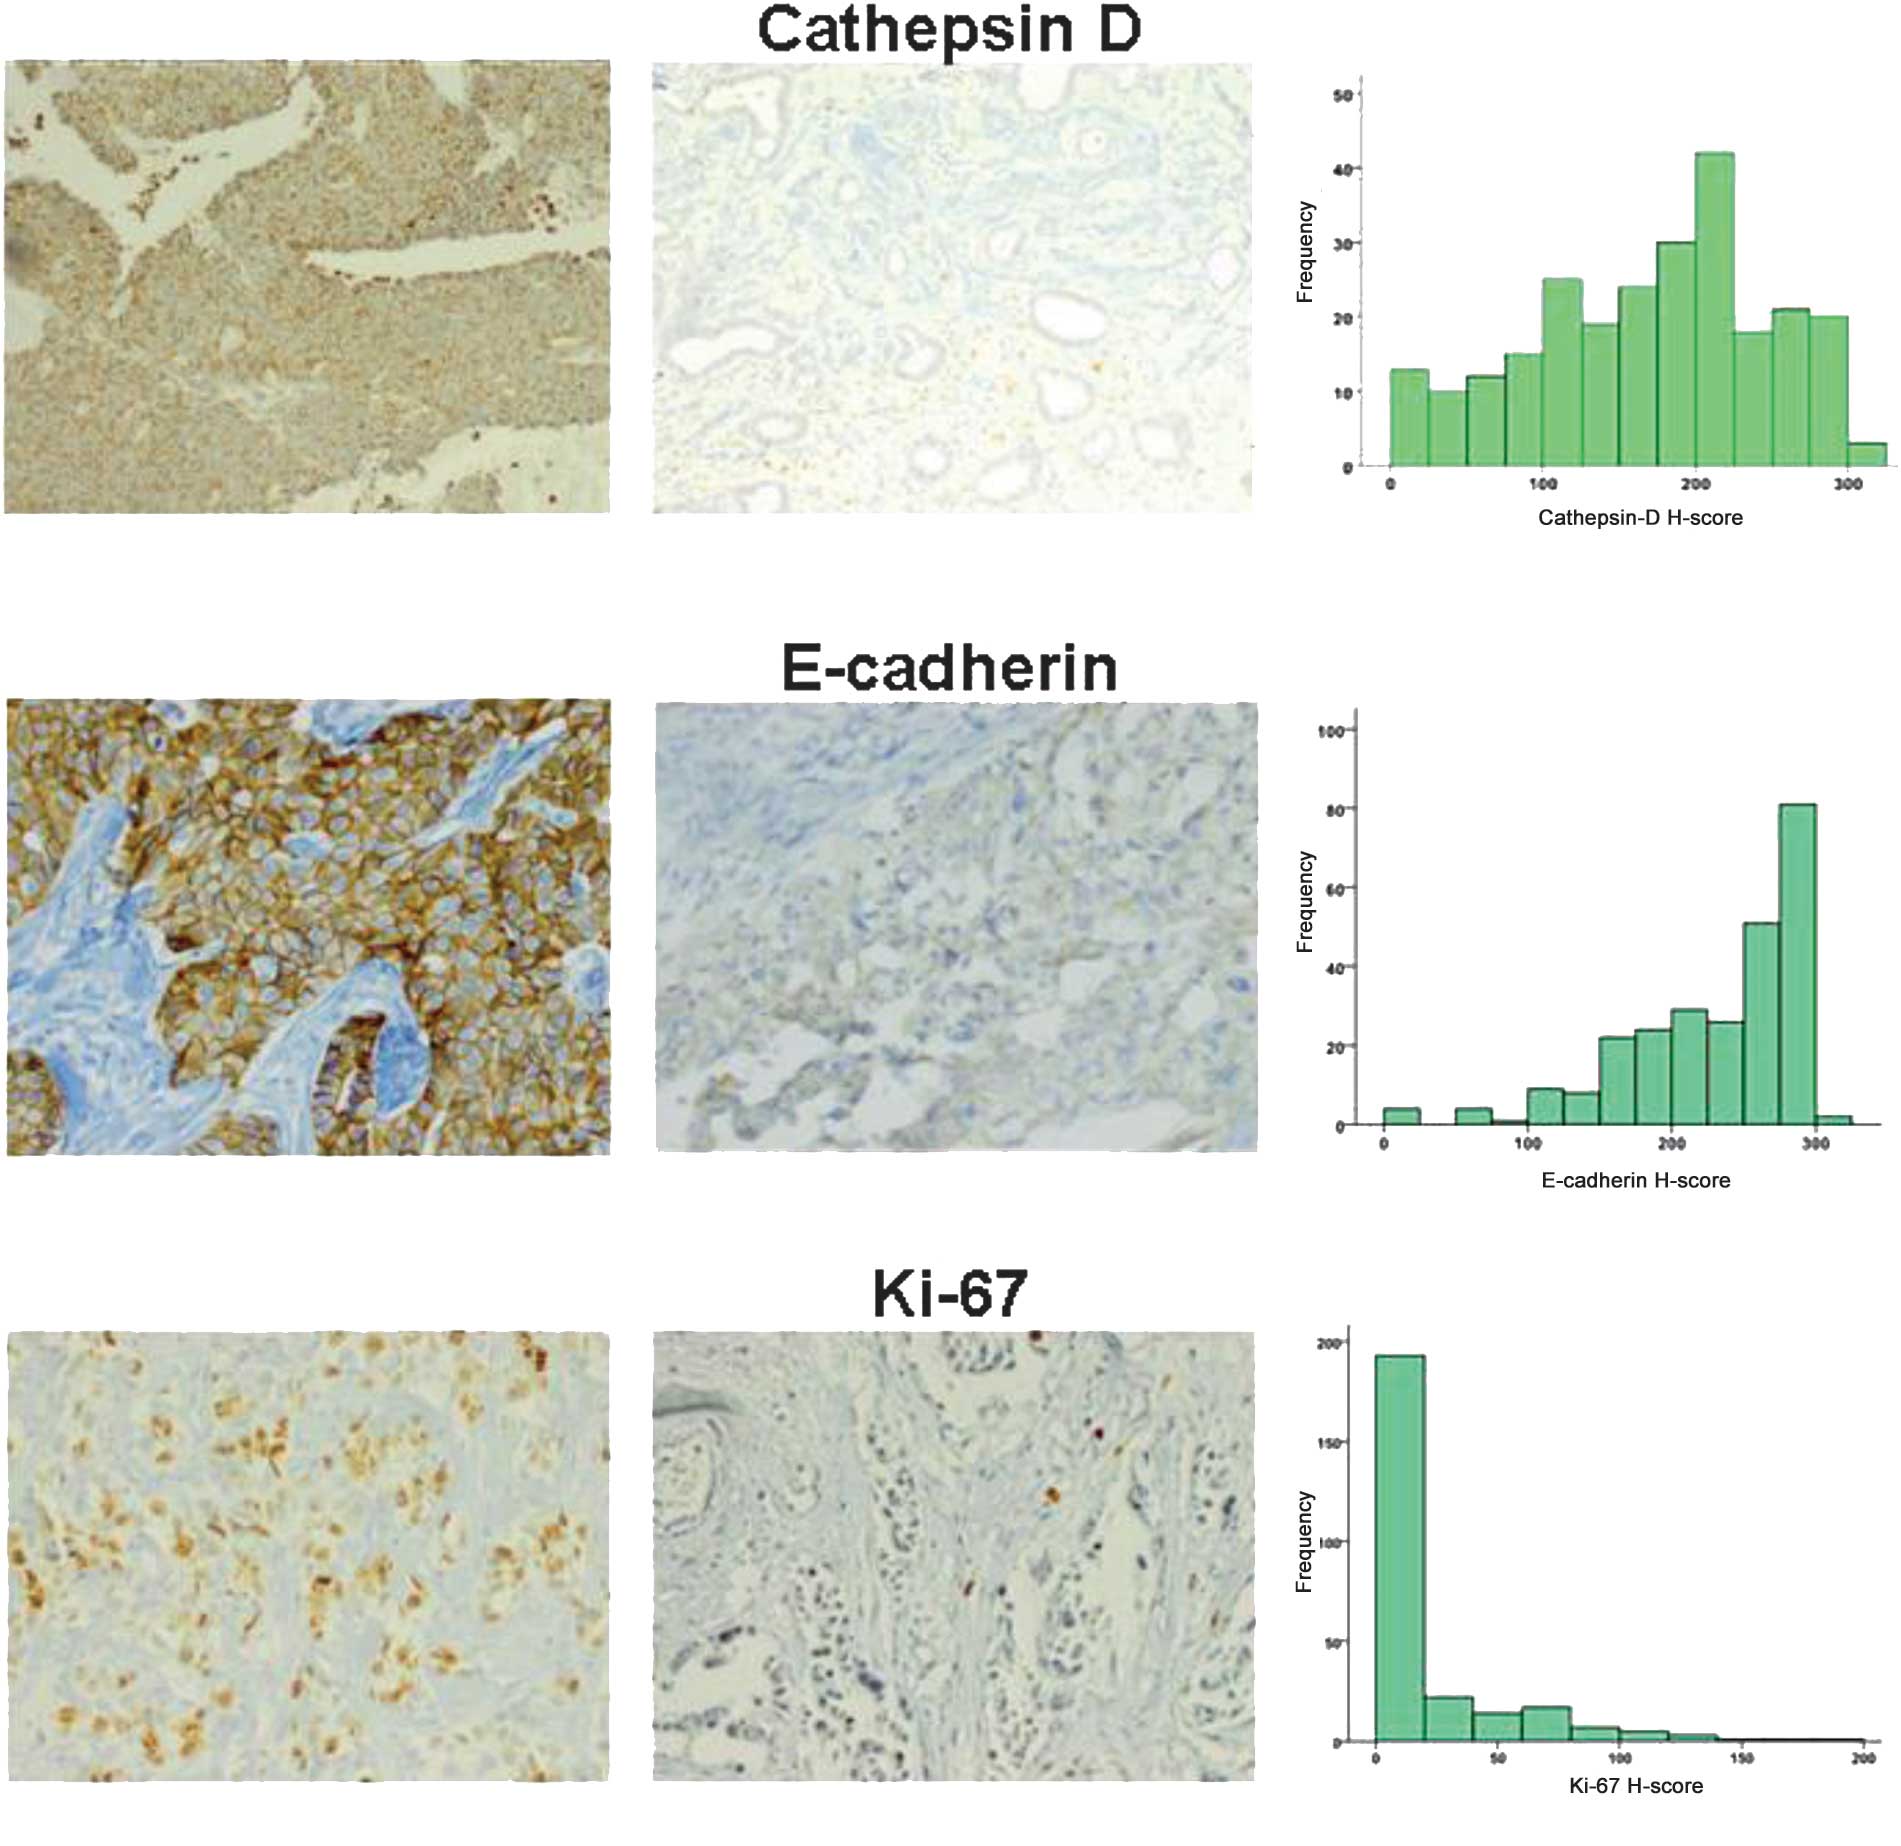
Fig. 1 shows the characteristics of
the immunohistochemical stains for cathepsin D, E-cadherin and
Ki67, including representative cases and histograms of each. In
univariate analyses, the following parameters were associated with
BCREs: i) tumor size (P<0.001), ii) ER-positive status (P=0.01),
iii) PgR-positive status (P=0.01), iv) Her2-positive status
(P=0.02) and v) lymph node involvement (P=0.05). No statistically
significant correlation was found between tumor grade and BCRE.
Table III shows the scores of
immunohistochemical markers according to the occurrence of BCREs in
all breast cancer patients. None of the three study biomarkers
correlated with the occurrence of BCREs.
| Table IIFrequencies of conventional prognostic
factors, adjuvant treatments and immunohistochemical markers in the
early breast cancer patients.a |
Table II
Frequencies of conventional prognostic
factors, adjuvant treatments and immunohistochemical markers in the
early breast cancer patients.a
| Characteristic | All patients
(n=270) | Event (n=39) | No event (n=231) | P-value |
|---|
|
|
|
| |
|---|
| No. | % | No. | % | No. | % | |
|---|
| Age (year) | | | | | | | 0.990 |
| Mean | 57.3±12.1 | | 57.3±13.8 | | 57.3±11.9 | | |
| Range | 29–89 | | 29–83 | | 32–89 | | |
| ≤40 | 16 | 6 | | | | | |
| >40 | 254 | 94 | | | | | |
| Menopause state | | | | | | | 0.440 |
| Pre- and
peri-menopausal | 69 | 26 | 12 | 31 | 57 | 25 | |
|
Post-menopausal | 181 | 67 | 27 | 69 | 172 | 75 | |
| Unknown | 20 | 7 | | | | | |
| Tumor stage, TNM
class | | | | | | | <0.001 |
| T1a | 5 | 2 | 0 | 0 | 5 | 2 | |
| T1b | 31 | 12 | 1 | 2 | 30 | 14 | |
| T1c | 126 | 48 | 10 | 28 | 112 | 52 | |
| T2 | 91 | 35 | 23 | 62 | 68 | 30 | |
| T3 | 7 | 3 | 2 | 2 | 5 | 2 | |
| T4 | 0 | 0 | 0 | 0 | 0 | 0 | |
| Unknown | 10 | 4 | | | | | |
| Positive nodes | | | | | | | 0.050 |
| 0–3 | 228 | 86 | 28 | 76 | 200 | 88 | |
| 0 | 163 | 60 | | | | | |
| 1–3 | 65 | 24 | | | | | |
| >4 | 37 | 14 | 9 | 24 | 28 | 12 | |
| 4–10 | 24 | 9 | | | | | |
| >10 | 13 | 5 | | | | | |
| Unknown | 5 | 2 | | | | | |
| Tumor grade | | | | | | | 0.420 |
| Low | 43 | 16 | 4 | 12 | 39 | 20 | |
| Intermediate | 110 | 41 | 11 | 48 | 95 | 49 | |
| High | 71 | 26 | 13 | 39 | 58 | 30 | |
|
Undetermined/unknown | 46 | 17 | | | | | |
| ER status | | | | | | | 0.040 |
| ER positive
status, >10% of tumor cells | 199 | 74 | 29 | 64 | 170 | 78 | |
| ER negative
status, <10% of tumor cells | 63 | 23 | 15 | 42 | 48 | 21 | |
| Unknown | 8 | 3 | | | | | |
| gR status | | | | | | | 0.040 |
| PgR-positive
status, >10% of tumor cells | 197 | 75 | 30 | 64 | 167 | 78 | |
| PgR-negative
status, <10% of tumor cells | 64 | 24 | 16 | 42 | 48 | 21 | |
| Unknown | 9 | 3 | | | | | |
| Her2/neu
status | | | | | | | 0.080 |
| Her2/neu
overexpression | 15 | 6 | 4 | 11 | 11 | 5 | |
| Her2/neu-negative
status | 245 | 94 | 33 | 88 | 212 | 95 | |
| Unknown | 10 | 4 | | | | | |
| ER, PgR, Her2/neu
(Triple) negative status | 31 | 11 | 7 | 18 | 24 | 10 | 0.180 |
| Event type | | | | | | | |
| Metastasis | 34 | 13 | 34 | 90 | 0 | 0 | |
| Locoregional
relapse | 1 | 0.4 | 1 | 3 | 0 | 0 | |
| Contralateral
breast cancer | 2 | 0.7 | 2 | 5 | 0 | 0 | |
| Adjuvant
tamoxifen | | | | | | | |
| Yes | 212 | 78 | | | | | |
| No | 54 | 20 | | | | | |
| Unknown | 4 | 2 | | | | | |
| Adjuvant
chemotherapy | | | | | | | |
| Yes | 146 | 54 | | | | | |
| No | 121 | 45 | | | | | |
| Unknown | 3 | 1 | | | | | |
| Adjuvant
radiotherapy | | | | | | | |
| Yes | 192 | 71 | | | | | |
| No | 72 | 27 | | | | | |
| Unknown | 8 | 2 | | | | | |
| Ki67 score | | | | | | | |
| Yes | 264 | 98 | | | | | |
| No | 6 | 2 | | | | | |
| E-cadherin
score | | | | | | | |
| Yes | 261 | 97 | | | | | |
| No | 9 | 3 | | | | | |
| Cathepsin D
score | | | | | | | |
| Yes | 252 | 93 | | | | | |
| No | 18 | 7 | | | | | |
| Table IIIScores of immunohistochemical markers
according to the occurrence of breast cancer-related events in the
early breast cancer patients. |
Table III
Scores of immunohistochemical markers
according to the occurrence of breast cancer-related events in the
early breast cancer patients.
| Variable | All patients
(n=270) | Event (n=39) | No event
(n=231) | P-value |
|---|
| ER H-Score |
| Mean | 102±94 | 78±100 | 106±92 | 0.10 |
| Median | 90 | 15 | 90 | |
| PgR H-Score |
| Mean | 86±84 | 64±80 | 90±85 | 0.09 |
| Median | 70 | 30 | 70 | |
| Ki67 H-Score |
| Mean | 19±31 | 17±28 | 19±31 | 0.66 |
| Median | 5 | 2 | 5 | |
| E-cadherin
H-Score |
| Mean | 229±62 | 227±69 | 229±61 | 0.86 |
| Median | 250 | 250 | 250 | |
| Cathepsin D
H-Score |
| Mean | 168±77 | 172±84 | 168±76 | 0.75 |
| Median | 180 | 185 | 180 | |
Analysis for RFS
Univariate Cox proportional hazard regression
analyses for RFS were performed according to following variables:
age <50 years, pre-/peri-menopausal status, tumor size >20
mm, involvement of lymph nodes of >3, positive ER, positive PgR,
Her2 overexpression, high-grade tumors, and cathepsin D, E-cadherin
and Ki67 in quartiles (highest quartile as the reference group).
Among those models, the following parameters were statistically
significant in the Cox regression analysis (Table IV): i) tumor size (HR=2.94; P=0.01,
95% CI, 1.41–6.10); ii) positive ER (HR=0.40; P=0.01, 95% CI,
0.21–0.78); iii) positive PgR (HR=0.42; P=0.01, 95% CI, 0.22–0.80);
iv) Her2 overexpression (HR=3.11; P=0.01, 95% CI, 1.36–7.10). In
the multivariate Cox proportional hazard regression analyses, the
only variables that were statistically significant included tumor
size (HR=2.63; P=0.01, 95% CI, 1.26–5.54) and PgR status (HR=0.41;
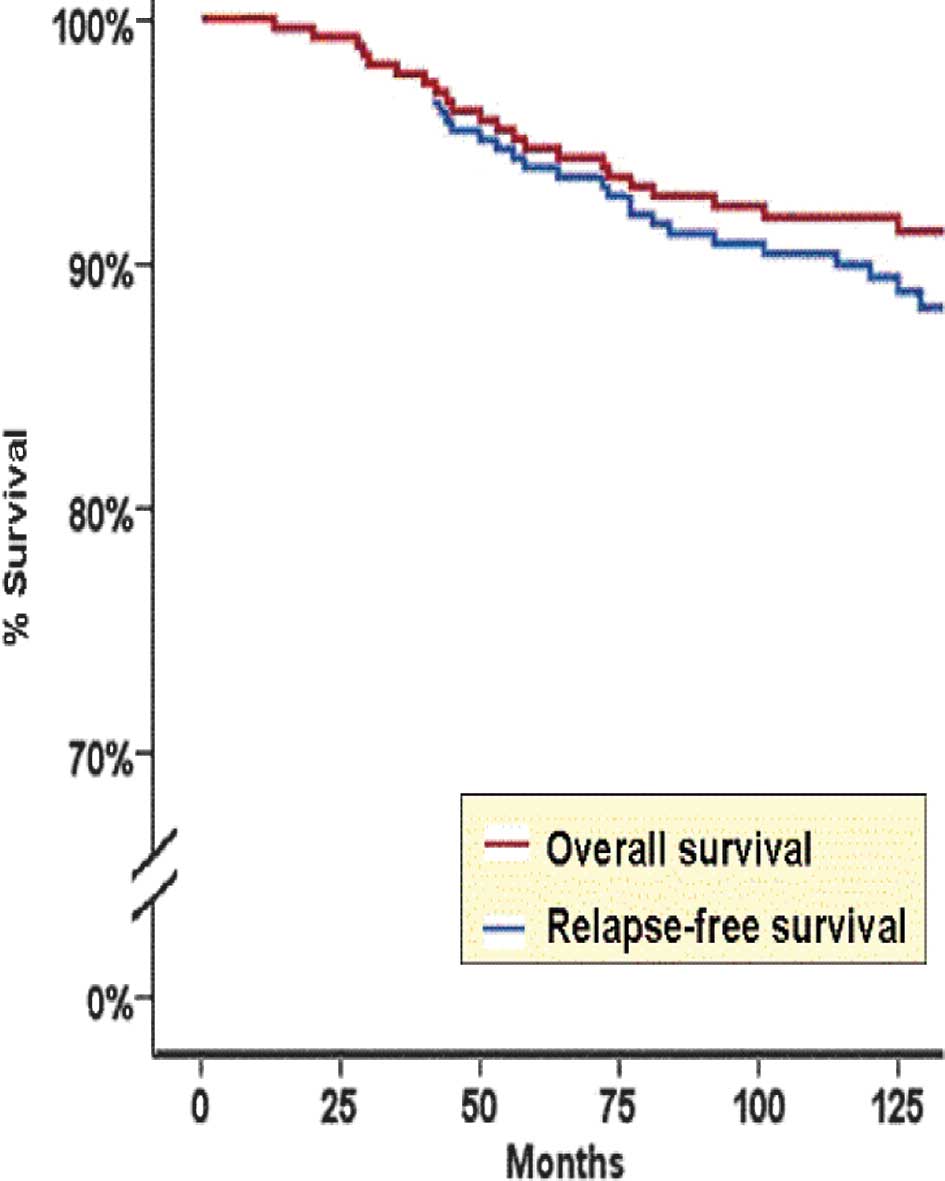
P=0.01, 95% CI, 0.21–0.82). The Kaplan-Meier RFS curve for all
breast cancer patients is shown in Fig.
2.
| Table IVClinical, pathological and
immunohistochemical parameters. |
Table IV
Clinical, pathological and
immunohistochemical parameters.
| Variable | Relapse-free
survival | Overall
survival |
|---|
|
|
|
|---|
| Hazard ratio | 95% CI | P-value | Hazard ratio | 95% CI | P-value |
|---|
| Age ≤50 vs. >50
years | 1.09 | 0.57–2.08 | 0.79 | 1.09 | 0.48–2.49 | 0.840 |
| Pre-/peri-menopause
vs. post-menopause | 1.27 | 0.64–2.50 | 0.50 | 1.18 | 0.49–2.85 | 0.710 |
| Tumor size >20
vs. <20 mm | 2.94 |
1.41–6.10 | 0.01 | 7.37 |
2.18–24.93 | 0.001 |
| Positive lymph
nodes >3 vs. 0–3 | 1.96 | 0.93–4.17 | 0.08 | 1.75 | 0.65–4.72 | 0.270 |
| Positive ER status
vs. negative | 0.40 |
0.21–0.78 | 0.01 | 0.29 |
0.13–0.68 | 0.010 |
| Positive PgR status
vs. negative | 0.42 |
0.22–0.80 | 0.01 | 0.36 |
0.16–0.81 | 0.010 |
| Positive Her2/neu
status vs. negative | 3.11 |
1.36–7.10 | 0.01 | 4.25 |
1.67–10.80 | 0.010 |
| High- vs. low- and
intermediate-grade | 1.77 | 0.87–3.57 | 0.11 | 2.45 | 0.97–6.20 | 0.060 |
| Ki67 (quartiles) Q4
vs. Q1-3 | 0.91 | 0.60–1.19 | 0.47 | 0.86 | 0.61–1.22 | 0.400 |
| E-cadherin Q4 vs.
Q1-3 | 1.06 | 0.79–1.43 | 0.70 | 0.79 | 0.54–1.43 | 0.220 |
| Cathepsin D Q4 vs.
Q1-3 | 1.08 | 0.81–1.43 | 0.60 | 1.06 | 0.73–1.51 | 0.790 |
Analysis for BCSS
Univariate Cox proportional hazard regression
analyses for BCSS were similarly performed according to the same
variables. Among those models, the following parameters were
statistically significant on the Cox regression analysis (Table IV): i) tumor size (HR=7.37;
P=0.001, 95% CI, 2.18–24.93); ii) positive ER (HR=0.29; P=0.01, 95%
CI, 0.13–0.68); iii) positive PgR (HR=0.36; P=0.01, 95% CI,
0.16–0.81); iv) Her2 +3 (HR=4.25; P=0.01, 95% CI, 1.67–10.8). Tumor
grade showed a trend for statistical significance (HR=2.45; P=0.06,
95% CI, 0.97–6.2). In the multivariate Cox proportional hazard
regression analyses, the only variables that were statistically
significant included tumor size (HR=5.39; P=0.01, 95% CI,
1.56–18.64) and ER status (HR=0.33; P=0.02, 95% CI, 0.13–0.81). The
Kaplan-Meier BCSS curve for all breast cancer patients is shown in
Fig. 2.
ROC statistics
Results of the ROC analysis for RFS of the following
models: i) combined clinicopathological data; ii) scores for
E-cadherin, cathepsin D and Ki67; and iii) scores for E-cadherin
and cathepsin D only are shown in Table
V. Analysis for a combined clinicopathological model, including
parameters such as tumor size, lymph node status, histological
grade, ER and PgR scores and Her2 status, resulted in an AUC of
0.51 (95% CI, 0.39–0.64); a model using the scores of three
immunohistochemical parameters resulted in an AUC of 0.73 (95% CI,
0.63–0.84), and a model using the scores of cathepsin D and
E-cadherin only resulted in an AUC value of 0.75 (95% CI,
0.65–0.85). Results of the ROC analysis for BCSS related to similar
models are shown in Table V. The
AUC of a combined clinicopathological model was 0.75 (95% CI,
0.64–0.86). The AUC of the three biomarker models was 0.79 (95% CI,
0.68–0.90), and the AUC of a model of E-cadherin and cathepsin D
was only 0.82 (95% CI, 0.72–0.92).
| Table VROC analysis and corresponding area
under the curve (AUC) statistics for prediction models of breast
cancer-related events and breast cancer-specific death in patients
with early breast cancer. |
Table V
ROC analysis and corresponding area
under the curve (AUC) statistics for prediction models of breast
cancer-related events and breast cancer-specific death in patients
with early breast cancer.
| Prediction
model | BC-related
events | BC-specific
death |
|---|
|
|
|
|---|
| 95% CI | C-statistics
(AUC) | 95% CI | C-statistics
(AUC) |
|---|
| Clinicopathological
(combined) | 0.51 | 0.39–0.64 | 0.75 | 0.64–0.86 |
| Three markers
(Ki67, cathepsin D and E-cadherin) | 0.73 | 0.63–0.84 | 0.79 | 0.68–0.90 |
| Two markers
(cathepsin D and E-cadherin) | 0.75 | 0.65–0.85 | 0.82 | 0.72–0.92 |
Discussion
In this single-institutional study, we showed that a
model incorporating two immunohistochemical biomarkers, E-cadherin
and cathepsin D, in tumors of patients with EBC was comparable to a
model based on standard clinicopathological parameters in
predicting BCSS. We used a simple scoring method that provided a
quantitative measure for the degree of staining intensity of each
biomarker. The combination of E-cadherin and cathepsin D proved
valuable despite the fact that none of the individual biomarkers
was capable of predicting prognosis. Overexpression of cathepsin D
and low expression of E-cadherin may therefore be used to detect
distinct sets of EBC in patients with a more aggressive form of the
disease.
Each of the three biomarkers has been extensively
studied in the past for its contribution to tumor aggressiveness.
In clinical practice, however, there remains some controversy
regarding the manner in which biomarkers support treatment
decisions. A critical impediment to their wider use is the lack of
standardization for the interpretation of staining results.
Overexpression of cathepsin D in breast tumors was associated with
increased metastatic potential and poor survival (14). Although it has been held that
cathepsin D is involved in a non-specific protein degradation in a
markedly acidic environment of lysosomes, an increasing number of
studies have shown that cathepsin D interacts with other
significant molecules and affects cell signaling. Procathepsin D,
the proform of lysosomal aspartic peptidase cathepsin D secreted
from cancer cells, acts as a mitogen on cancer and stromal cells
and stimulates their pro-invasive and pro-metastatic properties
(15). In a model of neuroblastoma,
extracellular exogenous cathepsin D induced Akt-1 phosphorylation
and doxorubicin resistance in sensitive cells (16). Unlike infiltrating lobular
carcinomas, which consistently exhibit a loss of E-cadherin
expression regardless of clinical staging or outcome, over 80% of
infiltrating ductal carcinomas continue to express E-cadherin,
albeit at a progressively reduced level with an increasing stage or
histological grade (17).
E-cadherin is a transmembrane glycoprotein that mediates
calcium-dependent intercellular adhesion and tissue architecture
among epithelial cell layers (18,19).
However, a reduced expression of E-cadherin may also underscore the
‘stem-cell behavior’ of breast cancer cells, since E-cadherin is
regulated by Slug, Snail and Twist, which belong to the canonical
Wnt/β-catenin signaling system (20,21).
Notably, the addition of Ki67 to the model of cathepsin D and
E-cadherin in our study did not improve prediction over and above
the two-biomarker model. Multiple studies have previously shown
that the immunohistochemical expression of nuclear Ki67 may be
prognostic and predictive in patients with EBC (22), and the majority of gene
expression-based predictors, including Oncotype DX, make use
of proliferation phenotypes (23).
Our findings indicate that decision-making in
patients with EBC is feasible. Our group has recently published its
experience with the use of Oncotype DX in patients with EBC
and ER-positive, node-negative tumors (24). Recommendations for chemotherapy were
changed after obtaining assay results in 25% of patients, where the
majority of changes (71%) were from chemotherapy to no
chemotherapy. Most importantly, Oncotype DX correlated
poorly with Adjuvant! Online predictions. Nevertheless, we
experienced uncertainty in regard to the correct treatment for
patients with intermediate risk and recurrence scores. In such
cases, treatment decisions are based on numerous parameters,
including histological grade, clinical judgment and patients’
willingness to receive chemotherapy. Although histological grade is
almost universally accepted by clinicians, included in consensus
guidelines and used in treatment decision-making (25), it is considered by certain
investigators to have poor reproducibility, particularly for
nuclear pleomorphism and mitotic count. Clinical judgment remains
highly subjective, and patients’ willingness to receive
chemotherapy may not be based on solid data. Moreover, treatment
decisions in many cases are required while molecular studies are
unavailable. IHC has shown good reproducibility when performed by
skilled specialists and in experienced high-volume laboratories.
Beyond its simplicity and relative cost efficacy, IHC may prove
prudent in the setting of limited tissue availability through the
use of needle or core biopsies (26). The present study included a
heterogeneous population of patients with EBC who received various
treatments, and none of the patients received certain treatment
options that now are considered standard, such as trastuzumab or
taxanes. Another limitation of the present study is the lack of
validation of the proposed prognostic model.
In conclusion, our results show that a prognostic
model based on the scores of cathepsin D and E-cadherin staining
intensity on paraffin sections of breast tumors may be beneficial
in treatment decisions for patients with EBC, and in particular
cases complement traditional and molecular prognosticators.
Abbreviations:
|
AUC
|
area under the curve
|
|
BCREs
|
breast cancer-related events
|
|
BCSS
|
breast cancer-specific survival
|
|
CI
|
confidence interval
|
|
ER
|
estrogen receptor
|
|
FISH
|
fluorescence in situ
hybridization
|
|
HR
|
hazard ratio
|
|
IHC
|
immunohistochemistry
|
|
PgR
|
progesterone receptor
|
|
Q
|
quartile
|
|
ROC
|
receiver operating characteristic
|
|
RFS
|
relapse-free survival
|
|
SUMC
|
Soroka University Medical Center
|
References
|
1
|
Jemal A, Siegel R, Xu J, et al: Cancer
statistics, 2010. CA Cancer J Clin. 60:277–300. 2010. View Article : Google Scholar
|
|
2
|
Burstein HJ, Harris JR and Morrow M:
Malignant tumors of the breast. Cancer: Principles and Practice of
Oncology. DeVita VT, Hellman S and Rosenberg SA: 8th edition.
Lippincot Williams & Wilkins; Philadelphia: pp. 1606–1654.
2008
|
|
3
|
Van Belle V, van Calster B, Brouckaert O,
et al: Qualitative assessment of the progesterone receptor and Her2
improves the Nottingham Prognostic Index up to 5 years after breast
cancer diagnosis. J Clin Oncol. 28:4129–4134. 2010.PubMed/NCBI
|
|
4
|
Goldhirsch A, Ingle JN, Gelber RD, et al:
Panel members. Thresholds for therapies: highlights of the St
Gallen International Expert Consensus on the primary therapy of
early breast cancer 2009. Ann Oncol. 20:1319–1329. 2009. View Article : Google Scholar : PubMed/NCBI
|
|
5
|
National Institutes of Health. Consensus
Development Conference Statement adjuvant therapy for breast
cancer, November 1–3, 2000. J Natl Cancer Inst Monogr. 5–15.
2001.
|
|
6
|
Adjuvant! Onlinehttp://www.adjuvantonline.com/index.jsp.
|
|
7
|
Wang Y, Klijn JG, Zhang Y, et al:
Gene-expression profiles to predict distant metastasis of
lymph-node-negative primary breast cancer. Lancet. 365:671–679.
2005. View Article : Google Scholar : PubMed/NCBI
|
|
8
|
Paik S, Shak S, Tang G, et al: A multigene
assay to predict recurrence of tamoxifen-treated, node-negative
breast cancer. N Engl J Med. 351:2817–2826. 2004. View Article : Google Scholar : PubMed/NCBI
|
|
9
|
Singletary SE, Allred C, Ashley P, et al:
Revision of the American Joint Committee on Cancer staging system
for breast cancer. J Clin Oncol. 20:3628–3636. 2002. View Article : Google Scholar : PubMed/NCBI
|
|
10
|
Elston CW and Ellis IO: Pathological
prognostic factors in breast cancer. I The value of histological
grade in breast cancer: experience from a large study with
long-term follow-up. Histopathology. 19:403–410. 1997. View Article : Google Scholar
|
|
11
|
Pauletti G, Dandekar S, Rong H, et al:
Assessment of methods for tissue-based detection of the HER-2/neu
alteration in human breast cancer: a direct comparison of
fluorescence in situ hybridization and immunohistochemistry. J Clin
Oncol. 18:3651–3664. 2000.PubMed/NCBI
|
|
12
|
Detere S, Saccani G, Jotti L, et al: A
‘quickscore’ method for immunohistochemical semiquantitation:
validation for oestrogen receptor in breast carcinomas. J Clin
Pathol. 48:876–879. 1995.
|
|
13
|
McShane LM, Altman DG, Sauerbrei W, et al:
Reporting recommendations for tumor MARKer prognostic studies
(REMARK). Nat Clin Pract Oncol. 2:416–422. 2005. View Article : Google Scholar
|
|
14
|
Foekens JA, Look MP, Bolt-de Vries J, et
al: Cathepsin-D in primary breast cancer: prognostic evaluation
involving 2810 patients. Br J Cancer. 79:300–307. 1999. View Article : Google Scholar : PubMed/NCBI
|
|
15
|
Ohri SS, Vashishta A, Proctor M, et al:
The propeptide of cathepsin D increases proliferation, invasion and
metastasis of breast cancer cells. Int J Oncol. 32:491–498.
2008.PubMed/NCBI
|
|
16
|
Sagulenko V, Muth D, Sagulenko E, et al:
Cathepsin D protects human neuroblastoma cells from
doxorubicin-induced cell death. Carcinogenesis. 29:1869–1877. 2008.
View Article : Google Scholar : PubMed/NCBI
|
|
17
|
Prasad CP, Rath G, Mathur S, et al:
Expression analysis of E-cadherin, Slug and GSK3beta in invasive
ductal carcinoma of breast. BMC Cancer. 9:3252009. View Article : Google Scholar : PubMed/NCBI
|
|
18
|
Frixen UH, Behrens J, Sachs M, et al:
E-cadherin-mediated cell-cell adhesion prevents invasiveness of
human carcinoma cells. J Cell Biol. 113:173–185. 1991. View Article : Google Scholar : PubMed/NCBI
|
|
19
|
Goodwin M and Yap AS: Classical cadherin
adhesion molecules: coordinating cell adhesion, signaling and the
cytoskeleton. J Mol Histol. 35:839–844. 2004. View Article : Google Scholar : PubMed/NCBI
|
|
20
|
Nelson WJ and Nusse R: Convergence of Wnt,
β-catenin, and cadherin pathways. Science. 303:1483–1487. 2004.
|
|
21
|
Roarty K and Rosen JM: Wnt and mammary
stem cells: hormones cannot fly wingless. Curr Opin Pharmacol.
10:643–649. 2010. View Article : Google Scholar : PubMed/NCBI
|
|
22
|
Van Diest PJ, van der Wall E and Baak JP:
Prognostic value of proliferation in invasive breast cancer: a
review. J Clin Pathol. 57:675–681. 2004.PubMed/NCBI
|
|
23
|
Albain KS, Paik S and van’t Veer L:
Prediction of adjuvant chemotherapy benefit in endocrine
responsive, early breast cancer using multigene assays. Breast.
18(Suppl 3): 141–145. 2009. View Article : Google Scholar : PubMed/NCBI
|
|
24
|
Geffen DB, Abu-Ghanem S, Sion-Vardy N, et
al: The impact of the 21-gene recurrence score assay on decision
making about adjuvant chemotherapy in early-stage
estrogen-receptor-positive breast cancer in an oncology practice
with a unified treatment policy. Ann Oncol. March;2011.(E-pub ahead
of print).
|
|
25
|
Soerjomataram I, Louwman MW, Ribot JG, et
al: An overview of prognostic factors for long-term survivors of
breast cancer. Breast Cancer Res Treat. 107:309–330. 2008.
View Article : Google Scholar : PubMed/NCBI
|
|
26
|
Payne SJ, Bowen RL, Jones JL, et al:
Predictive markers in breast cancer – the present. Histopathology.
52:82–90. 2008.
|