Introduction
Cyclins and cyclin-dependent kinases (CDK) are the
regulatory proteins of the cell cycle. Uncontrolled growth and
proliferation of cancer cells are the result of their over
activity. R-roscovitine (ROSC) (also known as CYC202 and
Seliciclib) is a second-generation CDK inhibitor reducing tumor
growth and proliferation, inducing cell death by competing for ATP
binding sites on these CDKs. ROSC has inhibitory effects on cyclin
E/CDK2, cyclin H/CDK7 and cyclin T/CDK9. In addition to their cell
cycle regulatory function, CDK7 and CDK9 play significant roles in
the regulation of RNA polymerase II-mediated transcription
(1,2). ROSC induces growth arrest and
apoptosis through activation of the p53 gene, inhibition of
ribosome biogenesis at an early rRNA processing level and blockage
of the RNA polymerase II-dependent transcription, inhibition of
mitogen-activated kinases (MAPKs) and pyridoxal kinase, reduction
of anti-apoptotic proteins, such as survivin, p-glycoprotein
(p-gp), nuclear factor κ-light-chain-enhancer of activated B cells
(NF-κB), vascular endothelial growth factor (VEGF) and inhibition
of potassium channels named Human ether-a-go-go-related gene (HERG)
(3–10). Besides ongoing in vitro and
in vivo experiments regarding its anti-neoplastic effects,
ROSC has entered phase II clinical trials as a treatment for
various tumors such as non-small cell lung cancer and advanced
solid tumors (1).
Tyrosine kinase receptors (TKRs) play significant
roles in tumor progression and therapy resistance. Activation of
these tyrosine kinases (TKs) causes a cascade reaction, ultimately
leading to DNA synthesis and cell division (10). Small molecule inhibitors were
designed to block the enzymatic function of the TKs. A prototype
tyrosine kinase inhibitor (TKI), imatinib mesylate (IM), known as
Gleevec, was the first to be introduced into clinical oncology for
leukemia, and was followed by other TKI drugs such as gefitinib,
erlotinib, sorafenib, sunitinib and dasatinib. TKIs share the same
mechanism of action as the competitive ATP inhibition at the
catalytic binding site of TK; however, their TK targets are
different (11,12). IM inhibits Abelson cytoplasmic
tyrosine kinase (ABL), c-Kit, the platelet-derived growth factor
receptor (PDGFR) and epidermal growth factor receptor (EGFR)
(12,13). In addition, IM showed its toxicity
by inducing mitochondrial damage (14).
Glioblastoma (GBL) is the most common primary
malignant intraparenchymal brain tumor and accounts for the
majority of diagnoses. Prognosis of GBL remains poor and GBL is
accepted as virtually incurable due to its marked heterogeneity,
which leads to resistance to various radiation and/or chemotherapy
modalities (15). Reports showed
that IM had anti-neoplastic effects on GBL; however, drug efflux
proteins, particularly p-gp, decreased its efficiency primarily,
and mutations at the TKR secondarily (16–18).
In the present study, our aim was to overcome resistance to IM
through its combination with ROSC, due to the inhibitory activities
of the latter on p-gp and downstream signaling of TKR as CDKs. In
addition, we also investigated whether MK, a newly discovered
resistance factor, had an effect on this combination.
Briefly, a heparin-binding growth factor, MK, was
originally reported to be the product of a retinoic acid-responsive
gene during embryogenesis (19). MK
expression is high during embryogenesis; however, MK is
undetectable in healthy adults and only reappears in the body as a
part of disease pathogenesis. High frequency and massive expression
in advanced tumors has been detected (20–22).
High levels of MK expression correlate with the progression of
human astrocytomas: MK mRNA and protein expression levels were
higher in high-grade astrocytomas (anaplastic astrocytomas and
GBLs) than in low-grade astrocytomas (23). Consequently, besides the well-known
survival and resistance factors, the investigation of the effect of
MK on the activity of ROSC and the new combination model with IM
may give information about the reasons for success or failure of
treatment.
Materials and methods
Monolayer and spheroid cell cultures
The T98G GBL cell line was supplied by the American
Type Culture Collection (ATCC; Rockville, USA) and was grown in a
monolayer culture in Dulbecco’s modified eagle’s medium-F12
(DMEM-F12; Biological Industries, Israel) supplemented with 10%
heat-inactivated fetal calf serum, 1 mM sodium pyruvate, 0.1 mM
non-essential aminoacid solution, 50 U/ml penicillin and
streptomycin (Sigma Chemical Co., St. Louis, MO, USA). Cells in
semi-confluent flasks were harvested using 0.05% trypsin and 0.53
mM EDTA solution (Sigma Chemical Co.) and centrifuged following the
addition of DMEM-F12 for trypsin inactivation and then resuspended
in culture medium. Following the trypan blue exclusion assay, GBM
cells were plated in six-well culture plates containing 5 ml
DMEM-F12 medium at a concentration of 5×10⁵ cells/well
with 100% vitality. An in vitro multicellular T98G GBL
spheroid model was established using a liquid overlay technique.
Briefly, semi-confluent monolayer cell cultures were trypsinized
and single cells with 100% vitality were cultured in 3% Noble
agar-coated (Difco, USA) six-well culture plates containing 5 ml
DMEM-F12 medium at a concentration of 1×10⁶
cells/well.
Experimental design
IM and ROSC were applied at a volume of 100 μl to
monolayer cultures of T98G GBL cells in concentrations ranging from
1 to 200 μM, whereas the negative control cells received only
nutrient medium alone. Cultures were incubated for 72 h. Inhibition
concentration 50 (IC50) values were determined as 10 μM
for IM and 200 μM for ROSC. Experiments were performed in monolayer
and 3D cultures of human T98G GBL cells. Groups were determined as
control, IM (10 μM), ROSC (200 μM) and their combination. For each
experimental group n=6. Experiments were repeated three times and
achieved similar results. Cell proliferation (total cell number),
apoptotic cell death analysis by flow cytometric
annexin-V-fluorescein isothiocyanate/propidium iodide (PI)
(annexin-V-FITC/PI) staining, caspase-3, MK and EGFR levels by
enzyme-linked immunosorbent assay (ELISA), protein levels of
PDGFR-α multi-dug resistance protein-1 (MRP-1), p170, human
telomerase reverse transcriptase (TERT) and aquaporin-4 (AQP-4)
(Western blotting), cAMP levels (RIA: Radioimmunoassay),
cyclooxygenase (COX) activity, morphology (SEM: Scanning Electron
Microscopy) in monolayer cultures and cell ultrastructure (TEM:
Transmission Electron Microscopy) in spheroid cultures were
evaluated for 72 h.
Cell proliferation and apoptotic
indices
Cells were harvested every 24 h for 72 h and the
total cell number was determined by using an automated cell counter
(nucleocounter, Denmark). One of the manifestations of apoptosis is
the translocation of phosphatidylserine (PS) from the inner
membrane to the outer side of the plasma membrane. Externalization
of PS was studied by the annexin-V-binding assay. Briefly, cells
were washed twice with phosphate-buffered saline (PBS) and
resuspended by binding buffer containing 0.01 M HEPES, 0.14 mM NaCl
and 2.5 mM CaCl2. A cell suspension (1×10⁵
cells in 100 μl) in binding buffer was incubated with 5 μl of
FITC-labeled annexin V (BD Pharmingen, San Diego, CA, USA) dye, and
PI for 15 min in the dark at room temperature. Following
incubation, the PI fluorescence and annexin V were measured
simultaneously in a BD FACS/Calibur and analyzed with the
instrument’s operating software (CellQuest, BD Pharmingen). Data
acquisition and analysis were undertaken with CellQuest and WinMDI
programs.
Caspase-3 levels
Cell culture supernatants were analyzed for
caspase-3 levels in triplicate, using fluorimetric kits (Sigma
Aldrich, MO, USA). The caspase-3 fluorimetric assay is based on the
hydrolysis of the peptide substrate
acetyl-Asp-Glu-Val-Asp-7-amido-4-methylcoumarin (Ac-DEVD-AMC) by
caspase 3, resulting in the release of the fluorescent
7-amino-4-methylcoumarin (AMC) moiety. Cells (1×10⁴)
seeded in each well of 96-well plates were washed twice in PBS and
incubated in CHAPS lysis buffer at 4°C for 20 min. Cell lysate (5
μl) was transferred into the wells of other 96-well plates, then
incubated with 5 μl of 2 mM Ac-DEVD-pNA peptide substrate and 200
μl of assay buffer (HEPES 20 mM, pH 7.4, CHAPS 0.1%, DTT 5 mM, EDTA
2 mM) at 37°C for 1 h in an incubator. The concentration of AMC
released was quantified by reading in a fluorometer with a 360 nm
excitation filter and a 460 nm emission filter for optimal
sensitivity.
Cell cycle
The effects of drugs on the cell cycle were examined
using a DNA analysis kit (BD Pharmingen) according to the
manufacturer’s instructions. Briefly, T98G cells were induced at a
cell density of 5×10⁵ cells/ml in the presence of each
drug applied separately and in combination for various time
intervals (24 and 72 h). Cells were then harvested, centrifuged,
washed and resuspended in buffer [dimethyl sulfoxide (DMSO) in
sucrose-sodium citrate] for 5 min at room temperature. A mixture of
trypsin in spermine tetrahydrochloride detergent buffer was added
and samples were incubated for 20 min at room temperature.
Following the addition of RNase A and trypsin inhibitor in spermine
buffer, cells were incubated with PI, in darkness for 20 min at
4°C. Flow cytometric analysis was performed immediately using a
Facscan flow cytometer (FACS Diva, Becton-Dickinson, CA, USA) and
fluorescence intensity data were acquired using the instrument’s
operating software (CellQuest, BD Pharmingen). The percentages of
the analyzed cell population in G0/G1-, S- or G2/M-phases were
determined by the Mod Fit cell-cycle analysis program.
MK levels
Cell culture supernatants were analyzed for MK
levels in triplicate, using ELISA kits (PeproTech, NJ, USA). The
lower detection limit of the assay was 150 pg/ml for MK. MK levels
were measured by an ELISA system in which polyclonal anti-human MK
was used as a capture antibody (Peprotech). Detection was by
biotinylated polyclonal anti-human MK antibody (Peprotech) followed
by streptavidin HRP (Sigma) and a TMB enzyme substrate system
(Sigma). The reaction was stopped by 1 M
H2SO4 and readings were made at 450 nm by a
spectrometer (M2, Molecular devices, CA, USA).
cAMP levels
Following centrifugation, the supernatant was
removed and 0.1 N HCl with DMEM-F12 medium (1:1) was added to cells
to stop the reaction at each 24 h interval. Briefly, 25 μl of the
samples were used to measure cAMP levels. cAMP accumulation was
measured in the supernatants according to the method previously
described, with some modifications (20). cAMP was determined by
radio-immunoassay using the acetylation protocol. High-affinity
rabbit anti-cAMP antibodies were generated in our laboratory using
BSA-conjugated cAMP. Succinyl-cAMP tyrosine methylester (ScAMP-TME)
was iodinated by the chloramine-T method. Mono- and diiodo
ScAMP-TME were used as tracer ligands for the radioimmunoassay
(RIA) and then purified by gel-filtration chromatography (Sephadex
G 25 superfine), equilibrated and eluted with 1 M sodium acetate
(pH 5.0).
EGFR levels
Cell culture supernatants were analyzed for EGFR
levels in triplicate, using ELISA kits (SABiosciences, Germany).
EGFR levels were measured by an ELISA system in which anti-human
EGFR was used as capture antibody (SABiosciences) and detection was
by biotinylated polyclonal anti-human EGFR antibody (SABiosciences)
followed by streptavidin HRP (SABiosciences) and a TMB enzyme
substrate system (SABiosciences). The reaction was stopped by 2 M
H2SO4 and readings were made at 450 nm by a
spectrometer (M2, Molecular devices).
Cyclooxygenase activity
COX activity was indirectly measured by utilizing
TMPD as a co-substrate with arachidonic acid. TMPD does not turn
over without the presence of a hydroperoxide substrate. TMPD
oxidation was monitored spectrophotometrically with a 96-well plate
reader at 610 nm every 1 min for 10 min. Enzyme (100 μg/ml) and
inhibitor (100 μg/ml) were mixed for various amounts of time in 100
mM Tris-HCl (pH 8.0), containing 10 μM heme and 3 μM EDTA. This
mixture was added into wells and incubated for 15 min at 25°C. The
reaction was then started by the addition of a mixture of 100 μM
arachidonic acid and 120 μM TMPD.
Protein levels of PDGFR-α, MRP-1, p170,
hTERT and AQP-4
Expression of PDGFR-α, MRP-1, p170, hTERT and AQP-4
proteins were detected by Western blot analysis. Cells
(2×10⁶) were lysed for 15 min at 4°C in RIPA lysis
buffer. Protein content was assessed using a BCA protein assay
(Pierce, Rockford, IL, USA). Samples with equal amounts of protein
were separated on a 7 and 10% sodium dodecyl sulfate polyacrylamide
electrophoresis (SDS-PAGE) gel, transferred to polyvinylidene
fluoride (PVDF) membranes and detected with PDGFR-α, MRP-1, bcl-2,
COX-2 (1/100 dilution, all from Santa Cruz Biotechnology, Santa
Cruz, CA, USA) and β-actin (1/1000 dilution, Pierce) antibodies.
Protein bands were visualized with the enhanced chemiluminescence
(ECL) Advance Western blot detection reagents (GE Healthcare Life
Sciences, NJ, USA) and quantified by the ImageJ image processing
program (National Institutes of Health, Bethesda, MD, USA).
Ultrastructure
Harvested spheroids were fixed with 2.5%
glutaraldehyde in 0.1 M sodium cacodylate buffer and post-fixed in
1% osmium tetroxide in 0.1 M sodium cacodylate buffer for 1 h at
4°C. Cells were incubated in 1% uranyl acetate for 1 h at 4°C,
dehydrated in a graded acetone series and embedded in Epon 812.
Samples were cut using a rotating blade microtome (Leica,
Heerbrugg, Switzerland) and 70-nm sections were mounted on copper
grids. Sections were subsequently stained with 5% uranyl acetate
and counterstained with Reynold’s lead citrate. Sections were
examined with a Jeol-Jem 1011 transmission electron microscope.
Images were captured at a number of magnifications.
Statistical analysis and determination of
synergism
SPPS 17.0 statistical software (SPSS, Inc., Chicago,
IL, USA) was used for the statistical analysis. The results were
statistically analyzed using the Student’s t-test. Data were
presented as the mean ± SEM. P<0.05 was considered to be
statistically significant. Synergy was determined as previously
described (24–26). Briefly, synergism was determined
using the formula: combination index (CI): D1/(DX)1 + D2/(DX)2,
where D1 is the tested concentration of IM used in combination with
ROSC, D2 is the tested concentration of ROSC used in combination
with IM, (DX)1 is the concentration of a singly applied IM and
(DX)2 is the concentration of a singly applied ROSC. A CI value of
1 indicates an additive effect, a CI value <1 indicates a
synergistic effect and a CI value >1 indicates an antagonist
effect.
Results
Cell proliferation
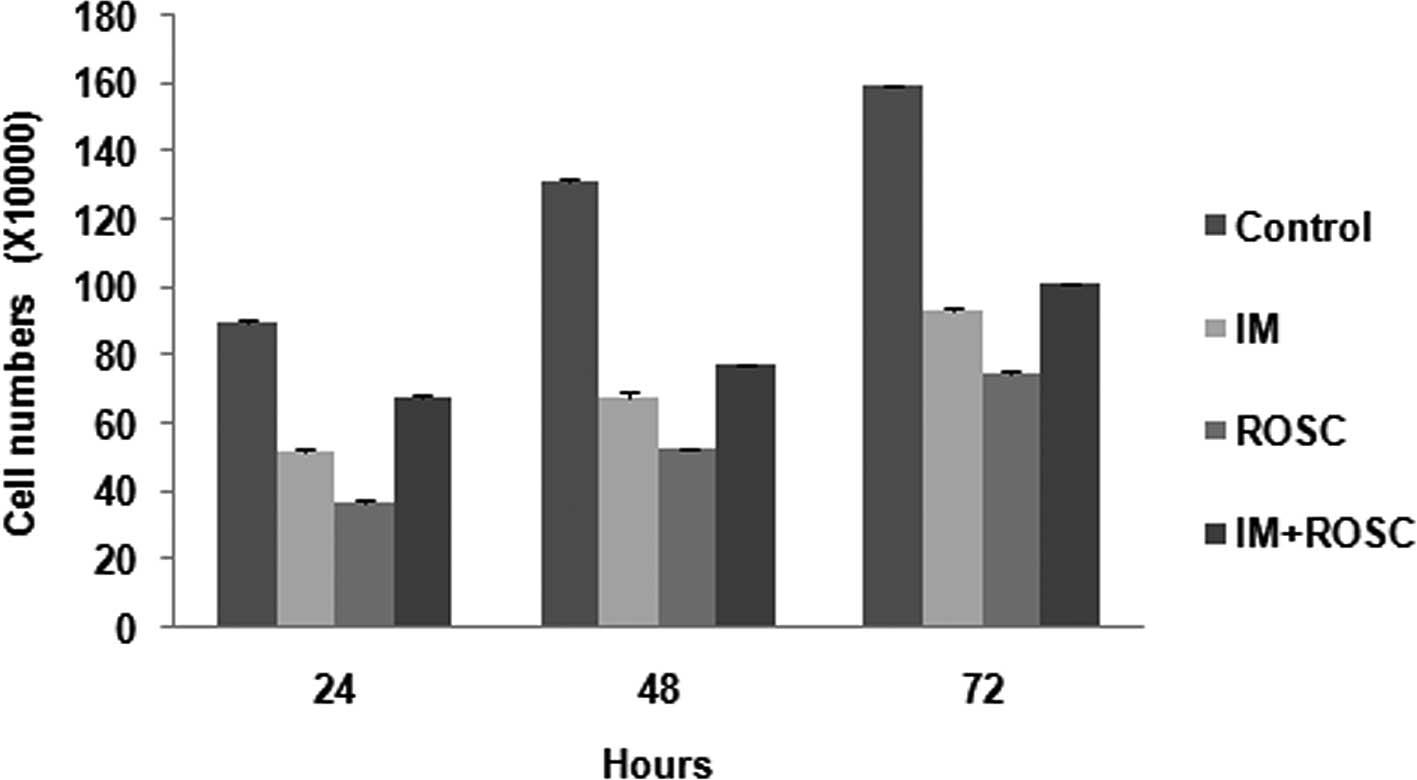
The effects of drug applications are shown in
Fig. 1. The cell number of the
control group showed a proportional increase for 72 h. All drug
treatments inhibit cell proliferation of the T98G GBL cell lines
for 72 h (p<0.05) in a time-dependent manner. The rank from
highest decrease to lowest decrease was determined as the ROSC, IM
and the combination groups, respectively (p<0.05).
Apoptotic index and caspase-3 levels
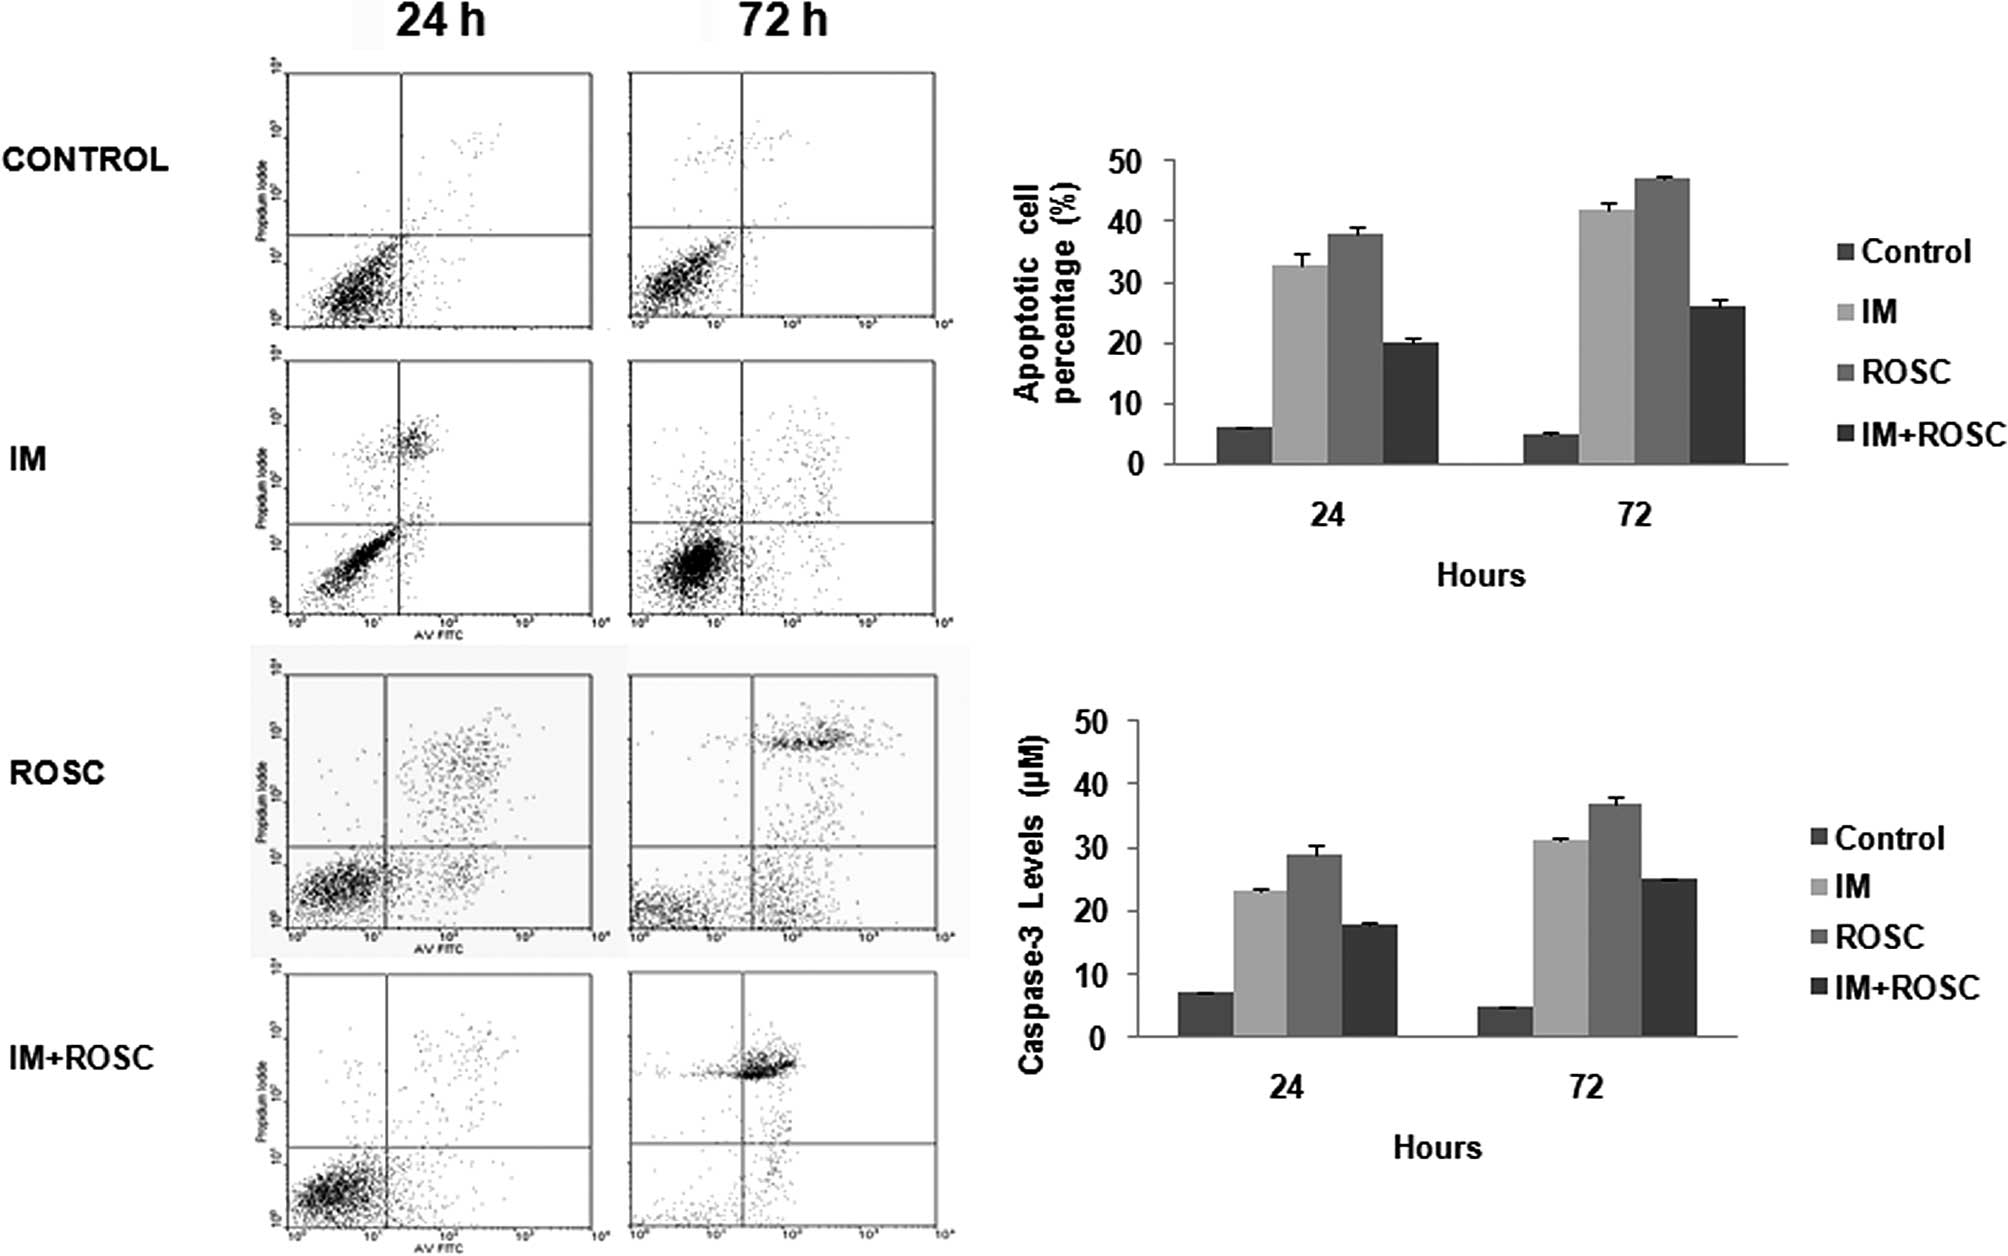
Fig. 2 clearly shows
various levels of apoptosis (Fig.
2A) and caspase-3 activity (Fig.
2B) induced by these drug applications. ROSC, IM and the
combination group increased apoptosis and caspase-3 activity for 72
h (p<0.05). ROSC induced the highest apoptotic index, but the
combination group led to the lowest apoptotic index
(p<0.05).
Cell cycle
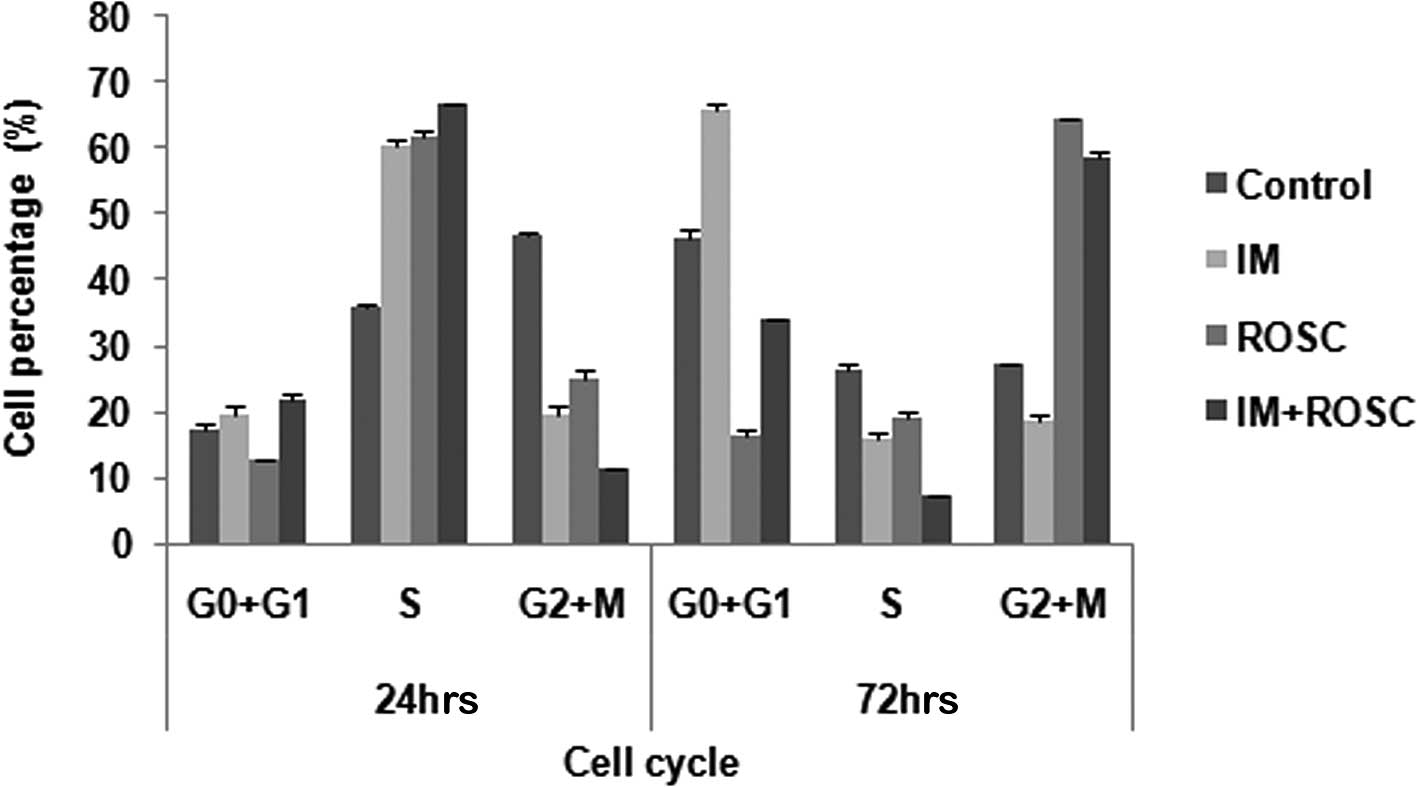
T98G GBL cells induced growth arrest in the S-phase
of the cell cycle within 24 h of drug treatments (p<0.05). ROSC
and the combination group increased the population in the G2/M
phases, but IM induced growth arrest in the G0+G1 at 72 h
(p<0.05) (Fig. 3).
MK levels
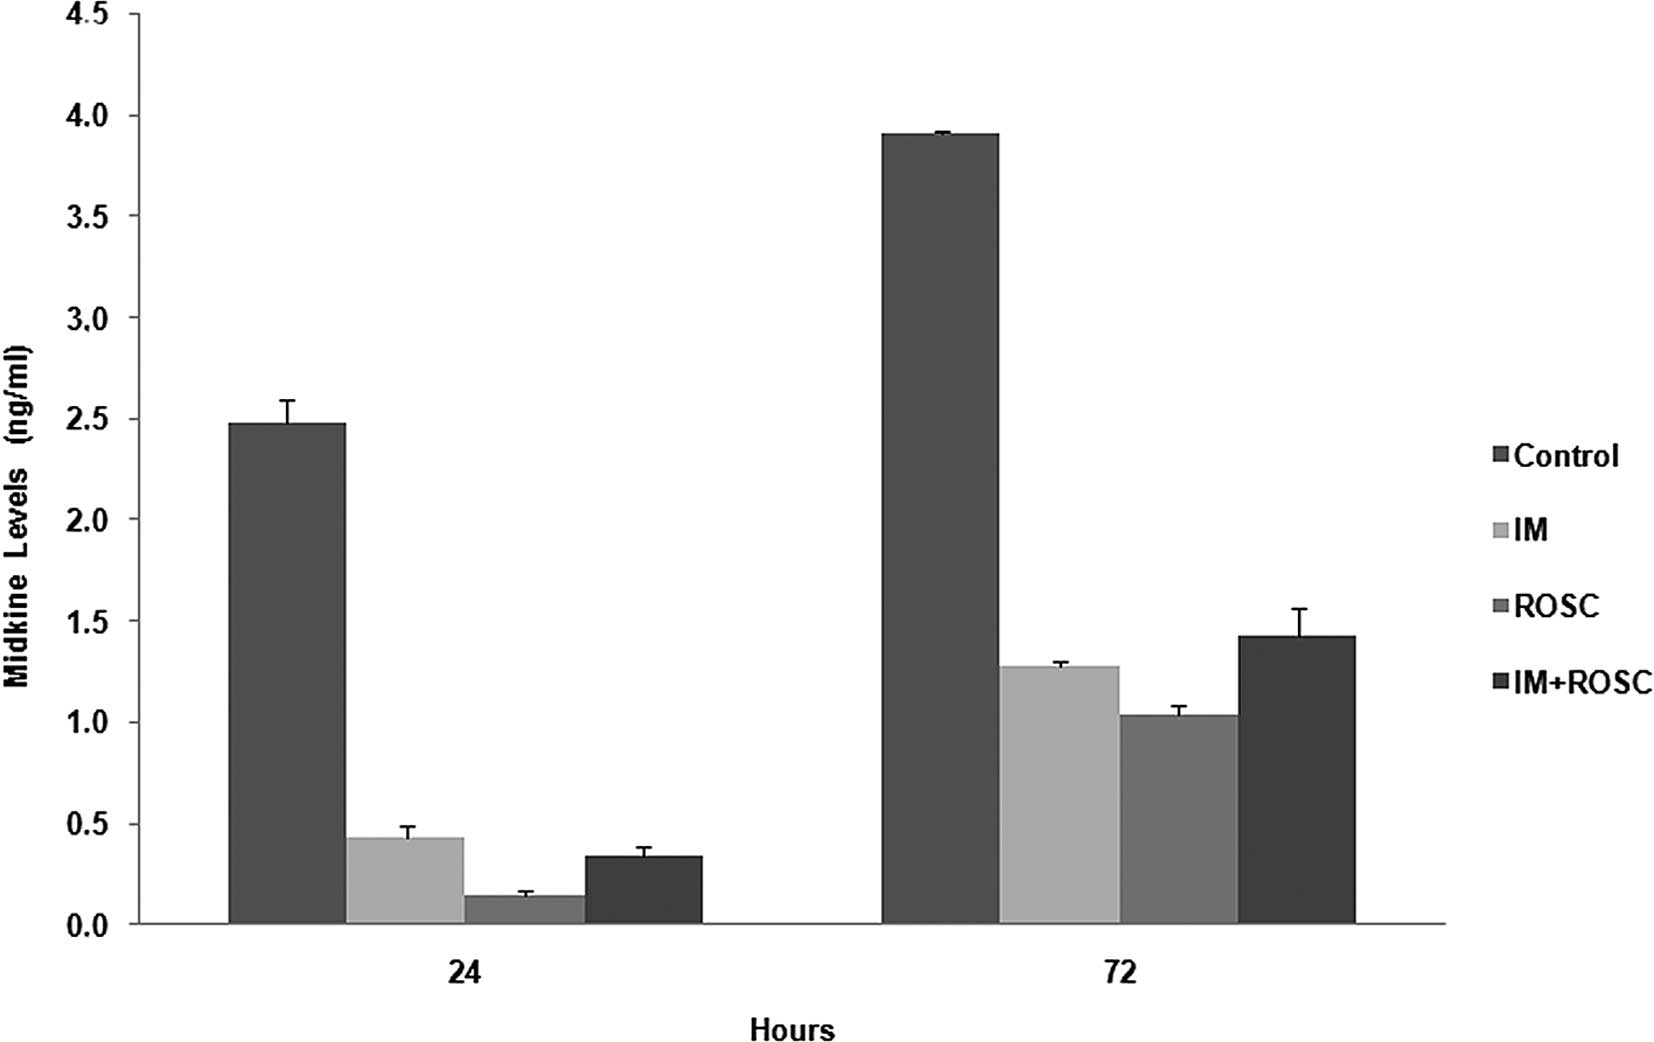
The alterations in MK levels for 72 h are shown in
Fig. 4. All drugs alone and in
combination decreased MK levels for 72 h. The rank from highest
decrease to lowest decrease was determined as the ROSC, IM and
combination groups for 72 h, respectively (p<0.05).
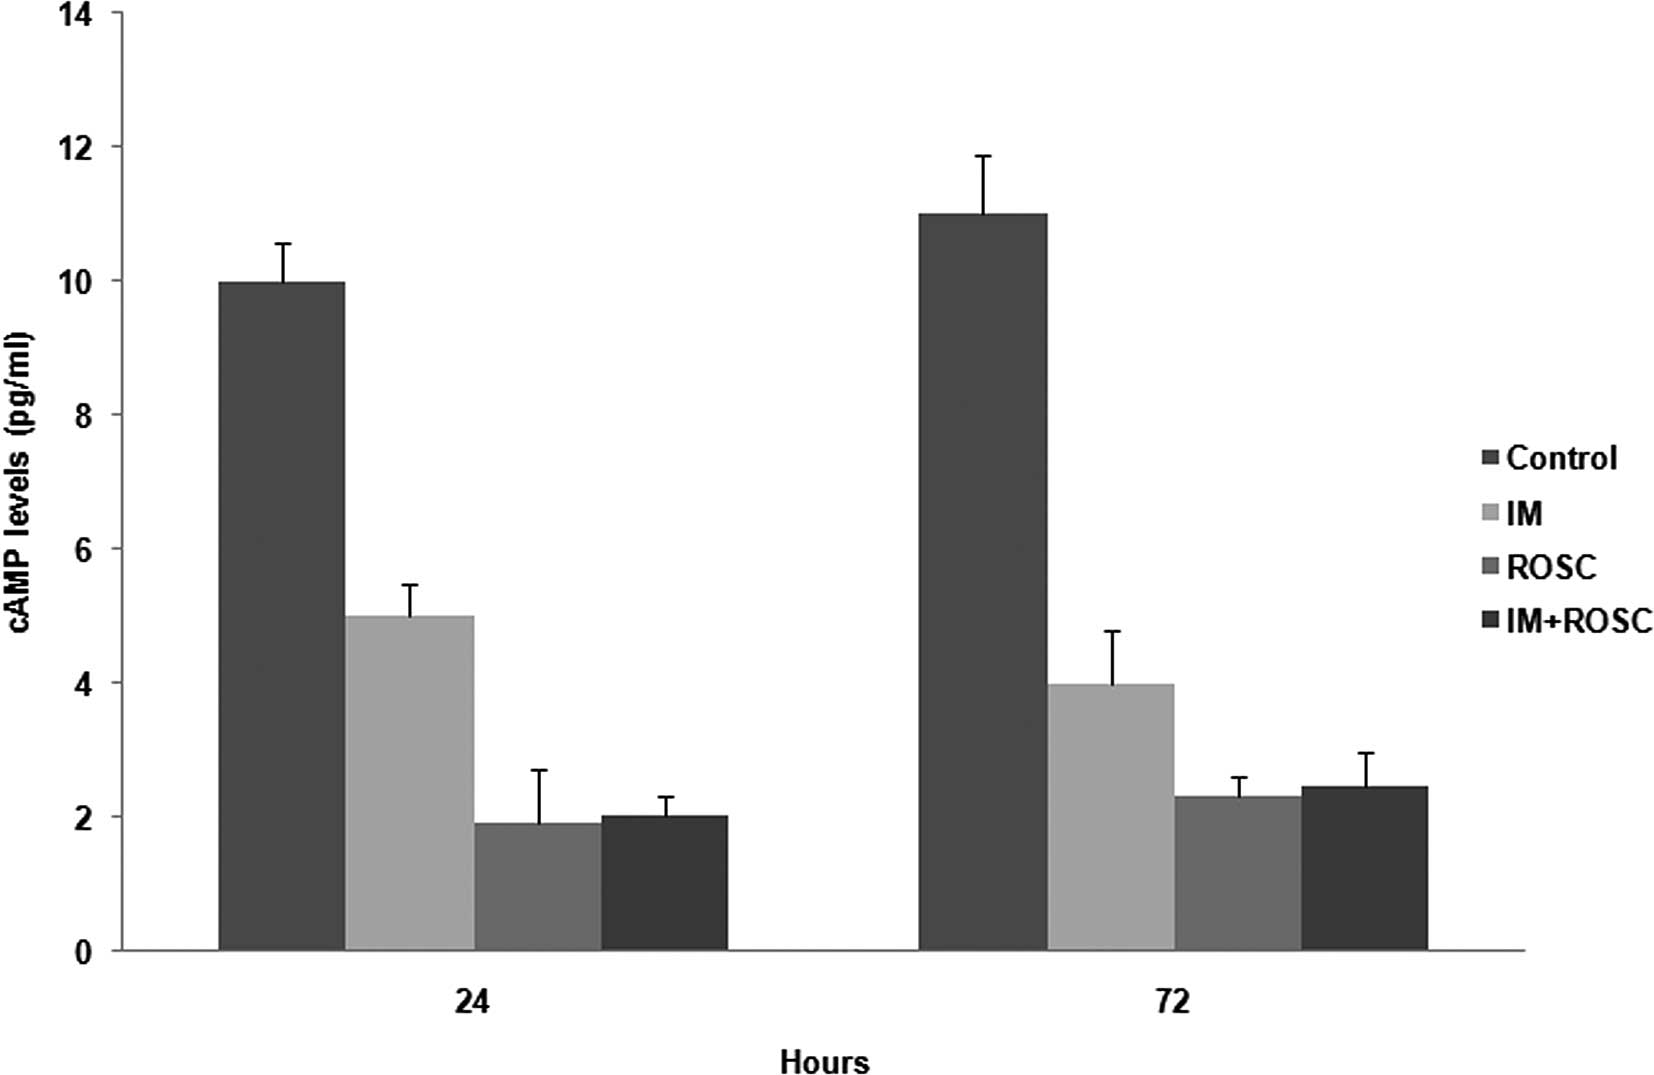
cAMP levels
All drug applications decreased cAMP levels
(p<0.05). ROSC induced the highest decrease in cAMP levels, but
the decrease by the combination group was similar to that by ROSC
(p>0.05). The decrease by IM was much lower than the other
groups (p<0.05) (Fig. 5).
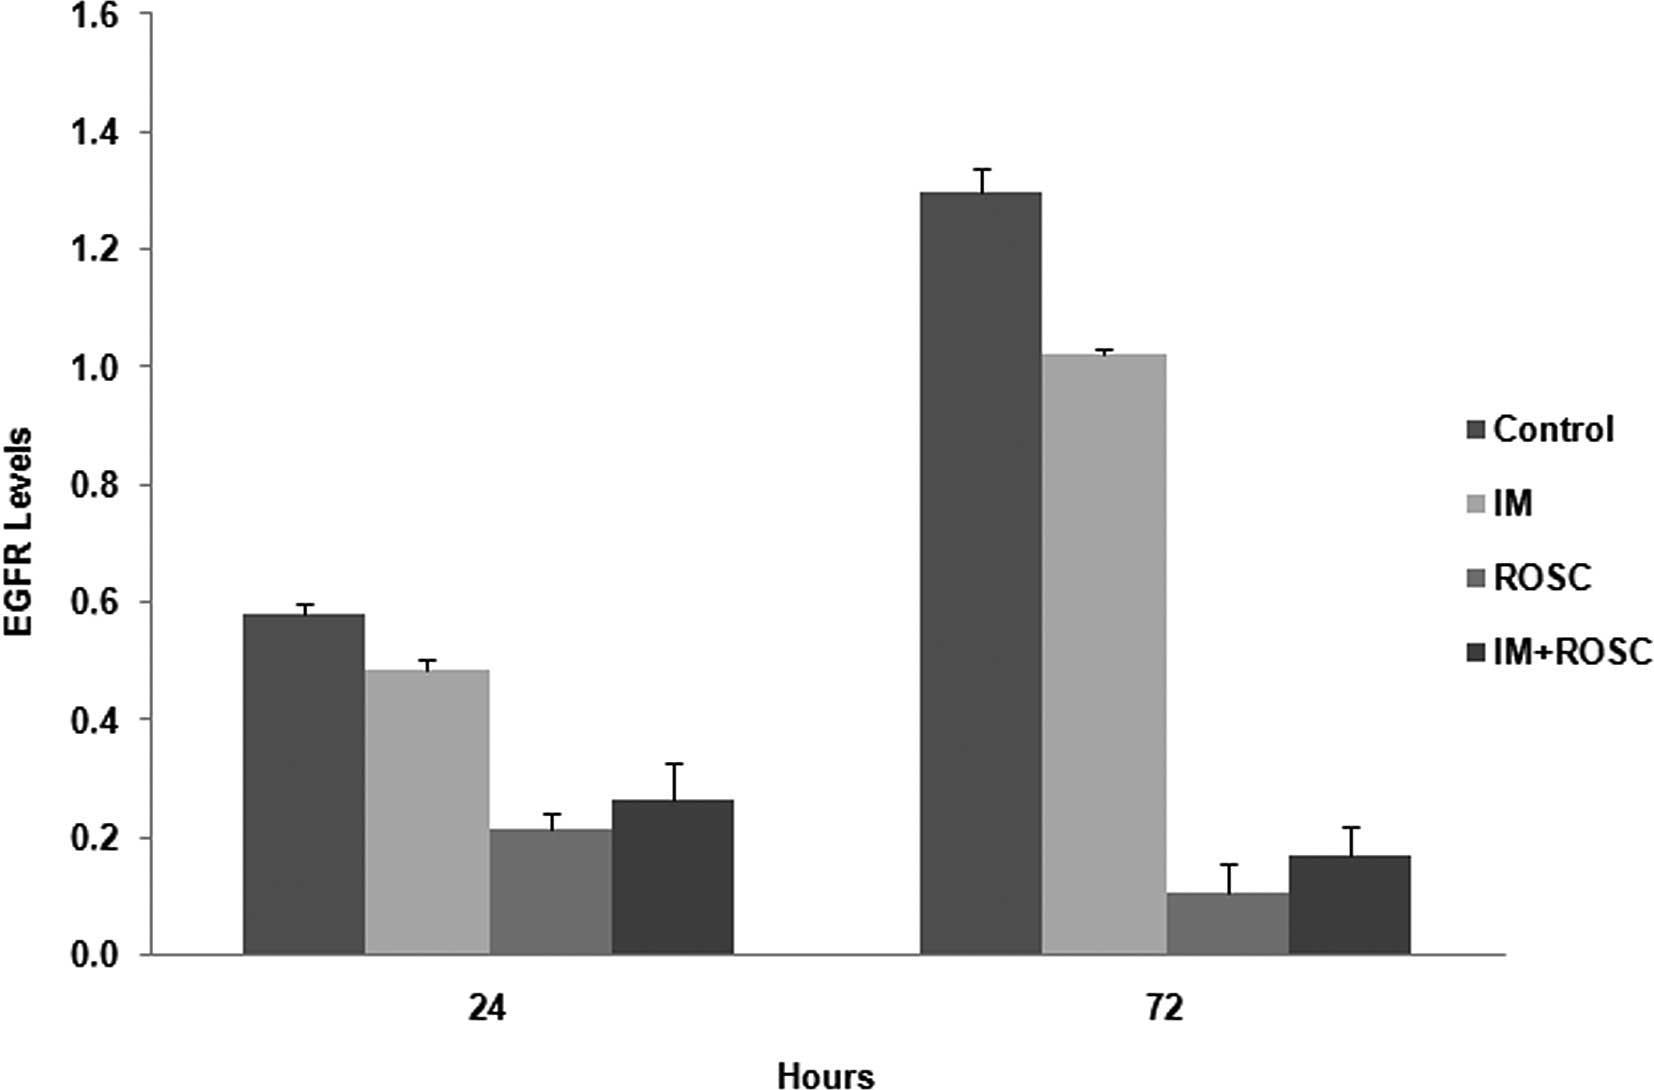
EGFR levels
EGFR levels were increased from 24 to 72 h in the
control group cells (p<0.05) (Fig.
6). All drug applications reduced these levels (p<0.05).
Firstly, ROSC, and secondly, the combination group, reduced EGFR
levels much more potently than the well-known tyrosine kinase
inhibitor IM (p<0.05).
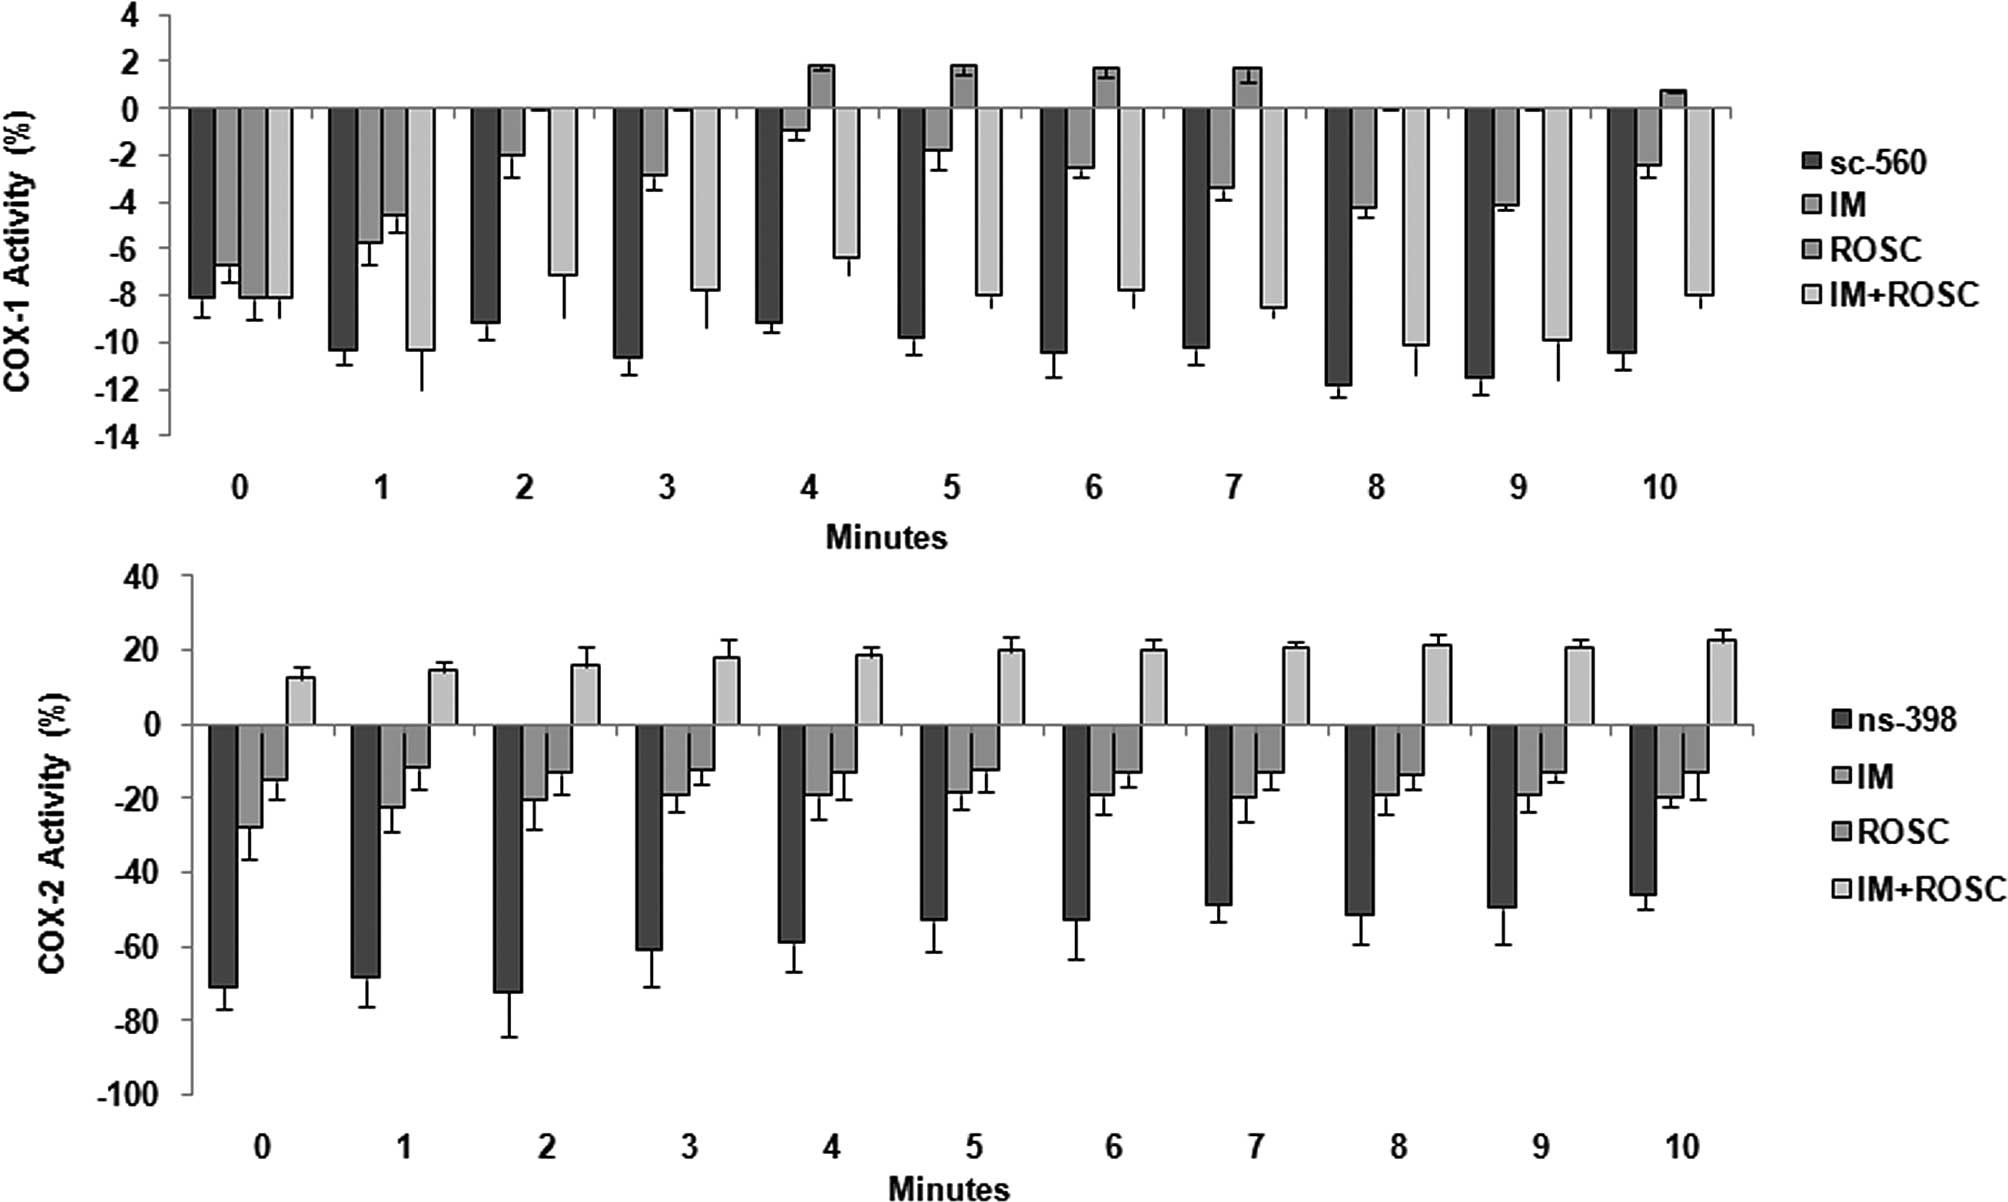
COX activity
Alterations in COX-1 and COX-2 activities are shown
in Fig. 7. The highest decrease in
COX-1 levels was determined in the combination group followed by
the IM group (p<0.05). ROSC increased these levels and these
increases reached the highest levels between 4th and 7th min and at
the 10th min (p<0.05) (Fig. 7A).
IM induced the highest decrease in COX-2 activity, and ROSC also
decreased this enzyme activity; however, the combination group
increased COX-2 activity for 10 min (p<0.05) (Fig. 7B).
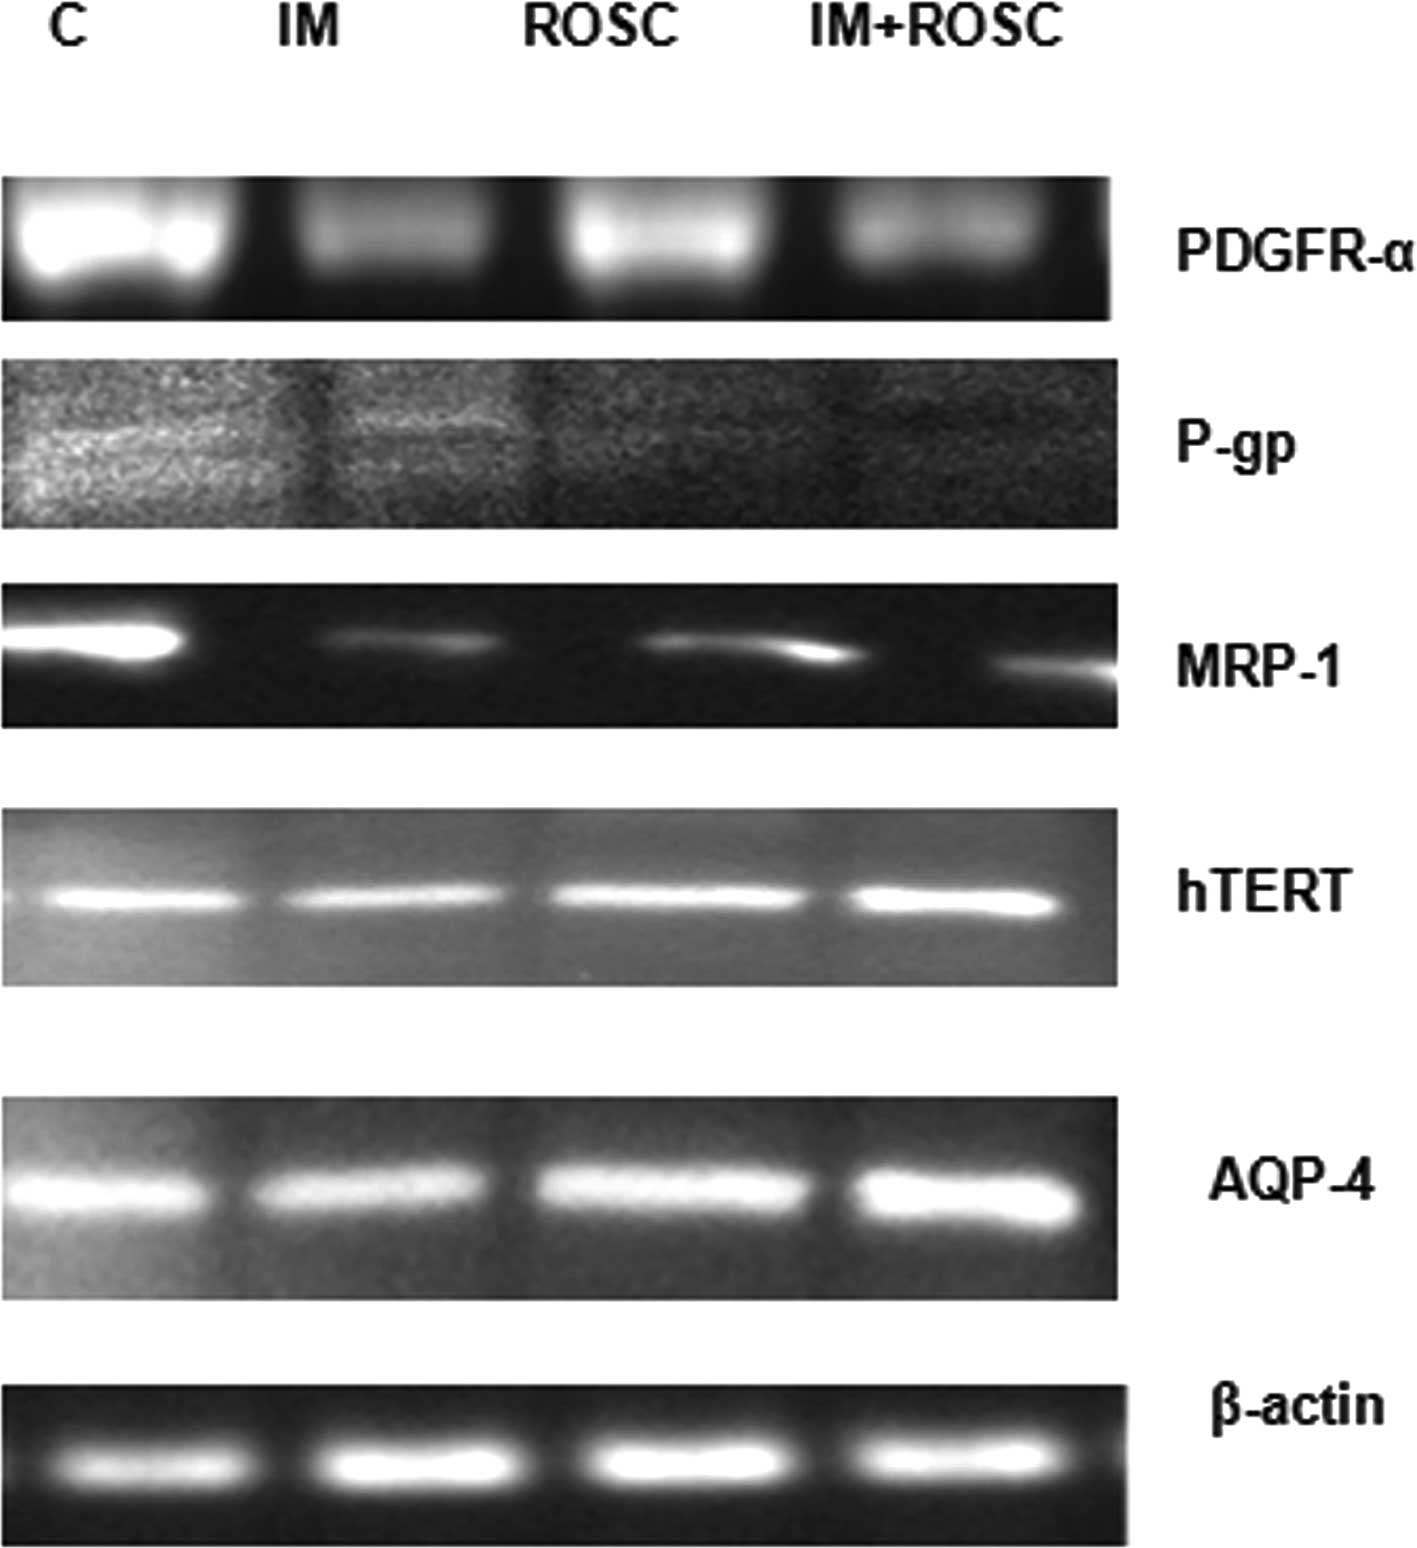
Protein levels
Alterations in PDGFR-α, hTERT, p170, MRP-1 and AQP-4
were evaluated and, results are shown in Fig. 8. IM and the combination group
decreased PDGFR-α levels, but ROSC increased these levels
(p<0.05). The highest decrease in PDGFR-α levels was induced by
IM (p<0.05). IM, ROSC and the combination group increased TERT
levels for 72 h (p<0.05). The increase in TERT levels by IM was
higher than that in ROSC (p<0.05); however, the increase by the
combination group was much higher than that in the ROSC and IM
groups (p<0.05). The combination group induced the highest
decrease in p170 levels (p<0.05), followed by the IM group
(p<0.05). All drug applications decreased MRP-1 levels
(p<0.05), but the highest decrease was determined in the
combination group, followed by the IM group (p<0.05). IM
decreased AQP-4 levels; however, the combination group and the ROSC
group increased AQP-4 levels in T98G GBL cells. This increase was
higher in the combination group.
Ultrastructure
Alterations in ultrastructure by TEM are shown in
Fig. 9. The control group showed
normal morphology characterized by fine-textured nuclear chromatin,
intact nuclear membranes and intact cytoplasmic membranes with
numerous microvilli, which were in contact with other cells. A
number of mitotic cells were observed (Fig. 9A). The IM group showed that
cell-to-cell interactions were lost, and eventually small gaps
existed between cells. This treatment group also exhibited severe
mitochondrial damage, lytic changes such as foamy-vacuolated
cytoplasm, and numerous, presumably autophagic, vacuoles. An
apoptotic appearance was determined in a number of cells (Fig. 9B). Within the ROSC group, an
apoptotic appearance was frequently observed. Spheroids lost their
integrity as a result of loss of cell-to-cell interactions and
lysis of the cells. Numerous cell remnants in the intercellular
area, loss of cell membrane, severe lytic changes, foamy-vacuolated
cytoplasm, lipid droplets and few severe mitochondria damage were
determined. Notably, the most marked changes in the cytoplasm were
the increase in endoplasmic reticulum and ribosomes. A few
autophagic vacuoles were also observed in some cells at the time
the surrounding endoplasmic reticulum was analyzed (Fig. 9C). In the combination group, little
gaps between cells were observed. Vacuoles and vacuole fusions were
observed in the cytoplasm. The number of lipid droplets was much
higher than that in the ROSC group, and no autophagic vacuoles were
determined. Little mitochondrial damage was observed. Notably, as
observed in the ROSC group, endoplasmic reticulum and ribosomes
were also increased in this group, but the increase in the
ribosomes was lower than that in the ROSC group (Fig. 9D). In the ROSC and combination
group, mitochondrial damage was often observed (Fig. 9C and D).
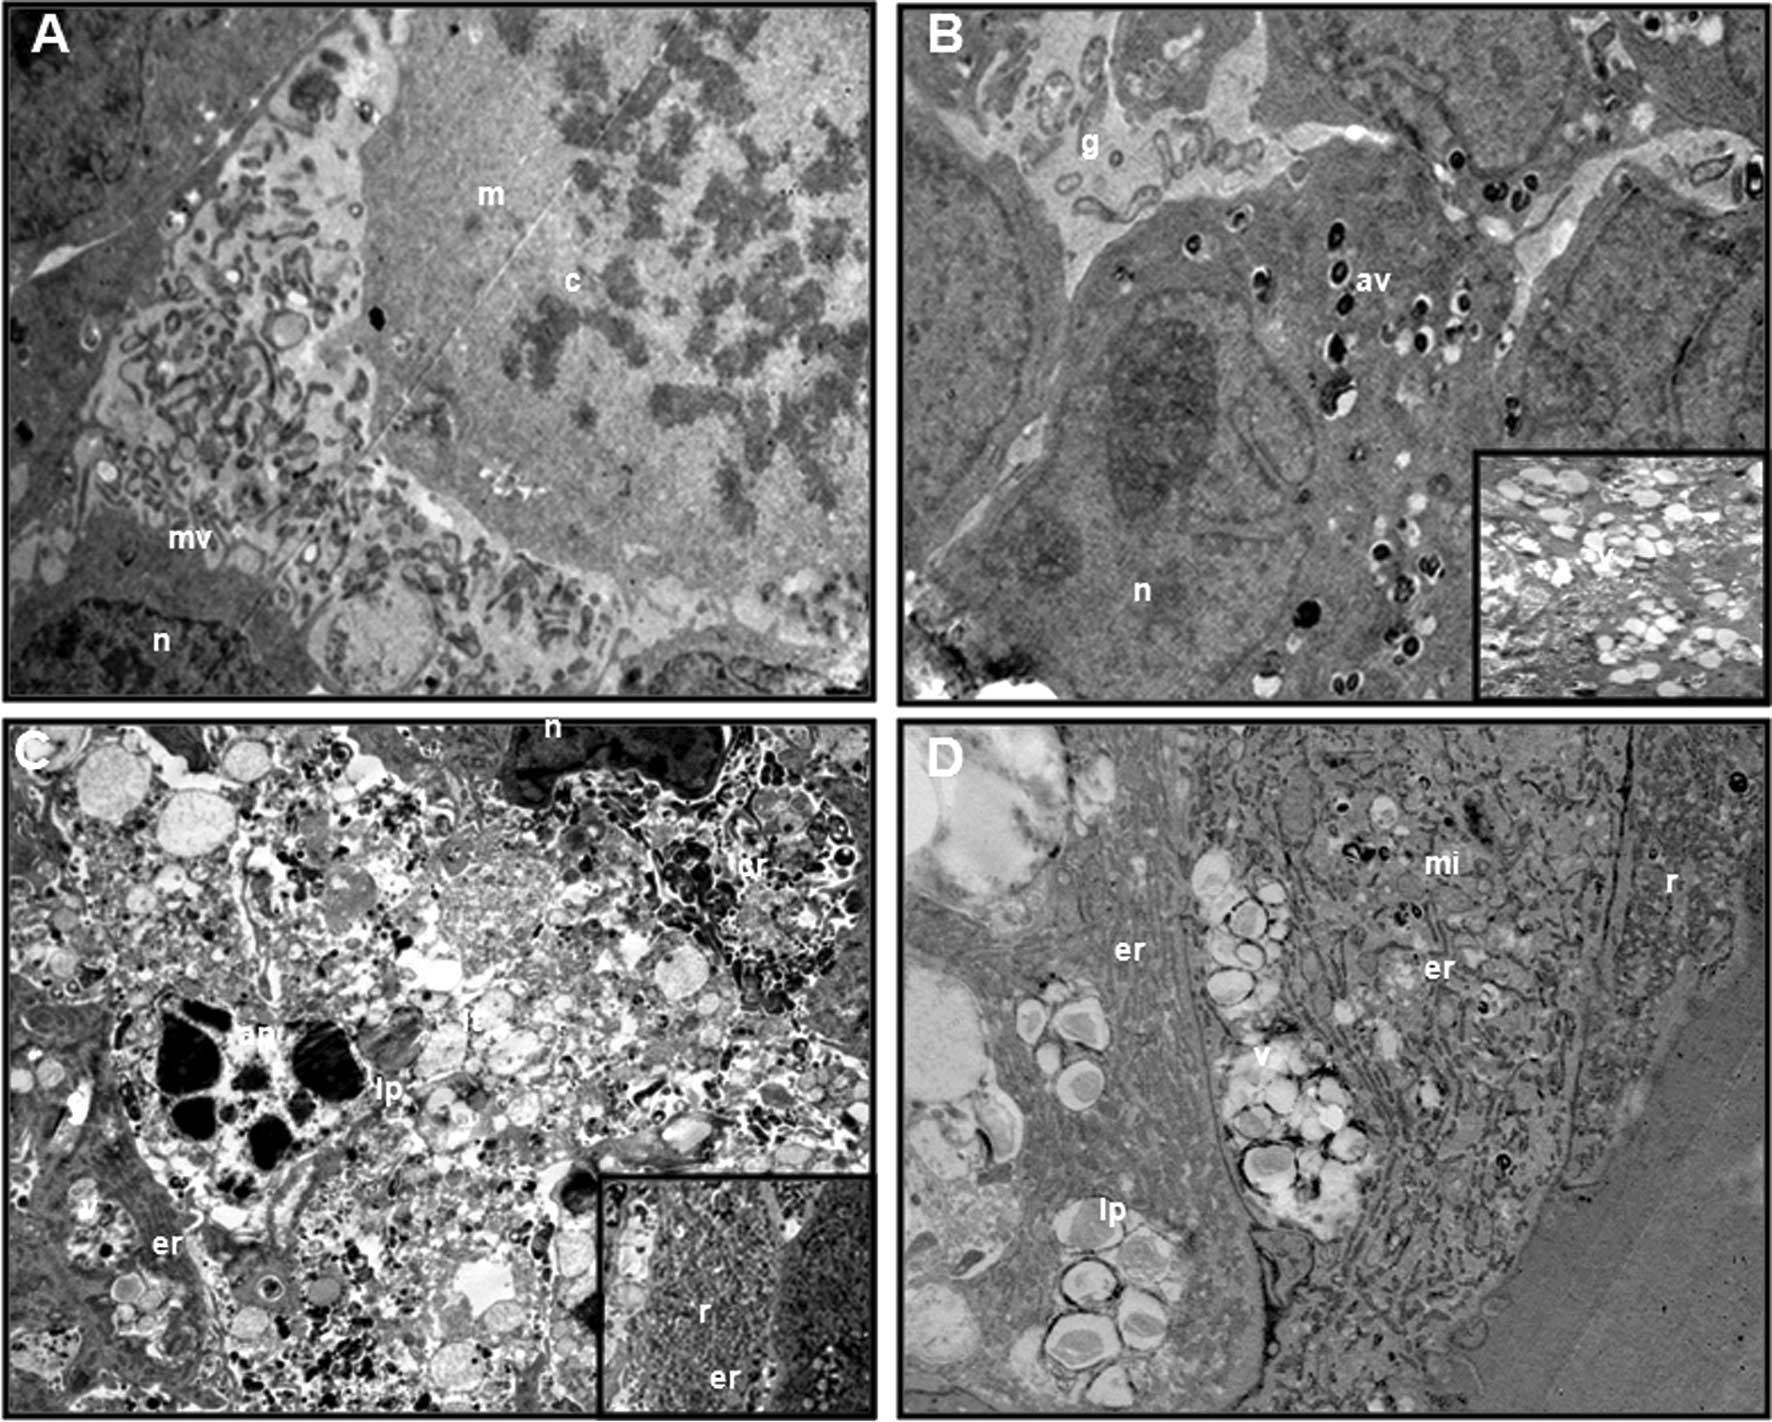 | Figure 9Transmission electron microscopic
views of T98G GBM spheroids at 72 h. (A) The control group
(original magnification, ×10,000). (B) The IM group (original
magnification, ×10,000 and ×7500). (C) The ROSC group (original
magnification, ×7500). (D) The combination group (original
magnification, ×6000). m, mitotic cell; c, chromosome; mv,
microvillus; g, gaps; n, nucleus; av, autophagic vacuole; v,
vacuole; lt, lytic cytoplasm; ap, apoptotic cell; er, endoplasmic
reticulum; lp, lipid vacuole; r, ribosome; cr, cell remnant; mi,
mitochondria. |
Discussion
ROSC success was confirmed in the treatment of a
number of cancer types, including GBL (1,27). In
the present study, the combination of ROSC with IM showed an
antagonist effect in monolayer and 3D cultures of the human T98G
GBL cell line. This antagonism was determined by the highest cell
number and the lowest apoptotic index with caspase-3 levels;
however, the results provided for the anti-apoptotic protein levels
were controversial. The potentiation of TRAIL-induced apoptosis
through the downregulation of two major caspase inhibitors,
survivin and XIAP, was shown by Kim et al in U87 and T98G
GBL cells (5). Kim et al
showed that treatment with ROSC recovered the TRAIL-induced
activation of caspases in an efficient manner in these cells. In
the present study, singly applied ROSC induced the highest increase
in caspase-3 levels, but these levels were lowest in the
combination group. It seemed that IM blocked the caspase-3 recovery
activity of ROSC.
Fleming et al showed that ROSC decreased EGFR
levels, and the combination of a new generation receptor tyrosine
kinase inhibitor named erlotinib, which acts on EGFR, with ROSC
showed a synergistic effect in NSCLC cell lines (28). In agreement with their results, we
determined that ROSC and the combination group decreased EGFR
levels, respectively, but in contrast to the results by Fleming
et al, our combination showed an antagonist effect.
Mohapatra et al showed that ROSC reduced the abundance of
tyrosine-phosphorylated PDGFR-α receptors in the HTLV-1-transformed
T-cell line MT-2 (29). Notably,
ROSC increased PDGFR-α levels; however, the combination group
decreased PDGFR-α levels.
IM was shown as a substrate for drug efflux
proteins, particularly p-gp. This was one of the reasons leading to
the failure of IM in GBL treatment (14-16).
Spiegl-Kreinecker et al found that a considerable expression
of p-gp was relatively rare in glioma cells, in contrast to MRP-1,
which was constitutively overexpressed in cells derived from
astrocytomas, as well as GBLs such as T98G, and SW1088 cells
(30). Komina et al showed
that ROSC is capable of inducing apoptosis in the
doxorubicin-resistant multiple myeloma cells overexpressing p-gp
(6). Consequently, we investigated
alterations in these two protein levels. The combination group
induced the highest decrease, followed by the IM group. ROSC alone
was not as efficient as the others at decreasing these two protein
levels. According to our PubMed research, this is the first report
to show the inhibitory effect of ROSC on MRP-1 levels. Ding et
al reported that AQP-4 is a key molecule involved in
maintaining water and ion homeostasis in the central nervous
system. In addition, these authors mentioned that AQP-4 is
increased in GBL and plays a significant role in GBL cell migration
and invasion, in addition to its well-known function in brain edema
(31). The inhibitory effect of
ROSC on AQP-2 was shown in kidneys (32). In the present study, IM decreased
AQP-4 levels; however, the combination group and ROSC increased
AQP-4 levels in T98G GBL cells. This increase was higher in the
combination group. There is no report about the effect of ROSC on
AQP-4.
Telomeres and telomerase play essential roles in the
regulation of the lifespan of human cells. Normal human somatic
cells do not, or only transiently, express telomerase and therefore
shorten their telomeres with each cell division (33). GBL cancer cells typically express
high levels of telomerase and show uncontrolled cell
proliferation/growth. Thus, a high telomerase expression allows GBL
cells to proliferate, grow and acquire resistance (34). In light of the crucial role of
telomerase activity, we also investigated the effects of drugs on
TERT protein levels, which is a catalytic subunit of telomerase and
required for telomerase activity. Uziel et al reported that
IM downregulates telomerase activity and inhibits cell
proliferation in telomerase-expressing cell lines such as
c-kit-expressing SK-N-MC (Ewing sarcoma), SK-MEL-28 (melanoma),
RPMI-8226 (myeloma), MCF-7 (breast cancer) and HSC 536/N (Fanconi
anaemia) cells, as well as in ba/F3 (murine pro-B) cells, which do
not express c-kit, BCR-ABL or PDGF-R (35). Deville et al showed that
hTERT overexpression favors the development of IM resistance
through its anti-apoptotic and telomere maintenance functions in
CML cells (36). We showed that IM
decreased hTERT protein levels slightly; however, ROSC and the
combination group increased these levels. The combination group led
to the highest increase in hTERT protein level. However, as yet we
have found no reports on the effect of ROSC on hTERT protein
levels.
Cyclooxygenase-1 (COX-1) is constitutively expressed
in a wide variety of tissues, whereas the COX-2 gene is highly
inducible and expressed in response to stimuli from various
cytokines, growth factors and tumor promoters. COX-2 plays a key
role in the regulation of progression, invasiveness and
angiogenesis of various types of cancer, including gliomas
(37). It was shown that COX-2 is
upregulated in high-grade gliomas and that COX-2 expression is
associated with poor prognosis. Consequently, COX-2 is an emerging
target for anti-GBM therapy (38).
Studies have shown that ROSC inhibited COX-2 expression in cumulus
oocyte complexes and in isolated peritoneal macrophages (39,40),
but there is no report about the mechanism of action on COX-1. We
showed that ROSC increased COX-1 levels, and that the increased
rates reached the highest levels after 4–7 mins and at 10 min. In
contrast to ROSC, the combination group induced the highest
decrease in COX-1 levels for 10 min. Notably, ROSC and the
combination group showed an opposite effect on COX-2 activity; ROSC
decreased COX-2 while the combination group increased COX-2.
Arunasree et al showed that IM resistance was correlated to
high COX-2 activity in IM-resistant K562 cells (41). In the present study, IM was the
second drug to inhibit COX-1 and COX-2 activities.
Burger et al showed that ROSC inhibited
ribosomal RNA synthesis at early rRNA processing (3). Although this inhibitory effect was
reported, notably in the ultrastructure evaluation of ROSC, an
increase in ribosomes and endoplasmic reticulum was determined. Few
autophagic vacuoles were observed in the ROSC group; thus,
autophagy is not involved in the mechanism of ROSC’s action as
either cell resistance or cytotoxicity. In contrast to our results,
Lambert etal determined that ROSC induced autophagy in
osteosarcoma cells (42). We showed
the correlation between autophagy and the cytotoxicity of IMs in
rat glioma cells (14) and in human
GBL cells (unpublished data). In the combination group there were
no autophagic vacuoles, however, an increase in ribosomes and
endoplasmic reticulum was also observed, but this was lower than in
the ROSC group alone.
In addition to drug efflux proteins, telomerase and
TKR proteins, we also investigated the role of MK in this
experiment. Previous reports have suggested that the MK gene may be
involved in multidrug resistance (43,44).
In our previous report on neuroblastoma, as well as unpublished
data in GBL and endometrium carcinoma, we showed the inhibitory
effect of IM on MK levels (45).
ROSC also had an inhibitory effect on MK levels. However, we did
not find any reports about the effect of ROSC on MK. In the
combination group, we also determined an inhibitory effect;
however, this effect was much weaker than ROSC and IM alone. Dai
et al reported that MK played a significant role in rRNA
transcription, ribosome biogenesis and cell proliferation in HepG2
cells; thus, low MK levels led to a decrease in cell numbers and
ribosome biogenesis (46). In
contrast to Dai et al, in the present study, ROSC led to low
cell numbers and MK levels, but it also led to an increase in
ribosomes. In the report of Riggelen et al, it was mentioned
that in certain cases the overexpression of a ribosomal protein has
been shown to suppress tumorigenesis (47). The overexpression of RPL11 has been
shown to interfere with cell cycle progression by inhibiting MDM2
(an E3 ubiquitin ligase that targets p53 for degradation), thereby
resulting in activation of the p53 pathway (48–51).
In light of this study, this ribosome increase may be part of
ROSCs. However, in the combination group, the low increase in the
ribosome number may reflect antagonism.
In the IM group, severe mitochondrial damage was
frequently observed. The decrease in the cAMP level may be due to
mitochondrial damage and/or the inhibition of adenylate cyclase.
Since the increase in ribosome number requires energy (52), we determined little severe
mitochondrial damage in the ROSC and combination groups.
Consequently, it may be reported that ROSC decreased cAMP levels
through the direct inhibition of adenylate cyclase (AC) activity
and ATP was conserved for ribosome biogenesis.
In conclusion, IM with ROSC showed an antagonist
effect in the treatment of human GBL cells. The ROSC group was the
most efficient group to decrease the cell number and to increase
the apoptotic index; however, data provided for the underlying
mechanism of its action were controversial, due to the increase in
the levels of anti-apoptotic proteins, enzymes and processes
(PDGFR-α, AQP-4, hTERT, the activity of COX-1 and ribogenesis). The
effects of ROSC on the hTERT, MK, AQP-4, MRP-1 levels and COX-1
activity were reported for the first time in the present study.
Autophagy was not correlated to ROSC activity in human GBL
spheroids. Although the combination group decreased the levels of
PDGFR-α, EGFR, MK, cAMP, drug efflux proteins and COX-1 activity,
it led to the highest increase in hTERT, COX-2 activity and the
lowest increase in AQP-4 levels. The ribosome number and the lowest
caspase-3 levels seemed to be responsible for one part of this
antagonism. GBL MK is not involved in this antagonism. Further
investigation is required to identify the key regulatory components
which are responsible for this antagonism; however, the
determination of this combination therapy as a failure were
precautionary for oncologists in the treatment of GBL patients and
potentially may contribute to the efficacy of new therapeutic
regimens.
Acknowledgements
This work was supported by the Scientific Research
Projects Coordination Unit of Istanbul University (Project number:
T988/06102006).
References
|
1
|
Krystof V and Uldrijan S: Cyclin-dependent
kinase inhibitors as anticancer drugs. Curr Drug Targets.
11:291–302. 2010. View Article : Google Scholar : PubMed/NCBI
|
|
2
|
Aldoss IT, Tashi T and Ganti AK:
Seliciclib in malignancies. Expert Opin Investig Drugs.
18:1957–1965. 2009. View Article : Google Scholar
|
|
3
|
Burger K, Mühl B, Harasim T, et al:
Chemotherapeutic drugs inhibit ribosome biogenesis at various
levels. J Biol Chem. 285:12416–12425. 2010. View Article : Google Scholar : PubMed/NCBI
|
|
4
|
Bach S, Knockaert M, Reinhardt J, et al:
Roscovitine targets, protein kinases and pyridoxal kinase. J Biol
Chem. 280:31208–31219. 2005. View Article : Google Scholar : PubMed/NCBI
|
|
5
|
Kim EH, Kim SU, Shin DY, et al:
Roscovitine sensitizes glioma cells to TRAIL-mediated apoptosis by
downregulation of survivin and XIAP. Oncogene. 23:446–456. 2004.
View Article : Google Scholar : PubMed/NCBI
|
|
6
|
Komina O, Nosske E, Maurer M, et al:
Roscovitine, a small molecule CDK inhibitor induces apoptosis in
multidrug-resistant human multiple myeloma cells. J Exp Ther Oncol.
9:27–35. 2011.PubMed/NCBI
|
|
7
|
Dey A, Wong ET, Cheok CF, et al:
R-Roscovitine simultaneously targets both the p53 and NF-kappaB
pathways and causes potentiation of apoptosis:implications in
cancer therapy. Cell Death Differ. 15:263–273. 2008. View Article : Google Scholar : PubMed/NCBI
|
|
8
|
Maggiorella L, Aubel C, Haton C, et al:
Cooperative effect of roscovitine and irradiation targets
angiogenesis and induces vascular destabilization in human breast
carcinoma. Cell Prolif. 42:38–48. 2009. View Article : Google Scholar
|
|
9
|
Ganapathi SB, Kester M and Elmslie KS:
State-dependent block of HERG potassium channels by R-roscovitine:
implications for cancer therapy. Am J Physiol Cell Physiol.
296:C701–C710. 2009. View Article : Google Scholar : PubMed/NCBI
|
|
10
|
Yang SY, Miah A, Pabari A, et al: Growth
Factors and their receptors in cancer metastases. Front Biosci.
16:531–538. 2011. View
Article : Google Scholar : PubMed/NCBI
|
|
11
|
Natoli C, Perrucci B, Perrotti F, et al:
Consorzio Interuniversitario Nazionale per Bio-Oncologia (CINBO).
Tyrosine kinase inhibitors. Curr Cancer Drug Targets. 10:462–483.
2010.PubMed/NCBI
|
|
12
|
Waller CF: Imatinib mesylate. Recent
Results Cancer Res. 184:3–20. 2010. View Article : Google Scholar : PubMed/NCBI
|
|
13
|
Razis E, Selviaridis P, Labropoulos S, et
al: Phase II study of neoadjuvant imatinib in glioblastoma:
evaluation of clinical and molecular effects of the treatment. Clin
Cancer Res. 15:6258–6266. 2009. View Article : Google Scholar : PubMed/NCBI
|
|
14
|
Erguven M, Yazihan N, Aktas E, et al:
Carvedilol in glioma treatment alone and with imatinib in
vitro. Int J Oncol. 36:857–866. 2010. View Article : Google Scholar : PubMed/NCBI
|
|
15
|
Mangiola A, Anile C, Pompucci A, et al:
Glioblastoma therapy: going beyond Hercules Columns. Expert Rev
Neurother. 10:507–514. 2010. View Article : Google Scholar : PubMed/NCBI
|
|
16
|
Declèves X, Bihorel S, Debray M, et al:
ABC transporters and the accumulation of imatinib and its active
metabolite CGP74588 in rat C6 glioma cells. Pharmacol Res.
57:214–222. 2008.PubMed/NCBI
|
|
17
|
Bihorel S, Camenisch G, Lemaire M, et al:
Influence of breast cancer resistance protein (Abcg2) and
p-glycoprotein (Abcb1a) on the transport of imatinib mesylate
(Gleevec) across the mouse blood-brain barrier. J Neurochem.
102:1749–1757. 2007. View Article : Google Scholar : PubMed/NCBI
|
|
18
|
Ozawa T, Brennan CW, Wang L, et al: PDGFRA
gene rearrangements are frequent genetic events in PDGFRA-amplified
glioblastomas. Genes Dev. 24:2205–2218. 2010. View Article : Google Scholar : PubMed/NCBI
|
|
19
|
Muramatsu T: Midkine (MK), the product of
a retinoic acid responsive gene, and pleiotrophin constitute a new
protein family regulating growth and differentiation. Int J Dev
Biol. 37:183–188. 1993.PubMed/NCBI
|
|
20
|
Garver RI, Chan CS and Milner PG:
Reciprocal expression of pleiotrophin and midkine in normal versus
malignant lung tissues. Am J Respir Cell Mol Biol. 9:463–466. 1993.
View Article : Google Scholar : PubMed/NCBI
|
|
21
|
Garver RI, Radford DM, Donis-Keller H, et
al: Midkine and pleiotrophin expression in normal and malignant
breast tissue. Cancer. 74:1584–1590. 1994. View Article : Google Scholar : PubMed/NCBI
|
|
22
|
Konishi N, Nakamura M, Nakaoka S, et al:
Immunohistochemical analysis of midkine expression in human
prostate carcinoma. Oncology. 57:253–257. 1999. View Article : Google Scholar : PubMed/NCBI
|
|
23
|
Mishima K, Asai A, Kadomatsu K, et al:
Increased expression of midkine during the progression of human
astrocytomas. Neurosci Lett. 233:29–32. 1997. View Article : Google Scholar : PubMed/NCBI
|
|
24
|
Torres KE, Castillo G and Horwitz SB: Proc
Am Assoc Cancer Res. 38:5301997.
|
|
25
|
Fan W, Miller MC, Cheng RL, et al:
Induction of apoptosis by low concentrations of Taxol is not
dependent on a G2/M block. Microsc Microanal. 4:1042–1043.
1998.
|
|
26
|
Miller MC III, Johnson KR, Willingham MC,
et al: Apoptotic cell death induced by baccatin III, a precursor of
Taxol, occurs without G2/M arrest. Cancer Chemother Pharmacol.
44:444–452. 1999. View Article : Google Scholar : PubMed/NCBI
|
|
27
|
Yakisich JS, Boethius J, Lindblom IO, et
al: Inhibition of DNA synthesis in human gliomas by roscovitine.
Neuroreport. 10:2563–2567. 1999. View Article : Google Scholar : PubMed/NCBI
|
|
28
|
Fleming IN, Hogben M, Frame S, et al:
Synergistic inhibition of ErbB signaling by combined treatment with
seliciclib and ErbB-targeting agents. Clin Cancer Res.
14:4326–4335. 2008. View Article : Google Scholar : PubMed/NCBI
|
|
29
|
Mohapatra S, Chu B, Wei S, et al:
Roscovitine inhibits STAT5 activity and induces apoptosis in the
human leukemia virus type 1-transformed cell line MT-2. Cancer Res.
63:8523–8530. 2003.PubMed/NCBI
|
|
30
|
Spiegl-Kreinecker S, Buchroithner J,
Elbling L, et al: Expression and functional activity of the
ABC-transporter proteins P-glycoprotein and multidrug-resistance
protein 1 in human brain tumor cells and astrocytes. J Neurooncol.
57:27–36. 2002. View Article : Google Scholar
|
|
31
|
Ding T, Ma Y, Li W, et al: Role of
aquaporin-4 in the regulation of migration and invasion of human
glioma cells. Int J Oncol. 38:1521–1531. 2011.PubMed/NCBI
|
|
32
|
Ibraghimov-Beskrovnaya O: Targeting
dysregulated cell cycle and apoptosis for polycystic kidney disease
therapy. Cell Cycle. 6:776–779. 2007. View Article : Google Scholar : PubMed/NCBI
|
|
33
|
Shukla S, Acharya S, Rajput D, et al:
Telomere-the twilight to immortality. J Assoc Physicians India.
58:553–560. 2010.PubMed/NCBI
|
|
34
|
Marian CO, Cho SK, McEllin BM, et al: The
telomerase antagonist, imetelstat, efficiently targets glioblastoma
tumor-initiating cells leading to decreased proliferation and tumor
growth. Clin Cancer Res. 16:154–163. 2010. View Article : Google Scholar
|
|
35
|
Uziel O, Fenig E, Nordenberg J, et al:
Imatinib mesylate (Gleevec) downregulates telomerase activity and
inhibits proliferation in telomerase-expressing cell lines. Br J
Cancer. 92:1881–1891. 2005. View Article : Google Scholar : PubMed/NCBI
|
|
36
|
Deville L, Hillion J, Pendino F, et al:
hTERT promotes imatinib resistance in chronic myeloid leukemia
cells: therapeutic implications. Mol Cancer Ther. 10:711–719. 2011.
View Article : Google Scholar : PubMed/NCBI
|
|
37
|
Greenhough A, Smartt HJ, Moore AE, et al:
The COX-2/PGE2 pathway: key roles in the hallmarks of cancer and
adaptation to the tumour microenvironment. Carcinogenesis.
30:377–386. 2009. View Article : Google Scholar : PubMed/NCBI
|
|
38
|
Reardon DA, Quinn JA, Vredenburgh J, et
al: Phase II trial of irinotecan plus celecoxib in adults with
recurrent malignant glioma. Cancer. 103:329–38. 2005. View Article : Google Scholar : PubMed/NCBI
|
|
39
|
Du J, Wei N, Guan T, et al: Inhibition of
CDKS by roscovitine suppressed LPS-induced *NO production through
inhibiting NFkappaB activation and BH4 biosynthesis in macrophages.
Am J Physiol Cell Physiol. 297:C742–9. 2009.PubMed/NCBI
|
|
40
|
Vigneron C, Nuttinck F, Perreau C, et al:
Effect of roscovitine, a cdk1 inhibitor, and of the presence of
oocyte on bovine cumulus cell expansion and cyclooxygenase-2
expression. Mol Reprod Dev. 65:114–21. 2003. View Article : Google Scholar : PubMed/NCBI
|
|
41
|
Arunasree KM, Roy KR, Anilkumar K, et al:
Imatinib-resistant K562 cells are more sensitive to celecoxib, a
selective COX-2 inhibitor: role of COX-2 and MDR-1. Leuk Res.
32:855–864. 2008. View Article : Google Scholar : PubMed/NCBI
|
|
42
|
Lambert LA, Qiao N, Hunt KK, et al:
Autophagy: a novel mechanism of synergistic cytotoxicity between
doxorubicin and roscovitine in a sarcoma model. Cancer Res.
68:7966–7974. 2008. View Article : Google Scholar : PubMed/NCBI
|
|
43
|
Hu R, Yan Y, Li Q, et al: Increased drug
efflux along with midkine gene high expression in childhood
B-lineage acute lymphoblastic leukemia cells. Int J Hematol.
92:105–110. 2010. View Article : Google Scholar : PubMed/NCBI
|
|
44
|
Kang HC, Kim IJ, Park JH, et al:
Identification of genes with differential expression in acquired
drug-resistant gastric cancer cells using high-density
oligonucleotide microarrays. Clin Cancer Res. 10:272–284. 2004.
View Article : Google Scholar : PubMed/NCBI
|
|
45
|
Bilir A, Erguven M, Yazihan N, et al:
Enhancement of vinorelbine-induced cytotoxicity and apoptosis by
clomipramine and lithium chloride in human neuroblastoma cancer
cell line SH-SY5Y. J Neurooncol. 100:385–395. 2010. View Article : Google Scholar : PubMed/NCBI
|
|
46
|
Dai LC, Shao JZ, Min LS, et al: Midkine
accumulated in nucleolus of HepG2 cells involved in rRNA
transcription. World J Gastroenterol. 14:6249–6253. 2008.
View Article : Google Scholar : PubMed/NCBI
|
|
47
|
Van Riggelen J, Yetil A and Felsher DW:
MYC as a regulator of ribosome biogenesis and protein synthesis.
Nat Rev Cancer. 10:301–309. 2011.PubMed/NCBI
|
|
48
|
Dai MS, Arnold H, Sun XX, et al:
Inhibition of c-Myc activity by ribosomal protein L11. EMBO J.
26:3332–3345. 2007. View Article : Google Scholar : PubMed/NCBI
|
|
49
|
Lohrum MA, Ludwig RL, Kubbutat MH, et al:
Regulation of HDM2 activity by the ribosomal protein L11. Cancer
Cell. 3:577–587. 2003. View Article : Google Scholar : PubMed/NCBI
|
|
50
|
Zhang Y, Wolf GW, Bhat K, et al: Ribosomal
protein L11 negatively regulates oncoprotein MDM2 and mediates a
p53-dependent ribosomal-stress checkpoint pathway. Mol Cell Biol.
23:8902–8912. 2003. View Article : Google Scholar : PubMed/NCBI
|
|
51
|
Bhat KP, Itahana K, Jin A, et al:
Essential role of ribosomal protein L11 in mediating growth
inhibition-induced p53 activation. EMBO J. 23:2402–2412. 2004.
View Article : Google Scholar : PubMed/NCBI
|
|
52
|
Muller AW: Thermosynthesis as energy
source for the RNA World: a model for the bioenergetics of the
origin of life. Biosystems. 82:93–102. 2005.PubMed/NCBI
|