Introduction
Neoadjuvant chemotherapy (NAC) is a standard
treatment for locally advanced breast cancer. Previous randomized
controlled trials revealed that NAC increased the rate of
breast-conserving surgery (BCS) and provided the same survival
benefits as postoperative chemotherapy (1,2). To
this end, NAC has become a standard treatment for females with
operable breast cancer who request BCS, even when a mastectomy was
suitable at presentation.
In breast cancer patients treated with NAC, survival
rates are significantly improved in patients with a pathological
complete response (pCR) than in patients with a residual tumor
(2,3). Furthermore, pCR rates have recently
increased owing to development of novel chemotherapy regimens
(2,4,5).
Theoretically, surgery is not required for patients
whose tumors have been completely eradicated by NAC. However,
eradication of the tumor is only determined by pathological
analysis of the surgically-removed breast tissue that may have
contained the tumor. The development of a diagnostic tool capable
of precisely predicting pCR following NAC, may enable surgery to be
omitted or minimized.
Core needle biopsy is an example of such a tool.
Additional options are non-invasive imaging methods, including
mammography, ultrasound, magnetic resonance imaging (MRI) and
computed tomography (CT). Previously, MRI was analyzed for
assessment of tumor responses following NAC and was demonstrated to
be more reliable than mammography or ultrasound (6,7).
In the most recent study, pCR was differently
observed between various molecular subtypes of breast cancer
classifications based on estrogen receptor (ER), progesterone
receptor (PgR) and human epidermal growth factor receptor 2 (HER2)
(8). To predict pCR following NAC,
evaluation of clinical tumor response by MRI, as well as the
molecular subtype of the tumor, is important. In the present study,
clinical tumor response diagnosed by MRI and clinicopathological
factors at baseline were analyzed for correlations with
pathological tumor responses following NAC. In addition,
clinicopathological factors, including molecular subtypes, were
analyzed for a correlation with the MRI capacity to predict
pCR.
Materials and methods
Patients
Female patients diagnosed with invasive breast
cancer by core needle biopsy were treated with NAC. Following NAC,
patients were examined using MRI at the Saitama Cancer Center
(Saitama, Japan). Patients underwent surgery at the same institute
between February 2003 and June 2008.
Of the 2427 breast cancer cases treated with surgery
between February 2003 and June 2008 at the center, 384 (15.8%) were
treated with NAC. Of these 384 cases, 120 that did not undergo MRI
following NAC were excluded, leaving 264 breast cancer cases of 260
patients (4 synchronous bilateral) eligible for inclusion in the
present study. The study was approved by the ethics committee of
Saitama Cancer Center, Saitama, Japan. Written informed patient
consent was obtained from the patient.
MRI technique
Details of the MRI technique are presented in
Table I. Briefly, the device used
was an Intera Achieva Nova Dual 1.5 T instrument (Philips, Aachen,
Germany) with a SENSE body coil. Transverse images were obtained by
diffusion-weighted (DW) imaging. Coronal images were obtained by
contrast-enhanced dynamic imaging. Sagittal images were obtained by
contrast-enhanced late-phase imaging. Additionally, depending on
the case, sagittal images were obtained by T2-weighted
fat-suppressed imaging prior to infusion of contrast material.
 | Table IDetails of MRI techniques. |
Table I
Details of MRI techniques.
| Technique | TR (msec) | TE (msec) | FA | BW (Hz) | Profile order | TFE | Voxel size (mm) | Fat supression | Diffusion
b-factor | No. of signal
averages | Scan time | Dynamic phase | Slice
orientation |
|---|
| Diffusion-weighted
image: single shot EPI | 4067 | 82 | 90 | 22.2 | - | - | 2.23 (0.98) × 2.80
(0.98) × 3.5 | SPAIR | 0, 800 | 6 | 1 min 55 sec | - | Transverse |
| Dynamic study: 3D
FFE | 11.0 | 5.6 | 20 | 992.1 | - | - | 1.12 (0.49) × 1.12
(0.49) × 10.0 (5.0) | Proset (1:3:3:1) | - | 1 | 30.2 sec/phase | 6 (pre,1,1.5, 2,4,6
min) | Coronal |
| High resolution
image: 3D TFE | 3.5 | 1.74 | 10 | 1183.7 | Low-high radial | 40 | 1.33 (0.80) × 1.33
(0.80) ×1.70 (0.85) | SPAIR | - | 3 | 2 min 9 sec | - | Sagittal |
Clinical tumor response evaluated by
MRI
Physicians evaluated clinical tumor responses prior
to surgery by physical examination, mammography and ultrasound.
Radiologists evaluated clinical tumor response following NAC by
MRI. MRI diagnoses were performed independently of physical
examination, mammography or ultrasound observations. In the present
study, clinical tumor response diagnosed by MRI following NAC was
defined as a clinical complete response (cCR) or as a residual
tumor. cCR was diagnosed if no gadolinium enhancement or an
enhancement equal to or less than that of glandular tissue was
observed in any phase of the MRI. Presence of a residual tumor was
diagnosed if an enhancement more than that of glandular tissue was
identified in any phase of the MRI. A case of cCR and residual
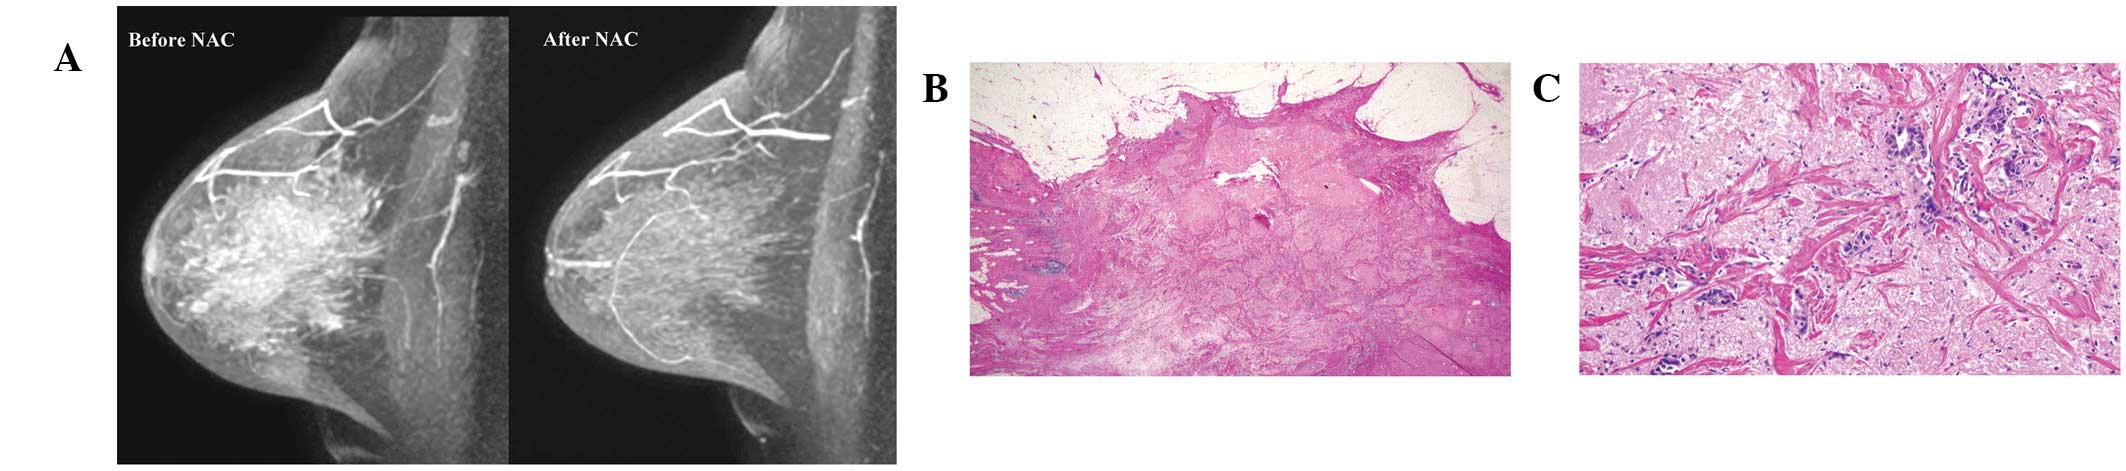
tumour are presented in Fig. 1A and
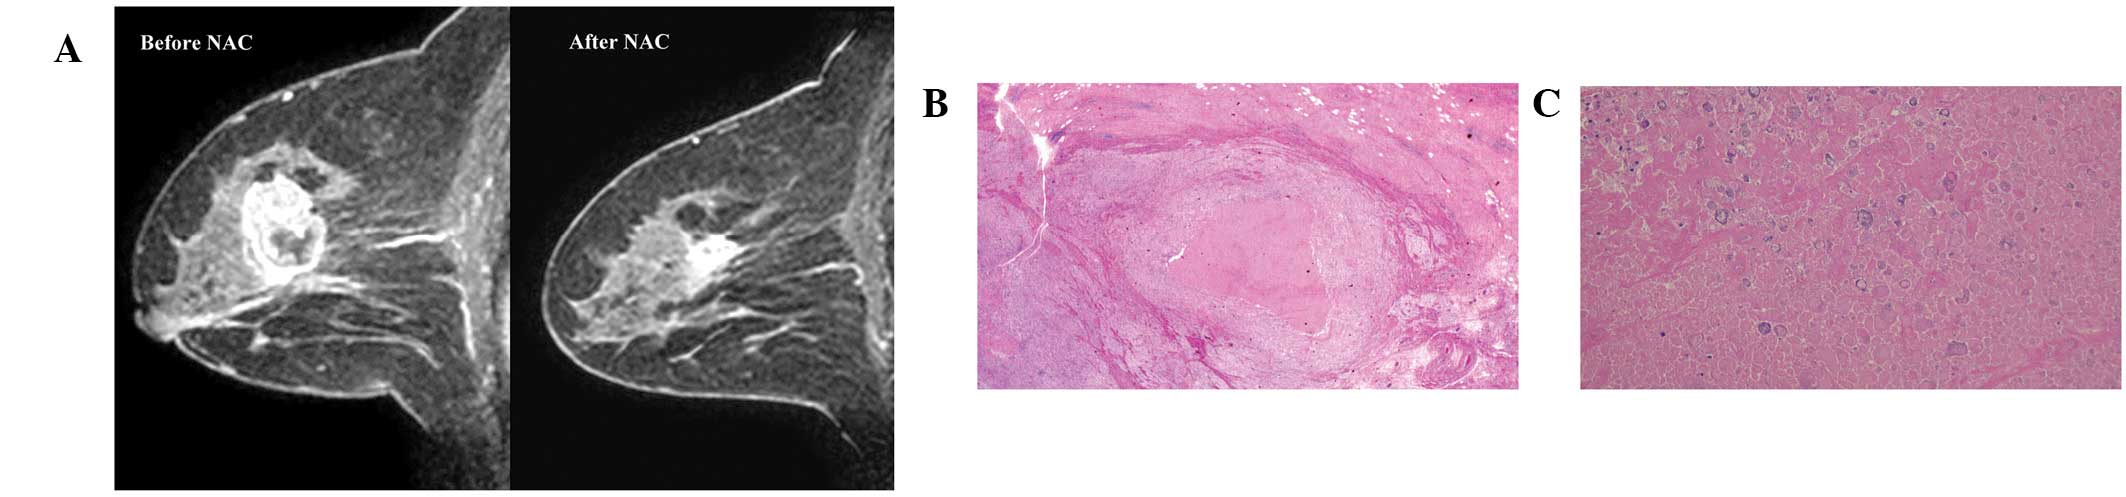
2A, respectively.
Pathological tumor responses
Pathological tumor response following NAC was
evaluated by pathologists according to the criteria of the Japanese
Breast Cancer Society (JBCS) (9)
and were classified as grade 0 (no change), 1 (moderate change), 2
(marked change) and 3 (pCR). In the present study, a pCR was
determined to be grade 3 according to the JBCS criteria, defined as
the absence of residual invasive cancer irrespective of the
presence or absence of residual ductal carcinoma in situ
(DCIS).
Correlation between tumor response
evaluated by MRI and pathology
A case of accurate prediction of pCR by MRI was
defined as a cCR diagnosed by MRI and a pCR by pathology
(true-positive, TP). A case of accurate prediction of a residual
tumor by MRI was defined as a residual tumor diagnosed by MRI and
pathology (true-negative, TN). A case of inaccurate prediction of
pCR by MRI was defined as a cCR diagnosed by MRI but a residual
tumor diagnosed by pathology (false-positive, FP). A case of
inaccurate prediction of a residual tumor by MRI was defined as a
residual tumor diagnosed by MRI but a pCR diagnosed by pathology
(false-negative, FN). Based on these parameters, sensitivity,
specificity, accuracy, positive predictive value (PPV) and negative
predictive value (NPV) were calculated.
To analyze how accurately MRI predicts the absence
or presence of residual DCIS without invasive cancer following NAC,
MRI diagnoses were analyzed for a correlation with the presence or
absence of residual DCIS in tumors for which the pCR was
diagnosed.
Clinicopathological factors
Patient age and body mass index (BMI) at MRI
evaluation; clinical tumor size and clinical nodal status at
baseline; histological types; ER, PgR and HER2 expression at
baseline; and molecular subtypes at baseline were analyzed for
correlations with pathological tumor response and the TP, TN, FP
and FN rates for predicting pCR by MRI. The clinical tumor size and
nodal status at baseline were classified according to the criteria
of the American Joint Committee on Cancer (10).
Histological types were divided into two categories:
invasive ductal carcinoma (IDC) not otherwise specified and other
types of IDC. The expression of ER and PgR at baseline was measured
by immunohistochemistry or an enzyme immunoassay. Cut-off values
for ER and PgR were ≥10% positive cells by immunohistochemistry or
≥10 fmol/mg protein by the enzyme immunoassay. HER2 expression at
baseline was measured by immunohistochemistry using Herceptest™
(Dako, Glostrup, Denmark) and was classified as 0, 1+, 2+ or 3+.
HER2 2+ was further divided into positive and negative for HER2 by
fluorescence in situ hybridization (FISH) using
PathVysion® HER-2 DNA probe kit (Abbott Molecular,
Wiesbaden, Germany). The HER2-positive status was defined as HER2
3+ by immunohistochemistry or HER2 gene amplification by FISH.
Molecular subtypes at baseline were classified into
four categories based on the status of ER, PgR and HER2.
Luminal/HER2-negative tumors were positive for the ER and/or PgR
and negative for HER2. Luminal/HER2-positive tumors were positive
for the ER and/or PgR and HER2. Non-luminal/HER2-positive tumors
were negative for the ER and PgR and positive for HER2.
Triple-negative tumors were defined as negative for the ER, PgR and
HER2.
Statistical analysis
Statistical analysis was performed using Fisher’s
exact test. P<0.05 were considered to indicate a statistically
significant difference. Analysis was performed using Statview-J
4.5® (Abacus Concepts, Piscataway, NJ, USA).
Results
Patients age ranged between 23 and 71 years (mean,
51 years). Of 264 breast cancer cases, 59 (22%) and 205 (78%) were
diagnosed by MRI following NAC as a cCR or residual tumor,
respectively (Table II). Four (2%),
81 (31%), 81 (31%) and 98 (37%) were pathologically diagnosed as
grade 0, 1, 2 and 3 (pCR), respectively (Table II).
| Table IIPathological tumor response and MRI
diagnosis. |
Table II
Pathological tumor response and MRI
diagnosis.
| Pathological tumor
response, n (%)
| |
|---|
| Response | 0 | 1 | 2 | 3 | Total (%) |
|---|
| cCR | 0 (0.0) | 1 (1.7) | 15 (25.4) | 43 (72.9) | 59 (22.3) |
| Residual tumor | 4 (2.0) | 80 (39.0) | 66 (32.2) | 55 (26.8) | 205 (77.7) |
| Total | 4 (1.5) | 81 (30.7) | 81 (30.7) | 98 (37.1) | 264 (100.0) |
Of the clinicopathological factors, clinical T
category, ER, PgR, HER2, molecular subtype and histological type at
baseline were identified to significantly correlate with
pathological tumor response (Table
III). However, clinical N category at baseline and age and BMI
at MRI evaluation did not correlate with these responses (Table III).
| Table IIIPathological tumor response and
clinicopathological factors. |
Table III
Pathological tumor response and
clinicopathological factors.
| Pathological tumor
response (%)
| | |
|---|
| Clinicopathological
factors | 0 | 1 | 2 | 3 | Total | P-value |
|---|
| Age (years) | | | | | | |
| ≤50 | 3 (2.2) | 43 (32.1) | 44 (32.8) | 44 (32.8) | 134 | 0.41 |
| ≥51 | 1 (0.8) | 38 (29.2) | 37 (28.5) | 54 (41.5) | 130 | |
| Body mass
index | | | | | | |
| ≤23 | 1 (0.7) | 43 (30.7) | 39 (27.9) | 57 (40.7) | 140 | 0.37 |
| >23 | 3 (2.5) | 36 (29.5) | 42 (34.4) | 41 (33.6) | 122 | |
| Clinical tumor
size | | | | | | |
| T1 | 1 (8.3) | 2 (16.7) | 0 (0.0) | 1 (8.3) | 12 | 0.046 |
| T2 | 2 (1.3) | 39 (25.5) | 44 (28.8) | 68 (44.4) | 153 | |
| T3 | 0 (0.0) | 27 (42.9) | 20 (31.7) | 16 (25.4) | 63 | |
| T4 | 1 (2.8) | 13 (36.1) | 13 (36.1) | 9 (25.0) | 36 | |
| Clinical nodal
status | | | | | | |
| N0 | 3 (4.8) | 16 (25.4) | 15 (23.8) | 29 (46.0) | 63 | 0.11 |
| N1 | 1 (0.7) | 46 (32.2) | 44 (30.8) | 52 (36.4) | 143 | |
| N2 | 0 (0.0) | 10 (32.3) | 9 (29.0) | 12 (38.7) | 31 | |
| N3 | 0 (0.0) | 9 (33.3) | 13 (48.1) | 5 (18.5) | 27 | |
| Estrogen
receptor | | | | | | |
| Negative | 2 (1.7) | 26 (22.6) | 18 (15.7) | 69 (60.0) | 115 | <0.0001 |
| Positive | 2 (1.3) | 55 (36.9) | 63 (42.3) | 29 (19.5) | 149 | |
| Progesterone
receptor | | | | | | |
| Negative | 3 (2.1) | 35 (24.6) | 26 (18.3) | 78 (54.9) | 142 | <0.0001 |
| Positive | 1 (0.8) | 46 (37.8) | 55 (45.1) | 20 (16.4) | 122 | |
| HER2 | | | | | | |
| 0 | 2 (5.3) | 15 (39.5) | 16 (42.1) | 5 (13.2) | 38 | <0.0001 |
| 1+ | 2 (2.6) | 29 (38.2) | 24 (31.6) | 21 (27.6) | 76 | |
| 2+ | 0 (0.0) | 25 (39.7) | 17 (27.0) | 21 (33.3) | 63 | |
| 3+ | 0 (0.0) | 12 (13.8) | 24 (27.6) | 51 (58.6) | 87 | |
| Molecular
subtype | | | | | | |
|
Luminal/HER2-negative | 2 (2.2) | 37 (39.8) | 41 (44.1) | 13 (14.0) | 93 | <0.0001 |
|
Luminal/HER2-positive | 0 (0.0) | 15 (27.8) | 22 (40.7) | 17 (31.5) | 54 | |
| Non-luminal/
HER2-positive | 0 (0.0) | 7 (10.6) | 11 (16.7) | 48 (72.7) | 66 | |
|
Triple-negative | 2 (4.5) | 17 (38.6) | 5 (11.4) | 20 (45.5) | 44 | |
| Histological
type | | | | | | |
| IDC NOS | 3 (1.2) | 73 (29.6) | 74 (30.0) | 97 (39.3) | 247 | 0.026 |
| Others | 1 (5.9) | 8 (82.4) | 7 (47.1) | 1 (5.9) | 17 | |
| Total | 4 (1.5) | 81 (30.7) | 81 (30.7) | 98 (37.1) | 264 | |
In terms of predicting pCR by MRI, 43 (16%), 150
(57%), 16 (6%) and 55 (21%) were TP, TN, FP and FN, respectively
(Table IV). Clinical T category,
ER, PgR, HER2, molecular subtype and histological type at baseline
were identified to significantly correlate with ratio of TP, TN, FP
and FN cases (Table IV). However,
clinical N category at baseline and age and BMI at MRI evaluation
did not correlate with this ratio (Table IV).
| Table IVNumber and ratio of TP, TN, FP and FN
cases and clinicopathological factors. |
Table IV
Number and ratio of TP, TN, FP and FN
cases and clinicopathological factors.
| Clinicopathological
factors | TP (%) | TN (%) | FP (%) | FN (%) | Total | P-value |
|---|
| Age (years) | | | | | | |
| ≤50 | 20 (14.9) | 78 (58.2) | 12 (9.0) | 24 (17.9) | 134 | |
| ≥51 | 23 (17.7) | 72 (55.4) | 4 (3.1) | 31 (23.8) | 130 | 0.15 |
| Body mass
index | | | | | | |
| ≤23 | 24 (17.1) | 76 (54.3) | 7 (5.0) | 33 (23.6) | 140 | |
| >23 | 19 (15.6) | 72 (59.0) | 9 (7.4) | 22 (18.0) | 122 | 0.59 |
| Clinical tumor
size | | | | | | |
| T1 | 4 (33.3) | 7 (58.3) | 0 (0.0) | 1 (8.3) | 12 | |
| T2 | 33 (21.6) | 76 (49.7) | 9 (5.9) | 35 (22.9) | 153 | |
| T3 | 4 (6.3) | 42 (66.7) | 5 (7.9) | 12 (19.0) | 63 | |
| T4 | 2 (5.6) | 25 (69.4) | 2 (5.6) | 7 (19.4) | 36 | 0.048 |
| Clinical nodal
status | | | | | | |
| N0 | 16 (25.4) | 30 (47.6) | 4 (6.3) | 13 (20.6) | 63 | |
| N1 | 23 (16.1) | 83 (58.0) | 8 (5.6) | 29 (20.3) | 143 | |
| N2 | 2 (6.5) | 18 (58.1) | 1 (3.2) | 10 (32.3) | 31 | |
| N3 | 2 (7.4) | 19 (70.4) | 3 (11.1) | 3 (11.1) | 27 | 0.16 |
| Estrogen
receptor | | | | | | |
| Negative | 34 (29.6) | 44 (38.3) | 2 (1.7) | 35 (30.4) | 115 | |
| Positive | 9 (6.0) | 106 (71.1) | 14 (9.4) | 20 (13.4) | 149 | <0.0001 |
| Progesterone
receptor | | | | | | |
| Negative | 39 (27.5) | 60 (42.3) | 4 (2.8) | 39 (27.5) | 142 | |
| Positive | 4 (3.3) | 90 (73.8) | 12 (9.8) | 16 (13.1) | 122 | <0.0001 |
| HER2 | | | | | | |
| 0 | 3 (7.9) | 33 (86.8) | 0 (0.0) | 2 (5.3) | 38 | |
| 1+ | 8 (10.5) | 50 (65.8) | 5 (6.6) | 13 (17.1) | 76 | |
| 2+ | 9 (14.3) | 36 (57.1) | 6 (9.5) | 12 (19.0) | 63 | |
| 3+ | 23 (26.4) | 31 (35.6) | 5 (5.7) | 28 (32.2) | 87 | <0.0001 |
| Molecular
subtype | | | | | | |
|
Luminal/HER2-negative | 4 (4.3) | 72 (77.4) | 8 (8.6) | 9 (9.7) | 93 | |
|
Luminal/HER2-positive | 5 (9.3) | 31 (57.4) | 6 (11.1) | 12 (22.2) | 54 | |
| Non-luminal/
HER2-positive | 22 (33.3) | 16 (24.2) | 2 (3.0) | 26 (39.4) | 66 | |
|
Triple-negative | 12 (27.3) | 24 (54.5) | 0 (0.0) | 8 (18.2) | 44 | <0.0001 |
| Histological
type | | | | | | |
| IDC NOS | 43 (17.4) | 136 (55.1) | 14 (5.7) | 54 (21.9) | 247 | |
| Others | 0 (0.0) | 14 (82.4) | 2 (11.8) | 1 (5.9) | 17 | 0.047 |
| Total | 43 (16.3) | 150 (56.8) | 16 (6.1) | 55 (20.8) | 264 | |
Based on the number of TP, TN, FP and FN cases, the
sensitivity, specificity, accuracy, PPV and NPV were 44, 90, 73, 73
and 73%, respectively, in all cases (Table V). MRI FP and FN cases are presented
in Figs. 1 and 2, respectively.
| Table VpCR rate, sensitivity, specificity,
accuracy, PPV and NPV for predicting pCR by MRI and molecular
subtypes. |
Table V
pCR rate, sensitivity, specificity,
accuracy, PPV and NPV for predicting pCR by MRI and molecular
subtypes.
| Molecular
subtype | pCR rate | Sensitivity | Specificity | Accuracy | PPV | NPV |
|---|
|
Luminal/HER2-negative | 14.0 | 30.8 | 90.0 | 81.7 | 33.3 | 88.9 |
|
Luminal/HER2-positive | 31.5 | 29.4 | 83.8 | 66.7 | 45.5 | 72.1 |
| Non-luminal/
HER2-positive | 72.7 | 45.8 | 88.9 | 57.6 | 91.7 | 38.1 |
|
Triple-negative | 45.5 | 60.0 | 100.0 | 81.8 | 100.0 | 75.0 |
| Total | 37.1 | 43.9 | 90.4 | 73.1 | 72.9 | 73.2 |
The pCR rates differed between the 4 molecular
subtypes (Tables III and V). pCR rates increased from 14% to 73% in
the order, luminal/HER2-negative, luminal/HER2-positive,
triple-negative and non-luminal/HER2-positive tumors. The
sensitivity, specificity, accuracy, PPV and NPV for predicting pCR
differed between these subtypes (Table
V). Sensitivity and specificity were the highest (60 and 100%,
respectively) in triple-negative tumors. The accuracy was the
highest (82%) in luminal/HER2 negative and triple-negative tumors.
PPV decreased in order from triple-negative (100%),
non-luminal/HER2-positive (92%), luminal/HER2-positive (46%) and
luminal/HER2-negative (33%) tumors. NPV was the highest (89%) in
luminal/HER2-negative tumors and the lowest (38%) in
non-luminal/HER2-positive tumors.
In 98 pCR cases, 66 (67%) had no residual DCIS and
32 (33%) had residual DCIS (Table
VI). In terms of predicting a lack of residual DCIS by MRI, 36
(37%), 24 (25%), 8 (8%) and 30 (31%) cases were diagnosed as TP,
TN, FP and FN, respectively. The sensitivity, specificity,
accuracy, PPV and NPV were 55, 75, 61, 82 and 44%,
respectively.
| Table VIPresence or absence of residual DCIS
and MRI diagnoses. |
Table VI
Presence or absence of residual DCIS
and MRI diagnoses.
| Residual DCIS (%)
| |
|---|
| Response | Absence | Presence | Total (%) |
|---|
| cCR | 36 (81.8) | 8 (18.2) | 44 (44.9) |
| Residual tumor | 30 (55.6) | 24 (44.4) | 54 (55.1) |
| Total | 66 (67.3) | 32 (32.7) | 98 (100.0) |
Discussion
In the present study, a cCR diagnosed by MRI was
identified in 59 (22%) of 264 cases of breast cancer treated with
NAC. Of the 59 cCR cases, 43 were TP and 16 were FP. The number of
MRI FP cases was low (6%) in all cases. Of the 16 MRI FP cases, 15
were pathologically diagnosed as a grade 2 response and one was
diagnosed as a grade 1 response. According to the JBCS criteria, a
grade 2 response is indicative of marked changes in two-thirds or
more of the whole tumor area (grade 2A) or only a few cancer cells
remain (grade 2B) (9). Therefore,
in this study, the majority of cases diagnosed as a cCR by MRI were
considered to have responded well to NAC.
The FP MRI may be explained by the hypothesis that
residual invasive cancer does not require vasculature due to their
small tumor volumes or a low viability of cancer cells. In the
present study, MRI FP rates were higher in ER- or PgR-positive
tumors compared with ER- or PgR-negative tumors, indicating that
hormone receptor-positive tumors survive with a lower vasculature
following NAC than hormone receptor negative-tumors.
Chen et al(11) reported a PPV of 74% using the same
criteria for cCR and pCR as the present study. This result is
almost identical to the result obtained in our study (73%). In
addition, the authors reported that the PPV increased in
HER2-positive (95%), compared with HER2-negative (50%) tumors.
These results are also consistent with current results which
indicate that the PPV was 33% in luminal/HER2-negative tumors and
92% in non-luminal/HER2-positive tumors. In an additional study by
the same group (12) mean
MRI-pathological size discrepancy was identified to be smaller in
HER2-positive and hormone receptor-negative tumors or tumors with
high Ki67 scores compared with their counterparts. In addition,
among HER2-negative tumors, the accuracy of MRI for predicting pCR
was increased in hormone receptor-negative cancers compared with
hormone receptor positive-cancers and was also improved in
high-proliferation tumors compared with low-proliferation tumors
(13). In another study, MRI more
accurately predicted tumor sizes following NAC in HER2-positive and
triple-negative tumors compared with luminal tumors (14). By contrast, De Los Santos et
al(15) reported that the
molecular subtype was not identified to significantly affect the
sensitivity, specificity, PPV or NPV of MRI for the prediction of
pathological responses. However, the number of patients analyzed in
the study was smaller than that of the present study. Current
results indicate that MRI is more useful for predicting pCR
following NAC in patients with non-luminal/HER2-positive tumors or
in those with triple-negative tumors compared with patients with
luminal/HER2-negative tumors.
In the current study, the number of MRI FN cases was
∼1/5 (21%) of all cases and the ratio increased with increased HER2
scores and it was higher in ER- or PgR-negative tumors compared to
ER- or PgR-positive tumors. In 4 molecular subtypes, the number of
MRI FN cases was lowest (10%) in luminal/HER2-negative tumors and
highest (39%) in non-luminal/HER2-positive tumors. These results
indicate that HER2 overexpression or hormone receptor negativity
appears to demonstrate a positive enhancement in MRI following NAC
despite the absence of residual invasive cancer. In general,
HER2-positive or hormone receptor-negative tumors grow more rapidly
and may require higher neovascularization than their counterparts.
Although the biological aspect of the FN MRI remains unclear, tumor
vasculature may remain following NAC if a primary tumor previously
exhibited abundant vascularization. Tumor neovascularization at
baseline and the sensitivity to NAC may be important in the
mechanism of the FN MRI.
Of the 4 molecular subtypes, the present study
demonstrated that sensitivity, specificity, accuracy and PPV of MRI
for predicting pCR were the highest in triple-negative tumors. In
addition, non-luminal/HER2-positive tumors revealed an extremely
high pCR rate and PPV. However, these tumors were identified with
the lowest NPV (38%). As a result, MRI is concluded to be the most
useful for prediction of pCR following NAC in patients with
triple-negative tumors. When a cCR is diagnosed by MRI in patients
with triple-negative tumors, the removed volume of the breast
tissue must be minimized.
In this study, MRI predicted the presence or absence
of residual DCIS when there were no residual invasive cancer
following NAC. The accuracy of these predictions was almost the
same as that of residual invasive cancer. The presence of residual
DCIS following NAC is important for determining the extent of
surgery necessary to achieve free surgical margins. In addition, it
is important for predicting the risk of recurrence. Previously, von
Minckwitz et al(8) observed
that the presence of residual DCIS in the absence of invasive
cancer was associated with increased recurrence risk compared with
absence of residual DCIS and invasive cancer. The authors
recommended that pCR must be defined as the absence of residual
invasive cancer and DCIS in the breast and nodes. Accordingly, MRI
is important for deciding the extent of surgery and may also be
useful for estimating patient prognosis.
The present study only analyzed the status of
gadolinium enhancement at each phase of MRI. Simultaneous analysis
of time-signal intensity curves when judging the residual tumor may
prove useful. This analysis may decrease the number of FN cases.
Woodhams et al(16) reported
that the accuracy for depicting residual tumors following NAC by
DW-MRI is similar to that depicted by contrast material-enhanced
MRI. In this study, DW images were referred for the evaluation of
tumor response to NAC, however, the final diagnosis of cCR was
based on the status of gadolinium enhancement.
In conclusion, the accuracy, PPV and NPV of MRI for
predicting pCR following NAC were >70%. These rates differed
between molecular subtypes of breast cancer and MRI was useful in
predicting pCR, particularly in triple-negative tumors.
Abbreviations:
|
BMI
|
body mass index;
|
|
cCR
|
clinical complete response;
|
|
DCIS
|
ductal carcinoma in situ;
|
|
DW
|
diffusion-weighted;
|
|
ER
|
estrogen receptor;
|
|
FISH
|
fluorescence in situ
hybridization;
|
|
FN
|
false-negative;
|
|
FP
|
false-positive;
|
|
HER2
|
human epidermal growth factor receptor
2;
|
|
IDC
|
invasive ductal carcinoma;
|
|
JBCS
|
Japanese Breast Cancer Society;
|
|
MRI
|
magnetic resonance imaging;
|
|
NAC
|
neoadjuvant chemotherapy;
|
|
NOS
|
not otherwise specified;
|
|
NPV
|
negative predictive value;
|
|
pCR
|
pathological complete response;
|
|
PgR
|
progesterone receptor;
|
|
PPV
|
positive predictive value;
|
|
TN
|
true-negative;
|
|
TP
|
true-positive
|
Acknowledgements
The authors thank Mr. Tomohiro
Matsumoto for preparation of MRI images and technical management of
MRI devices and Drs Kimito Suemasu, Jun Ninomiya, Yoshio Horii,
Mari Kamimura, Miho Yoshida, Yasutaka Hagiwara, Katsunori Tozuka,
Yuko Ishikawa and Toru Higuchi for performing surgical
therapies.
References
|
1
|
Fisher B, Bryant J, Wolmark N, et al:
Effect of preoperative chemotherapy on the outcome of women with
operable breast cancer. J Clin Oncol. 16:2672–2685. 1998.PubMed/NCBI
|
|
2
|
Rastogi P, anderson SJ, Bear HD, et al:
Preoperative chemotherapy: updates of National Surgical Adjuvant
Breast and Bowel Project Protocols B-18 and B-27. J Clin Oncol.
26:778–785. 2008. View Article : Google Scholar : PubMed/NCBI
|
|
3
|
Symmans WF, Peintinger F, Hatzis C, et al:
Measurement of residual breast cancer burden to predict survival
after neoadjuvant chemotherapy. J Clin Oncol. 25:4414–4422. 2007.
View Article : Google Scholar : PubMed/NCBI
|
|
4
|
Smith IC, Heys SD, Hutcheon AW, et al:
Neoadjuvant chemotherapy in breast cancer: significantly enhanced
response with docetaxel. J Clin Oncol. 20:1456–1466. 2002.
View Article : Google Scholar : PubMed/NCBI
|
|
5
|
Buzdar AU, Valero V, Ibrahim NK, et al:
Neoadjuvant therapy with paclitaxel followed by 5-fluorouracil,
epirubicin and cyclophosphamide chemotherapy and concurrent
trastuzumab in human epidermal growth factor receptor 2-positive
operable breast cancer: an update of the initial randomized study
population and data of additional patients treated with the same
regimen. Clin Cancer Res. 13:228–233. 2007.
|
|
6
|
Nakamura S: Present role and future
perspectives of the evaluation of the effect of primary
chemotherapy by breast imaging. Breast Cancer. 11:134–138. 2004.
View Article : Google Scholar : PubMed/NCBI
|
|
7
|
Hylton N: MR imaging for assessment of
breast cancer response to neoadjuvant chemotherapy. Magn Reson
Imaging Clin N Am. 14:383–389. 2006. View Article : Google Scholar : PubMed/NCBI
|
|
8
|
von Minckwitz G, Untch M, Blohmer J-U, et
al: Definition and impact of pathologic complete response on
prognosis after neoadjuvant chemotherapy in various intrinsic
breast cancer subtypes. J Clin Oncol. 30:1796–1804. 2012.PubMed/NCBI
|
|
9
|
Kurosumi M, Akashi-Tanaka S, Akiyama F, et
al: Histopathological criteria for assessment of therapeutic
response in breast cancer (2007 version). Breast Cancer. 15:5–7.
2008. View Article : Google Scholar : PubMed/NCBI
|
|
10
|
Edge SB and Compton CC: The American Joint
Committee on Cancer: the 7th edition of the AJCC cancer staging
manual and the future of TNM. Ann Surg Oncol. 17:1471–1474. 2010.
View Article : Google Scholar : PubMed/NCBI
|
|
11
|
Chen JH, Fieg B, Agrawal G, et al: MRI
evaluation of pathologically complete response and residual tumors
in breast cancer after neoadjuvant chemotherapy. Cancer. 112:17–26.
2008. View Article : Google Scholar : PubMed/NCBI
|
|
12
|
Chen JH, Bahri S, Mehta RS, et al: Breast
cancer: evaluation of response to neoadjuvant chemotherapy with
3.0-T MR imaging. Radiology. 261:735–743. 2001. View Article : Google Scholar
|
|
13
|
Kuzucan A, Chen JH, Bahri S, et al:
Diagnostic performance of magnetic resonance imaging for assessing
tumor response in patients with HER2-negative breast cancer
receiving neoadjuvant chemotherapy is associated with molecular
biomarker profile. Clin Breast Cancer. 12:110–118. 2012. View Article : Google Scholar
|
|
14
|
McGuire KP, Toro-Burguete J, Dang H, et
al: MRI staging after neoadjuvant chemotherapy for breast cancer:
does tumor biology affect accuracy? Ann Surg Oncol. 18:3149–3154.
2011. View Article : Google Scholar : PubMed/NCBI
|
|
15
|
De Los Santos J, Bernreuter W, Keene K, et
al: Accuracy of breast magnetic resonance imaging in predicting
pathologic response in patients treated with neoadjuvant
chemotherapy. Clin Breast Cancer. 11:312–319. 2011.PubMed/NCBI
|
|
16
|
Woodhams R, Kakita S, Hata H, et al:
Identification of residual breast carcinoma following neoadjuvant
chemotherapy: diffusion-weighted imaging-comparison with
contrast-enhanced MR imaging and pathological findings. Radiology.
254:357–366. 2010. View Article : Google Scholar
|