Introduction
Anticancer chemotherapy (CT) functions by producing
metabolic alterations, changing the structure and function of DNA,
affecting mitotic microtubules or triggering apoptotic pathways in
the target cells. As well as beneficial effects in cancer cells, CT
results in non-desirable cytotoxic effects in normal healthy
tissues. Bone marrow is most susceptible to the non-specific
effects of CT; damage may result in short-term toxicity, such as
myelosuppression and anaemia, or in long-term problems such as
myelodysplastic syndromes or secondary leukaemia forms.
To investigate the changes in gene expression and
the possible pathways involved in CT-induced cytotoxicity in normal
blood cells, we studied peripheral blood leukocytes (PBLs) prior to
and following three cycles of CT.
Most cytotoxic anticancer drugs target DNA directly
through reactive metabolites or indirectly through incorporation
into DNA (nucleotide analogues) or the blockade of DNA-metabolising
enzymes, including polymerases and topoisomerases (1,2). This
DNA damage triggers signalling pathways that ultimately lead to
cell death (1,2).
Paclitaxel is a tubulin-binding agent that
stabilises microtubules (α-β-tubulin heterodimers) in the
microtubule-GDP complex, thereby inhibiting the dynamic role of the
complex and consequently arresting mitosis (1,2).
Platinum chemotherapeutic agents, including carboplatin, halt the
cell cycle by forming stable complexes with DNA. The efficacy of
chemotherapeutic agents in most types of cancer is limited by the
development of resistance. Resistance to paclitaxel suggests the
aberrant expression of β-tubulin isotypes, usually βIII-tubulin, or
microtubule-regulating proteins (3). Resistance to platinum is commonly
developed by the DNA nucleotide excision repair pathways as repair
or mismatch repair, such as excision repair cross-complementation
group 1 enzyme (ERCC1) (4).
Doxorubicin interacts with DNA by intercalating
between two base pairs, blocking the progression of topoisomerase
II and thereby preventing the process of replication (2). Resistance to doxorubicin is
multifactorial, including increased levels of factors involved in
reducing the intracellular drug concentration by increasing drug
extrusion through membrane-associated pumps, the altered expression
of topoisomerase II, increased ability of the cell to repair DNA
damage and changes in gene expression that reduce the apoptotic
response (5,6).
Cyclophosphamide mainly acts through its metabolite,
phosphoramide mustard, which is an irreversible interstrand DNA
crosslinker that causes cell death. Cytochrome P450 (CYP),
glutathione S-transferase (GST) and ALDH protect the cells in
tissues with rapid cell turnover against the toxic effects of
phosphoramide mustard (7) by
converting aldophosphamide to molecules that do not produce the
toxic metabolites.
The aim of this study was to identify a group of
genes in PBLs whose expression is modified by CT.
Materials and methods
Patients
This study was approved by the Ethics Committee of
La Laguna University and HUNSC and all the subjects signed informed
consent documents prior to entering the study. The study subjects
were Caucasian, of European origin and recruited from the reference
medical area of the hospital. The patients in this study were
administered CT only (not radiotherapy or any other adjuvant
therapy), and this was their first CT. Two groups were analysed:
patients undergoing carboplatin-paclitaxel (PC) treatment and, as a
reference, patients treated with doxorubicin
(Adriamycin)-cyclophosphamide (AC).
Leukocyte isolation
PBLs were obtained immediately prior to patients
undergoing the first cycle and following the third cycle (at the
time the 4th cycle was administered). A volume of 1X PBS (1.9 mM
NaH2PO4, 8.1 mM
Na2HPO4, 154 mM NaCl) was added to an
identical volume of freshly collected blood and mixed gently. The
mix was placed over 5 ml Ficoll-Hypaque (d=1.077 g/ml) (Sigma, St.
Louis, MO, USA) and centrifuged for 30 min at 600 × g. The
intermediate layer (mononuclear white cells) was aspirated and
washed three times in three volumes of HBSS (5.4 mM KCl, 0.3 mM
Na2HPO4, 0.4 mM KH2PO4,
4.2 mM NaHCO3, 1.3 mM CaCl2, 0.5 mM
MgCl2, 0.6 mM MgSO4, 137 mM NaCl, 5.6 mM
D-glucose, 0.02% phenol red) and centrifuged at 300 × g for 10 min.
The pellet containing the cells was resuspended in 1 ml of PBS. The
trypan blue test and cell counting in a Neubauer chamber were
performed. The amount of collected cells ranged from 3 to
4×10⁶ cells.
PBL mRNA extraction, double stranded (ds)
cDNA synthesis and PCR amplification
The collected PBLs from 5 ml of blood were spun at
300 × g for 5 min and mRNA was obtained from the cell pellet using
the Total SV RNA Isolation system (Promega Corporation, Madison,
WI, USA), according to the manufacturer’s instructions. cDNA was
synthesised using the iScript cDNA Synthesis kit (Bio-Rad,
Mannheim, Germany) for the real-time quantitative RT-PCR (qRT-PCR)
assay and the Super SMART PCR cDNA Synthesis kit (Clontech
Laboratories, Mountain View, CA, USA) for the subtraction library
according to the manufacturer’s instructions.
ds-cDNA subtraction and library
construction
The subtraction library was constructed using the
PCR Select cDNA Subtraction kit (Clontech Laboratories) according
to the manufacturer’s instructions, with ds-cDNA pools obtained
from the white cells of the four patients immediately prior to
undergoing the first cycle and at the time the 4th cycle of PC was
administered, using equal amounts of cDNA from each patient. The
pool of differentially expressed cDNA was cloned into the
pBSK+ vector in competent E. coli, XL-2-Blue
cells.
Dot-blot screening
Probes were used to subtract the cDNA from the PBLs
obtained pre- and post-treatment and were digoxigenin-dUTP labeled
using the DIG DNA labeling kit (Roche Diagnostics, Mannheim,
Germany). Colonies from the library were seeded in plates
containing LB-ampicillin (0.1 mg/ml), X-Gal (40 μg/ml) and IPTG
(0.2 mM) solid medium and incubated at 37°C overnight. The colonies
were selected and placed into 96-well plates in liquid
LB-ampicillin (0.1 mg/m) medium and incubated at 37°C overnight. A
volume of 1 μl from each cultured well was placed in duplicate onto
two nylon membranes (Roche Diagnostics) and incubated at 37°C
overnight over LB-ampicillin (0.1 mg/ml) solid medium plates.
Duplicate membranes were probed with both probes (8) and positive clones were re-checked by
double-dot-blotting of the PCR amplified product using T3 and T7
flanking sequence primers (8).
DNA sequencing and sequence
identification
DNA sequencing was performed at La Laguna University
Sequencing Facility. DNA for sequencing was prepared using the
Qiaprep kit (Qiagen, Hilden, Germany) according to the
manufacturer’s instructions. Sequence alignments of the sequences
with those in the GenBank, EMBL, DDBJ and PDB databases were
performed using the BLASTN and BLASTX algorithms (9).
qRT-PCR
mRNA was extracted from the PBLs to perform qRT-PCR
for the selected genes (Table I)
and the corresponding cDNAs were synthesised as described above.
PCR assays were carried out using the Bio-Rad CFX96 Real-Time PCR
system (Hercules, CA, USA). The specific primers for each gene are
shown in Table I. PCR was performed
using the SYBR-Green Supermix (Bio-Rad). The amplification
reactions were performed in a 10-μl final volume containing 2X
SYBR-Green Supermix and 10 μM of each primer. Each sample was
analysed in triplicate and multiple water blanks were included.
β-actin was amplified as a reference for mRNA quantification. The
relative gene expression was presented as arbitrary units of the
ratio of Ctgene/Ctβ-actin.
 | Table IPrimers and annealing temperatures
used for qRT-PCR of selected genes. |
Table I
Primers and annealing temperatures
used for qRT-PCR of selected genes.
| Gene | Primer | Sequence (5′→3′) | Tm (°C) |
|---|
| ATM | ATM-F |
AACGAGCCGATCCACAACC | 63.4 |
| ATM-R |
CTCATGTAGTCCACAACAGCAAGC | 63.3 |
| eIF4B | eIF4B-F |
GGCAAAAAGGATCAAGACTCC | 60.1 |
| eIF4B-R |
CCATCAACAGAGAGAGCAGC | 58.7 |
| MATR3 | MATR3-F |
CCTAGTCTCAACCCAGTGC | 55.7 |
| MATR3-R |
CATCCCTACACCTTTCTCC | 54.5 |
| MORC3 | MORC3-F |
TCCACCTCAGTCTGAACC | 54.1 |
| MORC3-R |
TCAAACTGACTACTCAATCTCC | 53.7 |
| PCMTD2 | PCMTD2-F |
ATGCAAAGCAGAAACTGG | 54.8 |
| PCMTD2-R |
CGATCATACTGAGAACAATCC | 54.7 |
| PDCD10 | PDCD10-F |
CGATCATACTGAGAACAATCC | 50.2 |
| PDCD10-R |
ATACGAAGAAGGGACTCC | 51.4 |
| PSMB1 | PSMB1-F |
AGACTTGGGGATGGAACC | 57.2 |
| PSMB1-R |
TCACTCAATCGAGTATCAGAAGC | 58.6 |
| RMND5A | RMND5A-F |
AGACCCAAGTCAGAAGGAACC | 59.6 |
| RMND5A-R |
GGAGCTGTTTTGAGCTATAAGC | 57.5 |
| RUNX2 | RUNX2-F |
GCCTCTGCTGTTATGAAAAACC | 60.1 |
| RUNX2-R |
ATGGTCAAGGTGAAACTCTTGC | 60.5 |
| SACM1L | SACM1L-F |
GATTTGACCCATACTTTGC | 53 |
| SACM1L-R |
TGACCATTCCATACAAACC | 54 |
| TMEM66 | TMEM66-F |
TATCCTCCATTTTCCCACC | 57.2 |
| TMEM66-R |
CAAAACCAGAAGTTGCACC | 56.7 |
| ZNF644 | ZNF644-F |
GGACTTGACTATGCACTCAGC | 57.6 |
| ZNF644-R |
TGTAAACCTCGTCAGCACC | 57.2 |
| β-actin | ACT-F |
CTTCCTTCCTGGGCATGG | 61.6 |
| ACT-R |
GCCGCCAGACAGCACTGT | 63.7 |
Statistical analysis
Statistical analysis was performed using the SPSS
software and Pearson’s correlation coefficient. P<0.01 was
considered statistically significant. The Kolmogorov-Smirnov
analysis of these data showed that the expression values of these
genes did not have a normal Gaussian distribution. Thus, in order
to use the Pearson’s correlation coefficient, we obtained the
decimal logarithm of each expression value. A Kolmogorov-Smirnov
test of the logarithm values showed a normal distribution.
Results
Construction and screening of the
subtracted cDNA library
We constructed a cDNA subtraction library from the
PBLs obtained from patients immediately prior to undergoing the
first cycle of CT and at the time the 4th cycle was administered
(after completing 3 cycles). Screening of 1,200 colonies yielded a
total of 65 positive clones of variable expression intensity. The
sequencing and identification of the clones following CT treatment
revealed that 27 were mitochondrial DNA and 38 (38 clones but 27
different genes) were coded for cytosolic and nuclear proteins
(Tables II and III).
| Table IIIdentified genes coding for cytosolic
and nuclear proteins whose expression levels varied following
treatment with paclitaxel and carboplatin chemotherapy.a |
Table II
Identified genes coding for cytosolic
and nuclear proteins whose expression levels varied following
treatment with paclitaxel and carboplatin chemotherapy.a
| Identified
gene | Clones | Diff signal
int |
|---|
| Transcription and
translation factors |
| eIF4B | 1 | Medium |
| H2AFZ | 1 | Low |
| RUNX2 | 1 | High |
| ZNF644 | 1 | Medium |
| DNA repair |
| ATM | 2 | Medium |
| Signal
transduction |
| MORC3 | 7 | High |
| PDCD10 | 1 | High |
| Protein
remodelling |
| PCMTD2 | 1 | Low |
| PSMB1 | 3 | High |
| Cellular
multidynamic systems |
| ADD3 | 1 | Low |
| MATR3 | 1 | Low |
| RMND5A | 1 | Medium |
| SACM1L | 1 | Low |
| Metabolic
pathways |
| COQ3 | 1 | High |
| CSNK1A1 | 1 | High |
| FAR1 | 1 | Low |
| FTL | 1 | High |
| GMDS | 1 | Medium |
| SORL1 | 1 | Medium |
| Unknown |
| ANKRD10 | 1 | Medium |
| Chromosome 8 clone
RP11-320N21 | 1 | High |
| Chromosome 1 clone
RP11-545E24 | 2 | Low |
| Chromosome 5 clone
RP11-1C1 | 2 | Low |
| Clone DNA16445
SELT (UNQ150) | 1 | High |
| F8A1 | 1 | Medium |
| TMEM66 | 1 | Low |
| TMEM209 | 1 | Low |
| Table IIIIdentified leukocyte mitochondrial
genes whose expression levels varied following paclitaxel and
carboplatin chemotherapy. |
Table III
Identified leukocyte mitochondrial
genes whose expression levels varied following paclitaxel and
carboplatin chemotherapy.
| Identified
gene | Clones | Diff signal
int |
|---|
| 16S ribosomal RNA
gene | 3 | High |
| Isolate TV15
mitochondrion | 1 | Medium |
| Haplogroup J1b2
mitochondrion | 4 | Medium |
| Haplogroup U5b1
mitochondrion | 2 | High |
| Haplogroup U5b2
mitochondrion | 1 | High |
| Haplogroup K2a
mitochondrion | 2 | Medium |
| ATP synthase,
H+ transporting, mitochondrial F1 complex, O
subunit | 1 | Medium |
| Haplogroup H6*
mitochondrion | 2 | High |
| Isolate L332
mitochondrion | 1 | High |
| Haplogroup H2a1
mitochondrion | 1 | High |
| Isolate MTDNA381
mitochondrion | 1 | High |
| Isolate ST024
mitochondrion | 1 | Medium |
| Haplotype U4a
mitochondrion | 1 | High |
| Isolate Koryak 28
mitochondrion | 1 | High |
| Isolate MTDNA538
mitochondrion | 1 | Medium |
| Haplotype H5
mitochondrion | 3 | High |
| Isolate Tub28
mitochondrion | 1 | Medium |
We classified the identified genes into seven groups
according to the function of the protein they encode: protein
synthesis activators (either at the transcriptional or
translational level), DNA repair mechanisms, signal transduction
pathways (apoptosis-survival), protein repair enzymes, cellular
multidynamic systems, integral parts of metabolic pathways and
unknown function (Table II).
Genes and proteins analysed in cancer
patients undergoing CT
Certain genes were selected for the specific study
of variations in their expression levels in two series of patients
undergoing CT (Table II). The
selected genes were ATM (ataxia-telangiectasia mutated gene), eIF4B
(translation initiation factor 4B), MATR3 (Matrin 3), MORC3
(microrchidia 3), PCMTD2 (protein-L-isoaspartate
O-methyltransferase), PDCD10 (programmed cell death gene 10), PSMB1
(proteasome subunit type β), RMND5A (required for meiotic nuclear
division 5 homologue A), RUNX2 (runt-related transcription factor
2), SACM1L (suppressor of actin mutations 1-like), TMEM66
(transmembrane protein 66) and ZNF644 (zinc finger protein 644). To
assess the specificity of carboplatin and paclitaxel on the
regulatory response, a group of patients undergoing treatment with
doxorubicin (Adriamycin) and cyclophosphamide was analysed
concomitantly. Quantitation of the gene expression was carried out
using qRT-PCR relative to actin.
Analysis of variation in the expression
of selected genes induced by CT
The relative gene expression prior to and following
CT with PC (Table IVA) or AC
(Table IVB) was evaluated. In
almost all of the genes studied there was a significant variation
of expression, with up- and downregulation in patients treated with
PC and AC. Only a few cases (one or two per group) of certain genes
(Tables IVA and B) did not show
significant variation in their expression levels. Column ‘N’ in
Tables IVA and B indicates the
number of cases in which the expression of each gene was increased
or decreased significantly and the column ‘Ratio’ shows the mean of
the increased or decreased ratio between the relative gene
expression prior to and following CT (Pre-/Post-CT) for each
patient. Genes with the greatest increases in expression induced by
PC were RMND5A (7-fold), PDCD10 (3.9-fold) and MATR3 (4.5-fold).
The increases in gene expression induced by AC therapy ranged
between 1.4- and 2.1-fold. Decrease of the expression of the
studied genes was shown in fewer cases at levels that range about a
half of the previous expression to CT.
| Table IVMean and typical error of relative
gene expression, prior to and following chemotherapy. |
Table IV
Mean and typical error of relative
gene expression, prior to and following chemotherapy.
| A, Relative gene
expression prior to and following chemotherapy with paclitaxel and
carboplatin |
|---|
|
|---|
| Gene | Expression | N | Pre-CT | Post-CT | Ratio |
|---|
| ATM | Increase | 6 | 866±371 | 2301±1000 | 2.8±0.20 |
| Decrease | 2 | 2479±839 | 1316±303 | 0.6±0.05 |
| No change | 0 | | | |
| eIF4B | Increase | 3 | 11730±3958 | 20092±6688 | 1.8±0.18 |
| Decrease | 5 | 14588±6386 | 5358±1578 | 0.6±0.08 |
| No change | 0 | | | |
| MATR3 | Increase | 2 | 1041±188 | 4358±1108 | 4.5±1.90 |
| Decrease | 5 | 8357±2090 | 3673±1848 | 0.5±0.10 |
| No change | 1 | 881 | 882 | |
| MORC3 | Increase | 4 | 166±22 | 1733±1354 | 2.1±0.80 |
| Decrease | 2 | 1502±458 | 835±330 | 0.5±0.05 |
| No change | 2 | 2235±1319 | 2485±1513 | |
| PCMTD2 | Increase | 5 | 656±226 | 2276±1006 | 2.7±0.98 |
| Decrease | 1 | 891 | 700 | 0.8 |
| No change | 2 | 819±519 | 884±594 | |
| PDCD10 | Increase | 6 | 924±313 | 10828±6560 | 3.9±0.71 |
| Decrease | 2 | 7067±2439 | 4756±3138 | 0.6±0.25 |
| No change | 0 | | | |
| PSMB1 | Increase | 6 | 788±378 | 3137±1178 | 3.3±0.64 |
| Decrease | 0 | | | |
| No change | 2 | 3898±2078 | 4172±2566 | |
| RMND5A | Increase | 5 | 816±294 | 13569±8201 | 7±3.07 |
| Decrease | 2 | 6091±1403 | 3172±560 | 0.5±0.05 |
| No change | 1 | 1756 | 1495 | |
| RUNX2 | Increase | 4 | 399±187 | 1081±447 | 2.1±0.24 |
| Decrease | 2 | 3277±108 | 1236±413 | 0.4±0.10 |
| No change | 2 | 584±479 | 498±408 | |
| SACM1L | Increase | 5 | 352±157 | 742±284 | 1.7±0.19 |
| Decrease | 3 | 6006±2751 | 1524±481 | 0.4±0.11 |
| No change | 0 | | | |
| TMEM66 | Increase | 3 | 2900±1496 | 16501±5145 | 3±0.25 |
| Decrease | 3 | 26174±7780 | 12398±4596 | 0.5±0.17 |
| No change | 2 | 3626±1691 | 3905±1900 | |
| ZNF644 | Increase | 4 | 221±106 | 1040±377 | 2.9±0.29 |
| Decrease | 4 | 2026±1062 | 1012±467 | 0.6±0.08 |
| No change | 0 | | | |
|
| B, Relative gene
expression prior to and following chemotherapy with Adriamycin and
cyclophosphamide |
|
| Gene | Expression | N | Pre-CT | Post-CT | Ratio |
|
| ATM | Increase | 4 | 1589±453 | 2385±697 | 1.5±0.11 |
| Decrease | 4 | 2655±460 | 1235±139 | 0.5±0.08 |
| No change | 2 | 2554±951 | 2349±853 | |
| eIF4B | Increase | 4 | 7622±1114 | 16094±4490 | 2±0.39 |
| Decrease | 5 | 11250±1730 | 7462±1817 | 0.6±0.09 |
| No change | 1 | 9430 | 8304 | |
| MATR3 | Increase | 4 | 2766±590 | 4154±1027 | 1.5±0.07 |
| Decrease | 5 | 3789±405 | 2154±347 | 0.6±0.07 |
| No change | 1 | 1357 | 1276 | |
| MORC3 | Increase | 3 | 842±72 | 1302±127 | 1.6±0.12 |
| Decrease | 5 | 1135±70 | 786±112 | 0.7±0.06 |
| No change | 2 | 1090±106 | 1066±59 | |
| PCMTD2 | Increase | 3 | 791±71 | 1247±318 | 1.5±0.27 |
| Decrease | 3 | 864±380 | 405±173 | 0.5±0.09 |
| No change | 4 | 993±256 | 976±250 | |
| PDCD10 | Increase | 7 | 4348±1448 | 10148±7747 | 2±0.46 |
| Decrease | 2 | 2908±111 | 1873±64 | 0.6±0.00 |
| No change | 1 | 2628 | 2967 | |
| PSMB1 | Increase | 6 | 5489±3056 | 15822±12499 | 1.7±0.41 |
| Decrease | 4 | 2966±481 | 1877±362 | 0.6±0.09 |
| No change | 0 | | | |
| RMND5A | Increase | 4 | 920±150 | 1741±288 | 1.9±0.14 |
| Decrease | 4 | 3032±1351 | 1518±446 | 0.6±0.12 |
| No change | 2 | 807±131 | 852±98 | |
| RUNX2 | Increase | 4 | 632±96 | 1241±187 | 2.1±0.33 |
| Decrease | 4 | 1441±306 | 755±177 | 0.5±0.05 |
| No change | 2 | 444±180 | 437±155 | |
| SACM1L | Increase | 3 | 953±99 | 1497±127 | 1.6±0.25 |
| Decrease | 6 | 1124±251 | 631±141 | 0.6±0.09 |
| No change | 1 | 584 | 584 | |
| TMEM66 | Increase | 2 | 6941±2765 | 9935±3096 | 1.5±0.15 |
| Decrease | 6 | 11805±1983 | 6396±775 | 0.6±0.04 |
| No change | 2 | 7143±2734 | 7808±3201 | |
| ZNF644 | Increase | 2 | 1072±239 | 2148±1179 | 1.9±0.65 |
| Decrease | 6 | 1016±244 | 484±62 | 0.5±0.07 |
| No change | 2 | 773±99 | 802±80 | |
Results of the analysis of correlation among the
genes with up- or downregulated expression are shown in Fig. 1.
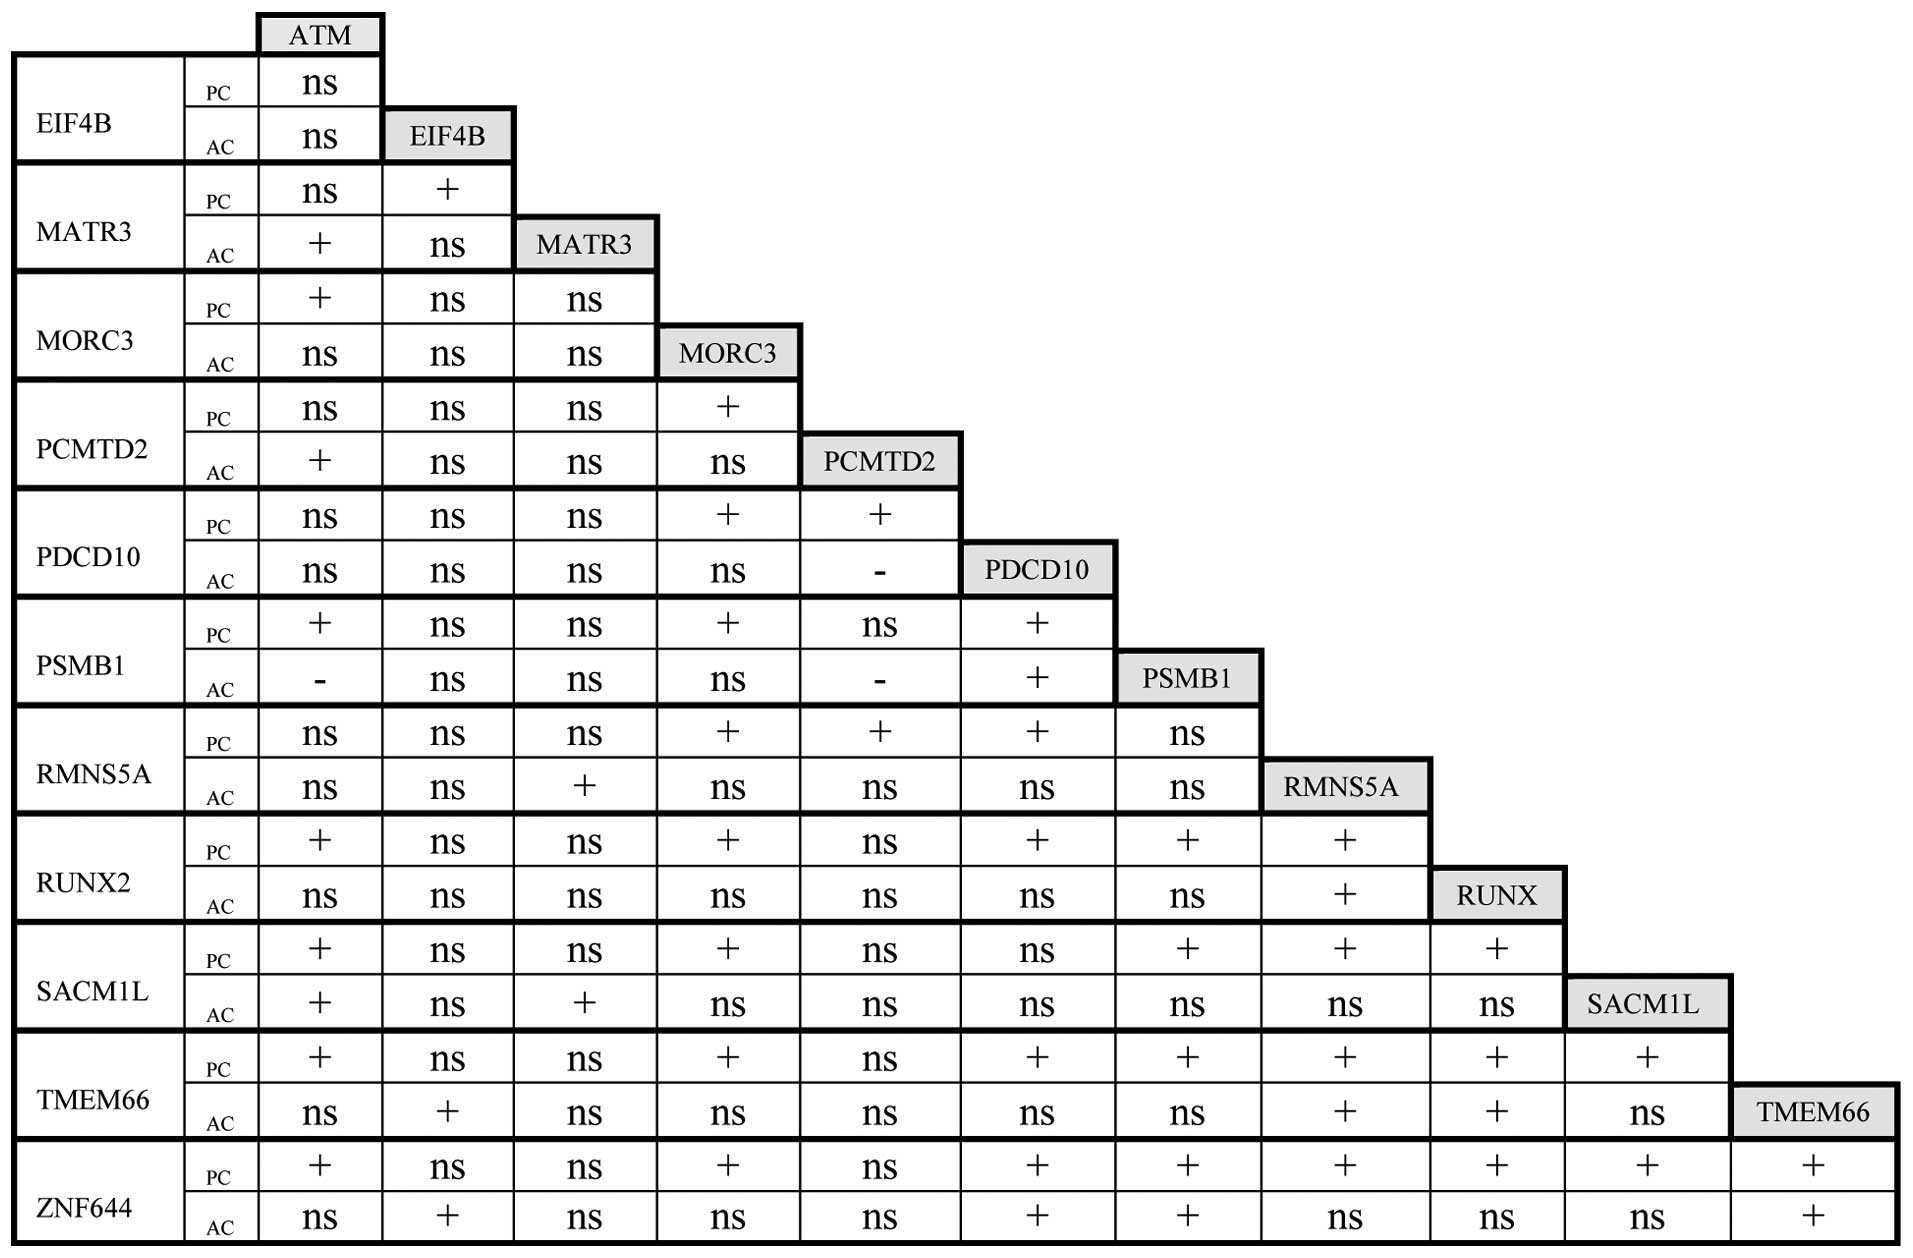 | Figure 1Correlations between the studied
genes. +, positive correlation, P<0.01; -, negative correlation,
P<0.01; ns, no significant correlation; PC, paclitaxel and
carboplatin; AC, Adriamycin and cyclophosphamide; ATM,
ataxia-telangiectasia mutated gene; eIF4B, translation initiation
factor 4B; MATR3, Matrin 3; MORC3, microrchidia 3; PCMTD2,
protein-L-isoaspartate O-methyltransferase; PDCD10, programmed cell
death gene 10; PSMB1, proteasome subunit type β; RMND5A, required
for meiotic nuclear division 5 homologue A; RUNX2, runt-related
transcription factor 2; SACM1L, suppressor of actin mutations
1-like; TMEM66, transmembrane protein 66; ZNF644, zinc finger
protein 644. |
Discussion
Areas of progress in the fields of cancer biology
and CT currently include strategies for identifying genes that are
differentially expressed in different situations, including normal
and cancer cells or, as in this study, prior to and following CT.
Several methods have been used for these analyses, including SAGE
(serial analysis of gene expression) (10), the differential display of mRNA by
PCR (11) and the generation and
screening of cDNA subtraction libraries (12). We selected the last method in order
to obtain cDNA clones that could be used to analyse or produce
recombinant proteins and subsequent antibodies for lesser known
genes and proteins. This study specifically concerns the
construction and screening of the library, the description of
differential genes and their analysis in two groups of patients
undergoing CT. Thus, in addition to patients receiving PC, we
extended our study to women suffering from breast cancer who were
undergoing doxorubicin (Adriamycin) and cyclophosphamide treatment
in the adjuvant setting in order to differentiate genes whose
expression varies as a general response to CT from those which are
more specifically correlated with PC treatment.
The ATM gene is distinctive as mutations in this
gene are associated with the ataxia telangiectasia disorder. ATM is
a central transducer of DNA damage signals and ensures the normal
repair of DNA ds breaks (13). ATM
belongs to the PI3/PI4-kinase family and is a cell cycle checkpoint
kinase that functions as a regulator of a wide variety of
downstream proteins, including the tumour suppressor proteins p53,
BRCA1, CHK2, RAD17 and RAD9 and the DNA repair protein NBS1. The
ATM and ATR proteins are closely related and control the cell cycle
checkpoint signalling pathways that are required for cellular
responses to DNA damage and for genome stability (14). We suggest that leukocytes upregulate
the ATM gene during CT in order to repair DNA that has been damaged
by drugs.
eIF4B stimulates the helicase activity of the DEAD
box protein translation initiation factor 4A (eIF4A) to unwind the
inhibitory secondary structure of the 5′ untranslated region of
eukaryotic mRNAs. Increasing the expression of the eIF4B gene might
be a general response to CT in order to accelerate the synthesis of
proteins involved in drug resistance or metabolic changes involved
in cell survival, but the helicase activity of eIF4B suggests that
its upregulation is more specifically correlated with carboplatin
treatment (15).
MATR3 is a nuclear matrix protein that has been
reported to interact with other nuclear proteins to anchor RNAs to
the nuclear matrix, modulate the activity of proximal promoters and
to be the main PKA substrate following the activation of the NMDA
receptor (16). Two transcript
variants encoding the same protein have been identified for this
gene. Matrin3 has been identified as a Ca2+-dependent
CaM-binding protein and a downstream substrate for caspases
(17). MATR3 acts as a co-factor of
the HIV-1 Rev protein during nuclear export and the translation of
unspliced and partially spliced viral mRNA (18).
MORC3, also termed KIAA0136, ZCWCC3 and NXP-2,
encodes a member of the MORC protein family, which is characterised
by conserved structures consisting of a GHL (Gyrase B, Hsp90 and
MutL)-ATPase domain, a zinc finger-type CW domain (four cysteines
and two tryptophans), a nuclear localisation signal (NLS) and
coiled-coil domains at the carboxy-terminus, as mentioned in
(19). MORC3 is ubiquitously
expressed in humans, localises to the nuclear matrix, has RNA
binding activity and regulates p53 activity and localisation to
promyelocytic leukaemia-nuclear bodies (PML-NBs) (19). The upregulation of MATR3 and MORC3
may indicate an attempt to drive an injured cell, through the
caspase and p53 pathways, to apoptosis.
PCMTD2 is also termed PIMT (protein-L-isoaspartate
O-methyltransferase). The formation of L-isoaspartyl (isoAsp)
peptide bonds is a major source of protein damage in vivo
and in vitro. PIMT is a protein repair enzyme that converts
L-isoaspartyl residues in damaged proteins to normal L-aspartyl
residues. In rat nucleosomes, the histone H2B was found to
accumulate isoAsp in the Asp25-Gly26 bond in the N-terminal tail.
In chicken nucleosomes, isoAsp accumulated mainly in histone H2A
and, to a lesser extent, in histone H2B (20–22).
PDCD10 is also known as cerebral cavernous
malformation-3 and CCM3. This gene encodes an evolutionarily
conserved protein which is associated with cell apoptosis and has
multiple alternatively spliced variants encoding the same protein
(23). The protein interacts with
the serine/threonine protein kinase MST4 to modulate the
extracellular signal-regulated kinase (ERK) pathway. The protein
also interacts with and is phosphorylated by serine/threonine
kinase 2 in a signalling pathway, which is critical for vascular
development (24). Gene chip data
have suggested that PDCD10 is involved in tumour signalling, as it
was shown to be upregulated in pancreatic adenocarcinoma (25), metastatic colon cancer cells
resistant to cisplatin-induced apoptosis and other cancer cell
lines (26). Thus, our data suggest
that the interaction pathway PDCD10-MST4-ERK-MAPK, one of the most
significant regulators of cell proliferation, is also affected by
the two CT therapies investigated in the present study.
The PSMB1 proteasome is a multicatalytic proteinase
complex with a highly ordered ring-shaped core structure. This gene
encodes a member of the proteasome B-type family, also known as the
T1B family, with a 20S core β subunit. The PSMB1 subunit is
critical for the degradation of several proteins, more specifically
those involved in cell proliferation and cancer (27).
RMND5A, also known as CTLH, RMD5, p44CTLH, FLJ12753,
FLJ13910, FLJ21795 and MGC78451, forms complexes in cells with
RanBPM, ARMC8α, ARMC8β, Muskelin and p48EMLP. RMND5A is a key
component of the CTLH complex (C-terminal to lissencephaly
type-1-like homology motif). This complex is involved in
microtubule dynamics, cell migration, nucleokinesis and chromosome
segregation (28). Therefore, the
variations in the expression of the RMND5A gene may be due to the
effects of paclitaxel.
RUNX2 is a member of the RUNX family of
transcription factors, which are essential for osteoblast growth
and differentiation and chondrocyte maturation. RUNX2 encodes a
nuclear protein with a Runt DNA-binding domain that controls the
expression of target genes involved in cell fate decisions
(29). Runx-2 isoforms are produced
by transcript variants caused by alternative promoters and
alternative splicing. In the osteosarcoma cell line Saos2, Runx2
has been shown to regulate apoptosis via modulation of the Bcl2
family of proteins (30).
The SACM1L gene encodes a phosphoinositide
phosphatase that is an integral membrane protein of the endoplasmic
reticulum (ER) and the Golgi apparatus representing a class of
phosphoinositide degradation enzymes (31,32).
The integral membrane Sac1 phosphatases are a major class of this
type of enzyme. Additionally, SAC1 accumulates in the Golgi complex
of quiescent cells and suppresses anterograde trafficking by
depleting Golgi PI(4)P (33).
For the purposes of our study, the reported case of
a mixed lineage leukaemia MLL-rearrangement with the suppressor of
actin mutations 1-like (MLL-SACM1L) rearrangement is significant.
This rearrangement was observed in bone marrow cells during CT for
acute lymphoblastic leukaemia with hyperdiploidy and was
continuously detected over seven years without exhibiting clonal
expansion (34).
TMEM66, also known as XTP3, FOAP-7, HSPC035, MGC8721
and FLJ22274, is regarded as a potential marker for prostate
cancer, included into a group of secreted proteins (35,36)
and counted among others in a screening for proapoptotic genes
(37). No specific function has yet
been attributed to the protein product of this gene.
ZNF644 (38) is a
large multizinc finger homologue of the KIAA1221 and WIZ proteins
(39). It has been reported that
these three proteins co-purified with CDYL, which is associated
with histone methylase G9a and mediates a REST tumour suppression
function. The specific function of ZNF644 is currently unknown.
All the studied genes in the patients from the PC
group showed a positive correlation with each other, with the
marked exception of eIF4B and MATR3. Most of these correlations
were not found in the AC patient group; furthermore, some of the
correlations were negative in this group. Notably, MORC3 and ZNF644
in the PC patients had a positive correlation with the rest of the
genes, whereas, in the AC patients, MORC3 did not show a
correlation with any gene and ZNF644 was correlated with only a few
genes.
A high correlation of the levels of expression of
most of the identified genes coding for cytosolic and nuclear
proteins were included in the cellular multidynamic system and
signal transduction groups (Table
II). The balance in the variation in their expression drives
the cell to life versus apoptosis as a response to cellular damage
induced by CT. This expression pattern corresponds to the pattern
for CT-surviving cells, assuming that cells that did not react by
modifying the expression of these genes, thereby inducing apoptosis
and cell death. This hypothesis is further supported by the
different expression patterns observed in the leukocytes obtained
from AC-treated patients. The few up- or downregulations the PC-
and AC-treated groups have in common are likely to be due to the
similar modes of action of carboplatin and Adriamycin and the
manner in which cells react to the two drugs.
A notable differential positive correlation between
the PC and AC groups is that of PCMTD2 with PDCD10 and the non-
significant PCMTD2 with PSMB1 in PC-treated patients. In the case
of AC-treated patients, the expression of the PCMTD2 gene showed a
negative correlation with the expression of PDCD10 and PSMB1. As
such, the expression of an apoptosis regulatory gene was correlated
with a protein repair gene and not a proteasome subunit gene in the
PC-treated group. However, the same apoptosis regulatory gene in
AC-treated patients was negatively correlated with the protein
repair gene and the proteasome subunit gene. This further supports
the theory that the increased expression of genes that are involved
in protein repair and damaged protein degradation following PC
treatment is indicative of an attempt to rescue the cells from the
effects of PC-induced cytotoxicity.
In the PC-treated patients, the amount of
circulating platelets and the expression levels of the ATM, MORC,
PSMB1, RUNX TMEM and ZNF genes showed a negative correlation
(P<0.05). No other correlation between groups of patients with
up- or downregulated genes and clinical parameters, including
anaemia, fever, secondary neuropathy or mucositis, has been
demonstrated for any of the studied parameters.
The results indicate a heterogeneous response of
white cells (Tables IVA and B)
resulting in different populations that have the up- or
downregulation of the expression of certain genes in common. The
contradictory responses of cells which contemporaneously increased
the expression of genes involved in the survival and apoptotic
responses may be due to the critical moment at which cells are
committed to evolving and surviving or being eliminated by
apoptosis.
This study was performed with a reduced sample of
patients, as a pilot study, to identify genes whose expression
levels are affected by CT. Now that the changes in gene expression
are known, further studies should be performed with a larger cohort
of patients and a longer follow-up period to ascertain whether
certain genes are associated with specific clinical or analytical
manifestations.
The patients treated with PC CT had stage III-IV
non-small cell lung cancer or gynaecological cancer. This group of
patients have a high incidence of chronic anaemia, reducing the
possibility of identifying the effects of the changes in gene
expression on the development of bone marrow toxicity.
Certain genes that showed altered patterns of
expression in the leukocytes may be involved in the generation of
the non-desirable effects of CT in normal blood cells. In the
short-term, it should be determined whether there is any
association between these changes and immune deficiency, which
leads to infectious complications in a reversible or permanent
manner. This is critical in establishing prognostic significance in
terms of immune surveillance and the recurrence rate.
If these variations in gene expression originate in
stem cells, they may be important for CT-associated anaemia or, in
the long-term, for myelodysplastic syndromes. If these CT-induced
alterations in gene expression also occur in tumour cells, we
should expect them to contribute, in heavily treated patients, to
an increased genomic instability and rapid disease progression.
More studies are necessary to determine whether these changes in
gene expression are correlated with the short- and/or long-term
toxicities of anticancer CT. Additionally, whether these changes
are random or directed in a specific selection-evolution manner
also needs to be elucidated.
Acknowledgements
This study was supported by grants from the Grupo
Hospiten, Tenerife, Spain to M.M.; FIS PS09/0128 to J.A. and FIS
PI11/00141, Spain, to P. M-V. The authors thank Dr Eduardo Salido,
Facultad de Medicina, Universidad de La Laguna, Spain and Dr Ali
Mobasheri, Nottingham University Vet School, UK, for their critical
reading and editorial help.
References
|
1
|
DeVita V; DePinho RA, Lawrence TS,
Rosenberg SA and Weinberg RA: DeVita, Hellman, and Rosenberg’s
Cancer: Principles and Practice of Oncology. 9th edition.
Lippincott Williams & Wilkins; Philadelphia: 2011
|
|
2
|
Perry MC: The Chemotherapy Source Book.
4th edition. Lippincott Williams & Wilkins; Philadelphia:
2008
|
|
3
|
Kavallaris M, Kuo DY, Burkhart CA, et al:
Taxol-resistant epithelial ovarian tumors are associated with
altered expression of specific beta-tubulin isotypes. J Clin
Invest. 100:1282–1293. 1997. View Article : Google Scholar : PubMed/NCBI
|
|
4
|
Steffensen KD, Waldstrom M and Jakobsen A:
The relationship of platinum resistance and ERCC1 protein
expression in epithelial ovarian cancer. Int J Gynecol Cancer.
19:820–825. 2009. View Article : Google Scholar : PubMed/NCBI
|
|
5
|
Smith L, Watson MB, O’Kane SL, Drew PJ,
Lind MJ and Cawkwell L: The analysis of doxorubicin resistance in
human breast cancer cells using antibody microarrays. Mol Cancer
Ther. 5:2115–2120. 2006. View Article : Google Scholar : PubMed/NCBI
|
|
6
|
Watts GS, Futscher BW, Isett R,
Gleason-Guzman M, Kunkel MW and Salmon SE: cDNA microarray analysis
of multidrug resistance: doxorubicin selection produces multiple
defects in apoptosis signaling pathways. J Pharmacol Exp Ther.
299:434–441. 2001.
|
|
7
|
Ekhart C, Doodeman VD, Rodenhuis S, Smits
PH, Beijnen JH and Huitema AD: Influence of polymorphisms of drug
metabolizing enzymes (CYP2B6, CYP2C9, CYP2C19, CYP3A4, CYP3A5,
GSTA1, GSTP1, ALDH1A1 and ALDH3A1) on the pharmacokinetics of
cyclophosphamide and 4-hydroxycyclophosphamide. Pharmacogenet
Genomics. 18:515–523. 2008. View Article : Google Scholar
|
|
8
|
Sambrook J, Fritsch EF and Maniatis T:
Molecular Cloning: A Laboratory Manual. 2nd edition. Cold Spring
Harbor Laboratory; 1989
|
|
9
|
Altschul SF, Madden TL, Schaffer AA, et
al: Gapped BLAST and PSI-BLAST: a new generation of protein
database search programs. Nucleic Acids Res. 25:3389–3402. 1997.
View Article : Google Scholar : PubMed/NCBI
|
|
10
|
Velculescu VE, Zhang L, Vogelstein B and
Kinzler KW: Serial analysis of gene expression. Science.
270:484–487. 1995. View Article : Google Scholar : PubMed/NCBI
|
|
11
|
Liang P and Pardee AB: Differential
display of mRNA by PCR. Curr Protoc Mol Biol. Chapter 25(Unit 25):
pp. B32001
|
|
12
|
Diatchenko L, Lau YF, Campbell AP, et al:
Suppression subtractive hybridization: a method for generating
differentially regulated or tissue-specific cDNA probes and
libraries. Proc Natl Acad Sci USA. 93:6025–6030. 1996. View Article : Google Scholar
|
|
13
|
Bensimon A, Aebersold R and Shiloh Y:
Beyond ATM: the protein kinase landscape of the DNA damage
response. FEBS Lett. 585:1625–1639. 2011. View Article : Google Scholar : PubMed/NCBI
|
|
14
|
Lavin MF: Ataxia-telangiectasia: from a
rare disorder to a paradigm for cell signalling and cancer. Nat Rev
Mol Cell Biol. 9:759–769. 2008. View
Article : Google Scholar : PubMed/NCBI
|
|
15
|
Parsyan A, Svitkin Y, Shahbazian D, et al:
mRNA helicases: the tacticians of translational control. Nat Rev
Mol Cell Biol. 12:235–245. 2011. View
Article : Google Scholar : PubMed/NCBI
|
|
16
|
Przygodzka P, Boncela J and Cierniewski
CS: Matrin 3 as a key regulator of endothelial cell survival. Exp
Cell Res. 317:802–811. 2011. View Article : Google Scholar : PubMed/NCBI
|
|
17
|
Valencia CA, Ju W and Liu R: Matrin 3 is a
Ca2+/calmodulin-binding protein cleaved by caspases.
Biochem Biophys Res Commun. 361:281–286. 2007.PubMed/NCBI
|
|
18
|
Kula A, Guerra J, Knezevich A, Kleva D,
Myers MP and Marcello A: Characterization of the HIV-1 RNA
associated proteome identifies Matrin 3 as a nuclear cofactor of
Rev function. Retrovirology. 8:602011. View Article : Google Scholar : PubMed/NCBI
|
|
19
|
Takahashi K, Yoshida N, Murakami N, et al:
Dynamic regulation of p53 subnuclear localization and senescence by
MORC3. Mol Biol Cell. 18:1701–1709. 2007. View Article : Google Scholar : PubMed/NCBI
|
|
20
|
Shimizu T, Matsuoka Y and Shirasawa T:
Biological significance of isoaspartate and its repair system. Biol
Pharm Bull. 28:1590–1596. 2005. View Article : Google Scholar : PubMed/NCBI
|
|
21
|
Young GW, Hoofring SA, Mamula MJ, et al:
Protein L-isoaspartyl methyltransferase catalyzes in vivo
racemization of Aspartate-25 in mammalian histone H2B. J Biol Chem.
280:26094–26098. 2005. View Article : Google Scholar : PubMed/NCBI
|
|
22
|
Carter WG and Aswad DW: Formation,
localization, and repair of L-isoaspartyl sites in histones H2A and
H2B in nucleosomes from rat liver and chicken erythrocytes.
Biochemistry. 47:10757–10764. 2008. View Article : Google Scholar : PubMed/NCBI
|
|
23
|
Lauenborg B, Kopp K, Krejsgaard T, et al:
Programmed cell death-10 enhances proliferation and protects
malignant T cells from apoptosis. APMIS. 118:719–728. 2010.
View Article : Google Scholar : PubMed/NCBI
|
|
24
|
Ma X, Zhao H, Shan J, et al: PDCD10
interacts with Ste20-related kinase MST4 to promote cell growth and
transformation via modulation of the ERK pathway. Mol Biol Cell.
18:1965–1978. 2007. View Article : Google Scholar : PubMed/NCBI
|
|
25
|
Aguirre AJ, Brennan C, Bailey G, et al:
High-resolution characterization of the pancreatic adenocarcinoma
genome. Proc Natl Acad Sci USA. 101:9067–9072. 2004. View Article : Google Scholar : PubMed/NCBI
|
|
26
|
Huerta S, Harris DM, Jazirehi A, et al:
Gene expression profile of metastatic colon cancer cells resistant
to cisplatin-induced apoptosis. Int J Oncol. 22:663–670.
2003.PubMed/NCBI
|
|
27
|
Keutgens A, Zhang X, Shostak K, et al:
BCL-3 degradation involves its polyubiquitination through a
FBW7-independent pathway and its binding to the proteasome subunit
PSMB1. J Biol Chem. 285:25831–25840. 2010. View Article : Google Scholar : PubMed/NCBI
|
|
28
|
Kobayashi N, Yang J, Ueda A, et al:
RanBPM, Muskelin, p48EMLP, p44CTLH, and the armadillo-repeat
proteins ARMC8alpha and ARMC8beta are components of the CTLH
complex. Gene. 396:236–247. 2007. View Article : Google Scholar : PubMed/NCBI
|
|
29
|
Pratap J, Lian JB, Javed A, et al:
Regulatory roles of Runx2 in metastatic tumor and cancer cell
interactions with bone. Cancer Metastasis Rev. 25:589–600. 2006.
View Article : Google Scholar : PubMed/NCBI
|
|
30
|
Eliseev RA, Dong YF, Sampson E, et al:
Runx2-mediated activation of the Bax gene increases osteosarcoma
cell sensitivity to apoptosis. Oncogene. 27:3605–3614. 2008.
View Article : Google Scholar : PubMed/NCBI
|
|
31
|
Rohde HM, Cheong FY, Konrad G, Paiha K,
Mayinger P and Boehmelt G: The human phosphatidylinositol
phosphatase SAC1 interacts with the coatomer I complex. J Biol
Chem. 278:52689–52699. 2003. View Article : Google Scholar : PubMed/NCBI
|
|
32
|
Liu Y, Boukhelifa M, Tribble E, et al: The
Sac1 phosphoinositide phosphatase regulates Golgi membrane
morphology and mitotic spindle organization in mammals. Mol Biol
Cell. 19:3080–3096. 2008. View Article : Google Scholar : PubMed/NCBI
|
|
33
|
Blagoveshchenskaya A, Cheong FY, Rohde HM,
et al: Integration of Golgi trafficking and growth factor signaling
by the lipid phosphatase SAC1. J Cell Biol. 180:803–812. 2008.
View Article : Google Scholar : PubMed/NCBI
|
|
34
|
Mori T, Nishimura N, Hasegawa D, et al:
Persistent detection of a novel MLL-SACM1L rearrangement in the
absence of leukemia. Leuk Res. 34:1398–1401. 2010. View Article : Google Scholar : PubMed/NCBI
|
|
35
|
Romanuik TL, Ueda T, Le N, et al: Novel
biomarkers for prostate cancer including noncoding transcripts. Am
J Pathol. 175:2264–2276. 2009. View Article : Google Scholar : PubMed/NCBI
|
|
36
|
Romanuik TL, Wang G, Holt RA, Jones SJ,
Marra MA and Sadar MD: Identification of novel androgen-responsive
genes by sequencing of LongSAGE libraries. BMC Genomics.
10:4762009. View Article : Google Scholar : PubMed/NCBI
|
|
37
|
Mannherz O, Mertens D, Hahn M and Lichter
P: Functional screening for proapoptotic genes by reverse
transfection cell array technology. Genomics. 87:665–672. 2006.
View Article : Google Scholar : PubMed/NCBI
|
|
38
|
Mulligan P, Westbrook TF, Ottinger M, et
al: CDYL bridges REST and histone methyltransferases for gene
repression and supp-ression of cellular transformation. Mol Cell.
32:718–726. 2008. View Article : Google Scholar : PubMed/NCBI
|
|
39
|
Matsumoto K, Ishii N, Yoshida S, Shiosaka
S, Wanaka A and Tohyama M: Molecular cloning and distinct
developmental expression pattern of spliced forms of a novel zinc
finger gene wiz in the mouse cerebellum. Brain Res Mol Brain Res.
61:179–189. 1998. View Article : Google Scholar : PubMed/NCBI
|


