Introduction
Bladder cancer is a common disease, with an
estimated 386,300 new cases and 150,200 mortalities occurring in
2008 worldwide (1). The disease
ranks ninth in worldwide cancer incidence and is the seventh most
common malignancy in men (2). In
China, bladder cancer is the most common malignant neoplasm of the
male urogenital system and the incidence of bladder cancer has
shown an upward trend in the past two decades (3).
Tumorigenesis is a multistep process during which
cells acquire genetic alterations that drive the progressive
transformation of normal cells into malignant cells. Genetic events
which result in the progression of bladder cancer are complicated
and poorly understood. Despite being a common cancer worldwide, the
management of bladder cancer currently relies primarily on clinical
staging and histopathological parameters. Of newly diagnosed
bladder cancer cases, 70–80% present with non-muscle-invasive
disease and, despite endoscopic and intravesical treatments, 50–70%
recur and 10–30% progress to muscle-invasive disease (4). Thus, it is of great value to explore
the mechanism of bladder cancer genesis and progression and to
identify the molecular markers that predict bladder cancer
recurrence and progression.
Mitochondrial tumor suppressor 1 (MTUS1), also known
as ATIP [angiotensin II receptor subtypes 2 (AT2)-interacting
protein], is a newly identified candidate tumor suppressor gene
(5). Multiple splice transcript
variants which encode different isoforms have been identified in
this gene. Previous findings have demonstrated that MTUS1 was
reduced or lost in a number of tumors, including pancreatic and
ovarian tumors (5,6). MTUS1 maps to chromosome 8p21.3–22, a
region frequently deleted and associated with the progression of
disease in breast, colorectal, lung, ovarian, renal, prostate and
bladder cancer (7–13).
As yet, no study has investigated the expression of
MTUS1 in bladder cancer. Thus, we explored the expression of MTUS1
and its clinicopathological and prognostic significance in human
bladder cancer in this study.
Materials and methods
Study population and sample
collection
There were 55 patients in the study, all of whom had
bladder transitional cell carcinoma (BTCC) and were treated at our
two institutions between January 2009 and March 2011. The patients
included 44 males and 11 females aged between 27 and 81 years
(mean, 60.5). The patients were histopathologically diagnosed as
having BTCC, newly diagnosed and untreated, and had no history of
any other tumor. We excluded carcinoma in situ from our
study. Sixteen patients underwent radical cystectomy, 4 patients
underwent partial cystectomy and 35 patients underwent
transurethral resection of the bladder tumor (TURBT). This study
was approved by the medical ethics committee of our hospitals and
written informed consent was obtained from all patients. The
surgically removed tumors were immediately frozen in liquid
nitrogen and maintained at −80°C until RNA was extracted.
A total of 10 normal bladder tissue samples (5 cm
distance from the tumor) were surgically excised from different
patients who underwent radical cystectomy and were also stored at
−80°C. The patients who underwent partial cystectomy or TURBT
received intravesical mitomycin C (MMC) or pirarubicin (THP)
instillations following surgery once weekly for the first 8 weeks
and then monthly up to 1.5 years. Cystoscopy was performed at
3-month intervals during the first 2 years and 6-month intervals
after 2 years. The mean follow-up period for the 55 patients was 14
months (range, 1–27). The histological grade was assessed according
to the WHO 2004 criteria; 32 of the tumors (58.2%) were low grade
and 23 (41.8%) were high grade. According to the UICC 2002 TNM
classification system, 32 tumors were superficial
(Tis,Ta,T1) and 23 were invasive
(T2,T3,T4). Other clinical and
pathological characteristics of the enrolled patients are shown in
Table I. During the follow-up
period, the recurrence or progression of BTCC was detected in 16
patients, 4 of whom succumbed to BTCC.
 | Table ICorrelation between
clinicopathological characteristics and expression of MTUS1 in
bladder cancer. |
Table I
Correlation between
clinicopathological characteristics and expression of MTUS1 in
bladder cancer.
| Variable | Case | Relative expression
of MTUS1 mRNA (± SD) | P-value |
|---|
| Gender | | | 0.332 |
| Male | 44 | 240±92 | |
| Female | 11 | 270±86 | |
| Age (years) | | | 0.357 |
| ≤50 | 13 | 226±82 | |
| >50 | 42 | 253±94 | |
| Grade | | | <0.001a |
| Low | 32 | 307±58 | |
| High | 23 | 161±51 | |
| T stage | | | <0.001a |
|
Tis,Ta,T1 | 32 | 298±69 | |
|
T2,T3,T4 | 23 | 174±66 | |
| Tumor number | | | 0.029a |
| Single | 40 | 263±85 | |
| Multiple | 15 | 203±97 | |
| Tumor size (cm) | | | 0.034a |
| ≤3 | 43 | 260±92 | |
| >3 | 12 | 197±73 | |
RNA preparation and reverse
transcription
Total RNA was isolated from 500–1,000 mg specimens
of frozen bladder cancer tissue or normal bladder tissue using
TRIzol reagent (Invitrogen, Carlsbad, CA, USA) according to the
manufacturer's instructions. The quality of the RNA was confirmed
to be high. Complementary DNA (cDNA) was synthesized from 2 μg
total RNA using random primers and Moloney murine leukemia virus
(M-MLV) reverse transcriptase (Invitrogen).
Oligonucleotide primers for MTUS1 gene
and amplification by reverse transcription-polymerase chain
reaction (RT-PCR)
The specific oligonucleotide primers were
synthesized according to published information on the MTUS1 gene
(GenBank NM_001001924.2) as follows: sense,
5′-TGAGGCAAATAGCTGCTCCA-3′; antisense, 5′-TGAGGAGATACGGCTCGATCA-3′.
The PCR product size was 106 bp. We conducted BLAST searches
(GenBank) to confirm the specificity of the nucleotide sequences.
To ensure the fidelity of mRNA extraction and reverse
transcription, samples were subjected to PCR amplification with
oligonucleotide primers specific for β-actin and normalized
primers. β-actin primers were as follows: forward:
5′-CATGTACGTTGCTATCCAGGC-3′; reverse: 5′-CTCCTTAATGTCACGCACGAT-3′.
The PCR product size of β-actin was 318 bp. The PCR conditions were
as follows: denaturation at 95°C for 5 min, followed by 35 cycles
of 30 sec at 94°C, annealing at 57°C for 30 sec at and at 72°C for
30 sec. The final extention was at 72°C for 5 min. An 8-μl aliquot
of each amplified PCR product was electrophoresed on 1.5% (w/v)
agarose gels containing 0.5 μg/ml ethidium bromide which were
visualized under UV light. The band density was detected and
evaluated using the Quantity One Quantization software (Bio-Rad,
Munich, Germany).
Real-time RT-PCR and analysis of MTUS1
mRNA
The real-time quantitative RT-PCR amplification of
MTUS1 and β-actin mRNA from the tissue samples was performed using
the ABI 7500 Real-Time PCR system using the SYBR-Green I kit
(Takara Biotechnology, Dalian, China). Data were analyzed using the
7500 System SDS software (Applied Biosystems, Foster City, CA,
USA). In brief, the PCR was carried out in a 50 μl final volume
containing a) 10 μl 5X SYBR-Green I PCR buffer; b) 1 μl sense
primer (10 μM) and 1 μl antisense primer (10 μM); c) 1 μl dNTP (10
mM); d) 1 μl Taq enzyme (3 U/μl); e) 5 μl cDNA; and f)
ddH2O up to 50 μl. Following initial denaturation at
93°C for 3 min, temperature cycling was initiated. Each cycle
consisted of denaturation at 93° for 30 sec, annealing at 55°C for
45 sec and extension at 72°C for 45 sec. A total of 40 cycles was
carried out. To distinguish specific from non-specific products and
primer dimers, melting curve analyses were carried out. To evaluate
specific mRNA expression in the samples, a standard curve was
produced for each run. The concentration of each sample was
calculated by relating its crossing point to a standard curve. The
level of expression of MTUS1 mRNA is presented as relative copy
numbers normalized against β-actin mRNA and shown as the mean ± SD.
Relative MTUS1 mRNA expression was calculated using the formula:
(MTUS1/β-actin) × 1,000.
Statistical analysis
The correlation between MTUS1 mRNA expression and
clinicopathological factors was analyzed using the χ2
test and Student's t-test. For survival analysis, disease-free
survival (DFS) was defined as the time interval from surgery to
cancer recurrence or progression. DFS curves were generated using
the Kaplan-Meier method and the comparison between the curves was
carried out using the log-rank test. P<0.05 was considered to
indicate a statistically significant result. Statistical analysis
was performed using SPSS 13.0 software for Windows (SPSS Inc.,
Chicago, IL, USA). Prognostic factors were evaluated by univariate
and multivariate logistic regression analyses.
Results
MTUS1 mRNA expression in bladder
cancer
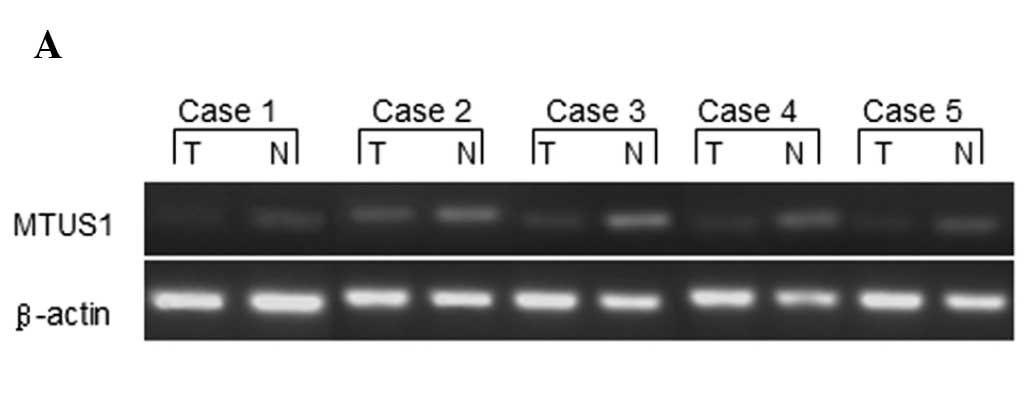
We performed an RT-PCR analysis of MTUS1 in bladder
tumors and paired normal samples obtained from 5 patients. A
significant downregulation of MTUS1 mRNA expression was observed in
the tumor tissues as compared with the corresponding normal bladder
tissue (Fig. 1). The mean MTUS1
mRNA expression in the tumor tissues was 54.1% (range, 43.9–73.3%)
compared with the normal tissues (with expression in normal tissues
defined as 100%). We further confirmed the expression of MTUS1 mRNA
in 55 bladder cancer samples and 10 paired normal samples by
real-time RT-PCR analysis. The mean expression value of MTUS1 mRNA
in the cancer samples was 246.1±91.3, which was significantly lower
than that for the normal samples (405.3±124.4; P<0.001).
Clinicopathological significance of MTUS1
mRNA expression in bladder cancer
The expression of MTUS1 mRNA in bladder cancer and
its correlation with clinicopathological factors were examined
(Table I). Four of these factors
were positively correlated with the expression of MTUS1 mRNA.
First, the level of MTUS1 mRNA expression was found to be
marginally higher in the low-grade group (307±58) compared to that
in the high-grade group (161±51; P<0.001). Second, MTUS1 mRNA
was expressed at higher levels in the superficial tumor group
(298±69) than in the invasive tumor group (174±66; P<0.001).
Third, the MTUS1 mRNA expression level was higher in the group with
a single mass (263±85) than in the multiple mass group (203±97;
P=0.029). Finally, there was also a significant correlation between
levels of MTUS1 mRNA expression and tumor size; tumors <3 cm
showed a higher expression of MTUS1 mRNA (260±92) than tumors of
>3 cm (197±73; P=0.034). However, no differences were found
between MTUS1 mRNA expression and age (P=0.357) or gender
(P=0.332). In addition, MTUS1 mRNA expression was lower in the 16
patients who experienced recurrence or progression following
surgery compared with those who did not; the mRNA expression mean
levels were 164±65 and 280±78, respectively (P<0.001).
Prognostic value of MTUS1 mRNA expression
for DFS
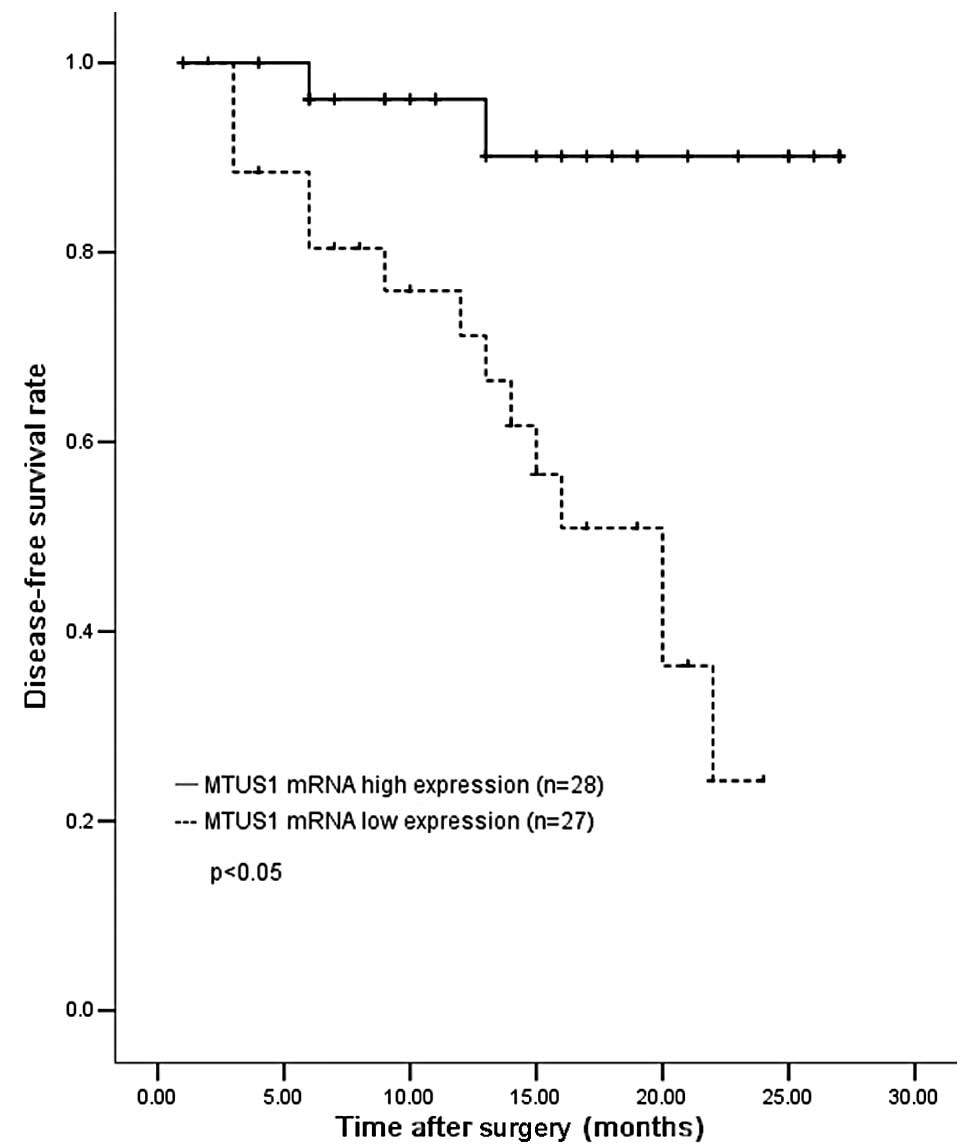
We evaluated whether MTUS1 mRNA expression was able
to predict tumor recurrence or progression in bladder cancer. The
cases were divided into high (n=28) and low (n=27) expression
groups according to the average MTUS1 mRNA expression status in the
tumor. The cut-off value was the most significant value for
prognostic prediction by the log-rank test. Patients with a high
MTUS1 expression (mean, 321±50) had a significantly longer DFS than
those with a low expression (mean, 169±51; P<0.05) (Fig. 2).
Univariate and multivariate prognostic
analyses of DFS in bladder cancer
The results of the univariate and multivariate
prognostic analyses of postoperative DFS are shown in Table II. Univariate analysis revealed
that the following factors were significantly correlated with DFS:
grade (P=0.001), T stage (P=0.009), tumor number (P=0.037) and
MTUS1 mRNA expression (P<0.001). Multivariate regression
analysis revealed that MTUS1 mRNA expression was an independent
prognostic predictor for DFS [relative risk (RR), 0.974; 95%
confidence interval (CI), 0.952–0.997; P=0.025].
| Table IIUnivariate and multivariate logistic
regression analysis for disease-free survival. |
Table II
Univariate and multivariate logistic
regression analysis for disease-free survival.
| Univariate
analysis | Multivariate
analysis |
|---|
| |
|
|---|
| Variable | P-value | P-value | RR | 95% CI |
|---|
| Gender | 0.824 | | | |
| Age (years) | 0.230 | | | |
| Grade | 0.001a | 0.561 | 0.460 | 0.034–6.309 |
| T stage | 0.009a | 0.556 | 0.561 | 0.082–3.842 |
| Tumor number | 0.037a | 0.630 | 1.573 | 0.249–9.958 |
| Tumor size (cm) | 0.995 | | | |
| MTUS1 expression | <0.001a | 0.025a | 0.974 | 0.952–0.997 |
To clarify the most significant factors correlated
with MTUS1 mRNA expression in bladder cancer, we performed
multivariate analyses. Results of the multivariate logistic
regression analysis demonstrated that grade and stage of the
disease were significantly associated with MTUS1 mRNA expression in
bladder cancer (P=0.001 and P=0.046, respectively) (Table III).
| Table IIIMultivariate logistic regression
analysis of factors associated with expression of MTUS1 mRNA. |
Table III
Multivariate logistic regression
analysis of factors associated with expression of MTUS1 mRNA.
| Variable | P-value | RR | 95% CI |
|---|
| Gender | 0.957 | 0.925 | 0.055–15.470 |
| Age | 0.159 | 9.238 | 0.419–203.892 |
| Grade | 0.001a | 0.005 | 0.000–0.114 |
| T stage | 0.046a | 0.060 | 0.004–0.953 |
| Tumor number | 0.416 | 0.300 | 0.017–5.460 |
| Tumor size | 0.522 | 2.870 | 0.114–72.351 |
Discussion
The MTUS1 gene contains 17 coding exons that are
distributed over 112 kb of genomic DNA. The use of alternative
exons produces three major transcripts, termed ATIP1, ATIP3 and
ATIP4, which show different tissue distributions (14). ATIP1 is ubiquitous and highly
expressed in the brain, ATIP3 is expressed in most tissues,
including the prostate, bladder, breast, ovary and colon, and ATIP4
is a brain-specific transcript that is highly abundant in the
cerebellum and fetal brain.
In the several splice variants of MTUS1, ATIP3 is
the major transcript which is localized to the centrosome, mitotic
spindle and intercellular bridge. ATIP3 regulates the essential
steps of mitosis by interfering with the microtubule cytoskeleton
and its overexpression delays the progression of mitosis by
prolonging the duration of the metaphase, potentially due to the
modulation of spindle checkpoint signaling. ATIP3 knock-down by
siRNA has been reported to lead to a significant increase in breast
cancer cell proliferation, indicating an antiproliferative effect
of ATIP3 (15).
The MTUS1 gene encodes a protein with a C-terminal
domain, which interacts with the AT2 receptor, and a large
coiled-coil region that facilitates dimerization. The AT1 and AT2
receptors belong to the superfamily of G protein-coupled receptors
(GPCR) and are the two major angiotensin II (ANG II) receptor
subtypes. ANG II is not only a potent vasoactive effector peptide
of the renin-angiotensin system, but also a significant regulator
of cell proliferation and hypertrophy. AT1 and AT2 receptors
exhibit opposite biological and physiological effects. MTUS1 is an
early mediator of AT2 receptor activation. Together with AT2, MTUS1
antagonizes AT1 receptor function, inducing antiproliferative and
pro-apoptotic effects in vitro and in vivo (16).
In the present study, we used semi-quantitative and
quantitative RT-PCR to investigate the level of MTUS1 (ATIP3) mRNA
expression in clinical cases of BTCC. We found that the expression
of MTUS1 was low in the cancer tissues compared with the normal
bladder tissues (Fig. 1). Previous
studies have shown that MTUS1 expression levels are downregulated
in cancers of the colon, ovary, pancreas, head and neck and breast
cancer (5,6,17–19).
For example, Zuern et al reported that MTUS1 expression is
significantly downregulated in colon cancer tissues, compared with
the corresponding normal tissues, at the protein and mRNA levels
(20). The authors also found that
knockdown of MTUS1 in HUVEC cells by siRNA transfection resulted in
increased cell proliferation. Pils et al reported similar
results in ovarian carcinoma (6),
as MTUS1 had a significantly lower expression in primary ovarian
carcinoma compared with normal ovarian tissues and cysts. In
addition, other studies have revealed the downregulation of MTUS1
in colon cancer and MTUS1 copy number deletion variants in familial
breast cancer (17,19). These data support our results.
However, no studies have focused on bladder cancer and our analysis
explored the clinical significance of MTUS1 expression in this
disease.
We compared various clinicopathological factors with
the MTUS1 expression status in bladder cancer. Our data demonstrate
that the cases with high levels of MTUS1 mRNA expression tended to
show low grade, low stage, small tumor size and a single tumor mass
compared with those with low MTUS1 expression tumors (Table I). The correlation of expression
with clinicopathological features provides clinical evidence that
MTUS1 is a bladder tumor suppressor gene.
Univariate analysis in our study demonstrated that
the following factors were prognostic for recurrence or
progression: grade, T stage, tumor number and MTUS1 mRNA expression
(Table II). Multivariate analysis
further identified MTUS1 mRNA expression as a stronger independent
prognostic factor of DFS than grade, T stage and tumor number in
the logistic regression model. Thus, we suggest that MTUS1 is
significant in the pathology of bladder cancer. The low level of
expression of MTUS1 in bladder cancer was shown to be significantly
associated with a poor DFS prognosis (Fig. 2). Therefore, the downregulation of
MTUS1 expression may be an early event in malignant disease. In
addition, grade and stage were significantly associated with MTUS1
mRNA expression in bladder cancer using multivariate analysis
(Table III). Based on these
results, the detection of MTUS1 in tumor tissue following surgery
may be used as a prognostic marker for determining the risk of
future recurrence or progression in patients with bladder
cancer.
The exact mechanism by which MTUS1 regulates cell
proliferation is currently unclear, but MTUS1 is believed to be an
early component of the growth inhibitory signaling cascade. Seibold
et al studied MTUS1 mRNA expression in pancreatic tumors and
tumor cell lines (5). The authors
reported a negative correlation of MTUS1 mRNA expression with cell
proliferation and differentiation, showing low expression in
undifferentiated proliferating cells and high expression in
differentiated and slowly proliferating cells. This study also
demonstrated an inhibitory effect of MTUS1 on cell proliferation by
transfecting a recombinant plasmid containing the MTUS1 gene into a
pancreatic tumor cell line which expressed no native MTUS1 mRNA.
Moreover, the antigrowth effects of MTUS1 in cooperation with AT2
may be associated with the activation of tyrosine phosphatases and
the inhibition of receptor tyrosine kinases (RTK), including bFGF,
EGF and insulin, which ultimately lead to the inhibition of
extracellular regulated kinase (ERK2) activation (21). The members of the RTK signaling
pathway and ERK2 are known to be associated with carcinogenesis
(22,23).
To the best of our knowledge, this is the first
study concerning correlations between MTUS1 expression and
clinicopathological factors in bladder cancer. However, the
clinical significance of MTUS1 mRNA expression should be further
studied with regard to MTUS1 protein levels in bladder cancer.
Further function studies are needed to elucidate the mechanism of
tumor suppression of MTUS1 and to confirm its tumor suppression
function in other bladder tumor types and models. Of note, the
total sample size included in this study, was small, the follow-up
duration was relatively short and the correlation between MTUS1 and
overall survival was absent. Another study with a larger study
population and longer follow-up on this issue is ongoing.
In conclusion, our study provides clinical evidence
which supports the hypothesis that MTUS1 is a bladder cancer
suppressor gene that may be significant in cancer development and
progression. The status of MTUS1 mRNA expression could be a novel
prognostic marker for predicting bladder tumor DFS.
References
|
1
|
Jemal A, Bray F, Center MM, Ferlay J, Ward
E and Forman D: Global cancer statistics. CA Cancer J Clin.
61:69–90. 2011. View Article : Google Scholar
|
|
2
|
Ploeg M, Aben KK and Kiemeney LA: The
present and future burden of urinary bladder cancer in the world.
World J Urol. 27:289–293. 2009. View Article : Google Scholar : PubMed/NCBI
|
|
3
|
Lei T, Mao WM, Yang HJ, et al: Study on
cancer incidence through the Cancer Registry Program in 11 cities
and counties, China. Zhonghua Liu Xing Bing Xue Za Zhi.
30:1165–1170. 2009.(In Chinese).
|
|
4
|
Jacobs BL, Lee CT and Montie JE: Bladder
cancer in 2010: how far have we come? CA Cancer J Clin. 60:244–272.
2010. View Article : Google Scholar : PubMed/NCBI
|
|
5
|
Seibold S, Rudroff C, Weber M, Galle J,
Wanner C and Marx M: Identification of a new tumor suppressor gene
located at chromosome 8p21.3–22. FASEB J. 17:1180–1182.
2003.PubMed/NCBI
|
|
6
|
Pils D, Horak P, Gleiss A, et al: Five
genes from chromosomal band 8p22 are significantly down-regulated
in ovarian carcinoma: N33 and EFA6R have a potential impact on
overall survival. Cancer. 104:2417–2429. 2005. View Article : Google Scholar : PubMed/NCBI
|
|
7
|
Dexter TJ, Sims D, Mitsopoulos C, Mackay
A, Grigoriadis A, Ahmad AS and Zvelebil M: Genomic distance
entrained clustering and regression modelling highlights
interacting genomic regions contributing to proliferation in breast
cancer. BMC Syst Biol. 4:1272010. View Article : Google Scholar
|
|
8
|
Sayagués JM, Abad Mdel M, Melchor HB, et
al: Intratumoural cytogenetic heterogeneity of sporadic colorectal
carcinomas suggests several pathways to liver metastasis. J Pathol.
221:308–319. 2010.
|
|
9
|
Fong Y, Lin YS, Liou CP, Li CF and Tzeng
CC: Chromosomal imbalances in lung adenocarcinomas with or without
mutations in the epidermal growth factor receptor gene.
Respirology. 15:700–705. 2010. View Article : Google Scholar : PubMed/NCBI
|
|
10
|
Califano D, Pignata S, Pisano C, et al:
FEZ1/LZTS1 protein expression in ovarian cancer. J Cell Physiol.
222:382–386. 2010. View Article : Google Scholar : PubMed/NCBI
|
|
11
|
Cheng L, MacLennan GT, Zhang S, et al:
Evidence for polyclonal origin of multifocal clear cell renal cell
carcinoma. Clin Cancer Res. 14:8087–8093. 2008. View Article : Google Scholar : PubMed/NCBI
|
|
12
|
Kim JW, Cheng Y, Liu W, et al: Genetic and
epigenetic inactivation of LPL gene in human prostate cancer. Int J
Cancer. 124:734–738. 2009. View Article : Google Scholar : PubMed/NCBI
|
|
13
|
Knowles MA, Aveyard JS, Taylor CF, Harnden
P and Bass S: Mutation analysis of the 8p candidate tumour
suppressor genes DBC2 (RHOBTB2) and LZTS1 in bladder cancer. Cancer
Lett. 225:121–130. 2005. View Article : Google Scholar : PubMed/NCBI
|
|
14
|
Di Benedetto M, Bièche I, Deshayes F, et
al: Structural organization and expression of human MTUS1, a
candidate 8p22 tumor suppressor gene encoding a family of
angiotensin II AT2 receptor-interacting proteins, ATIP. Gene.
380:127–136. 2006.PubMed/NCBI
|
|
15
|
Rodrigues-Ferreira S, Di Tommaso A,
Dimitrov A, et al: 8p22 MTUS1 gene product ATIP3 is a novel
anti-mitotic protein underexpressed in invasive breast carcinoma of
poor prognosis. PLoS One. 4:e72392009. View Article : Google Scholar : PubMed/NCBI
|
|
16
|
Stoll M and Unger T: Angiotensin and its
AT2 receptor: new insights into an old system. Regul Pept.
99:175–182. 2001. View Article : Google Scholar : PubMed/NCBI
|
|
17
|
Lee S, Bang S, Song K and Lee I:
Differential expression in normal-adenomacarcinoma sequence
suggests complex molecular carcinogenesis in colon. Oncol Rep.
16:747–754. 2006.
|
|
18
|
Ye H, Pungpravat N, Huang BL, et al:
Genomic assessments of the frequent loss of heterozygosity region
on 8p21.3–p22 in head and neck squamous cell carcinoma. Cancer
Genet Cytogenet. 176:100–106. 2007.PubMed/NCBI
|
|
19
|
Frank B, Bermejo JL, Hemminki K, et al:
Copy number variant in the candidate tumor suppressor gene MTUS1
and familial breast cancer risk. Carcinogenesis. 28:1442–1445.
2007. View Article : Google Scholar : PubMed/NCBI
|
|
20
|
Zuern C, Heimrich J, Kaufmann R, et al:
Down-regulation of MTUS1 in human colon tumors. Oncol Rep.
23:183–189. 2010.PubMed/NCBI
|
|
21
|
Nouet S, Amzallag N, Li JM, et al:
Trans-inactivation of receptor tyrosine kinases by novel
angiotensin II AT2 receptor-interacting protein, ATIP. J Biol Chem.
279:28989–28997. 2004. View Article : Google Scholar : PubMed/NCBI
|
|
22
|
Vogelstein B and Kinzler KW: Cancer genes
and the pathways they control. Nat Med. 10:789–799. 2004.
View Article : Google Scholar : PubMed/NCBI
|
|
23
|
Meloche S and Pouysségur J: The ERK1/2
mitogen-activated protein kinase pathway as a master regulator of
the G1- to S-phase transition. Oncogene. 26:3227–3239. 2007.
View Article : Google Scholar : PubMed/NCBI
|