Introduction
With an estimated incidence of 333,330 cases in the
European Union (2008) and reports of high mortality rates,
colorectal cancer (CRC) is one of the most common causes of
cancer-related mortality in the US and Europe (1). Metastatic disease is present in
approximately 25% of patients at the time of diagnosis, with 50% of
patients likely to develop metastases. The majority of these
patients are unlikely to be available for surgical resection with a
primary curative intention.
Therapy for advanced cancer, either on an individual
basis or via clinical trials, may often be toxic to the patient and
also costly and response rates are considered to be relatively low.
The timely discontinuation of treatment is therefore crucial. The
decision to continue, alter or terminate a specific treatment
regimen is often based upon morphological imaging. The RECIST
criteria (2,3) have, until the introduction of positron
emission tomography (PET), been used as a ‘gold standard’ for
response evaluation. Imaging of glucose metabolism in cancer cells
with quantitative PET applying the glucose analog 18-fluoride
fluoro-2-deoxy-D-glucose (18F-FDG), has emerged as a powerful tool
(4–6), with numerous studies reporting a
positive correlation between the tumor 18F-FDG uptake immediately
following or during treatment and the clinical outcome. Changes in
tumor metabolism may be observed prior to changes in tumor size,
providing information that may be used for early individual risk
assessment or as an early surrogate endpoint in a clinical
trial.
The metabolic response on an 18F-FDG PET scan may be
determined using qualitative and quantitative approaches. The most
common method for quantifying FDG uptake is via the application of
standardized uptake values (SUVs), which may be normalized to body
mass, lean body mass or body surface area. Being relatively easy to
access, SUVs have gained popularity in the clinic. Standardized
protocols, including patient preparation, scanning procedure, image
reconstruction and image analysis, are essential when patients are
studied over a period of time or are participating in multicenter
studies (7–10). As changes in plasma glucose levels
and/or differences in FDG plasma clearance among scans may
interfere with the interpretation of SUV results (11,12),
factors affecting these parameters should also be standardized. The
European Organisation for Research and Treatment of Cancer (EORTC),
the National Cancer Institute (NCI) and the European Association of
Nuclear Medicine have all made consensus recommendations with
regard to SUV and the issues mentioned above (9,13,14).
Although these recommendations are followed, studies assessing
metabolic response to therapy also have to address the following
consideration: SUVs in reproducible, tumor-free regions of interest
(ROI) should be significantly consistent throughout therapy,
therefore a significant change in tumor SUV would be indicative of
a therapeutic metabolic response.
By using 18F-FDG PET/CT, the aim of this study was
to evaluate SUVs in non-tumor volumes of interest (VOI) in patients
with metastatic CRC refractory to second-line treatment with
irinotecan just prior to and 2 weeks following a single
administration of third-line therapy with irinotecan plus
cetuximab.
Materials and methods
Selection and description of
participants
The study occurred at a specialist cancer treatment
center. Only patients with metastatic CRC participated in the
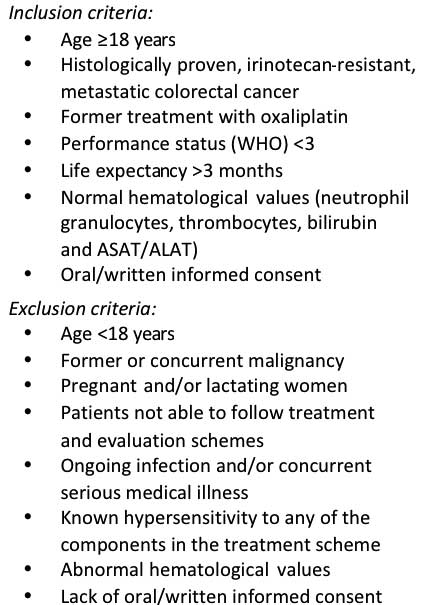
study. The inclusion and exclusion criteria are listed in Fig. 1. A total of 51 patients (mean body
weight, 74±18 kg; range, 47–132 kg; follow-up, 74±17 kg, range,
47–130 kg) underwent a baseline 18F-FDG PET/CT scan prior to a
single administration of irinotecan (180 mg/m2) plus
cetuximab (500 mg/m2). A follow-up scan was performed at
two weeks following treatment. The procedure followed was according
to a protocol approved by the Regional Ethics Committee of
Copenhagen County and with the Helsinki declaration (2008). Oral
and written informed consent from the patients were obtained prior
to any patient participating in the study.
Methods
A dose of 4 MBq/kg (maximum 400 MBq) of 18F-FDG was
injected intravenously (i.v.) following a minimum 6-h fast in
patients with blood glucose levels <120 mg/dl. PET/CT data were
acquired at 60 min post-injection (p.i.) on a GE Healthcare
DiscoveryTM (Buckinghamshire, UK) VCT PET/CT scanner
(15). A helical diagnostic CT scan
was acquired with oral (E-Z-Cat® 0.9 l solution) and
i.v. contrast (Ultravist® 370 mg I/ml) using a standard
CT protocol with a scan field of view of 70 cm. Data were
reconstructed with a standard filter into transaxial slices with a
field of view of 50 cm, matrix size of 512×512 (pixel size 0.98 mm)
and a slice thickness of 3.75 mm. The CT scan was followed
immediately by a PET scan performed using a standard whole-body
acquisition protocol with 6–7 bed positions, a slice overlap of 7
and an acquisition time of 2.5 min per bed position. The scan field
of view was 70 cm. The attenuation correction was based on the CT
scan. The PET data were reconstructed into transaxial slices with a
matrix size of 128×128 (pixel size 5.47 mm) and a slice thickness
of 3.75 mm using iterative 3D-OSEM (2 iterations, 28 subsets).
Corrections for attenuation, randoms, dead time and normalization
were carried out inside the iterative loop. Analyses of CT, PET and
fused PET/CT data were performed using a GE Healthcare Volume
Viewer® on a GE Healthcare Advantage Workstation® version 4.4.
Approximately 10 cm3 VOI was drawn in the aortic arch,
in tumor-free liver and in the spleen and SUVs (maximum and mean)
normalized to total body mass were registered for all regions.
Baseline and follow-up data were obtained using the same PET/CT
scanner. To avoid possible inter-observer bias, the same physician
analyzed all scans (16,17).
Statistical analysis
Calculations of sample size and power were performed
using the Altman nomogram (18).
The minimal relevant difference (MIREDIF) in SUV was set to be
equal to the standard deviation, yielding a standardized difference
of 1.0. The power of the study was determined to be 0.94. Any other
statistical analyses were performed using MedCalc
11.1.1® (Mariakerke, Belgium) and SPSS Statistics
17.0® (Chicago, IL, USA). The SUV results were compared
with Gaussian distributions by applying the D’Agostino-Pearson
omnibus test (19,20). The SUV measurements passed the test
for normality (P>0.05). Paired samples t-test was used to
compare two sets of results to assess whether there was any
difference between the means. Correlation coefficients were
calculated to measure the strength of correlation between
variables. P<0.05 was considered to indicate a statistically
significant result.
Results
The results of this study showed significantly
consistent SUVs (SUVmax and SUVmean) in the
aortic arch, liver and spleen tumor-free regions prior to and 2
weeks following a single administration of third-line treatment
with irinotecan plus cetuximab in patients with irinotecan
refractory metastatic CRC (Tables I
and II).
 | Table IBaseline SUVs prior to treatment. |
Table I
Baseline SUVs prior to treatment.
| Region (10
cm3 VOI) | Mean ± SD | CI (95%) | Normal distribution
(P-value) |
|---|
| Aortic arch
SUVmax | 1.66±0.37 | 1.55–1.76 | 0.66 |
| Aortic arch
SUVmean | 1.18±0.26 | 1.10–1.25 | 0.66 |
| Liver
SUVmax | 2.13±0.50 | 1.99–2.27 | 0.16 |
| Liver
SUVmean | 1.58±0.34 | 1.49–1.68 | 0.62 |
| Spleen
SUVmax | 1.83±0.48 | 1.70–1.97 | 0.07 |
| Spleen
SUVmean | 1.35±0.36 | 1.25–1.45 | 0.33 |
| Table IISUVs following treatment. |
Table II
SUVs following treatment.
| Region (10
cm3 VOI) | Mean ± SD | CI (95%) |
|---|
| Aortic arch
SUVmax | 1.70±0.48 | 1.57–1.83 |
| Aortic arch
SUVmean | 1.20±0.34 | 1.10–1.29 |
| Liver
SUVmax | 2.12±0.55 | 1.96–2.27 |
| Liver
SUVmean | 1.59±0.41 | 1.47–1.71 |
| Spleen
SUVmax | 1.89±0.54 | 1.74–2.04 |
| Spleen
SUVmean | 1.35±0.39 | 1.24–1.46 |
The mean differences were non-significant
(P>0.05; Table III) in the
aortic arch, liver and spleen regions of interest and
SUVmax and SUVmean. The correlation
coefficients were significant (P<0.001; Table III), ranging from 0.74 to
0.84.
| Table IIIComparison of SUV prior to and
following treatment (paired samples t-test and test of
correlation). |
Table III
Comparison of SUV prior to and
following treatment (paired samples t-test and test of
correlation).
| Region (10
cm3 VOI) | Mean difference ±
SD | CI (95%) | P-value | Correlation | P-value |
|---|
| Aortic arch
SUVmax | −0.045±0.32 | −0.135–0.045 | 0.32 | 0.74 | <0.001a |
| Aortic arch
SUVmean | −0.022±0.23 | −0.086–0.042 | 0.50 | 0.74 | <0.001a |
| Liver
SUVmax | 0.010±0.30 | −0.074–0.094 | 0.82 | 0.84 | <0.001a |
| Liver
SUVmean | −0.006±0.26 | −0.080–0.068 | 0.87 | 0.77 | <0.001a |
| Spleen
SUVmax | 0.053±0.33 | −0.145–0.039 | 0.25 | 0.80 | <0.001a |
| Spleen
SUVmean | −0.004±0.24 | −0.072–0.064 | 0.91 | 0.80 | <0.001a |
Discussion
Semi-quantitative analysis of glucose metabolism in
tumors with 18F-FDG PET in the prediction of clinical outcome is
gaining popularity (4–6), due to the evidence that changes in
tumor metabolism may be observed prior to changes in tumor size.
Knowledge of how tumor-free tissue responds to the same treatment
regimen is required for the correct interpretation of metabolic
response in cancer cells to therapy. Thus, a significant change in
tumor SUV would be indicative of a therapeutic metabolic response
if SUVs in reproducible, non-tumor ROI are consistent throughout
therapy. Response rates to therapy for metastatic colorectal cancer
are markedly low and a swift individual assessment for different
treatment regimens is crucial.
Assuming all consensus recommendations with regard
to data acquisition and patient preparation are fulfilled (9,13,14),
this study demonstrates significantly consistent SUVs (both
SUVmax and SUVmean) in three different
tumor-free regions (aortic arch, liver and spleen) prior to and 2
weeks following a single administration of third-line treatment
with irinotecan plus cetuximab in patients with irinotecan
refractory metastatic CRC. This study provides the fundamental data
needed for studies focusing on the early assessment of therapeutic
response in these patients with this specific treatment
regimen.
References
|
1
|
Ferlay J, Parkin DM and Steliarova-Foucher
E: Estimates of cancer incidence and mortality in Europe in 2008.
Eur J Cancer. 46:765–81. 2010. View Article : Google Scholar : PubMed/NCBI
|
|
2
|
Eisenhauer EA, Therasse P, Bogaerts J,
Schwartz LH, Sargent D, Ford R, Dancey J, Arbuck S, Gwyther S,
Mooney M, et al: New response evaluation criteria in solid tumours:
revised RECIST guideline (version 1.1). Eur J Cancer. 45:228–247.
2009. View Article : Google Scholar
|
|
3
|
Therasse P, Arbuck SG, Eisenhauer EA,
Wanders J, Kaplan RS, Rubinstein L, Verweij J, Van GM, van Oosterom
AT, Christian MC and Gwyther SG: New guidelines to evaluate the
response to treatment in solid tumors. European Organization for
Research and Treatment of Cancer, National Cancer Institute of the
United States, National Cancer Institute of Canada. J Natl Cancer
Inst. 92:205–216. 2000. View Article : Google Scholar
|
|
4
|
Kidd EA, Siegel BA, Dehdashti F and
Grigsby PW: The standardized uptake value for F-18
fluorodeoxyglucose is a sensitive predictive biomarker for cervical
cancer treatment response and survival. Cancer. 110:1738–1744.
2007. View Article : Google Scholar : PubMed/NCBI
|
|
5
|
Larson SM and Schwartz LH: 18F-FDG PET as
a candidate for ‘qualified biomarker’: functional assessment of
treatment response in oncology. J Nucl Med. 47:901–903. 2006.
|
|
6
|
Weber WA: Positron emission tomography as
an imaging biomarker. J Clin Oncol. 24:3282–3292. 2006. View Article : Google Scholar : PubMed/NCBI
|
|
7
|
Boellaard R: Standards for PET image
acquisition and quantitative data analysis. J Nucl Med. 50(Suppl
1): S11–S20. 2009. View Article : Google Scholar : PubMed/NCBI
|
|
8
|
Cheebsumon P, Velasquez LM, Hoekstra CJ,
Hayes W, Kloet RW, Hoetjes NJ, Smit EF, Hoekstra OS, Lammertsma AA
and Boellaard R: Measuring response to therapy using FDG PET:
semi-quantitative and full kinetic analysis. Eur J Nucl Med Mol
Imaging. January 6–2011.(Epub ahead of print).
|
|
9
|
Shankar LK, Hoffman JM, Bacharach S,
Graham MM, Karp J, Lammertsma AA, Larson S, Mankoff DA, Siegel BA,
Van den Abbeele A, Yap J and Sullivan D: Consensus recommendations
for the use of 18F-FDG PET as an indicator of therapeutic response
in patients in National Cancer Institute Trials. J Nucl Med.
47:1059–1066. 2006.PubMed/NCBI
|
|
10
|
Weber WA: Use of PET for monitoring cancer
therapy and for predicting outcome. J Nucl Med. 46:983–995.
2005.PubMed/NCBI
|
|
11
|
Freedman NM, Sundaram SK, Kurdziel K,
Carrasquillo JA, Whatley M, Carson JM, Sellers D, Libutti SK, Yang
JC and Bacharach SL: Comparison of SUV and Patlak slope for
monitoring of cancer therapy using serial PET scans. Eur J Nucl Med
Mol Imaging. 30:46–53. 2003. View Article : Google Scholar : PubMed/NCBI
|
|
12
|
Huang SC: Anatomy of SUV. Standardized
uptake value. Nucl Med Biol. 27:643–646. 2000.PubMed/NCBI
|
|
13
|
Boellaard R, O’Doherty MJ, Weber WA,
Mottaghy FM, Lonsdale MN, Stroobants SG, Oyen WJ, Kotzerke J,
Hoekstra OS, Pruim J, et al: FDG PET and PET/CT: EANM procedure
guidelines for tumour PET imaging: version 1.0. Eur J Nucl Med Mol
Imaging. 37:181–200. 2010. View Article : Google Scholar : PubMed/NCBI
|
|
14
|
Young H, Baum R, Cremerius U, Herholz K,
Hoekstra O, Lammertsma AA, Pruim J and Price P: Measurement of
clinical and subclinical tumour response using
[18F]-fluorodeoxyglucose and positron emission tomography: review
and 1999 EORTC recommendations. European Organization for Research
and Treatment of Cancer (EORTC) PET Study Group. Eur J Cancer.
35:1773–1782. 1999.
|
|
15
|
Teräs M, Tolvanen T, Johansson JJ,
Williams JJ and Knuuti J: Performance of the new generation of
whole-body PET/CT scanners: Discovery STE and Discovery VCT. Eur J
Nucl Med Mol Imaging. 34:1683–1692. 2007.PubMed/NCBI
|
|
16
|
Benz MR, Evilevitch V, Allen-Auerbach MS,
Eilber FC, Phelps ME, Czernin J and Weber WA: Treatment monitoring
by 18F-FDG PET/CT in patients with sarcomas: interobserver
variability of quantitative parameters in treatment-induced changes
in histopathologically responding and nonresponding tumors. J Nucl
Med. 49:1038–1046. 2008. View Article : Google Scholar
|
|
17
|
Marom EM, Munden RF, Truong MT, Gladish
GW, Podoloff DA, Mawlawi O, Broemeling LD, Bruzzi JF and Macapinlac
HA: Interobserver and intraobserver variability of standardized
uptake value measurements in non-small-cell lung cancer. J Thorac
Imaging. 21:205–212. 2006. View Article : Google Scholar : PubMed/NCBI
|
|
18
|
Altman DG: Statistics and ethics in
medical research: III How large a sample? Br Med J. 281:1336–1338.
1980. View Article : Google Scholar : PubMed/NCBI
|
|
19
|
D’Agostino RB and Pearson ES: Tests for
departure from normality. Empirical results for the distributions
of b2 and √b1. Biometrika.
60:613–622. 1973.
|
|
20
|
D’Agostino RB and Stephens MA:
Goodness-of-Fit Techniques. Marcel Dekker; New York: 1986
|