Introduction
Hepatocellular carcinoma (HCC), or liver cancer, is
the fifth most common type of cancer and the third leading cause of
cancer-related mortality worldwide (1). At least two-thirds of the 650,000
cases of HCC reported globally each year are found in Asian
countries (2). China is estimated
to have the highest incidence of HCC (34.1 for males and 13.7 for
females, per 100,000 world standard population as of 2008),
accounting for 53.5% (approximately 401,000 cases) of newly
diagnosed cases in the world (approximately 749,000 cases) in 2008
(3). Chronic infections of
hepatitis B virus (HBV) and hepatitis C virus (HCV), excessive
alcohol consumption, tobacco smoking, aflatoxin B1 (AFB1) and
diabetes are reported to be associated with an increased risk of
HCC (4–10). Among these known or suspected risk
factors, single nucleotide polymorphisms (SNPs) may also play a
significant role in infectious and non-infectious pathways
associated with HCC (11–14). SNPs of oncogenes and anti-oncogenes
may alter the gene expression level and are functionally associated
with HCC and other forms of liver disease (15).
The common disease-common variant (CD-CV) hypothesis
holds that the genetic risk factors that contribute the most to the
risk of disease are likely to be commonly occurring polymorphisms
(16). Linkage disequilibrium (LD)
mapping appears to be a reasonable approach to narrow down the
number of potential risk genes or variants for the disease
(17). The International HapMap
Project (18,19) (www.hapmap.org)
provides a systematic framework of LD and haplotype structure for
common SNPs. Haplotype-tagging single nucleotide polymorphisms
(htSNPs) can be selected from the International HapMap database for
genome-wide association studies (20). The htSNPs act as a minimal set of
highly informative SNP markers that capture 95% of the common
haplotype diversity of the genome.
CIP2A, also termed p90, was originally identified by
Soo Hoo et al (21).
Findings of our previous studies suggested that p90 was a novel
cytoplasmic cancer autoantigen, and demonstrated that
autoantibodies to p90 protein were found in 21% of HCC patients
(21,22). The function of p90 remained unknown
until 2007 when Junttila et al (23) reported that p90 possessed oncogenic
activity by inhibiting the tumor suppressor protein phosphatase 2A
(PP2A) and stabilizing c-myc in human malignancies. These authors
proposed renaming p90 to cancerous inhibitor of PP2A (CIP2A). Their
results suggested that CIP2A may be an endogenous interaction
partner for the PP2A complex. Moreover, the data showed that amino
acids between 461 and 533 on CIP2A appeared to be necessary for the
interaction. However, the association of CIP2A variants and HCC
susceptibility has not been investigated. The aim of our study was
to test the association of CIP2A gene polymorphisms and HCC
susceptibility using the HapMap database in the Chinese Han
population. We attempted to identify sufficient SNPs to tag all the
common haplotypes across a 39.776 kb region encompassing the CIP2A
gene.
Materials and methods
Clinical data
This hospital-based case-control study comprised 233
HCC cases and 280 cancer-free controls. From September 2009 to
December 2010, cases were consecutively selected and enrolled from
patients in the Department of General Surgery, the Department of
Oncology and the Department of Hepatology and Infectious Diseases
at the First Affiliated Hospital of Zhengzhou University, China.
All cases were diagnosed as primary HCC and had not received
previous treatment of chemotherapy or radiotherapy. Controls were
randomly selected from patients who attended the same hospital for
an annual physical examination. In the control group, cancer-free
status was ensured following detailed questioning by doctors.
Randomly selected controls were matched with the HCC patients on
age (±5 years), gender and ethnicity. None of the subjects had any
biological relationship with each other. The covariate data were
obtained from questionnaires which included the following aspects:
a) demographic data including age and gender; b) smoking and
drinking history; and c) family history of liver cancer. Stratified
analysis was performed according to the drinking and smoking
history (Table I). The hepatitis B
surface antigen (HBsAg) or antibodies to hepatitis C virus
(anti-HCV) detection data were obtained by clinical examination.
Study protocols were approved by the ethics committee of Zhengzhou
University and all participants provided written informed
consent.
 | Table ISelected characteristics distribution
in cases and controls. |
Table I
Selected characteristics distribution
in cases and controls.
| Variables | Cases, N (%) | Controls, N (%) | OR (95% CI)a | P-value |
|---|
| Mean age (SD) | 54.9 (12.65) | 54.9 (12.67) | | 0.79 |
| Gender (%) |
| Male | 156 (67.0) | 181 (64.6) | | 0.67 |
| Female | 77 (33.0) | 99 (35.4) | | |
| Alcohol drinking per
day |
| Never | 151 (64.8) | 216 (77.1) | Ref | |
| Ever | 82 (35.2) | 64 (22.9) | 1.85
(1.21–2.76) | <0.01b |
| Drinks per day |
| None | 151 (64.8) | 216 (77.1) | Ref | |
| 0–2 | 26 (11.2) | 19 (6.8) | 1.98
(1.09–3.76) | 0.03b |
| >2 | 56 (24.0) | 45 (16.1) | 1.83
(1.16–2.95) | 0.01b |
|
Ptrend | | | | <0.01b |
| Smoking
history |
| Never | 123 (52.8) | 179 (63.9) | Ref | |
| Ever | 110 (47.2) | 101 (36.1) | 1.64
(1.23–2.39) | 0.01b |
| Packs per year |
| None | 123 (52.8) | 179 (63.9) | Ref | |
| <20 | 12 (5.2) | 26 (9.3) | 0.69
(0.35–1.42) | 0.28 |
| 20–40 | 25 (10.7) | 24 (8.6) | 0.66
(0.48–1.37) | 0.18 |
| ≥40 | 73 (31.3) | 51 (18.2) | 2.18
(1.41–3.23) | <0.01b |
|
Ptrend | | | | <0.01b |
| HBV/HCV
infection |
|
HBsAg−/Anti-HCV− | 115 (49.4) | 249 (88.9) | Ref | |
|
HBsAg+/Anti-HCV+ | 118 (50.6) | 31 (11.1) | 8.34
(4.54–12.97) | <0.01b |
| Family history |
| Yes | 49 (21.0) | 21 (7.5) | Ref | |
| No | 184 (79.0) | 259 (92.5) | 3.35
(1.98–5.76) | <0.01b |
Definition of smoking history and alcohol
drinking
Smoking history was categorized into four levels:
never (non-smoker or <1 pack/year), low (<20 packs/year),
moderate (20–40 packs/year) and high (≥40 packs/year). Drinking
history was categorized into three levels: never (non-drinker or
<1 drink per day), 0–2 alcoholic drinks per day and >2
alcoholic drinks per day. Following the criteria defined by the
National Institute on Alcohol Abuse and Alcoholism in the United
States, one standard drink of alcohol was defined as any alcoholic
beverage containing 14 g of pure alcohol.
SNP selection
HtSNPs from the HapMap database (http://www.hapmap.org, HapMap Data Rel 27 Phase
II+III, Feb09, on NCBI B36 assembly, dbSNP b126) were selected
using tagger pairwise selection approaches using TagSNPs software
online, with an r2 cutoff of 0.8 and a minor allele
frequency cutoff of 0.05 in the database of Han Chinese in Beijing.
HapMap data on 11 SNPs revealed that two htSNPs tagged two common
haplotypes that spanned the CIP2A region: rs2278911 (exon 6
C/T), and rs4855656 (intron 2 G/A). rs2278911
demonstrated a CGA-to-CAA mutation in codon 229, leading to the
amino acid substitution of an Arginine for a Glutamine.
Genotyping
The DNA isolation kit (Dingguo Biotechnology Co.,
Ltd., Beijing, China) was used to extract the genomic DNA from 1 ml
peripheral blood sample. The rs2278911 genotypes of all
subjects were detected using the polymerase chain
reaction-restriction fragment length polymorphism (PCR-RFLP)
method. Primers were designed and synthesized by Beijing SBS
Genetech Co., Ltd. The sequences were as follows: rs2278911,
5′-CCA TCA CCG TTT ATG AGA AT-3′ (forward) and 5′-CTT GTT GGC CCA
TAG TAG TT-3′ (reverse). A thermocycler was used to perform PCR on
rs2278911, as follows: 95°C for 5 min, 35 cycles of 95°C for
30 sec, 54°C for 40 sec, 72°C for 45 sec and extension at 72°C for
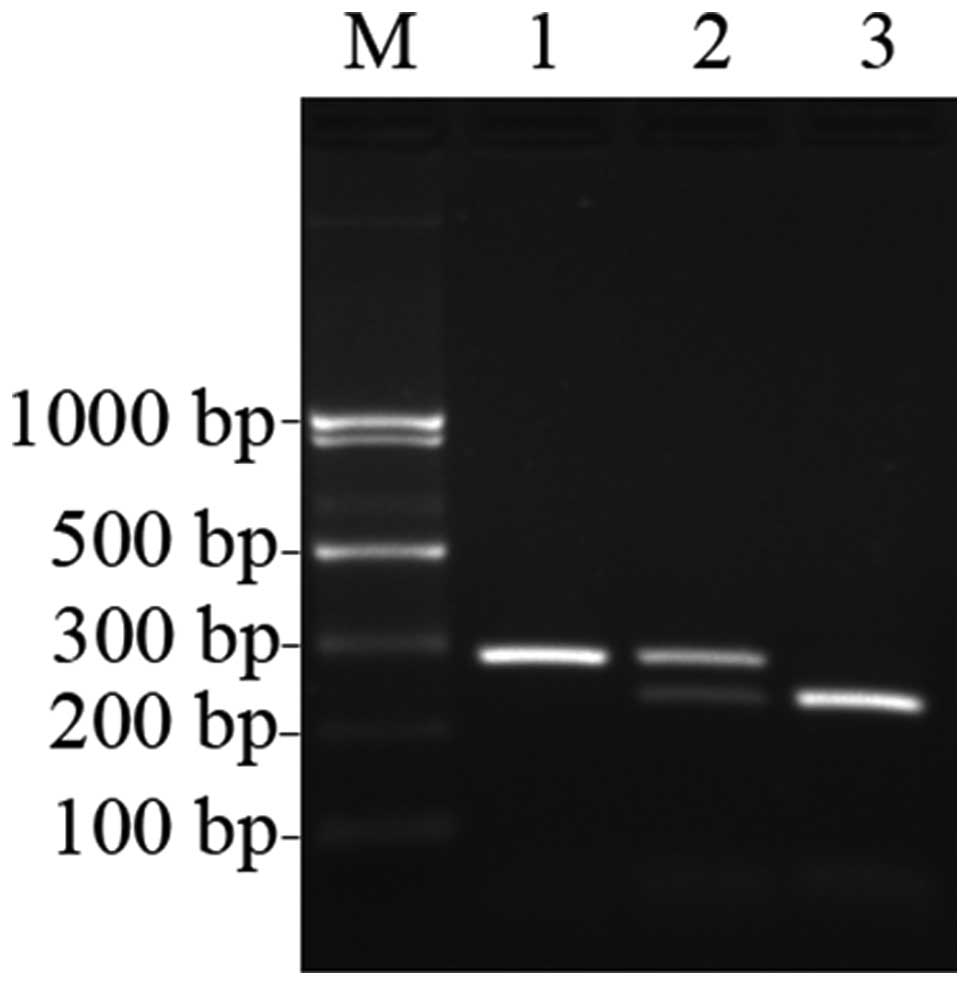
10 min. The PCR products were then digested by restriction enzyme
TaqI (Takara Biotechnology Co., Ltd.) at 65°C overnight. The
digested products were subsequently separated using 2% agarose gel
electrophoresis, stained with ethidium bromide and visualized under
ultraviolet light. Three different patterns of bands were observed:
a single band 295 bp in length indicated the TT genotype in which
the PCR products of rs2278911 were not digested; three bands
of 295, 241 and 54 bp indicated the TC genotype in which the
products were only partially digested; and two bands of 241 and 54
bp indicated the CC genotype in which the products were completely
digested (Fig. 1). Negative
controls (no template controls) and controls of known genotypes
were included in the assay. Repeated genotyping of 20% randomly
selected samples yielded identical results.
Genotyping of CIP2A rs4855656 was performed
using allele-specific PCR (AS-PCR). AS-PCR is a simple, rapid and
reliable method for detecting any mutation involving a single base
change or small deletions. Based on the SNPs in the genome, the
AS-PCR primers were designed with specific mismatches at the 3′ end
that allowed preferential amplification of one allele relative to
another on account of the primers being complementary to the SNP
site (24). Additional deliberate
mismatches should normally be introduced at the penultimate base of
the AS-PCR primer to increase the specificity of the AS-PCR
reaction. Since different mismatches have been found to have
different destabilizing effects, it was necessary to consider both
terminal and penultimate mismatches together. If the
mutation-induced terminal mismatch was strong, a weak additional
mismatch should be selected, and vice versa (25). Primers were designed and synthesized
by Beijing SBS Genetech Co., Ltd. The sequences were as follows:
rs4855656: 5′-GA AGA GTT TTA TGT AAA CCC CGT A-3′ (forward
for A allele), 5′-A AGA GTT TTA TGT AAA CCC CGT G-3′ (forward for G
allele) and 5′-TGA ATT AGC ATA GGC TCC AGA A-3′ (common reverse
primer). Then, each DNA sample was run in two separate reactions,
one for each allele. One tube (one tube = one reaction) contained
the forward primer for the A allele and the reverse primer, and the
other contained the forward primer for the G allele and the reverse
primer. PCR was performed as follows: 95°C for 5 min, 35 cycles of
95°C (30 sec), 53°C (forward primer for A allele and the reverse
primer) and 52°C (forward primer for G allele and the reverse
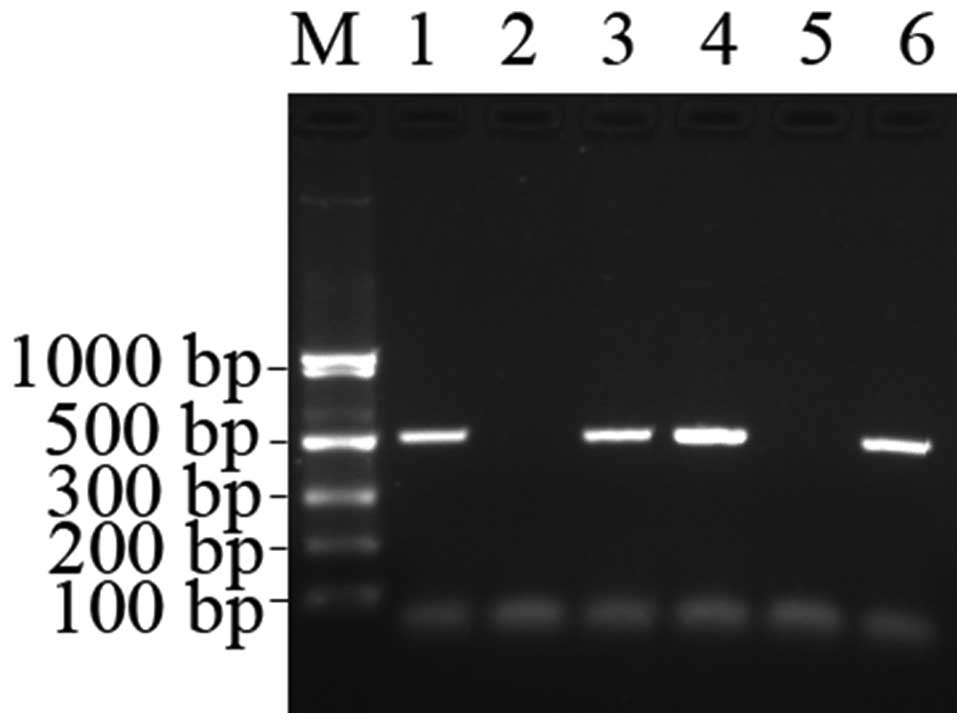
primer) (40 sec), 72°C (40 sec) and extension at 72°C for 10 min.
The SNPs were detected according to the presence and absence of the
PCR products on 1% agarose gel. The product was 514 bp in length
(Fig. 2). The sequencing of certain
randomly selected samples was performed and identical genotypes
were obtained. Overall, the genotyping success rate was 100%.
Statistical analysis
The Hardy-Weinberg equilibrium equation was used to
determine whether the proportion of each genotype obtained was in
agreement with the expected values as calculated from the allele
frequencies. The Chi-square test was used to examine the
differences in demographic variables. The Student's t-test was used
to compare the mean ages of cases and controls. Unconditional
logistic regression analysis was used to estimate the odds ratio
(OR) and its 95% confidence interval (CI) as a measure of the
association between the different genotypes and the risk of HCC.
SNPHAP software was used to analyze the haplotypes of
rs2278911 and rs485565. We examined the potential
interaction effects between different genotypes of the two htSNPs
and other risk factors on HCC risk. To assess whether the combined
effect of two factors on HCC was greater than the individual
effects, we used the method described by Rothman (26). Under the null hypothesis of
additivity, the synergy index (S) proposed by Rothman would take on
the value 1. The P-value of S, which is <0.05, is indicative of
a statistically significant synergistic effect between the two
factors.
P-values were two sided and P<0.05 was considered
to indicate a statistically significant result. Data analysis was
performed using Statistical Product and Service Solutions software
(version 15.0, SPSS, Inc., Chicago, IL, USA) unless otherwise
specified.
Results
Demographic characteristics
The distribution of demographic characteristics
among the cases and controls is shown in Table I. The mean age of the HCC patients
was 54.9±12.65 years [mean ± standard deviation (SD)] and that of
the controls was 54.9±12.67 years (mean ± SD, P=0.79), indicating
that there was no difference between the two groups. Males
comprised 67.0% of the HCC cases and 64.6% of the control group
(P=0.67). Compared with alcohol non-drinkers, subjects who drank
0–2 standard drinks of alcohol per day had an OR value of 1.98 (95%
CI, 1.09–3.76), while subjects who drank more than 2 standard
drinks of alcohol per day had an OR value of 1.83 (95% CI,
1.16–2.95). The OR value was found to rise with the increase of the
alcohol dose (Ptrend<0.01). Similarly,
a clear association was observed between smoking history and the
risk of HCC. Taking non-smokers as a reference, subjects who smoked
more than 40 packs per year had an OR value of 2.18 (95% CI,
1.41–3.23). The OR value was elevated with the increase of the
smoking dose (Ptrend<0.01). Chronic HBV
and HCV infection markers, HBsAg+ and anti-HCV+ were more prevalent
among HCC cases than controls, with an OR value of 8.34 (95% CI,
4.54–12.97). Family history of HCC was also associated with HCC,
with an OR value of 3.35 (95% CI, 1.98–5.76).
Genotype frequencies and HCC risk
The distribution of genotype frequencies of CIP2A
polymorphisms in HCC cases and controls is shown in Table II. The genotype distribution of
rs2278911 and rs4855656 in the cases and controls did
not deviate from the expected Hardy-Weinberg equilibrium
(rs2278911, P=0.22; rs4855656, P=0.89). No
differences were found in the genotype frequencies in either of the
SNPs between the case group and control group. Compared with the TT
genotype of rs2278911, no obvious association was found
between the TC or CC genotype and the risk of HCC (TC genotype:
OR=1.08; 95% CI, 0.64–1.59; CC genotype: OR=0.98; 95% CI,
0.42–1.73). Compared with the GG homozygous genotype of
rs4855656, GA and AA genotypes showed no statistical
difference between the two groups (GA genotype: OR=0.64; 95% CI,
0.32–1.04; AA genotype: OR=1.68; 95% CI, 0.94–2.83).
| Table IIFrequencies of genotypes for two
htSNPs of CIP2A and the risk of HCC. |
Table II
Frequencies of genotypes for two
htSNPs of CIP2A and the risk of HCC.
| Locus genotype | Cases, N (%) | Controls, N
(%) | OR (95% CI)a |
|---|
|
rs2278911 |
| TT | 78 (33.5) | 101 (36.1) | Ref |
| TC | 117 (50.2) | 126 (45.0) | 1.08
(0.64–1.59) |
| CC | 38 (16.3) | 53 (18.9) | 0.98
(0.42–1.73) |
| C carriers | 155 (66.5) | 179 (63.9) | 1.56
(0.98–2.12) |
|
rs4855656 |
| GG | 134 (57.5) | 152 (54.3) | Ref |
| GA | 75 (32.2) | 108 (38.6) | 0.64
(0.32–1.04) |
| AA | 24 (10.3) | 20 (7.1) | 1.68
(0.94–2.83) |
| A carriers | 99 (42.5) | 128 (45.7) | 1.19
(0.85–1.94) |
Haplotype analysis
As shown in Table
III, there were four possible haplotypes in total and no
significant difference was found in the distribution of haplotypes
between the cases and controls. The CA, CG and TA haplotypes were
not risk factors for HCC when using the haplotype and using TG as
the reference (CA, P=0.85; CG, P=0.95; TA, P=0.80).
| Table IIIrs2278911 and rs4855656
haplotype analysis using SNPHAP software. |
Table III
rs2278911 and rs4855656
haplotype analysis using SNPHAP software.
| Haplotype | Structure | Cases, N (%) | Controls, N
(%) | Total (%) | OR (95% CI) | P-value |
|---|
| Hap1 | TG | 269 (57.7) | 322 (57.5) | 591 (57.6) | 1.0 | |
| Hap2 | CA | 117 (25.1) | 144 (25.7) | 261 (25.4) | 0.97
(0.73–1.30) | 0.85 |
| Hap3 | CG | 76 (16.3) | 90 (16.1) | 166 (16.2) | 1.01
(0.72–1.43) | 0.95 |
| Hap4 | TA | 4 (0.9) | 4 (0.7) | 8 (0.8) | 1.20
(0.30–4.83) | 0.80 |
| Total (%) | | 466 (100.0) | 560 (100.0) | 1,026 (100.0) | | |
The interactions of rs2278911 genotypes
and other risk factors
Table IV shows the
possible interactions between rs2278911 genotypes and other
risk factors. An interaction between hepatitis infection (HBV and
HCV) and the C carriers (TC or CC) of rs2278911 was
observed, with an S of 3.72 (P=0.03). Among the hepatitis virus
infection (HBV and HCV)-positive group, an increased risk of HCC
was found with the presence of the C carriers (TC or CC) of
rs2278911 (OR=12.35; 95% CI, 4.93–19.87). When evaluating
the interactions of alcohol drinking and genotypes, we used
non-drinkers with the TT genotype as the reference. No interaction
between alcohol drinking and genotypes of rs2278911 was
observed, with an S of 1.74 (P=0.34). For smoking history, we used
non-smokers with the TT genotype as the reference. No obvious
interactions were found between the genotypes of rs2278911
and tobacco consumption (S=0.52; P=0.76).
| Table IVInteractions between rs2278911
genotypes and other risk factors. |
Table IV
Interactions between rs2278911
genotypes and other risk factors.
| Risk factors | Genotype | Cases N (%) | Controls N (%) | OR (95% CI)a | Synergy
indexb (S) | P-value |
|---|
| Alcohol
drinking |
rs2278911 | | | | | |
| Never | TT | 60 (25.8) | 85 (30.4) | Ref | | |
| Never | TC or CC | 91 (39.1) | 131 (46.8) | 0.96
(0.62–1.50) | | |
| Ever | TT | 18 (7.7) | 16 (5.7) | 1.57
(0.75–3.39) | | |
| Ever | TC or CC | 64 (27.5) | 48 (17.1) | 1.92
(1.17–3.12) | 1.74 | 0.34 |
| Smoking
history |
rs2278911 | | | | | |
| Never | TT | 42 (18.0) | 68 (24.3) | Ref | | |
| Never | TC or CC | 81 (34.8) | 111 (39.6) | 1.29
(0.67–1.95) | | |
| Ever | TT | 36 (15.5) | 33 (11.8) | 1.83
(0.76–3.42) | | |
| Ever | TC or CC | 74 (31.8) | 68 (24.3) | 1.58
(0.93–2.39) | 0.52 | 0.76 |
| HBV/HCV
infection |
rs2278911 | | | | | |
| No | TT | 45 (19.3) | 85 (30.4) | Ref | | |
| No | TC or CC | 70 (30.0) | 164 (58.6) | 0.69
(0.35–1.58) | | |
| Yes | TT | 33 (14.2) | 16 (5.7) | 4.36
(1.94–8.62) | | |
| Yes | TC or CC | 85 (36.5) | 15 (5.3) | 12.35
(4.93–19.87) | 3.72 | 0.03 |
The interactions of rs4855656 genotypes
and other risk factors
Table V shows the
possible interactions between rs4855656 genotypes and other
risk factors. No obvious interactions were observed between alcohol
drinking, smoking history and hepatitis infection (HBV and HCV) and
genotypes of rs4855656. The S for interactions between
smoking history and genotypes of rs4855656, and hepatitis
infection and genotypes of rs4855656 were 3.40 and 1.66,
respectively. P>0.05 in all cases.
| Table VInteractions between rs4855656
genotypes and other risk factors. |
Table V
Interactions between rs4855656
genotypes and other risk factors.
| Risk factors | Genotype | Cases N (%) | Controls N (%) | OR (95% CI)a | Synergy
indexb (S) | P-value |
|---|
| Alcohol
drinking |
rs4855656 | | | | | |
| Never | GG | 77 (33.0) | 115 (41.1) | Ref | | |
| Never | GA or AA | 74 (31.8) | 101 (36.1) | 1.23
(0.66–1.85) | | |
| Ever | GG | 57 (24.5) | 37 (13.2) | 2.20
(1.24–3.89) | | |
| Ever | GA or AA | 25 (10.7) | 27 (9.6) | 1.53
(0.89–2.96) | 0.37 | 0.12 |
| Smoking
history |
rs4855656 | | | | | |
| Never | GG | 75 (32.2) | 96 (34.3) | Ref | | |
| Never | GA or AA | 48 (20.6) | 83 (29.6) | 0.68
(0.33–1.06) | | |
| Ever | GG | 59 (25.3) | 56 (20) | 1.42
(0.92–2.45) | | |
| Ever | GA or AA | 51 (21.9) | 45 (16.1) | 1.34
(0.65–2.27) | 3.40 0.41 | |
| HBV/HCV
infection |
rs4855656 | | | | | |
| No | GG | 69 (29.6) | 132 (47.1) | Ref | | |
| No | GA or AA | 46 (19.7) | 117 (41.8) | 0.75
(0.48–1.18) | | |
| Yes | GG | 65 (27.9) | 20 (7.1) | 6.23
(3.48–11.12) | | |
| Yes | GA or AA | 53 (22.7) | 11 (3.9) | 9.27
(4.54–18.79) | 1.66 | 0.34 |
Discussion
Two approaches have been commonly used to detect
associations between HCC and common genetic variations. First, the
hypothesis-directed approach is used to investigate functional SNPs
in coding regions since they may dysregulate the expression of
proteins (12–15). Second, the indirect approach is used
to select a set of htSNPs which are informative polymorphisms that
best characterize the haplotype diversity of a given chromosomal
region. These htSNPs serve as markers to detect associations
between a particular region and diseases, regardless of whether or
not the SNPs themselves have a functional effect (27,28).
Previous studies have mostly used the hypothesis-directed approach
to report associations between several variants and the risk of HCC
(13,14). To the best of our knowledge, this is
also the first study on CIP2A and HCC susceptibility by htSNP
strategy. We performed a study of two htSNPs in a Chinese Han
population and no obvious associations between the two individual
htSNPs and the risk of HCC were found. With the present genotype
distribution and at a significance level of 0.05, the OR values of
the TC genotype and C carriers of rs2278911 and the AA
genotype of rs4855656 were all >1, but the 95% CI ranges
all included 1.
Haplotype analysis is more sensitive and powerful
than single htSNP analysis. Additional etiological information was
obtained by analyzing combinations of the two htSNPs. Four
haplotypes were detected, TG, CA, CG and TA. However, none of the
four haplotypes were found to be associated with the risk of HCC in
our study.
Environmental risk factors and SNPs are regarded as
major pathogenic factors in HCC development (29). Excessive alcohol consumption and
hepatitis infection (HBV and HCV) are associated with HCC, and has
previously been evaluated (30,31).
An interaction was observed between HBV/HCV infection and genotypes
of rs2278911 in this study. As a result, rs2278911 C
carriers with HBV/HCV infection may exhibit increased
susceptibility to HCC. However, no such association was found for
rs4855656. This finding indicated that the HBV/HCV infection
and SNPs may have a synergistic effect. The possible mechanism may
be that rs2278911 carries a T to C point mutation at the
nucleotide position which converts the highly conserved 229 amino
acid from Arginine to Glutamine, which may dysregulate the
expression of CIP2A. Hepatitis infection may accelerate the process
of this change and eventually trigger the occurrence and promote
the development of HCC. The above-mentioned process may provide an
explanation for the manner in which such environmental risk factors
and the rs2278911 polymorphism may have a combined effect on
HCC. However, the exact mechanism underlying the development of HCC
remains to be investigated.
Our study has certain limitations. One is that in
the HapMap database, common CIP2A haplotypes were tagged by two
SNPs. The one SNP per 20 kb density available for CIP2A in HapMap
may therefore be insufficient for the identification of
disease-predisposing variants. The other limitation of this study
is the relatively small sample size, which may have prevented the
adequate tagging of disease-predisposing variants.
In conclusion, the present study suggests that
genetic variation in the CIP2A gene alone is not associated with
the risk of HCC. However, HBV/HCV infection may enhance the risk of
HCC in C carriers (TC or CC) of rs2278911 in the Chinese Han
population. Further studies using a larger sample size are required
for validation.
Acknowledgements
This study was supported by grants from the National
Natural Science Foundation of China (Nos. 30872962 and 81172086).
We thank all the participants who contributed to this study, and
all the collaborators who conducted the collection of samples and
clinical information.
References
|
1
|
El-Serag HB and Rudolph KL: Hepatocellular
carcinoma: Epidemiology and molecular carcinogenesis.
Gastroenterology. 1329:2557–2576. 2007. View Article : Google Scholar
|
|
2
|
Asia-Pacific Working Party on Prevention
of Hepatocellular Carcinoma. Prevention of hepatocellular carcinoma
in the Asia-Pacific region: consensus statements. J Gastroenterol
Hepatol. 25:657–663. 2010. View Article : Google Scholar : PubMed/NCBI
|
|
3
|
International Agency for Research on
Cancer. GLOBOCAN. 2008, Geneva: WHO. Available at http://www-dep.iarc.fr/.
|
|
4
|
Mori M, Hara M, Wada I, Hara I, Yamamoto
K, Honda M and Naramoto J: Prospective study of hepatitis B and C
viral infections, cigarette smoking, alcohol consumption, and other
factors associated with hepatocellular carcinoma risk in Japan. Am
J Epidemiol. 151:131–139. 2000. View Article : Google Scholar
|
|
5
|
Yuan JM, Govindarajan S, Arakawa K and Yu
MC: Synergism of alcohol, diabetes, and viral hepatitis on the risk
of hepatocellular carcinoma in blacks and whites in the U.S.
Cancer. 101:1009–1017. 2004. View Article : Google Scholar : PubMed/NCBI
|
|
6
|
Jee SH, Ohrr H, Sull JW and Samet JM:
Cigarette smoking, alcohol drinking, hepatitis B, and risk for
hepatocellular carcinoma in Korea. J Natl Cancer Inst.
96:1851–1856. 2004. View Article : Google Scholar : PubMed/NCBI
|
|
7
|
Kuper H, Tzonou A, Kaklamani E, et al:
Tobacco smoking, alcohol consumption and their interaction in the
causation of hepatocellular carcinoma. Int J Cancer. 85:498–502.
2000. View Article : Google Scholar : PubMed/NCBI
|
|
8
|
Marrero JA, Fontana RJ, Fu S, Conjeevaram
HS, Su GL and Lok AS: Alcohol, tobacco and obesity are synergistic
risk factors for hepatocellular carcinoma. J Hepatol. 42:218–224.
2005. View Article : Google Scholar : PubMed/NCBI
|
|
9
|
Zhang JY, Dai M, Wang X, et al: A
case-control study of hepatitis B and C virus infection as risk
factors for hepatocellular carcinoma in Henan, China. Int J
Epidemiol. 27:574–578. 1998. View Article : Google Scholar : PubMed/NCBI
|
|
10
|
Zhang JY, Wang X, Han SG and Zhuang H: A
case-control study of risk factors for hepatocellular carcinoma in
Henan, China. Am J Trop Med Hyg. 59:947–951. 1998.PubMed/NCBI
|
|
11
|
Budhu A and Wang XW: The role of cytokines
in hepatocellular carcinoma. J Leukoc Biol. 80:1197–1213. 2006.
View Article : Google Scholar : PubMed/NCBI
|
|
12
|
Giacalone A, Montalto G, Giannitrapani L,
et al: Association between single nucleotide polymorphisms in the
cyclooxygenase-2, tumor necrosis factor-α, and vascular endothelial
growth factor-A genes, and susceptibility to hepatocellular
carcinoma. OMICS. 15:193–196. 2011.
|
|
13
|
Li S, Deng Y, Chen ZP, et al: Genetic
polymorphism of interleukin-16 influences susceptibility to
HBV-related hepatocellular carcinoma in a Chinese population.
Infect Genet Evol. 11:2083–2088. 2011. View Article : Google Scholar : PubMed/NCBI
|
|
14
|
Chinen MH, Yeh CB, Li YC, et al:
Relationship of interleukin-8 gene polymorphisms with
hepatocellular carcinoma susceptibility and pathological
development. J Surg Oncol. 104:798–803. 2011. View Article : Google Scholar : PubMed/NCBI
|
|
15
|
Sümbül AT, Akkiz H, Bayram S, Bekar A,
Akqöllü E and Sandıkçı M: p53 codon 72 polymorphism is associated
with susceptibility to hepatocellular carcinoma in the Turkish
population: a case-control study. Mol Biol Rep. 39:1639–1647.
2012.PubMed/NCBI
|
|
16
|
Chakravarti A: Population genetics -
making sense out of sequence. Nat Genet. 21:56–60. 1999. View Article : Google Scholar : PubMed/NCBI
|
|
17
|
Ikeda M, Iwata N, Kitajima T, Suzuki T,
Yamanouchi Y, Kinoshita Y and Ozaki N: Positive association of the
serotonin 5-HT7 receptor gene with schizophrenia in a Japanese
population. Neuropsychopharmacology. 31:866–871. 2006. View Article : Google Scholar : PubMed/NCBI
|
|
18
|
The International HapMap Consortium. A
haplotype map of the human genome. Nature. 437:1299–1320. 2005.
View Article : Google Scholar
|
|
19
|
International HapMap Consortium. Frazer
KA, Ballinqer DG, et al: A second generation human haplotype map of
over 3.1 million SNPs. Nature. 449:851–861. 2007. View Article : Google Scholar : PubMed/NCBI
|
|
20
|
de Bakker PI, Burtt NP, Graham RR, et al:
Transferability of tag SNPs in genetic association studies in
multiple populations. Nat Genet. 38:1298–1303. 2006.PubMed/NCBI
|
|
21
|
Soo Hoo L, Zhang JY and Chan EK: Cloning
and characterization of a novel 90 kDa ‘companion’ auto-antigen of
p62 overexpressed in cancer. Oncogene. 21:5006–5015. 2002.
|
|
22
|
Zhang JY, Wang X, Peng XX and Chan EK:
Autoantibody responses in Chinese hepatocellular carcinoma. J Clin
Immunol. 22:98–105. 2002. View Article : Google Scholar : PubMed/NCBI
|
|
23
|
Junttila MR, Puustinen P, Niemelä M, et
al: CIP2A inhibits PP2A in human malignancies. Cell. 130:51–62.
2007. View Article : Google Scholar : PubMed/NCBI
|
|
24
|
Ye S, Dhillon S, Ke X, Collins AR and Dav
IN: An efficient procedure for genotyping single nucleotide
polymorphisms. Nucleic Acids Res. 29:E88–8. 2001. View Article : Google Scholar : PubMed/NCBI
|
|
25
|
Little S: Amplification-refractory
mutation system (ARMS) analysis of point mutations. Curr Protoc Hum
Genet. Chapter 9(Unit 9): 82001.PubMed/NCBI
|
|
26
|
Rothman KJ: The estimation of synergy or
antagonism. Am J Epidemiol. 103:506–511. 1976.PubMed/NCBI
|
|
27
|
Han W, Kang D, Lee JE, et al: A haplotype
analysis of HER-2 gene polymorphisms: association with breast
cancer risk, HER-2 protein expression in the tumor, and disease
recurrence in Korea. Clin Cancer Res. 11:4775–4778. 2005.
View Article : Google Scholar : PubMed/NCBI
|
|
28
|
Hu Z, Xu L, Shao M, et al: Polymorphisms
in the two helicases ERCC2/XPD and ERCC3/XPB of the transcription
factor IIH complex and risk of lung cancer: a case-control analysis
in a Chinese population. Cancer Epidemiol Biomarkers Prev.
15:1336–1340. 2006. View Article : Google Scholar : PubMed/NCBI
|
|
29
|
Kirk GD, Bah E and Montesano R: Molecular
epidemiology of human liver cancer: insights into etiology,
pathogenesis and prevention from The Gambia, West Africa.
Carcinogenesis. 27:2070–2082. 2006. View Article : Google Scholar : PubMed/NCBI
|
|
30
|
Brechot C, Kremsdorf D, Soussan P, Pineau
P, Dejean A, Paterlini-Brechot P and Tiollais P: Hepatitis B virus
(HBV)-related hepatocellular carcinoma (HCC): molecular mechanisms
and novel paradigms. Pathol Biol (Paris). 58:278–287. 2010.
View Article : Google Scholar : PubMed/NCBI
|
|
31
|
Koike K: Hepatitis C virus contributes to
hepatocarcinogenesis by modulating metabolic and intracellular
signaling pathways. J Gastroenterol Hepatol. 22:S108–S111. 2007.
View Article : Google Scholar : PubMed/NCBI
|