Introduction
Reduced glutathione (GSH), a ubiquitous tripeptide
thiol, is a vital intracellular and extracellular protective
antioxidant, which plays a number of key and/or crucial roles in
the control of signalling processes, detoxifying certain
xenobiotics and heavy metals, as well as other functions. It is a
tripeptide composed of cysteine, glutamic acid and glycine.
Intracellular and whole blood concentrations of GSH are in the
milimolar range, while the plasma concentration is in the
micromolar range and accounts for approximately 0.4% of total blood
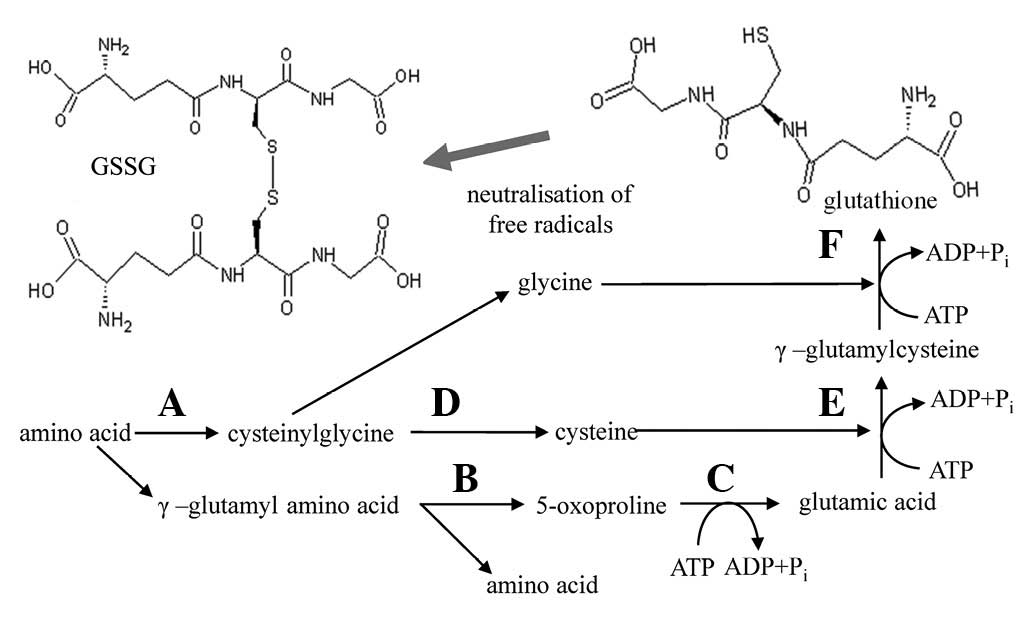
GSH (1–5). The GSH synthesis and metabolism
pathway is shown in Fig. 1. GSH is
synthesised in the cell by γ-glutamylcysteine synthetase (γ-GCS)
and glutathione synthetase (6). The
γ-GCS-catalysed formation of γ-glutamylcysteine is the first and
rate-limiting step in de novo GSH synthesis and is
feedback-inhibited by GSH, a mechanism that is central to the
regulation of cellular GSH concentrations (7). Thus, cysteine is a rate-limiting
substrate for de novo GSH synthesis (8).
Within cells, total GSH exists free and bound to
proteins. Since the enzyme glutathione reductase, which reverts
free glutathione from its oxidised form (GSSG) is constitutively
active and inducible upon oxidative stress, free glutathione exists
almost exclusively in its reduced form. The ratio of reduced to
oxidised glutathione within cells is often used as a marker of
cellular toxicity (9–12). Under normal conditions, the GSH
redox couple is well-known to be present in mammalian cells in the
concentration range of 1–10 mM. In a resting cell, the molar
GSH:GSSG ratio exceeds 100:1, while in various models of oxidative
stress, this ratio has been demonstrated to decrease to values of
10:1 and even 1:1 (13).
Oxidative stress is manifested by the excessive
production of reactive oxygen species (ROS) in the face of
insufficient or defective antioxidant defence systems. Oxidative
stress causes profound alterations of various biological
structures, including cellular membranes, lipids, proteins and
nucleic acids. Oxidative stress is considered to be involved in
ageing (14–20) and in various diseases, including
diabetes mellitus (21–23), atherosclerosis (24,25),
rheumatoid arthritis (26–29), Alzheimer’s disease (30–32),
Parkinson’s disease (33–35) and cancer (36–44).
There is an increasingly growing interest in identifying biomarkers
for diseases, in which oxidative stress is involved (45).
For many years, GSH has been measured by several
analytical methods. In particular, high performance liquid
chromatography (HPLC) with various detection techniques including
ultraviolet (UV) absorbance and fluorescence detection, mass
spectrometry and/or electrochemical detection (ED) are commonly
used for determination of GSH and GSSG concentrations (46–49).
Each method has its advantages and limitations and may serve a
particular need in analysis (50).
ED is an attractive alternative method for electroactive species
detection, due to its inherent advantages of simplicity, ease of
miniaturisation, high sensitivity and relatively low cost. The aim
of this study was to determine the GSH:GSSG ratio in the blood
serum of paediatric cancer patients to use this ratio as a
potential marker of oxidative stress. For determination of the
GSH:GSSG ratio, HPLC-ED was optimised and used.
Material and methods
Chemicals and pH measurements
GSH, GSSG and trifluoroacetic acid (TFA) were
purchased from Sigma-Aldrich (St. Louis, MO, USA). HPLC-grade
methanol (>99.9%; v/v) was obtained from Merck KGaA (Darmstadt,
Germany). Other chemicals were purchased from Sigma-Aldrich unless
otherwise stated. Stock standard solutions of the thiols (1
mg.ml−1) were prepared with ACS water (Sigma-Aldrich)
and stored at −20°C in the dark. Working standard solutions were
prepared daily by diluting the stock solutions. All solutions were
filtered through 0.45-μm nylon filter discs (Millipore,
Billerica, MA, USA) prior to HPLC analysis. The pH value was
measured using WTW inoLab Level 3 with terminal Level 3 (WTW GmbH,
Weilheim, Germany).
HPLC-ED analysis
The HPLC-ED system consists of two chromatographic
pumps (Model 582; ESA, Inc., Chelmsford, MA, USA; working range
0.001–9.999 ml/min), a chromatographic column with reverse phase
Zorbax eclipse AAA C18 (Agilent Technologies, Inc., Santa Clara,
CA, USA; 150x4.6 mm; 3.5-μm particles) and a twelve-channel
CoulArray electrochemical detector (Model 5600A; ESA, Inc.). The
detector consists of three flow analytical chambers (Model 6210;
ESA, Inc.). Each chamber contains four analytical cells and one
analytical cell contains two referent (hydrogen-palladium), as well
as two counters and porous graphite working electrodes. The ED is
situated in the thermostated control module. A 20 μl sample
was injected using an autosampler (Model 542; ESA, Inc.), which has
thermostated space for the column. The column was termostated at
35°C. Other conditions were optimised and are described later.
Determination of recovery in real
samples
Recovery of GSH and GSSG were evaluated with
homogenates spiked with standards according to Causon (50). Prior to extraction, 100 μl
GSH and GSSG was added to the blood serum homogenate. Homogenates
were blindly assayed and the concentration of GSH and GSSG was
derived from the calibration curves. The spiking of GSH and GSSG
was determined as a standard measured in the absence of real
sample. Accuracy was evaluated by comparing the estimated
concentration with the known concentrations of both thiols.
Human blood serum
Blood samples were obtained from 116 children
hospitalised at the Department of Paediatric Haematology and
Oncology (Faculty Hospital Motol, Prague, Czech Republic) with
newly diagnosed solid tumours of neuroblastoma (n=27),
nephroblastoma (n=8), anaplastic ependymoma (n=4), Ewing’s sarcoma
(n=9), germ cell tumour (n=4), osteosarcoma (n=16), tumour of the
genital tract (n=6), Hodgkin’s lymphoma (n=16), lymphadenopathy
(n=3), medulloblastoma (n=15), rhabdomyosarcoma (n=4) and
retinoblastoma (n=4). The study was approved by the ethics
committee of Faculty Hospital Motol, Prague, Czech Republic.
Written informed patient consent was obtained from the patients.
Subjects ranged between 1 and 10 years of age. The blood samples
were collected before chemotherapy and radiotherapy. Serum was
separated by centrifugation at 4,000 × g for 10 min (Model 5402;
Eppendorf AG, Hamburg, Germany), and the samples were stored at
−80°C until assayed. When required, the denatured samples were
centrifuged at 15,000 x g at 4°C for 30 min (Model 5402; Eppendorf
AG) and directly analysed using an optimised HPLC-ED method.
Descriptive statistics
Data were processed using Microsoft Excel (USA).
Results are expressed as mean ± standard deviation (SD) unless
otherwise stated. The detection limits [3 signal/noise (S/N)] were
calculated according to Long and Winefordner (51), while N was
expressed as the SD of noise determined in the signal domain unless
otherwise noted.
Results
Optimisation of HPLC-ED method
Primarily, it was necessary to optimise the
separation and subsequent ED in order to achieve the required
accuracy and sensitivity for the determination of GSH and GSSG in
real blood serum samples. Therefore, we focused on studying the
influence of flow rate, concentration of components of the mobile
phase, elution and applied potential of the working electrodes on
GSH and GSSG signals.
Flow rate
The mobile phase flow rate is an important parameter
influencing the electrochemical response of the detector. When
using a chromatographic column Zorbax Eclipse AAA, optimum mobile
phase flow rate was 1 ml/min at pressures of 130 bars.
Additionally, we identified that if the flow >1 ml/min, the
responses of GSH and GSSG decreased by >10%. This is probably
caused by reducing the time-concentration of the analyte on the
electrode surface. Even with a lower flow rate, a decreased signal
occurred compared with the maximum, but the total peak area
remained the same with a tolerance of 7%. Although a lower flow
rate may not be significantly affected by resolution, it may extend
the period of separation, which is critical for analysing a large
number of clinical samples. Therefore, we decided to use 1 ml/min
as the optimum flow rate of the mobile phase.
Influence of methanol on ED
Achieving an optimal resolution is crucial for
simultaneous separation of analytes. In order to separate all
determined substances in the system with reversed-phase, a gradient
with the increasing content of organic solvent is required. Since
the electrochemical determination of substances contained in the
sample requires the presence of an electrolyte, we examined the
effect of the organic solvent (methanol) on the electrochemical
response of analytes. We identified that 15% content of methanol in
the mobile phase, which is the polar component of the mobile phase
composed also from 80 mM TFA, lead to more than 50% decrease in GSH
signal. A marked decline of GSSG signal was also observed. The best
ratio of 80 mM TFA and methanol in the mobile phase was 99:1
(v/v).
Optimisation of gradient
If GSH and GSSG were separated by isocratic elution
where the ratio of TFA and methanol was 99:1 (v/v), it would be the
most sensitive, but the retention times of the separated substances
would be too high. A significant tailing of peaks was observed
during the elution of compounds with higher retention under these
conditions. Therefore, we optimised the increasing content of
methanol with respect to the sensitivity of the analysis. Based on
the optimisation steps, the mobile phase, which consisted of (A) 80
mM TFA and (B) 100% methanol, was used for separation and detection
of GSH and GSSG. Compounds were eluted by following an increasing
linear gradient: 0–1 min (3% B), 1–2 min (10% B), 2–5 min (30% B)
and 15–16 min (98% B). Flow rate of the mobile phase was 1 ml/min,
and the time of one analysis inducing column regeneration was 20
min.
ED
Sensitivity of the electrochemical detector may be
more influenced by factors including the type of electrolyte in the
mobile phase, concentration, pH and, in particular, applied
potential. TFA was used as an ion-pair reagent, which provides the
best separation conditions in the parameters mentioned above, and
at a concentration of 80 mM it is also an extremely suitable
electrolyte for the detection of thiols. We further studied the
effect of the applied potential on the working electrode set
separately for GSH and GSSG, which were designed for hydrodynamic
voltammogram (HDV). Tested potentials were 100, 200, 300, 400, 500,
600, 700, 800, 900 and 1,000 mV. The responses detected at 100 mV
were negligible; however, when the potential reached 300 mV,
detectable signals for GSH and GSSG were observed. While the GSH
signal markedly increased from 600 mV, the GSSG signal markedly
increased from 700 mV. This is probably due to the requirement for
greater power for partial dissociation of the -S-S- group on the
surface of the working electrode, in comparison to the relatively
easily accessible -SH moiety of GSH. We observed the highest
signals for both compounds when a potential of 900–1,000 mV was
applied, which is evident from the HDVs showed in Fig. 2A. Based on the HDV results we were
able to evaluate that the best glutathione detection was achieved
when a potential of 900 mV was applied to the working
electrodes.
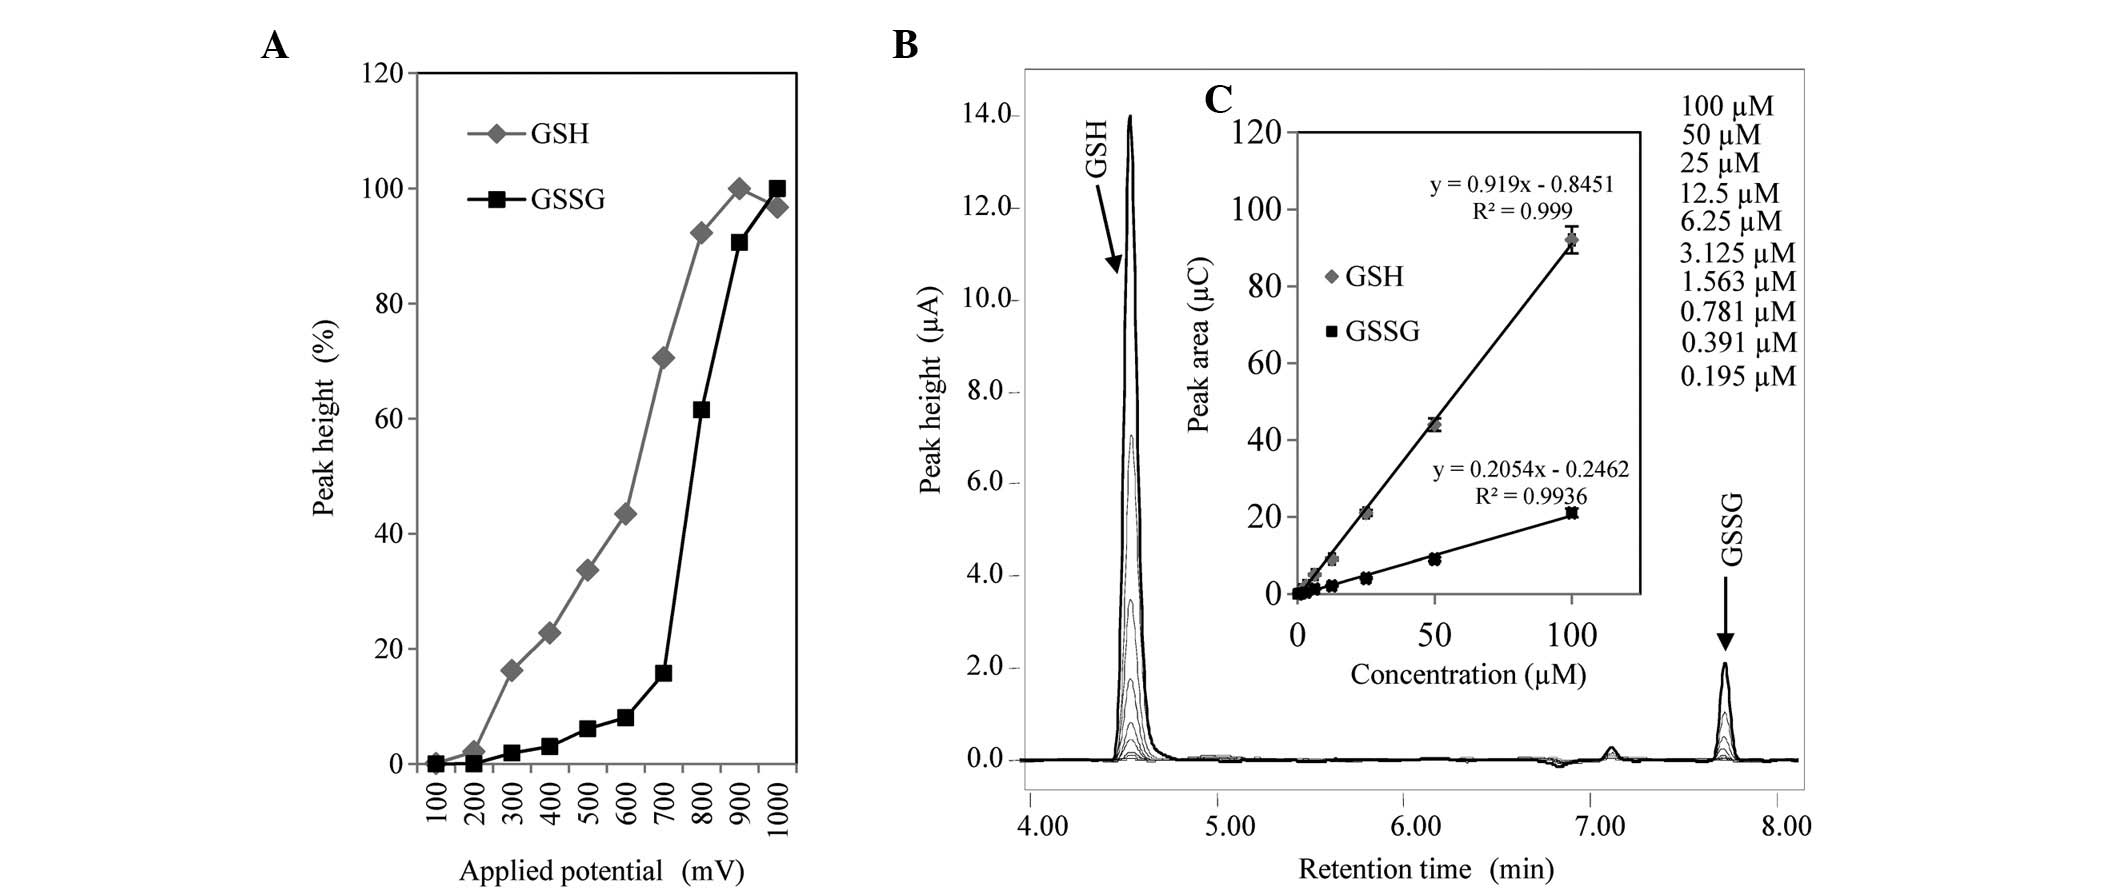 | Figure 2.(A) HDV of GSH (50 μM) and
GSSG (25 μM). (B) Overlay of typical HPL chromatograms of
GSH and GSSG within the range of 0.2–100 μM, and used for
preparation of (C) calibration curves. Experimental conditions for
the mobile phase were as follows: A, 80 mM TFA; and B, 100%
methanol. Compounds were eluted by following an increasing linear
gradient: 0-1 min (3% B), 1–2 min (10% B), 2–5 min (30% B) and
15–16 min (98% B). Flow rate of mobile phase was 1 ml/min, and an
electrode potential of 900 mV was used. GSH, reduced glutathione,
GSSG, oxidised gluathione. HDV, hydrodynamic voltammogram; HPL,
high performance liquid; TFA, trifluoroacetic acid. |
Calibration parameters
After identifying the optimal separation and
detection conditions, the calibration curves for GSH and GSSG were
measured within the concentration range of 0.2–100 μM.
Overlay of HPL chromatograms is shown in Fig. 2B, and the calibration curves are
shown in Fig. 2C. The obtained
dependences were strictly linear with R2=0.9997 for GSH
and R2=0.9936 for GSSG. Detection limits (3 S/N) were
estimated with nanomolar subunits for both substances of
interest.
Sample pretreatment for GSH:GSSG ratio
determination
Prior to chromatographic analysis, precipitation of
proteins with TFA to avoid excessive clogging of filters and
precolumns, which protect the separation column from
contaminations, was required. The proteins may interfere with
detected substances and the obtained chromatograms may be extremely
difficult to analyse. The denatured sample was than centrifuged and
the resulting supernatant was directly injected to the
chromatographic column. To ensure the lowest possible loss of
target compounds during sample preparation it was necessary to
examine several factors of a sample treatment, which could affect
the overall recovery of GSH and GSSG.
Stability of GSH
Given that the formation of complexes may be faster
under certain conditions (pH and ionic strength), we decided to
investigate the possibility of GSH complex formation in the
solution used for isolation. The formation of the complex was
determined via a decrease in the GSH peak. Primarily, we examined
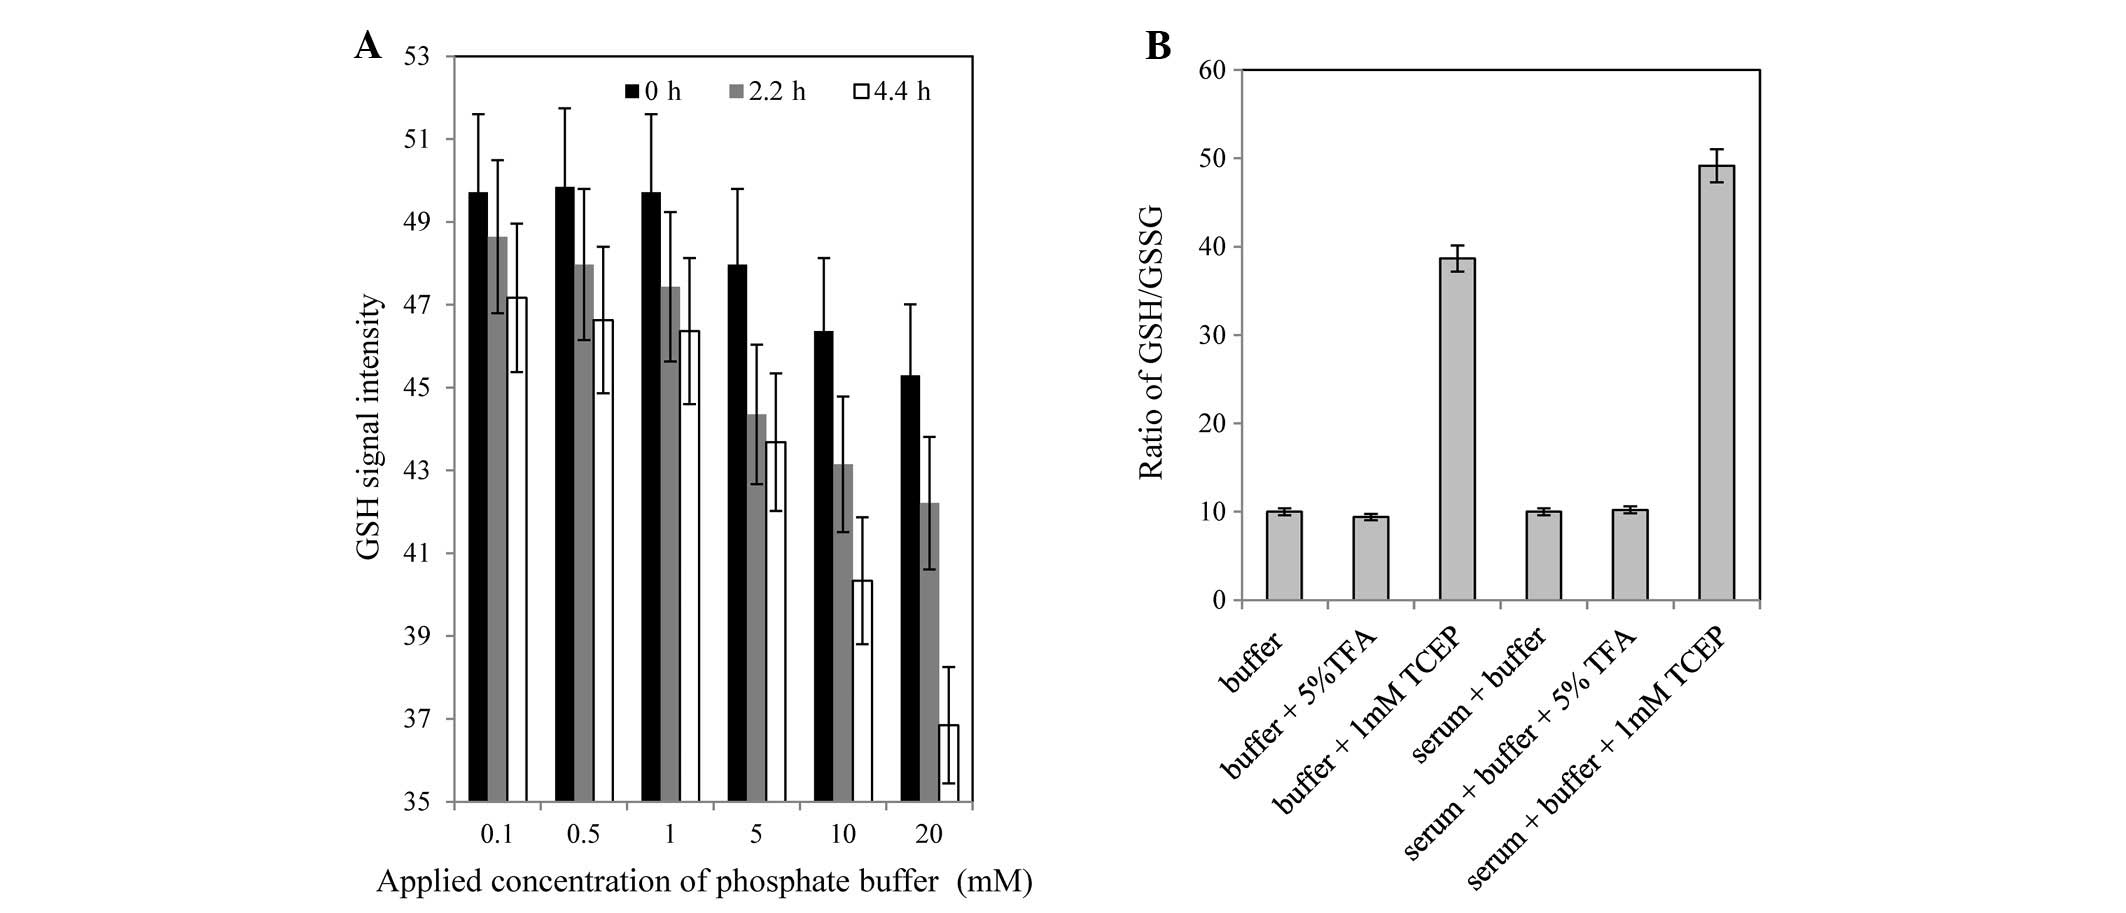
the effect of molar concentrations of phosphate buffer (0.1, 0.5,
1, 5, 10 and 20 mM; pH 7.5) on the GSH (50 μg/ml) signal.
These samples were left following preparation at room temperature,
and were analysed by HPLC at time 0, 130 (2.2 h) and 260 min (4.3
h). Based on the results obtained, higher concentrations of buffer
caused a decreasing GSH signal, i.e. concentration; thus, 20 mM
phosphate buffer caused the highest decrease of glutathione
concentration. It is clear that the greatest stability of GSH was
observed in samples prepared in the presence of low concentrations
of phosphate buffer.
Specifically, the lowest loss of glutathione
occurred at the applied concentrations of 0.1–1 mM (Fig. 3A). These results clearly
demonstrated that lower concentrations of phosphate buffer
contribute to the stability of the sample. Therefore, for further
experiments we used 1 mM phosphate buffer (pH 7.5).
Influence of various chemicals on
GSH:GSSG ratio
To determine the extent of oxidative stress by
glutathione it is necessary to know the ratio of GSH:GSSG.
Therefore, we were aimed to determine whether TFA, which is
normally added to the sample due to deproteination, could have an
effect on GSSG level. We also studied the effect of adding the
reducing agent tris(2-carboxylethyl)phosphine (TCEP), which may
markedly influence the ratio of GSH:GSSG. Studies on TFA and TCEP
were conducted in buffer and blood sera, and all variants were
prepared with the same concentration of 50 μg/ml GSH and 5
μg/ml GSSG. Samples were prepared in the presence of (i) 1
mM phosphate buffer (pH 7.5), (ii) 1 mM phosphate buffer (pH 7.5)
with 5% TFA (v/v), and (iii) 1 mM phosphate buffer (pH 7.5) with 1
mM TCEP. To be able to assess the influence of the matrix, samples
of blood serum were prepared in the same way. All samples were
vortexed for 1 min and immediately analysed by HPLC following
preparation. The GSH:GSSG ratio was determined, where the ratio of
10 was taken as a control. In the case of using 5% TFA, ±7% change
from control was determined in variants of buffer and serum
(Fig. 3B). The results reveal that
TFA did not affect the ratio of GSH:GSSG. However, following the
addition of TCEP, there was a significant increase in the ratio to
38 and 48 in the buffer and blood serum, respectively. TCEP reduced
the majority of GSSG to GSH, which was the reason for the
significant increase of the GSH:GSSG ratio. In the case of blood
serum, the ratio was even higher compared with buffer. This
phenomenon may be explained by the involvement of the biological
matrix in a non-specific reaction of the complexes or the presence
of certain concentrations of glutathione bound to the matrix
constituents. These results clearly indicate that TCEP reduces GSSG
back to GSH, which could be used to determine the total amount of
glutathione.
Recovery of pretreatment
Recovery estimation for sample preparation and
analysis for a sample of blood serum using an optimised separation
method was conducted by adding 10 μg/ ml GSH and 10
μg/ml GSSG prior to precipitation with 5% TFA and subsequent
centrifugation. A sample with a GSH:GSSG ratio of 2.8 was used for
determining recovery. The resulting recoveries are indicated in
Table I. A recovery estimation of
83 and 89% for GSH and GSSG, respectively, clearly follows from the
results previously obtained. GSH recovery can be associated with
the imperfect protection of free-SH groups of glutathione, which
can interact with the remains of biological matrices, and thus
reduce the total concentration of free GSH during the preparation
of the samples.
 | Table I.Recovery of GSH and GSSG for blood
serum sample analysis (n=5). |
Table I.
Recovery of GSH and GSSG for blood
serum sample analysis (n=5).
| Substance of
interest | Homogenate
(μg/ml) | Spiking
(μg/ml) | Homogenate +
spiking (μg/ml) | Recovery (%) |
|---|
| GSH | 54±6 | 50±5 | 86±10 | 83 |
| GSSG | 25±4 | 10±2 | 31±3 | 89 |
Determination of GSH:GSSG ratio in
paediatric patients
The antioxidant function of GSH is primarily due to
its involvement in enzymatic pathways that cells have developed
against ROS. The most important pathway involves glutathione
peroxidase (GPx) and glutathione reductase (GR). GPx catalyses the
reduction of hydrogen peroxide, which is produced by superoxide
dismutase (SOD) through the dismutation of superoxide anions or
organic hydroperoxides. GSH and GSH-dependent enzymes act in
cooperation to scavenge ROS and/or neutralise their toxic oxidising
effect. These systems act at the same time and in cooperation to
protect the human body from ROS. Under oxidative stress conditions,
GSH is oxidised to GSSG; thus, the GSH:GSSG ratio is altered.
Discussion
The GSH:GSSG ratio may be used as a marker of
oxidative stress, which arises due to various malignancies. Using
the optimised method, we were able to analyse real samples of
paediatric patients (Fig. 4A). GSH
and GSSG concentrations identified in each sample were recalculated
to recovery, and based on these values, the GSH:GSSG ratios were
given. The lowest number of patients in a group (n=3) were
diagnosed with lymphadenopathy and the highest number (n=27) were
diagnosed with neuroblastoma. Average values of GSH:GSSG ratio are
demonstrated in Fig. 4B. The
results reveal that the lowest redox status, which is given by the
GSH:GSSG ratio of 1.4, was identified in patients diagnosed with
ependymoma anaplastic, and the second lowest ratio of 1.5 was
identified in patients diagnosed with genital tract tumour. The
average values of both groups of patients also had a large relative
standard deviation (RSD) of 50.3 and 41.5%, respectively. The
lowest RSDs were identified in lymphadenopathy and rhabdomyosarcoma
patients with a higher GSH:GSSG ratio of 4.0 and 3.5, where RSDs
were 18.4 and 22.1, respectively. Additionally, the lowest
oxidative damage, expressed as a GSH:GSSG ratio of 5.2, was
revealed in retinoblastoma patients.
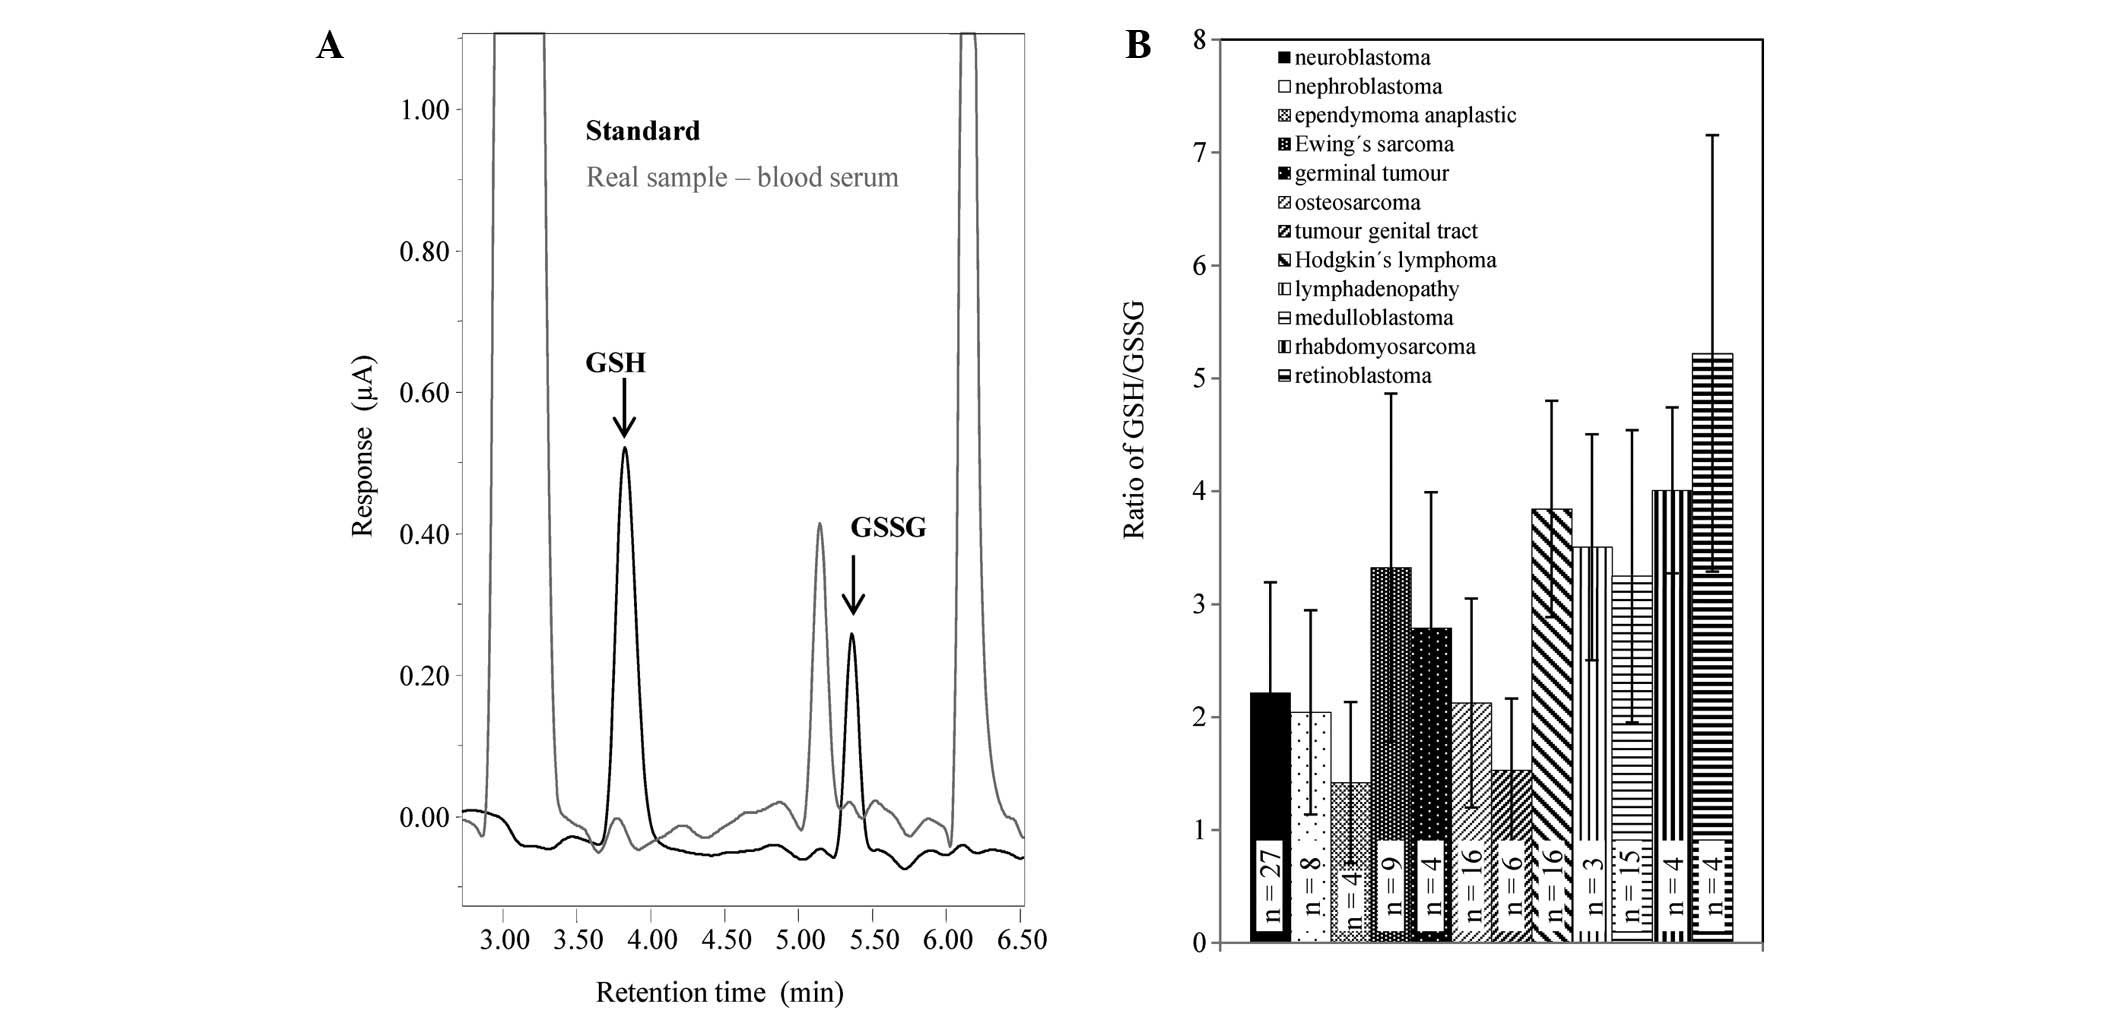 | Figure 4.(A) Overlay of HPL chromatograms of a
standard mixture of GSH (50 μM) and GSSG (25 μM) and
real blood serum samples. (B) Ratio of GSH:GSSG determined in
patients suffering from: neuroblastoma (n=27, RSD=43.9%),
nephroblastoma (n=8, RSD=44.3%), anaplastic epemdymoma
(n=4,RSD=50.3%), Ewing’s sarcoma (n=9, RSD=46.4%), germ cell tumour
(n=4, RSD=43.1%), osteosarcoma (n=16, RSD=43.6%), tumour of the
genital tract (n=6, RSD=41.5%), Hodgkin’s lymphoma (n=16,
RSD=24.9%), lymphadenopathy (n=3, RSD=22.1%), medulloblastoma
(n=15, RSD=39.8%), rhabdomyosarcoma (n=4, RSD=18.4%) or
retinoblastoma (n=4, RSD=37.0%). GSH, reduced glutathione, GSSG,
oxidised gluathione. HPL, high performance liquid; RSD, relative
standard deviation. |
Acknowledgements
Financial support from NANOSEMED GA AV
(Grant No. KAN208130801), NanoBioTECell GA CR (Grant No.
102/11/1068), CEITEC (Grant No. CZ.1.05/1.1.00/02.0068) and and the
Project for Conceptual Development of Research Organization
(00064203) is gratefully acknowledged.
References
|
1.
|
P LochmanT AdamD FriedeckyE HlidkovaZ
SkopkovaHigh-throughput capillary electrophoretic method for
determination of total aminothiols in plasma and
urineElectrophoresis2412001207200310.1002/elps.20039015412707912
|
|
2.
|
F MicheletR GueguenP LeroyM WellmanA
NicolasG SiestBlood and plasma glutathione measured in
healthy-subjects by HPLC: relation to sex, aging, biological
variables, and life habitsClin Chem411509151719957586526
|
|
3.
|
A PastoreR MassoudC MottiFully automated
assay for total homocysteine, cysteine, cysteinylglycine,
glutathione, cysteamine, and 2-mercaptopropionylglycine in plasma
and urineClin Chem448258321998
|
|
4.
|
JP RichieL SkowronskiP AbrahamY
LeutzingerBlood glutathione concentrations in a large-scale human
studyClin Chem42647019968565235
|
|
5.
|
M SheaS HowellHigh-performance liquid
chromatographic measurement of exogenous thiosulfate in urine and
plasmaAnal
Biochem140589594198410.1016/0003-2697(84)90211-26486442
|
|
6.
|
A MeisterSS TateGlutathione and related
gamma-glutamyl compounds: biosynthesis and utilizationAnnu Rev
Biochem45559604197610.1146/annurev.bi.45.070176.003015
|
|
7.
|
OW GriffithA MeisterPotent and
specific-inhibition of glutathione synthesis by buthionine
sulfoximine (S-n-butyl homocysteine sulfoximine)J Biol
Chem25475587560197938242
|
|
8.
|
A MeisterME AndersonO HwangIntracellular
cysteine and glutathione delivery systemsJ Am Coll
Nutr5137151198610.1080/07315724.1986.107201213722629
|
|
9.
|
S CarelliA CeriottiA CabibboG FassinaM
RuvoR SitiaCysteine and glutathione secretion in response to
protein disulfide bond formation in the
ERScience27716811684199710.1126/science.277.5332.16819287224
|
|
10.
|
R LocignoV CastronovoReduced glutathione
system: role in cancer development, prevention and treatment
(review)Int J Oncol19221236200111445833
|
|
11.
|
G NoctorCH FoyerAscorbate and glutathione:
keeping active oxygen under controlAnnu Rev Plant Physiol Mol
Biol49249279199810.1146/annurev.arplant.49.1.24915012235
|
|
12.
|
DM TownsendKD TewH TapieroThe importance
of glutathione in human diseaseBiomed
Pharmacother57145155200310.1016/S0753-3322(03)00043-X12818476
|
|
13.
|
YC ChaiSS AshrafK RokutanRB Johnston JrJA
ThomasS-thiolation of individual human neutrophil proteins
including actin by stimulation of the respiratory burst: evidence
against a role for glutathione disulfideArch Biochem
Biophys310273281199410.1006/abbi.1994.1167
|
|
14.
|
L ArranzC FernándezA RodríguezJM RiberaM
De la FuenteThe glutathione precursor N-acetylcysteine improves
immune function in postmenopausal womenFree Radic Biol
Med4512521262200810.1016/j.freeradbiomed.2008.07.01418694818
|
|
15.
|
K HashimotoW TakasakiT YamotoS ManabeI
SatoS TsudaEffect of glutathione (GSH) depletion on DNA damage and
blood chemistry in aged and young ratsJ Toxicol
Sci33421429200810.2131/jts.33.42118827442
|
|
16.
|
R ChristonRB HalouiG DurandDietary
polyunsaturated fatty acids and aging modulate glutathione-related
antioxidants in rat liverJ Nutr1253062307019957500185
|
|
17.
|
P MaherThe effects of stress and aging on
glutathione metabolismAgeing Res
Rev4288314200510.1016/j.arr.2005.02.00515936251
|
|
18.
|
I RebrinAC BayneRJ MockettWC OrrRS
SohalFree aminothiols, glutathione redox state and protein mixed
disulphides in aging Drosophila melanogasterBiochem
J382131136200410.1042/BJ2004050615142037
|
|
19.
|
I RebrinRS SohalPro-oxidant shift in
glutathione redox state during agingAdv Drug Deliv
Rev6015451552200810.1016/j.addr.2008.06.00118652861
|
|
20.
|
PS SamiecC Drews-BotschEW FlaggGlutathione
in human plasma: decline in association with aging, age-related
macular degeneration, and diabetesFree Radic Biol
Med24699704199810.1016/S0891-5849(97)00286-49586798
|
|
21.
|
A CerieloE MotzA CavarapeHyperglycemia
counterbalances the antihypertensive effect of glutathione in
diabetic patients: evidence linking hypertension and glycemia
through the oxidative stress in diabetes mellitusJ Diabetes
Complications11250255199710.1016/S1056-8727(97)00021-4
|
|
22.
|
Y DincerT AkcayZ AlademirH IlkovaEffect of
oxidative stress on glutathione pathway in red blood cells from
patients with insulin-dependent diabetes
mellitusMetabolism5113601362200210.1053/meta.2002.3519212370859
|
|
23.
|
K YoshidaJ HirokawaS TagamiY KawakamiY
UrataT KondoWeakened cellular scavenging activity against oxidative
stress in diabetes mellitus: regulation of glutathione synthesis
and effluxDiabetologia38201210199510.1007/BF00400095
|
|
24.
|
P MarguttiP MatarreseF ContiAutoantibodies
to the C-terminal subunit of RLIP76 induce oxidative stress and
endothelial cell apoptosis in immune-mediated vascular diseases and
atherosclerosisBlood11145594570200810.1182/blood-2007-05-09282517993611
|
|
25.
|
SS SignorelliS NeriL Di PinoOxidative
stress and endothelial damage in patients with asymptomatic carotid
atherosclerosisClin Exp
Med1912200110.1007/s10238-001-8002-711467406
|
|
26.
|
MQ HassanRA HadiZS Al-RawiVA PadronSJ
StohsThe glutathione defense system in the pathogenesis of
rheumatoid arthritisJ Appl
Toxicol216973200110.1002/jat.73611180282
|
|
27.
|
JH Pedersen-LaneRB ZurierDA
LawrenceAnalysis of the thiol status of peripheral blood leukocytes
in rheumatoid arthritis patientsJ Leukoc
Biol81934941200710.1189/jlb.080653317210617
|
|
28.
|
A SevenS GuzelM AslanV HamuryudanLipid,
protein, DNA oxidation and antioxidant status in rheumatoid
arthritisClin
Biochem41538543200810.1016/j.clinbiochem.2008.01.02918313405
|
|
29.
|
E KarelsonR MahlapuuM ZilmerU SoometsN
BogdanovicU LangelPossible signaling by glutathione and its novel
analogue through potent stimulation of frontocortical G proteins in
normal aging and in Alzheimer’s diseaseCell Signaling,
Transcription, and Translation as Therapeutic Targets973M
DiederichNew York Academy of SciencesNew York537540200212485924
|
|
30.
|
HL LiuH WangS ShenviTM HagenRM
LiuGlutathione metabolism during aging and in Alzheimer
diseaseStrategies for Engineered Negligible Senescence: Why Genuine
Control of Aging May Be Foreseeable1019ADN De GreyNew York Academy
of SciencesNew York346349200415247041
|
|
31.
|
R ResendePI MoreiraT ProencaBrain
oxidative stress in a triple-transgenic mouse model of Alzheimer
diseaseFree Radic Biol
Med4420512057200810.1016/j.freeradbiomed.2008.03.01218423383
|
|
32.
|
AE LangThe progression of Parkinson
disease: a
hypothesisNeurology68948952200710.1212/01.wnl.0000257110.91041.5d17372132
|
|
33.
|
MB SpinaG CohenDopamine turnover and
glutathione oxidation: implications for Parkinson diseaseProc Natl
Acad Sci USA8613981400198910.1073/pnas.86.4.13982919185
|
|
34.
|
N YamamotoH SawadaY IzumiProteasome
inhibition induces glutathione synthesis and protects cells from
oxidative stress: relevance to Parkinson diseaseJ Biol
Chem28243644372200710.1074/jbc.M60371220017158454
|
|
35.
|
SC BarrancoRR PerryME DurmRelationship
between colorectal cancer glutathione levels and patient survival:
early resultsDis Colon
Rectum4311331140200010.1007/BF0223656210950013
|
|
36.
|
J KigawaY MinagawaY KanamoriGlutathione
concentration may be a useful predictor of response to second-line
chemotherapy in patients with ovarian
cancerCancer82697702199810.1002/(SICI)1097-0142(19980215)82:4%3C697::AID-CNCR12%3E3.0.CO;2-T9477102
|
|
37.
|
A KumarS SharmaCS PundirA SharmaDecreased
plasma glutathione in cancer of the uterine cervixCancer
Lett94107111199510.1016/0304-3835(95)03832-H7621438
|
|
38.
|
DYK WongYL HsiaoCK PoonGlutathione
concentration in oral cancer tissuesCancer
Lett81111116199410.1016/0304-3835(94)90191-0
|
|
39.
|
CC YehMF HouSH WuA study of glutathione
status in the blood and tissues of patients with breast cancerCell
Biochem Funct24555559200610.1002/cbf.127516142688
|
|
40.
|
W DrogeFree radicals in the physiological
control of cell functionPhysiol Rev824795200211773609
|
|
41.
|
JD HayesDJ PulfordThe glutathione
S-Transferase supergene family: regulation of GST and the
contribution of the isoenzymes to cancer chemoprotection and drug
resistanceCrit Rev Biochem Mol
Biol30445600199510.3109/104092395090834918770536
|
|
42.
|
M ValkoCJ RhodesJ MoncolM IzakovicM
MazurFree radicals, metals and antioxidants in oxidative
stress-induced cancerChem Biol
Interact160140200610.1016/j.cbi.2005.12.00916430879
|
|
43.
|
JD HayesLI McLellanGlutathione and
glutathione-dependent enzymes represent a co-ordinately regulated
defence against oxidative stressFree Radic
Res31273300199910.1080/10715769900300851
|
|
44.
|
I Dalle-DonneR RossiR ColomboD GiustariniA
MilzaniBiomarkers of oxidative damage in human diseaseClin
Chem52601623200610.1373/clinchem.2005.06140816484333
|
|
45.
|
B KlejdusJ ZehnálekV AdamSub-picomole
high-performance liquid chromatographic/mass spectrometric
determination of glutathione in the maize (Zea mays L.) kernels
exposed to cadmiumAnal Chim
Acta520117124200410.1016/j.aca.2004.02.060
|
|
46.
|
D PotesilJ PetrlovaV AdamSimultaneous
femtomole determination of cysteine, reduced and oxidized
glutathione, and phytochelatin in maize (Zea mays L.) kernels using
high-performance liquid chromatography with electrochemical
detectionJ Chromatogr
A1084134144200510.1016/j.chroma.2005.06.019
|
|
47.
|
J PetrlovaR MikelovaK StejskalSimultaneous
determination of eight biologically active thiol compounds using
gradient elution-liquid chromatography with Coul-Array detectionJ
Sep Sci2911661173200610.1002/jssc.200500425
|
|
48.
|
O ZitkaD HuskaS KrizkovaAn investigation
of glutathione-platinum(II) interactions by means of the flow
injection analysis using glassy carbon
electrodeSensors712561270200710.3390/s7071256
|
|
49.
|
Y IwasakiY SaitoY NakanoChromatographic
and mass spectrometric analysis of glutathione in biological
samplesJ Chromatogr B Analyt Biomed Life
Sci87733093317200910.1016/j.jchromb.2009.07.00119620027
|
|
50.
|
R CausonValidation of chromatographic
methods in biomedical analysis - viewpoint and discussionJ
Chromatogr B689175180199710.1016/S0378-4347(96)00297-69061492
|