Introduction
Melanoma is one of the most deadly skin cancers and
the incidence of melanoma is continuing to increase world-wide
(1). Cutaneous malignant melanoma
(CMM) is the sixth most commonly diagnosed cancer in the USA in
males and females (2). One person
succumbs to from melanoma every hour in the USA. Advanced-stage
cutaneous melanoma has a median survival time of <1 year. An
important feature of melanoma is that the incidence rate is highest
in lighter skinned patients and much lower in darker skinned
individuals. Furthermore, melanoma strikes individuals before old
age (median age, 52 years), almost a decade before the majority of
solid tumors arise (e.g., breast, colon, lung or prostate).
Metastasis is the main contributor to the high mortality. Once
diagnosed with metastatic melanoma (AJCC stage IV), the majority of
patients ultimately succumb to the disease within two years
(3). The median survival following
the onset of distant metastases is only six to nine months and the
five-year survival rate is <5% (4).
One of the most significant factors associated with
tumor invasiveness and metastasis is altered cell-cell adhesion,
which determines cell polarity and is involved in cell
differentiation, as well as the establishment and maintenance of
tissue homeostasis. During oncogenesis, this organized adhesion is
disturbed by genetic and epigenetic changes, resulting in changes
in signaling, loss of contact inhibition and altered cell migration
and stromal interactions. A major class of cell-cell adhesion
molecules is the cadherin superfamily of transmembrane
glycoproteins that typically mediate calcium-dependent homophilic
intercellular adhesion (5).
E-cadherin is a prototypic member of the cadherin superfamily and
has been characterized as a potent suppressor of invasion and
metastasis in studies dating back to the 1990s (6). Perturbations in cadherins have been
associated with cancer, particularly invasion and metastasis
(7). The decreased expression and
abnormal cellular distribution of E-cadherin have been frequently
observed to be associated with de-differentiation and invasiveness
in a variety of human malignancies (8). T-cadherin (also known as CDH13 and
H-cadherin) is an atypical cadherin superfamily member which is
anchored in the membrane through a glycosylphosphatidylinositol
(GPI) anchor instead of a transmembrane domain (9). T-cadherin has also been suggested to
be involved in cancer progression (10,11).
T-cadherin downregulation has been observed in various malignant
tumors, including malignant melanoma (12), gallbladder carcinoma (13,14),
ovarian carcinoma (15,16) and breast (17) and lung cancers (18,19).
T-cadherin re-expression may suppress cell proliferation and
invasiveness, increase sensitivity to apoptosis and decrease tumor
growth (12,20–22).
The functional relevance of T-cadherin gene
expression in melanoma progression remains to be further clarified.
Our previous studies using B16F10 melanoma cells focused on the
immune mechanisms and used Ganoderma lucidum polysaccharides
to demonstrate the enhancement of MHC class I and costimulatory
molecules in B16F10 cells (23),
promotion of lymphocyte activation by B16F10 cells (24), antagonism against lymphocyte
suppression caused by the culture super-natants of B16F10 melanoma
cells (25), induction of marked
cytotoxicity against B16F10 cells in cytotoxic T cells (CTLs) with
granzyme B and porforin and inhibition of tumori-genesis in
wild-type B16F10 melanoma cells in vivo(26). Cell proliferation, apoptosis, cell
cycle and invasiveness are important features associated with
malignancy (27). In the present
study, the T-cadherin gene was expressed in B16F10 melanoma cells,
which are deficient in T-cadherin expression, by T-cadherin
gene transfection to examine its effects on proliferation,
apoptosis, cell cycle and invasiveness in B16F10 melanoma
cells.
Materials and methods
Cell culture system
The mouse B16F10 melanoma cell line, which is
derived from C57BL/6 mice, was used in this study as it is
originally deficient in T-cadherin expression. The B16F10
melanoma cell line was purchased from KeyGen Biotech. (Nanjing,
China) and was cultured in RPMI-1640 medium supplemented with fetal
bovine serum (10%), penicillin (100 IU/ml) and streptomycin (100
μg/ml) at 37°C in humidified 5% CO2
atmosphere.
Immunocytochemistry
The cells were cultured on slides and fixed with
cold acetone for 5 min, then rinsed with distilled water. The
endogenous peroxidase activity was quenched with 3% hydrogen
peroxide. After blocking with 10% normal serum, rabbit polyclonal
primary antibody against T-cadherin (Santa Cruz Biotechnology,
Inc., Santa Cruz, CA, USA) was added at a 1:100 dilution and
incubated overnight at 4°C. The next day, the horseradish
peroxidase labelled secondary antibody was applied for 1 h and
staining was finalized with a diaminobenzidine solution to detect
the target antigen. Slides were extensively washed with
phosphate-buffered saline (PBS) between the stages and
counterstained with hematoxylin prior to mounting. The slides were
examined under a light microscope. The replacement of primary
antibody with PBS was used as a negative control.
RNA extraction and RT-PCR
The total ribonucleic acids (RNAs) were extracted
with TRIzol reagent (Invitrogen, Carlsbad, CA, USA) according to
the manufacturer’s instructions. The RNA precipitates were
dissolved in DEPC-treated double distilled water containing RNasin
(R) ribonuclease inhibitor (Tiangen Biotech, Beijing, China). The
concentration of RNA was determined spectrophotometrically
(BioSpec-mini; Shimadzu, Kyoto, Japan). The messenger RNA (mRNA) of
T-cadherin in the tissues for expression vector engineering was
amplified by the reverse transcription polymerase chain reaction
(RT-PCR) with an RT-PCR system (Tiangen Biotech) according to the
manufacturer’s instructions. The levels of T-cadherin mRNA
transcribed in the transfected cells were also detected by RT-PCR.
To ensure that equal amounts of starting material were used in each
RT-PCR reaction, RNA was reverse transcribed and amplified with
β-actin-specific primers. The number of PCR amplification cycles
was 34, to ensure that the amplification of all specific
complementary deoxyribonucleic acid (cDNA) products was
exponential. The specific primer sequences were as follows:
T-cadherin sense primer, 5′-CCGGAATTCATGCAGCCGAG AACTCCGCT-3′ (for
gene cloning) or 5′-TTCAGCAGAAA GTGTTCCATAT-3′ (for expression
determination); T-cadherin antisense primer, 5′- CGCGGATCCTCACAGACA
AGCTAAGCTGAAG-3′ (for gene cloning) or 5′-GTG CATGGACGAACAGAGT-3′
(for expression determination); β-actin sense primer,
5′-CCTCGCCTTTGCCGATCC-3′; and β-actin antisense primer,
5’-GACTGACTACCTCATGA AGATCC-3’. All of the products were
electrophoresed on 2% agarose gel and stained with ethidium
bromide. The expression intensities of the bands were quantified
using ImageJ software (National Institutes of Health, Bethesda, MA,
USA) and expressed as a ratio (T-cadherin vs. β-actin).
Engineering of human T-cadherin
expression vector and cell transfection
The pEGFP-N1/T-cad, a plasmid vector encoding human
T-cadherin, was generated by inserting T-cadherin cDNA into a
pEGFP-N1 vector (Clontech Laboratories, Inc., Mountain View, CA,
USA), containing a CMV promoter and SV40 early promoter, as well as
the neomycin/kanamycin resistance gene of Tn5 which allows stably
transfected eukaryotic cells to be selected using G418. The vector
backbone also contains an SV40 origin of replication in mammalian
cells. The multiple cloning site (MCS) is next to the immediate
early promoter of CMV (PCMV IE). The human T-cadherin gene was
cloned from the mRNA extracted with TRIzol reagent (Invitrogen)
from human uterine smooth muscle tissue by performing RT-PCR using
the primers described previously in which the EcoRI or
BamHI restriction sites were included, digesting with
EcoRI or BamHI and ligating into the pEGFP-N1. The
pEGFP-N1/T-cad was transfected into Escherichia coli TOP10
for amplification and DNA sequencing was used to ensure the
fidelity. Plasmid DNA was prepared using the TIANprep Mini Plasmid
Kit (Tiangen Biotech) as per the manufacturer’s instructions.
Plasmids were transfected into the mouse melanoma cell line B16F10
cells at 80% confluence and 5×10⁵ cells per well in a
six-well plate using the Lipofectamine™ 2000 (Invitrogen) according
to the manufacturer’s instructions. The transfected cells which
stably expressed T-cadherin were selected by incubating with G418
for >2 weeks. The stable expression of T-cadherin was confirmed
by RT-PCR and immunohistochemistry.
Cell proliferation assay
Cell proliferation was measured by the
3-(4,5-dimethylthiazol-2-yl)-2,5-diphenyltetrazolium bromide (MTT)
assay following a 48 h incubation in 96-well microculture plates
with a volume of 200 μl/well. MTT solution (Sigma, St.
Louis, MO, USA; 20 μl, 5 mg/ml) was added to each well 4 h
before termination. After 4 h of incubation, the cells were lysed
and the purple formazan crystals were solubilized with DMSO. The
plate was analyzed on a microtitre plate reader at 490 nm and the
absorbance was translated into a cell proliferation ratio for
comparison: Cell proliferation ratio = (test absorbance /
non-transfection control absorbance) × 100.
Detection of apoptosis via EGFP-annexin V
and propidium iodide (PI) staining
Briefly, cells were cultured in six-well plates
(Costar; Corning Inc., Corning, NY, USA) for 72 h at 37°C and 5%
CO2. Cells (2×10⁵) were collected from each
well and incubated with 5 μl EGFP-annexin V and 5 μl
PI (KeyGen Biotech.) at room temperature for 15 min in the dark.
Subsequently, 500 μl annexin V binding buffer was added and
flow cytometry was performed using a FACSCalibur flow cytometer
(Becton Dickinson, Franklin Lakes, NJ, USA). Cells were considered
to be apoptotic if they were annexin V+/PI–
(early apoptotic). Each analysis was performed using at least
10,000 events.
Analysis of cell cycle using PI
staining
Cells were cultured in 6-well plates (Costar;
Corning Inc.) for 72 h at 37°C and 5% CO2. The cells
were then harvested, washed with PBS and resuspended in 75% ethanol
at 4°C overnight to make the membranes porous. After washing with
PBS, the cells were incubated with 0.5 ml PI solution (5 mg PI, 2
mg RNase, 1 ml Triton X-100, 65 ml NS and 100 mg citrate sodium;
volume to 100 ml, pH 7.4) for 30 min at 4°C in the dark to stain
the nuclear DNA. The percentages of cells in the
G0/G1, S and G2/M phases of the
cell cycle were identified by FACSCalibur flow cytometry (Becton
Dickinson) excluding cell doublets. The analyses were performed
using CellQuest software (Becton Dickinson). Each analysis was
performed using at least 10,000 events.
Transwell invasion assay
In vitro invasion assays were performed using
8-μm Transwell membranes (Corning Inc.) to measure tumor
invasion. The Matrigel invasion chambers were prepared at 1:4
dilution and incubated for 1 h at 37°C and 5% CO2. Cells
were washed with 1X PBS, resuspended in 0.1% fetal bovine serum
(FBS)-RPMI-1640 and 2×10⁵ cells (200 μl) were
added to the Matrigel-coated upper chamber. RPMI-1640 culture
medium containing 30% FBS was placed in the lower compartment of
the chemotaxis chamber to function as a source of chemoattractants.
The 24-well plastic culture plate was incubated at 37°C and 5%
CO2 for 24 h. After incubation, the invasive cells which
had passed through to the lower surface of the filter were fixed
and stained with hematoxylin for microscope observation or
quantified using an MTT assay in which the absorbance was
translated into a cell ratio for comparison: Cell ratio = (test
absorbance / non-transfection control absorbance) × 100.
Statistical analysis
The results, with the exception of the
immunocytochemistry, were expressed as the mean ± SD of triplicate
experiments (six experiments in the MTT cell proliferation assay)
and statistical comparisons between the experimental groups and the
control were performed using one-way analysis of variance (ANOVA)
followed by Dunnett’s t-test. P<0.05 was considered to indicate
statistically significant differences.
Results
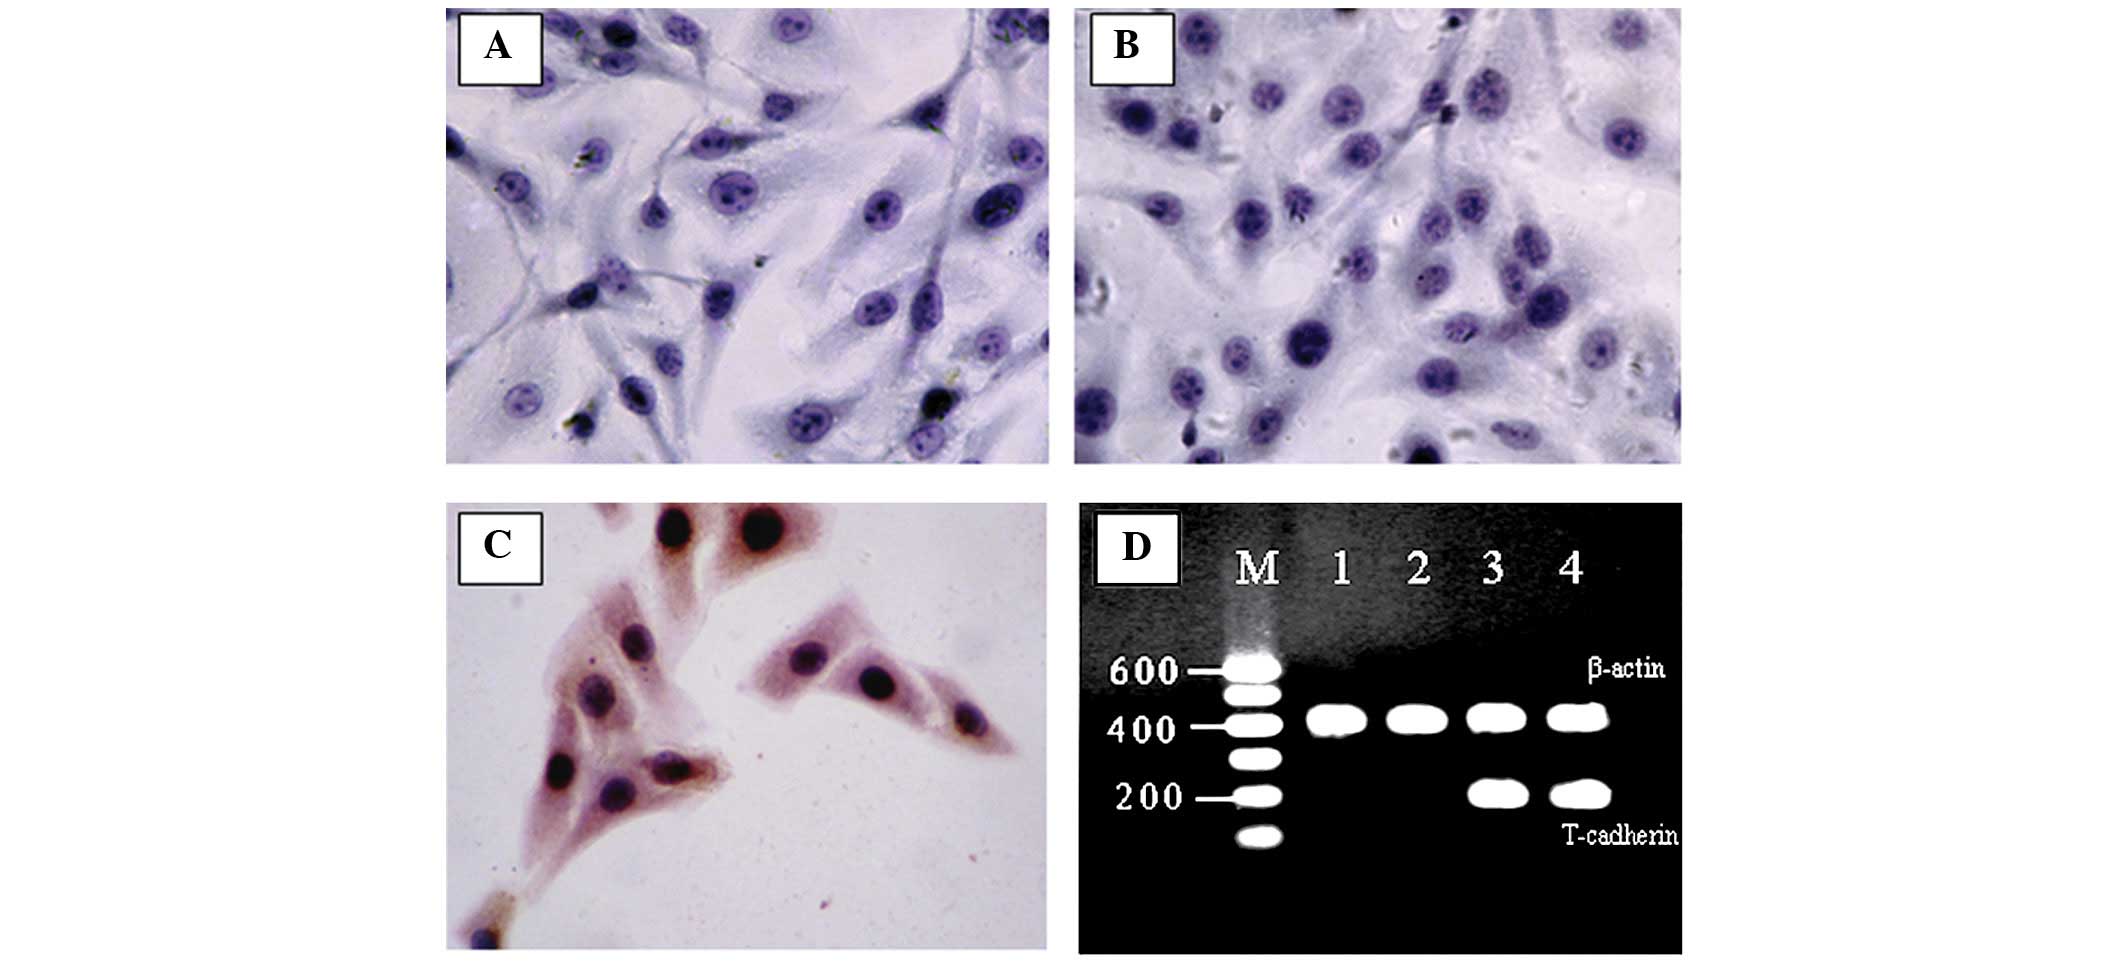
Confirmation of cDNA fidelity and
expression in transfected melanoma cells
The cDNA fidelity of the engineered human T-cadherin
expression vector pEGFP-N1/T-cad was evaluated by DNA sequencing
which showed that the cDNA was consistent with the genebank
(NM_001257). The pEGFP-N1/T-cad was transfected into mouse B16F10
melanoma cells and the transfected cells which stably expressed
human T-cadherin were selected by culturing with G418 for two
weeks. The expression of T-cadherin was demonstrated by
immunohisto-chemistry (Fig. 1A–C)
and RT-PCR (Fig. 1D).
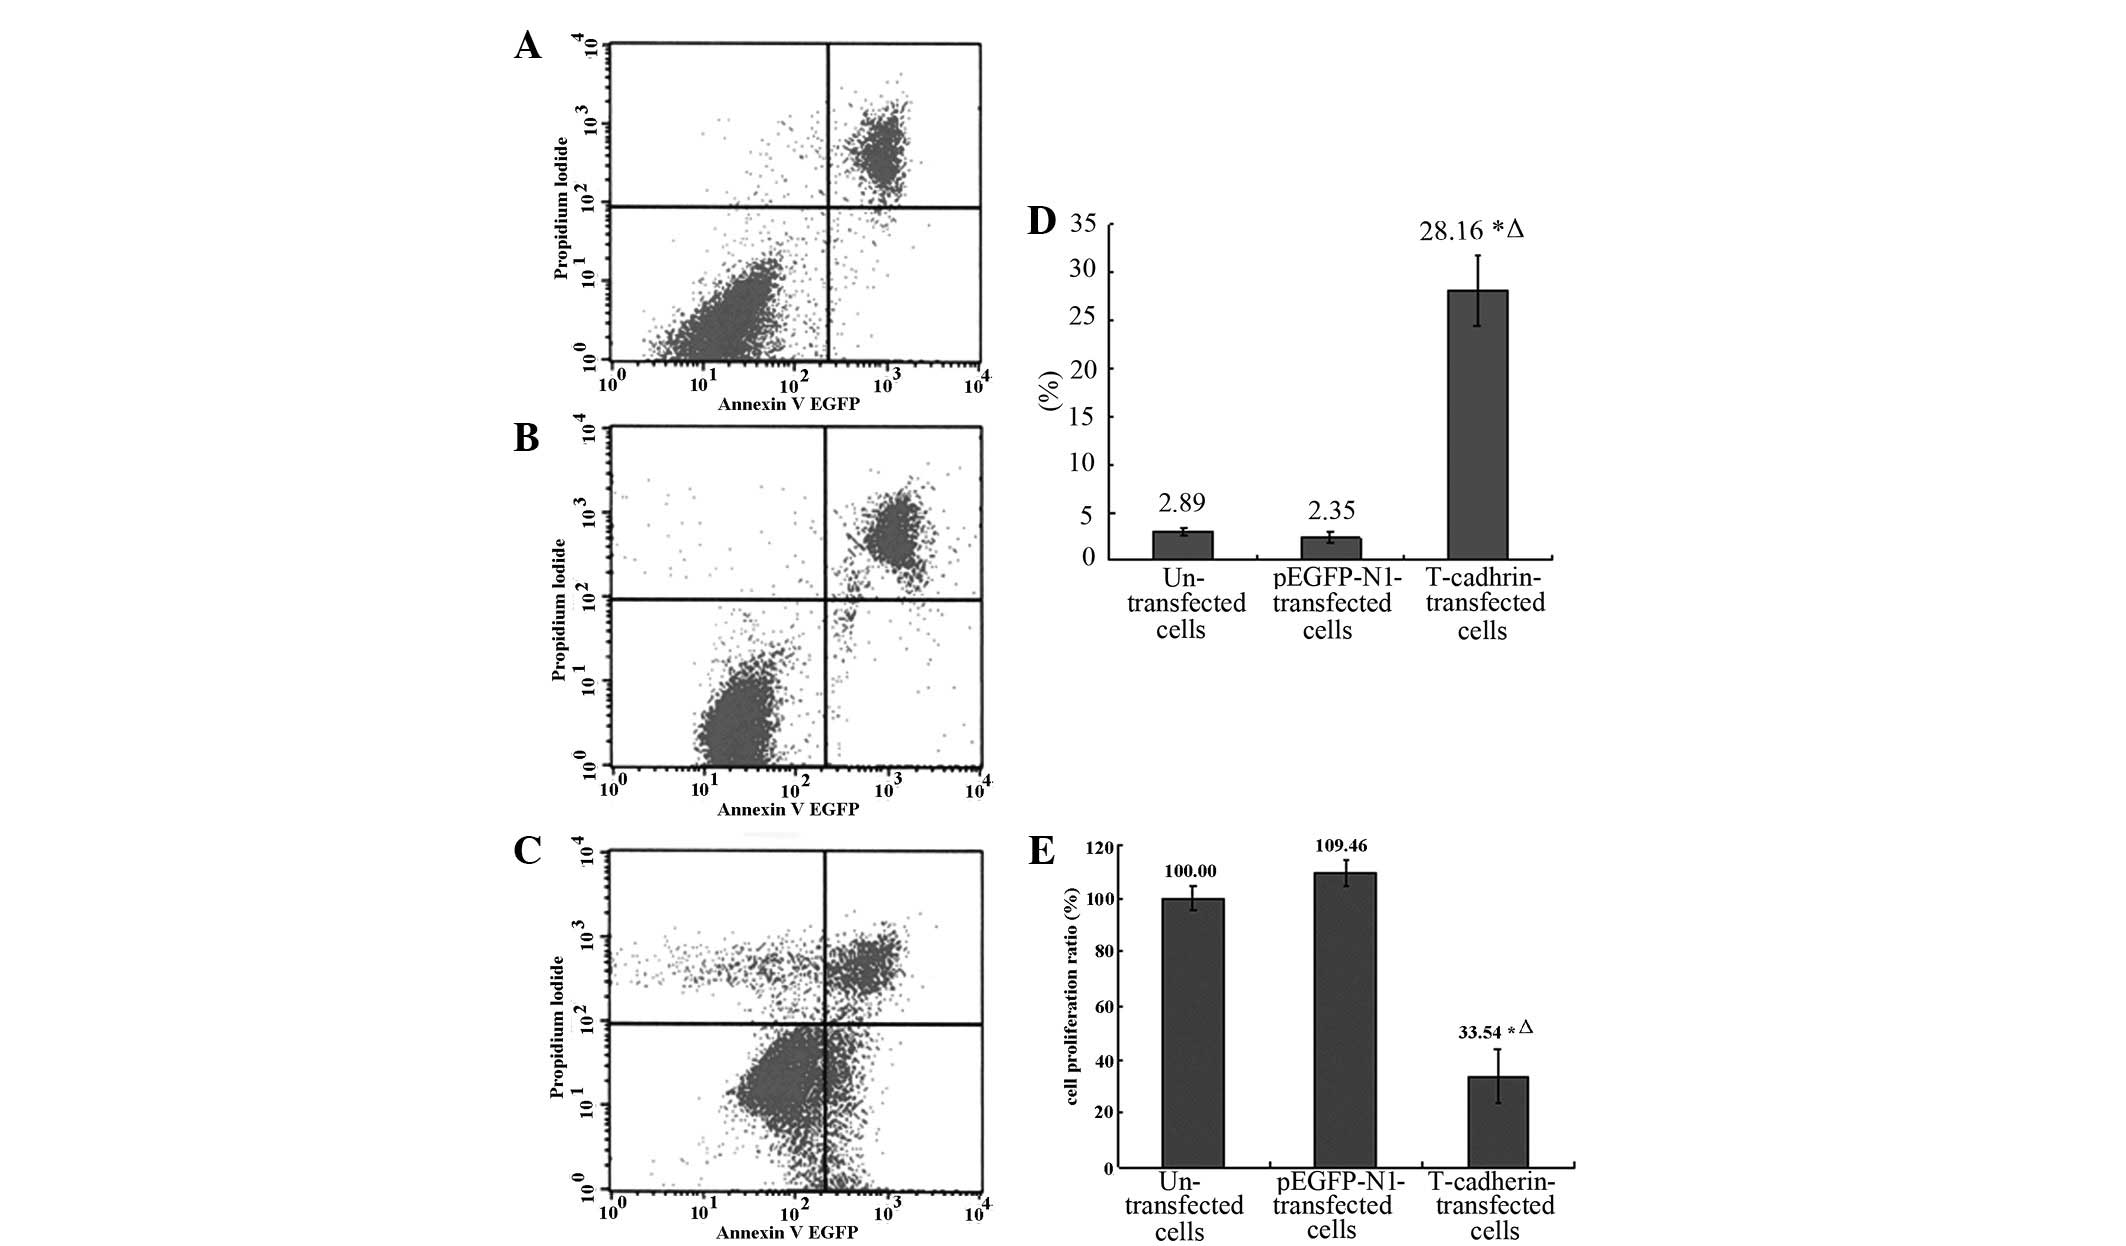
Cell proliferation in
T-cadherin-transfected melanoma cells
It was shown by MTT assays that the proliferation in
T-cadherin-transfected B16F10 melanoma cells was markedly lower
than either the parental (without transfection) or empty pEGFP-N1
(without T-cadherin gene)-transfected B16F10 cells (P<0.05),
while the proliferation in the parental and empty
pEGFP-N1-transfected B16F10 cells was similar (P>0.05, Fig. 2E).
Apoptosis in T-cadherin-transfected
melanoma cells
Flowcytometry FACS analysis with annexin V and PI
staining was used to determine cell apoptosis (28). It was shown by EGFP-annexin V/PI
staining and flow cytometry that the percentage of early apoptotic
cells in T-cadherin-transfected B16F10 melanoma cells was
significantly larger compared with either the parental or empty
pEGFP-N1-transfected B16F10 cells (P<0.05), while the percentage
of early apoptotic cells in the parental and empty
pEGFP-N1-transfected B16F10 cells was similar (P>0.05, Fig. 2A–D).
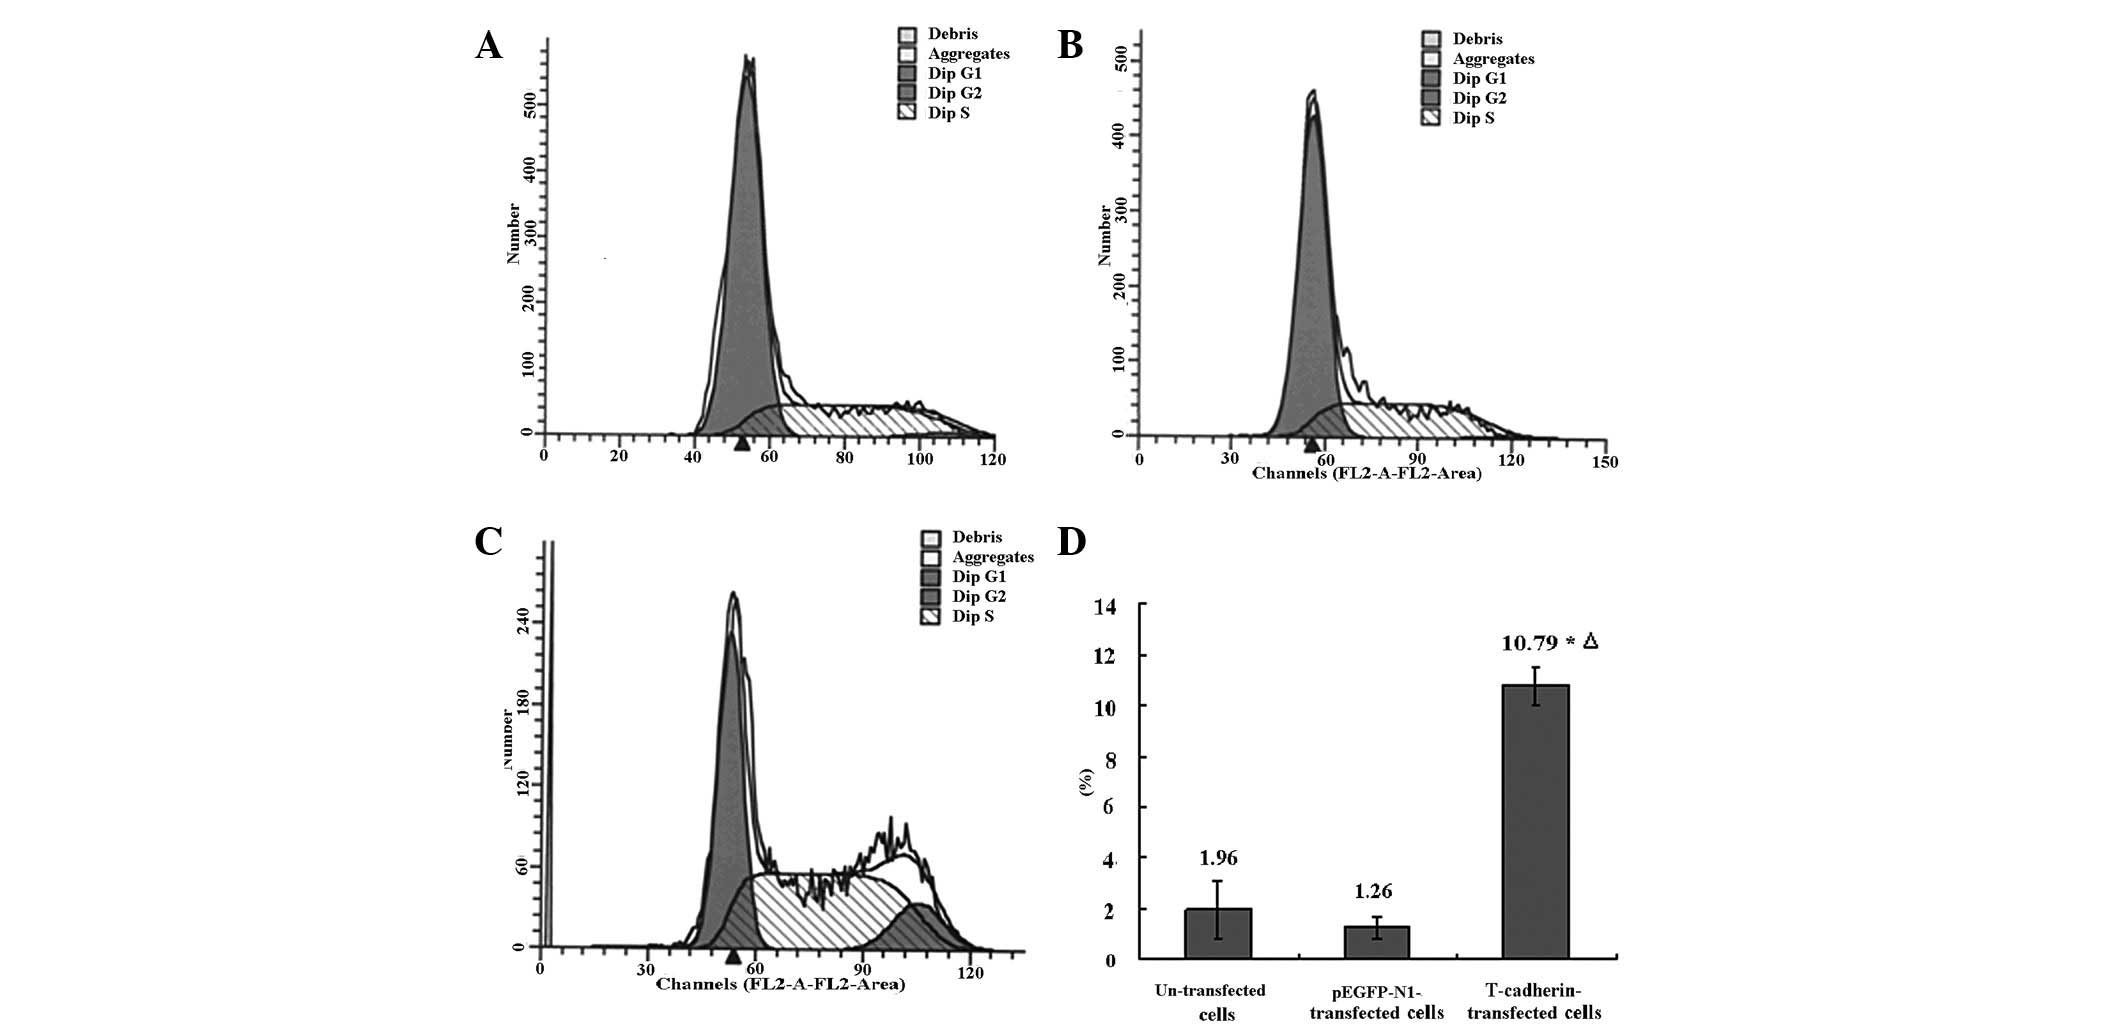
Cell cycle in T-cadherin-transfected
melanoma cells
The cell cycle may be analyzed by PI staining and
flow cytometry analysis (29,30).
It was shown by PI staining and flow cytometry analysis that the
cell cycle in T-cadherin-transfected B16F10 melanoma cells was
significantly different from either the parental or empty
pEGFP-N1-transfected B16F10 cells. The cells in the G2/M
phase were more abundant compared with either the parental or empty
pEGFP-N1-transfected B16F10 cells (P<0.05), while the number of
cells in the G2/M phase in the parental and empty
pEGFP-N1-transfected B16F10 cells was similar (P>0.05, Fig. 3). This suggested that the
T-cadherin-transfected B16F10 melanoma cells were arrested in the
G2/M phase.
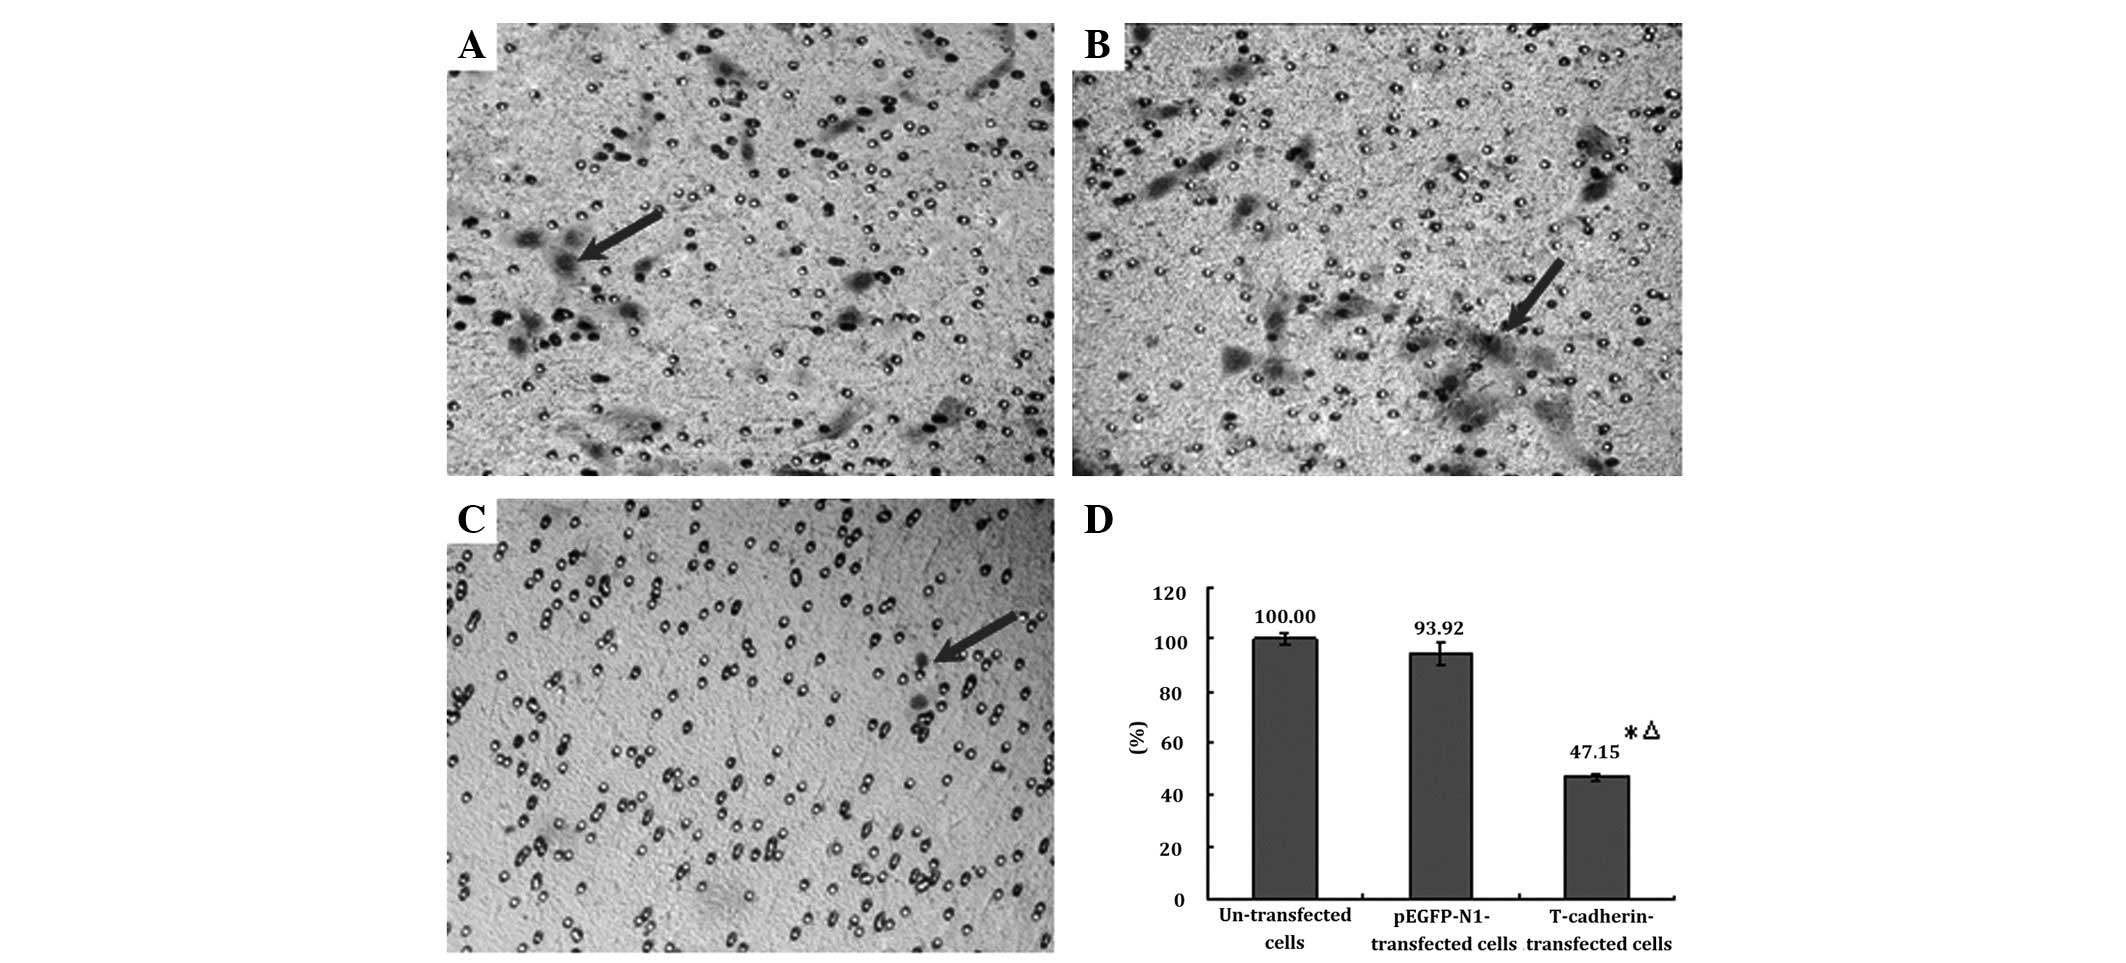
Invasiveness of T-cadherin-transfected
melanoma cells
The Transwell assay is a useful method for
determining cell migration (31)
which represents invasiveness. It was shown by the Transwell
invasion assay that the number of cells permeating the
Matrigel-coated membranes in the T-cadherin-transfected B16F10
melanoma cells was significantly lower compared with either the
parental or empty pEGFP-N1-transfected B16F10 cells (P<0.05).
The number of cells permeating the Matrigel-coated membranes in the
parental and empty pEGFP-N1-transfected B16F10 cells was similar
(P>0.05, Fig. 4).
Discussion
Invasiveness and metastasis are the most important
features of malignant tumors, including melanoma. Cell adhesion is
closely associated with tumor invasiveness and metastasis and the
cadherin superfamily is a superfamily of transmembrane
glycoproteins that mediate calcium-dependent homophilic
intercellular adhesion. E-cadherin is a prototypic member of the
cadherin superfamily and is expressed by the majority normal
epithelial tissues and a number of epithelium-derived cancer cells
have lost E-cadherin expression (32–34).
Unlike other members of the cadherin superfamily
which contain transmembrane domains linking the extracellular
portion of the molecules with the intracellular signaling pathways,
T-cadherin is unique as it lacks the transmembrane and cytoplasmic
domains and is anchored to cell membranes through a GPI anchor
(9). Cell adhesion mediated by
classical cadherins depends on the binding between cadherin
extracellular domains presented on the surfaces of opposing cells
and is regulated through intracellular associations with β- and
α-catenins which affect the dynamics of the actin-based
cytoskeleton (35,36). T-cadherin shares the extracellular
five cadherin repeats with other cadherins but lacks the
trans-membrane and cytosolic domains and instead attaches to the
membrane via a GPI anchor (9).
T-cadherin has been localized within lipid rafts of the plasma
membrane, is targeted to the apical surface in polarized epithelial
cells and redistributed to the leading edge of migrating cells
(37–39). T-cadherin mediates calcium-dependent
cell adhesion and colocalizes with small trimeric G-proteins and
Src family kinases in lipid rafts, where it may be involved in
modulating signal transduction pathways (37,40,41).
T-cadherin mediates calcium-dependent adhesion, although it is not
concentrated at the cell-cell junctions of transfected cells in
culture (9,42). Thus T-cadherin appears to be far
less adhesive than classical cadherins and, consistent with its
role in cell growth and migration, is likely to be involved in
reversible and dynamic cell-cell adhesion/de-adhesion (43). T-cadherin has been shown to have
diverse roles in physiology and pathophysiology, including as a
negative guidance cue for motor axon projections, tumor suppressor
factor in various types of cancer, atypical lipoprotein-binding
protein and stimulator of angiogenesis (44–46).
Hence, in various studies T-cadherin has been shown to be involved
in the regulation of proliferation, apoptosis and angiogenesis in
normal tissues, as well as tumor growth (47).
T-cadherin is widely expressed in the brain and
cardiovascular system, but is absent or strongly depleted in a
number of cell cancer lines (18,20,21,48).
Downregulation of T-cadherin gene expression associated with
promoter hyper-methylation has been frequently reported in breast,
lung and colon carcinomas (49).
T-cadherin mediates the activation of PI3K/Akt/GSK3β signaling
which protects endothelial cells from oxidative stress-induced
apoptosis (45). T-cadherin
downregulation is associated with poorer prognoses in various
carcinomas, such as lung, ovarian, cervical and prostate cancer,
while in the majority of cancer cell lines, T-cadherin
re-expression inhibits cell proliferation and invasiveness,
increases susceptibility to apoptosis and reduces tumor growth in
in vivo models. In contrast to the majority cancer cell
lines, T-cadherin overexpression in endothelial cells promotes
proliferation and migration and has a pro-survival effect (10).
In the present study, it was shown that inducing the
expression of T-cadherin by transfecting the T-cadherin gene into
B16F10 melanoma cells markedly reduced cell proliferation and
permeation through the Matrigel-coated membranes, representing
invasiveness. The percentage of early apoptotic cells and the cells
in the G2/M phase of the cell cycle was markedly
increased compared with either the parental or empty
pEGFP-N1-transfected B16F10 cells, with similarity between the
parental and empty pEGFP-N1-transfected B16F10 cells. These
properties suggest that T-cadherin may have an important role in
melanoma progression and be a possible target for therapy in
melanoma and certain other types of cancer.
References
|
1
|
Erdei E and Torres SM: A new understanding
in the epidemiology of melanoma. Expert Rev Anticancer Ther.
10:1811–1823. 2010. View Article : Google Scholar
|
|
2
|
Jemal A, Siegel R, Ward E, Murray T, Xu J,
Smigal C and Thun MJ: Cancer statistics, 2006. CA Cancer J Clin.
56:106–130. 2006. View Article : Google Scholar
|
|
3
|
Balch CM, Buzaid AC, Atkins MB, Cascinelli
N, Coit DG, Fleming ID, et al: A new American Joint Committee on
Cancer staging system for cutaneous melanoma. Cancer. 88:1484–1491.
2000. View Article : Google Scholar : PubMed/NCBI
|
|
4
|
Houghton AN and Polsky D: Focus on
melanoma. Cancer Cell. 2:275–278. 2002. View Article : Google Scholar
|
|
5
|
Wheelock MJ and Johnson KR: Cadherins as
modulators of cellular phenotype. Annu Rev Cell Dev Biol.
19:207–235. 2003. View Article : Google Scholar : PubMed/NCBI
|
|
6
|
van Roy F and Berx G: The cell-cell
adhesion molecule E-cadherin. Cell Mol Life Sci. 65:3756–3788.
2008.
|
|
7
|
Takeichi M: Cadherins in cancer:
implications for invasion and metastasis. Curr Opin Cell Biol.
5:806–811. 1993. View Article : Google Scholar : PubMed/NCBI
|
|
8
|
Christofori G and Semb H: The role of the
cell-adhesion molecule E-cadherin as a tumour-suppressor gene.
Trends Biochem Sci. 24:73–76. 1999. View Article : Google Scholar : PubMed/NCBI
|
|
9
|
Ranscht B and Dours-Zimmermann MT:
T-cadherin, a novel cadherin cell adhesion molecule in the nervous
system lacks the conserved cytoplasmic region. Neuron. 7:391–402.
1991. View Article : Google Scholar : PubMed/NCBI
|
|
10
|
Andreeva AV and Kutuzov MA: Cadherin 13 in
cancer. Genes Chromosomes Cancer. 49:775–790. 2010.PubMed/NCBI
|
|
11
|
Philippova M, Joshi MB, Kyriakakis E,
Pfaff D, Erne P and Resink TJ: A guide and guard: the many faces of
T-cadherin. Cell Signal. 21:1035–1044. 2009. View Article : Google Scholar : PubMed/NCBI
|
|
12
|
Kuphal S, Martyn AC, Pedley J, Crowther
LM, Bonazzi VF, Parsons PG, et al: H-cadherin expression reduces
invasion of malignant melanoma. Pigment Cell Melanoma Res.
22:296–306. 2009. View Article : Google Scholar : PubMed/NCBI
|
|
13
|
Adachi Y, Takeuchi T, Nagayama T, Ohtsuki
Y and Furihata M: Zeb1-mediated T-cadherin repression increases the
invasive potential of gallbladder cancer. FEBS Lett. 583:430–436.
2009. View Article : Google Scholar : PubMed/NCBI
|
|
14
|
Maruyama R, Toyooka S, Toyooka KO, Harada
K, Virmani AK, Zöchbauer-Müller S, et al: Aberrant promoter
methylation profile of bladder cancer and its relationship to
clinicopathological features. Cancer Res. 61:8659–8663.
2001.PubMed/NCBI
|
|
15
|
Kawakami M, Staub J, Cliby W, Hartmann L,
Smith DI and Shridhar V: Involvement of H-cadherin (CDH13) on 16q
in the region of frequent deletion in ovarian cancer. Int J Oncol.
15:715–720. 1999.PubMed/NCBI
|
|
16
|
Ehrlich M, Woods CB, Yu MC, Dubeau L, Yang
F, Campan M, et al: Quantitative analysis of associations between
DNA hypermethylation, hypomethylation, and DNMT RNA levels in
ovarian tumors. Oncogene. 25:2636–2645. 2006. View Article : Google Scholar : PubMed/NCBI
|
|
17
|
Toyooka KO, Toyooka S, Virmani AK,
Sathyanarayana UG, Euhus DM, Gilcrease M, et al: Loss of expression
and aberrant methylation of the CDH13 (H-cadherin) gene in breast
and lung carcinomas. Cancer Res. 61:4556–4560. 2001.PubMed/NCBI
|
|
18
|
Sato M, Mori Y, Sakurada A, Fujimura S and
Horii A: The H-cadherin (CDH13) gene is inactivated in human lung
cancer. Hum Genet. 103:96–101. 1998. View Article : Google Scholar : PubMed/NCBI
|
|
19
|
Brock MV, Hooker CM, Ota-Machida E, Han Y,
Guo M, Ames S, et al: DNA methylation markers and early recurrence
in stage I lung cancer. N Engl J Med. 358:1118–1128. 2008.
View Article : Google Scholar : PubMed/NCBI
|
|
20
|
Zhong Y, Delgado Y, Gomez J, Lee SW and
Perez-Soler R: Loss of H-cadherin protein expression in human
non-small cell lung cancer is associated with tumorigenicity. Clin
Cancer Res. 7:1683–1687. 2001.PubMed/NCBI
|
|
21
|
Lee SW, Reimer CL, Campbell DB, Cheresh P,
Duda RB and Kocher O: H-cadherin expression inhibits in vitro
invasiveness and tumor formation in vivo. Carcinogenesis.
19:1157–1159. 1998. View Article : Google Scholar : PubMed/NCBI
|
|
22
|
Chan DW, Lee JM, Chan PC and Ng IO:
Genetic and epigenetic inactivation of T-cadherin in human
hepatocellular carcinoma cells. Int J Cancer. 123:1043–1052. 2008.
View Article : Google Scholar : PubMed/NCBI
|
|
23
|
Sun LX, Lin ZB, Duan XS, Lu J, Ge ZH, Li
XF, et al: Enhanced MHC class I and costimulatory molecules on
B16F10 cells by Ganoderma lucidum polysaccharides. J Drug
Target. 20:582–592. 2012. View Article : Google Scholar : PubMed/NCBI
|
|
24
|
Sun LX, Lin ZB, Li XJ, Li M, Lu J, Duan
XS, et al: Promoting effects of Ganoderma lucidum
polysaccharides on B16F10 cells to activate lymphocytes. Basic Clin
Pharmacol Toxicol. 108:149–154. 2011.
|
|
25
|
Sun LX, Lin ZB, Duan XS, Lu J, Ge ZH, Li
XJ, et al: Ganoderma lucidum polysaccharides antagonize the
suppression on lymphocytes induced by culture supernatants of
B16F10 melanoma cells. J Pharm Pharmacol. 63:725–735. 2011.
View Article : Google Scholar
|
|
26
|
Sun LX, Lin ZB, Duan XS, Lu J, Ge ZH, Song
YX, et al: Stronger cytotoxicity in CTLs with granzyme B and
porforin was induced by Ganoderma lucidum polysaccharides
acting on B16F10 cells. Biomed Prev Nutr. 2:113–118. 2012.
View Article : Google Scholar
|
|
27
|
Hufbauer M, Lazić D, Reinartz M, Akgül B,
Pfister H and Weissenborn SJ: Skin tumor formation in human
papillomavirus 8 transgenic mice is associated with a deregulation
of oncogenic miRNAs and their tumor suppressive targets. J Dermatol
Sci. 64:7–15. 2011. View Article : Google Scholar : PubMed/NCBI
|
|
28
|
Liang Y and Sundberg JP: SHARPIN regulates
mitochondria-dependent apoptosis in keratinocytes. J Dermatol Sci.
63:148–153. 2011. View Article : Google Scholar : PubMed/NCBI
|
|
29
|
Lai WW, Hsiao YP, Chung JG, Wei YH, Cheng
YW and Yang JH: Synergistic phototoxic effects of glycolic acid in
a human keratinocyte cell line (HaCaT). J Dermatol Sci. 64:191–198.
2011. View Article : Google Scholar : PubMed/NCBI
|
|
30
|
Chang SP, Shen SC, Lee WR, Yang LL and
Chen YC: Imatinib mesylate induction of ROS-dependent apoptosis in
melanoma B16F0 cells. J Dermatol Sci. 62:183–191. 2011. View Article : Google Scholar : PubMed/NCBI
|
|
31
|
Dong D, Jiang M, Xu X, Guan M, Wu J, Chen
Q and Xiang L: The effects of NB-UVB on the hair follicle-derived
neural crest stem cells differentiating into melanocyte lineage in
vitro. J Dermatol Sci. 66:20–28. 2012. View Article : Google Scholar : PubMed/NCBI
|
|
32
|
Batlle E, Sancho E, Francí C, Domínguez D,
Monfar M, Baulida J, et al: The transcription factor snail is a
repressor of E-cadherin gene expression in epithelial tumour cells.
Nat Cell Biol. 2:84–89. 2000. View
Article : Google Scholar : PubMed/NCBI
|
|
33
|
Comijn J, Berx G, Vermassen P, Verschueren
K, van Grunsven L, Bruyneel E, et al: The two-handed E box binding
zinc finger protein SIP1 downregulates E-cadherin and induces
invasion. Mol Cell. 7:1267–1278. 2001. View Article : Google Scholar : PubMed/NCBI
|
|
34
|
Wheelock MJ, Soler AP and Knudsen KA:
Cadherin junctions in mammary tumors. J Mammary Gland Biol
Neoplasia. 6:275–285. 2001. View Article : Google Scholar : PubMed/NCBI
|
|
35
|
Goodwin M and Yap AS: Classical cadherin
adhesion molecules: coordinating cell adhesion, signaling and the
cytoskeleton. J Mol Histol. 35:839–844. 2004. View Article : Google Scholar : PubMed/NCBI
|
|
36
|
Drees F, Pokutta S, Yamada S, Nelson WJ
and Weis WI: Alpha-catenin is a molecular switch that binds
E-cadherin-beta-catenin and regulates actin-filament assembly.
Cell. 123:903–915. 2005. View Article : Google Scholar : PubMed/NCBI
|
|
37
|
Doyle DD, Goings GE, Upshaw-Earley J, Page
E, Ranscht B and Palfrey HC: T-cadherin is a major
glycophosphoinositol-anchored protein associated with noncaveolar
detergent-insoluble domains of the cardiac sarcolemma. J Biol Chem.
273:6937–6943. 1998. View Article : Google Scholar
|
|
38
|
Koller E and Ranscht B: Differential
targeting of T- and N-cadherin in polarized epithelial cells. J
Biol Chem. 271:30061–30067. 1996. View Article : Google Scholar : PubMed/NCBI
|
|
39
|
Philippova M, Ivanov D, Tkachuk V, Erne P
and Resink TJ: Polarisation of T-cadherin to the leading edge of
migrating vascular cells in vitro: a function in vascular cell
motility? Histochem Cell Biol. 120:353–360. 2003. View Article : Google Scholar : PubMed/NCBI
|
|
40
|
Kinch MS, Petch L, Zhong C and Burridge K:
E-cadherin engagement stimulates tyrosine phosphorylation. Cell
Adhes Commun. 4:425–437. 1997. View Article : Google Scholar : PubMed/NCBI
|
|
41
|
Philippova MP, Bochkov VN, Stambolsky DV,
Tkachuk VA and Resink TJ: T-cadherin and signal-transducing
molecules co-localize in caveolin-rich membrane domains of vascular
smooth muscle cells. FEBS Lett. 429:207–210. 1998. View Article : Google Scholar : PubMed/NCBI
|
|
42
|
Vestal DJ and Ranscht B: Glycosyl
phosphatidylinositol-anchored T-cadherin mediates
calcium-dependent, homophilic cell adhesion. J Cell Biol.
119:451–461. 1992. View Article : Google Scholar : PubMed/NCBI
|
|
43
|
Dames SA, Bang E, Haüssinger D, Ahrens T,
Engel J and Grzesiek S: Insights into the low adhesive capacity of
human T-cadherin from the NMR structure of Its N-terminal
extra-cellular domain. J Biol Chem. 283:23485–23495. 2008.
View Article : Google Scholar : PubMed/NCBI
|
|
44
|
Takeuchi T and Ohtsuki Y: Recent progress
in T-cadherin (CDH13, H-cadherin) research. Histol Histopathol.
16:1287–1293. 2001.PubMed/NCBI
|
|
45
|
Joshi MB, Philippova M, Ivanov D,
Allenspach R, Erne P and Resink TJ: T-cadherin protects endothelial
cells from oxidative stress-induced apoptosis. FASEB J.
19:1737–1739. 2005.PubMed/NCBI
|
|
46
|
Fredette BJ, Miller J and Ranscht B:
Inhibition of motor axon growth by T-cadherin substrata.
Development. 122:3163–3171. 1996.PubMed/NCBI
|
|
47
|
Rubina K, Sysoeva V, Semina E, Kalinina N,
Yurlova E, Khlebnikova A and Molochkov V: Malignant transformation
in skin is associated with the loss of T-cadherin expression in
human keratinocytes and heterogeneity in T-cadherin expression in
tumor vasculature. Tumor Angiogenesis. Ran S: InTech; New York, NY:
pp. 135–166. 2012
|
|
48
|
Lee SW: H-cadherin, a novel cadherin with
growth inhibitory functions and diminished expression in human
breast cancer. Nat Med. 2:776–782. 1996. View Article : Google Scholar : PubMed/NCBI
|
|
49
|
Toyooka S, Toyooka KO, Harada K, Miyajima
K, Makarla P, Sathyanarayana UG, et al: Aberrant methylation of the
CDH13 (H-cadherin) promoter region in colorectal cancers and
adenomas. Cancer Res. 62:3382–3386. 2002.PubMed/NCBI
|