Introduction
Giant cell tumor (GCT) of the bone is an osteolytic
tumor that is potentially malignant or is between benign and
malignant, and is characterized by local invasive destruction of
bone (1) and a high post-curettage
recurrence rate (2). The mechanisms
underlying the osteolytic destruction of bone have been
demonstrated (2,3). Tumor cells directly or indirectly
stimulate the differentiation and maturation of osteoclasts and
promote bone resorption. However, multiple growth factors released
from the bone matrix promote tumor cell seeding in the bone tissue,
which in turn exacerbates the invasive growth of tumor cells in the
bone tissue. During this process, the activation of osteoclasts is
the key step. It has been suggested that the osteoprotegerin
(OPG)/receptor activator of NF-κB (RANK)/RANK ligand (RANKL) system
is vital for the osteolytic destruction of bones mediated by
osteoclasts (3,4). Hence, the involvement of the
OPG/RANK/RANKL system in the osteolytic features of GCT has
received increasing attention from orthopedists. In the present
study, we investigated the expression of OPG and OPG ligand (OPGL)
in GCT by immunohistochemical analysis, to explore the correlation
between their expression and tumor invasiveness. Our study provides
molecular biological evidence for the clinical application of
bisphosphonate drugs in the treatment of GCT.
Materials and methods
Clinical data
The present study included 18 male and 13 female
patients with an average age of 35.19 years (range, 13–78 years).
The study was approved by the Ethics Committee of the Orthopedic
Department, The General Hospital of Jinan Militray Commanding
Region, Jinan, Shandong, China. Written informed consent was
obtained from the patients and patient’s family. Of the 31
patients, there were 9 cases of distal femur tumor, 9 cases of
proximal tibia, 4 cases of proximal femur, 3 cases of proximal
humerus, 2 cases of iliac, 1 case of distal radius, 1 case of
distal ulna, 1 case of pubis and 1 case of calcaneus. According to
Jaffe’s classification criteria, there were 12 cases of class I, 17
cases of class II and 2 cases of class III tumors. Based on
Campanicci’s radiological classification criteria, there were 7
cases of class I, 16 cases of class II and 8 cases of class III
tumors. All patients were treated with tumor curettage and bone
grafting surgeries performed by the same surgical group.
All 31 patients received follow-up surveys for an
average duration of 76 months (range, 24–124 months). No metastasis
was observed. Eight patients exhibited recurrence, and the second
surgery included 1 case of tumor curettage and bone grafting, 4
cases of tumor resection and prosthesis replacement, 1 case of
tumor resection and inactivated replantation,and 1 case of extended
tumor resection. Following secondary surgery, the 8 patients
received follow-up for an average duration of 50 months (range,
20–124 months), and no metastasis or recurrence was observed.
Immunohistochemical analysis of the
expression of OPG and OPGL in GCT
Polyclonal rabbit anti-human antibodies specific for
OPG and OPGL were purchased from Boshide (Wuhan, China). The
substance P (SP; rabbit) immunohistochemistry kit was purchased
from Zhongshanjingqiao Biotechnical Co., Ltd. (Beijing, China).
H&E-stained slices of the 31 GCT pathological
specimens were reviewed and typical paraffin-embedded samples were
selected for analysis. The 31 representative samples were used to
prepare 3 paraffin sections with a thickness of 4 μm for
H&E staining and OPG/OPGL analysis. All methods were performed
according to the manufacturer’s instructions. The slice with
positive expression was used as the positive control. The negative
control was established with the primary antibody replaced by
phosphate-buffered saline (PBS).
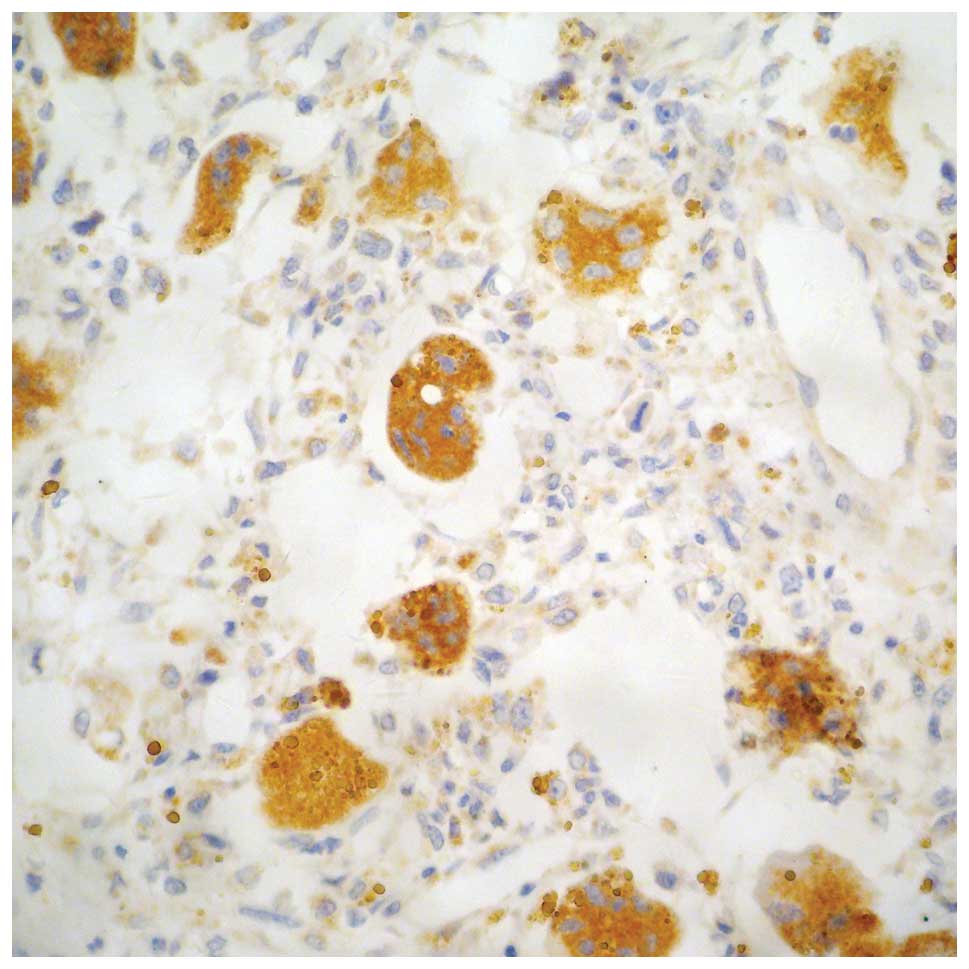
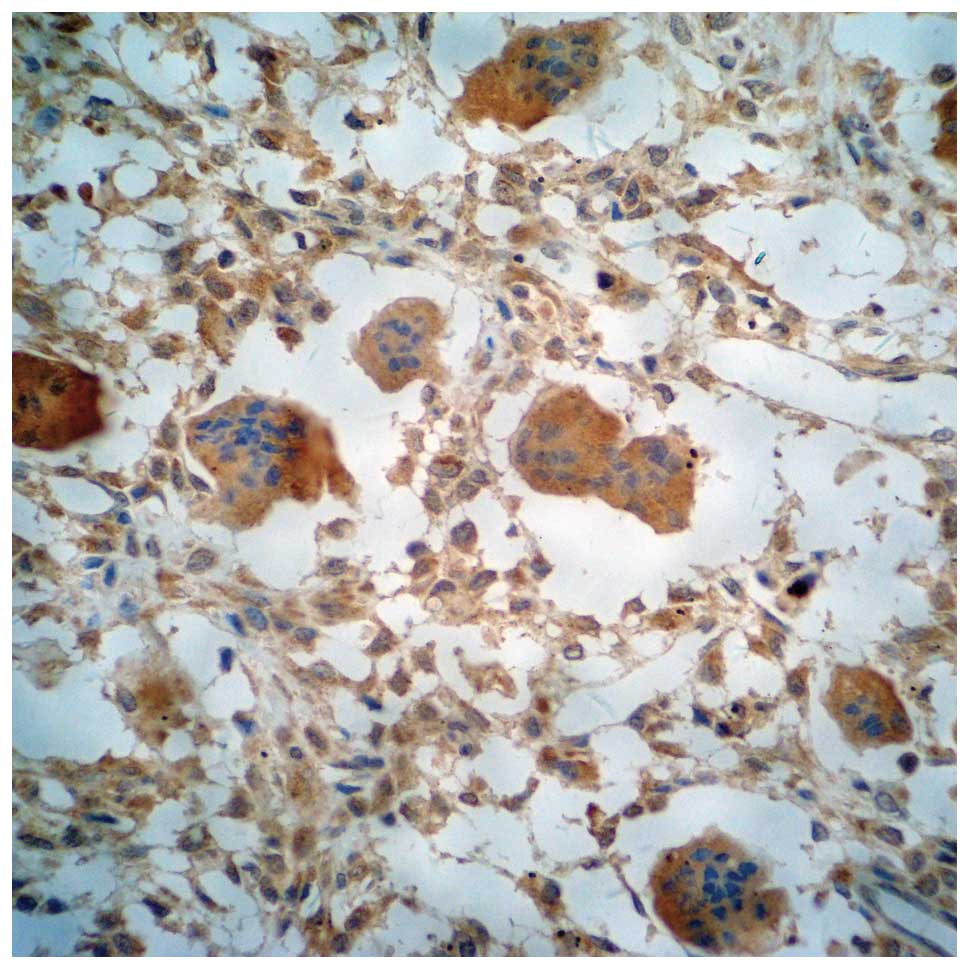
Both OPG and OPGL were expressed in stromal cells
(STCs) and multinucleated giant cells (MGCs). Positive expression
was determined by yellow, brown and tan particles on the plasma
membrane or in the cytosol (Figs.
1–5). The slices were scored
based on the integrated staining intensity and positive cell
number. The slices with the highest score were selected for
microscopic analysis. For each slice, 10 high magnification fields
(10×40) were randomly selected to analyze 100 cells per field
(1,000 tumor cells for 10 fields). The criteria used to determine
the OPG and OPGL expression were described previously (5). The cells were scored based on the
staining intensity of the plasma membrane and cytosol, and the
percentage of stained cells. The cell was negative if the product
of the two scores was ≤3, weakly positive if the product was
between 4 and 6 (+), positive if the product was 7 or 8 (++), and
strongly positive if the product was between 9 and 12 (+++).
Statistical analysis
The Wilcoxon rank-sum test, Kruskal-Wallis H test
and Spearman’s correlation method were used to analyze the
correlation of the OPG and OPGL expression levels with age, gender,
tumor site, Jaffe’s class, Campanicci’s class and prognosis. All
data analysis was performed using SPSS 17.0 software (SPSS, Inc.,
Chicago, IL, USA). P<0.05 was considered to indicate a
statistically significant difference.
Results
Expression of OPG in the GCT
Correlation between OPG expression in
the MGCs and clinical pathological characteristics
Of the 31 cases of GCT, 25 exhibited positive OPG
expression in the MGCs, and 6 demonstrated negative expression. The
OPG positive expression rate was 80.65%. Further analysis revealed
that the expression of OPG in the MGCs was not correlated with
gender, tumor site, Jaffe’s class or Campanicci’s class
(P>0.05). The patients between 21 and 40 years demonstrated a
positive rate of 94.74%, which was significantly higher than that
of the other two age groups (P<0.05). Notably, the expression of
OPG in the MGCs was correlated with recurrence (P<0.05; Table I).
 | Table ICorrelation between the expression of
OPG in MGCs and clinical pathology. |
Table I
Correlation between the expression of
OPG in MGCs and clinical pathology.
| Category | No. of patients | OPG expression in
MGCs
| Z or Hc | P-value |
|---|
| Positive | Negative | Rate (%) |
|---|
| Gender | | | | | | |
| Male | 18 | 15 | 3 | 83.33 | 0.439 | 0.661 |
| Female | 13 | 10 | 3 | 76.92 | | |
| Age (years) | | | | | | |
| ≤20 | 4 | 1 | 3 | 25.00 | 10.176 | 0.006 |
| 21–40 | 19 | 18 | 1 | 94.74 | | |
| >40 | 8 | 6 | 2 | 75.00 | | |
| Tumor site | | | | | | |
| Surrounding knee
joint | 18 | 15 | 3 | 83.33 | 0.439 | 0.661 |
| Other | 13 | 10 | 3 | 76.92 | | |
| Jaffe’s grading | | | | | | |
| I | 12 | 10 | 2 | 83.33 | 0.702 | 0.704 |
| II | 17 | 13 | 4 | 76.47 | | |
| III | 2 | 2 | 0 | 100.00 | | |
| Campanicci’s
grading | | | | | | |
| I | 7 | 4 | 3 | 57.14 | 3.096 | 0.213 |
| II | 16 | 14 | 2 | 87.50 | | |
| III | 8 | 7 | 1 | 87.50 | | |
| Prognosis | | | | | | |
| Cured | 23 | 21 | 2 | 91.30 | 2.506 | 0.012 |
| Recurrence | 8 | 4 | 4 | 50.00 | | |
Correlation between OPG expression in
the STCs and clinical pathological characteristics
Of the 31 cases of GCT, 23 demonstrated positive OPG
expression in the STCs, and 8 exhibited negative expression. The
OPG positive expression rate was 74.19%. Further analysis revealed
that the expression of OPG in the STCs was not correlated with
gender, age, tumor site, Jaffe’s class, Campanicci’s class or
prognosis (P>0.05; Table
II).
| Table IICorrelation between expression of OPG
in STCs and clinical pathology. |
Table II
Correlation between expression of OPG
in STCs and clinical pathology.
| Category | No. of patients | OPG expression in
STCs
| Z or Hc | P-value |
|---|
| Positive | Negative | Rate (%) |
|---|
| Gender | | | | | | |
| Male | 18 | 13 | 5 | 72.22 | 0.290 | 0.828 |
| Female | 13 | 10 | 3 | 76.92 | | |
| Age (years) | | | | | | |
| ≤20 | 4 | 2 | 2 | 50.00 | 2.700 | 0.259 |
| 21–40 | 19 | 16 | 3 | 84.21 | | |
| >40 | 8 | 5 | 3 | 62.50 | | |
| Tumor site | | | | | | |
| Surrounding knee
joint | 18 | 14 | 4 | 77.78 | 1.880 | 0.060 |
| Other | 13 | 9 | 4 | 69.23 | | |
| Jaffe’s grading | | | | | | |
| I | 12 | 9 | 3 | 75.00 | 0.789 | 0.674 |
| II | 17 | 12 | 5 | 70.59 | | |
| III | 2 | 2 | 0 | 100.00 | | |
| Campanicci’s
grading | | | | | | |
| I | 7 | 4 | 3 | 57.14 | 1.750 | 0.417 |
| II | 16 | 12 | 4 | 75.00 | | |
| III | 8 | 7 | 1 | 87.50 | | |
| Prognosis | | | | | | |
| Cured | 23 | 19 | 4 | 82.61 | 1.786 | 0.074 |
| Recurrence | 8 | 4 | 4 | 50.00 | | |
Correlation between OPG expression in
the GCT and clinical pathological characteristics
The Spearman’s analysis revealed that the expression
of OPG in the MGCs and the STCs was not correlated with gender,
age, tumor site, Jaffe’s class or Campanicci’s class (P>0.05);
however, it was negatively correlated with prognosis (rs=−0.397 and
P=0.027 for MGCs; rs=−0.390 and P=0.030 for STCs).
Expression of OPGL in the GCT
Correlation between OPGL expression in
the MGCs and clinical pathological characteristics
Of the 31 cases of GCT, 13 demonstrated positive
OPGL expression in the MGCs, and 18 had negative expression. The
OPG positive expression rate was 41.94%. Further analysis revealed
that the expression of OPGL in the MGCs was not correlated with
gender, tumor site, Jaffe’s class or Campanicci’s class
(P>0.05). The patients <20 years demonstrated a positive rate
of 100%, which was significantly higher than that of the other two
age groups (P<0.05). Notably, the expression of OPGL in the MGCs
was correlated with recurrence (P<0.05; Table III).
| Table IIICorrelation between expression of
OPGL in MGCs and clinical pathology. |
Table III
Correlation between expression of
OPGL in MGCs and clinical pathology.
| Category | No. of
patients | OPG expression in
MGCs
| Z or Hc | P-value |
|---|
| Positive | Negative | Rate (%) |
|---|
| Gender | | | | | | |
| Male | 18 | 9 | 9 | 50.00 | 1.053 | 0.292 |
| Female | 13 | 4 | 9 | 30.76 | | |
| Age (years) | | | | | | |
| ≤20 | 4 | 4 | 0 | 100.00 | 6.232 | 0.044 |
| 21–40 | 19 | 6 | 13 | 31.58 | | |
| >40 | 8 | 3 | 5 | 37.50 | | |
| Tumor site | | | | | | |
| Surrounding knee
joint | 18 | 7 | 11 | 38.89 | 0.398 | 0.691 |
| Other | 13 | 6 | 7 | 46.15 | | |
| Jaffe’s
grading | | | | | | |
| I | 12 | 4 | 8 | 33.33 | 3.536 | 0.171 |
| II | 17 | 9 | 8 | 52.94 | | |
| III | 2 | 0 | 2 | 0 | | |
| Campanicci’s
grading | | | | | | |
| I | 7 | 2 | 5 | 28.57 | 4.699 | 0.095 |
| II | 16 | 5 | 11 | 31.25 | | |
| III | 8 | 6 | 2 | 75.00 | | |
| Prognosis | | | | | | |
| Cured | 23 | 7 | 16 | 30.43 | 2.165 | 0.030 |
| Recurrence | 8 | 6 | 2 | 75.00 | | |
The correlation between OPGL
expression in the STCs and clinical pathological
characteristics
Of the 31 cases of GCT, 21 exhibited positive OPGL
expression in the STCs, and 10 demonstrated negative expression.
The OPG-positive rate was 67.74%. Further analysis revealed that
the expression of OPGL in the STCs was not correlated with gender,
tumor site, Campanicci’s class or prognosis (P>0.05). The
patients between 21 and 40 years demonstrated a positive rate of
84.21%, which was significantly higher than that of the other two
age groups (P<0.05). Importantly, the OPGL positive expression
rate was significantly higher in the Jaffe’s class I group (91.67%)
than in the Jaffe’s class II and III groups (P<0.05; Table IV).
| Table IVCorrelation between expression of
OPGL in STCs and clinical pathology. |
Table IV
Correlation between expression of
OPGL in STCs and clinical pathology.
| Category | No. of
patients | OPG expression in
STCs
| Z or Hc | P-value |
|---|
| Positive | Negative | Rate (%) |
|---|
| Gender | | | | | | |
| Male | 18 | 11 | 7 | 61.11 | 0.914 | 0.361 |
| Female | 13 | 10 | 3 | 76.92 | | |
| Age (years) | | | | | | |
| ≤20 | 4 | 1 | 3 | 25.00 | 6.633 | 0.036 |
| 21–40 | 19 | 16 | 3 | 84.21 | | |
| >40 | 8 | 4 | 4 | 50.00 | | |
| Tumor site | | | | | | |
| Surrounding knee
joint | 18 | 14 | 4 | 77.78 | 1.384 | 0.166 |
| Other | 13 | 7 | 6 | 53.85 | | |
| Jaffe’s
grading | | | | | | |
| I | 12 | 11 | 1 | 91.67 | 7.705 | 0.021 |
| II | 17 | 10 | 7 | 58.82 | | |
| III | 2 | 0 | 2 | 0 | | |
| Campanicci’s
grading | | | | | | |
| I | 7 | 5 | 2 | 71.43 | 4.575 | 0.102 |
| II | 16 | 13 | 3 | 81.25 | | |
| III | 8 | 3 | 5 | 37.50 | | |
| Prognosis | | | | | | |
| Cured | 23 | 15 | 8 | 65.22 | 0.502 | 0.616 |
| Recurrence | 8 | 6 | 2 | 75.00 | | |
Correlation between OPGL expression in
the GCT and clinical pathological characteristics
The Spearman’s analysis revealed that the expression
of OPGL in the MGCs was not correlated with gender, age, tumor
site, Jaffe’s class or prognosis (P>0.05), but it was positively
correlated with Campanicci’s class (rs= 0.377, P= 0.037). The
expression of OPGL in the STCs was not correlated with gender, age,
tumor site, Campanicci’s class or prognosis (P>0.05), but it was
negatively correlated with Jaffe’s class (rs=−0.534, P=0.002).
Discussion
GCT is a common type of primary bone tumor and
accounts for 5–8% of the incidence of bone tumors. GCT commonly
occurs in 20 to 50-year-old individuals, and is mostly focused on
the metaphysis, particularly around the knee (∼65%). The invasion
of the GCT is mainly due to the osteolytic destruction of the local
bone. At present, the major surgical approaches for GCT treatment
include intralesional excision and en bloc or wide
resection. Intralesional excision has been used as the primary
approach for the treatment of GCT, but the recurrence rate is as
high as 20–50%. Wide excision is able to reduce the recurrence
rate, but the frequent occurrence of long-term complications
reduces the clinical efficacy. Although the development of
bisphosphonate drugs has provided a potent method for retaining the
joints of the patients and for improving the clinical efficacy,
limited information is available regarding the mechanisms
underlying the effects of these drugs. In the present study, we
retrospectively analyzed 31 patients with complete clinical data
for the past 10 years to provide scientific evidence for the
clinical use of bisphosphonate drugs. We investigated the
expression of OPG and OPGL in the GCTs using immunohistochemical
analysis, to explore the correlation between their expression and
the clinical characteristics of the tumor.
OPG is a soluble protein secreted by osteoblasts and
bone marrow stromal cells. OPG is also a decoy receptor, with OPGL
(also known as RANKL) as its ligand. By binding to the RANKL
secreted by the bone marrow stromal cells, OPG blocks the
interaction between RANKL and RANK, and subsequently acts to
inhibit the differentiation of osteoclasts and the bone resorption
activity of mature osteoclasts. In this way, OPG is able to induce
the apoptosis of osteoclasts, reduce bone resorption and protect
the bone. In addition, OPG is a member of the TNF receptor
superfamily, and is capable of binding to TNF ligands.
RANKL is mainly expressed in osteoblasts and bone
marrow stromal cells. RANKL binds to the plasma membrane, and is
subsequently localized on the surface of osteoblasts and bone
marrow stromal cells. The receptor of RANKL is RANK, which is
usually localized to the surface of osteoclast precursors. In the
presence of macrophage colony stimulating factor (M-CSF), when the
osteoclast precursors and osteoblasts or bone marrow stromal cells
come into contact with each other, RANKL binds to RANK on the
surface of the osteoclasts and subsequently induces the activation
and differentiation of the osteoclasts through the intracellular
signaling pathway. RANKL can simultaneously enhance the activity of
the mature osteoclasts and prevent osteoclast apoptosis. Therefore,
bone destruction caused by RANKL-mediated osteoclast activation is
necessary for the invasive growth of tumors.
The expression of OPG and OPGL in GCTs has been
demonstrated. Guo et al(6)
found that OPG is enriched in all types of GCT cells. Meng et
al(7) found that the OPG
protein is expressed in the MGCs and some STCs in GCTs. Hu et
al(8) and Liu et
al(9) both demonstrated that
OPG is located in the MGCs and STCs of GCTs, indicating that a
negative feedback mechanism exists in GCT and acts to inhibit
osteoclast formation and bone resorption. However, this feedback is
likely to be insufficient to counteract the effect of RANK. Hence,
bone resorption may still occur in the GCT tissues, of which the
clinical symptom is bone destruction.
Atkins et al(10) isolated STCs in the GCT, using RT-PCR
assay, and detected the expression of RANKL mRNA. Huang et
al(11) found that RANKL is
mainly expressed in the STCs, using the fluorescence in situ
hybridization assay. Hu et al(8) revealed that RANKL mRNA is enriched in
GCTs, and the ratio of RANKL mRNA to GAPDH is greater compared with
in normal bone tissues. Roux et al(12) demonstrated that RANKL is expressed
in the STCs and confirmed that it is secreted by these cells, using
immunohistochemical assay. Zhu et al(13) performed immunohistochemical analysis
and found that RANKL is expressed in both the MGCs and STCs in
GCTs. In Zhu et al, 23 of the 44 GCT cases had
RANKL-positive STCs and 10 cases exhibited RANKL-positive MGCs,
with a positive rate of 52 and 23%, respectively. Furthermore, the
RANKL expression in the STCs was negatively correlated with Jaffe’s
class, which was consistent with the morphological observation of
reduced NGC number, further indicating that RANKL is a key molecule
for the formation of MGCs.
In the present study, we found that OPG and OPGL
were expressed in both the MGCs and the STCs in the GCTs. OPG
exhibited a positive rate of 80.65% in the MGCs and 74.19% in the
STCs. OPGL demonstrated a positive rate of 41.94% in the MGCs and
67.74% in the STCs, which were significantly different. Statistical
analysis revealed that the positive rate and expression level of
OPG and OPGL in the MGCs and the STCs were correlated with multiple
clinical characteristics, which is consistent with previous
studies. We also observed the following results:
Firstly, the positive rate and expression level of
OPG and OPGL were different among the three age groups. The
positive rate of OPG in the MGCs was significantly higher in the 21
to 40-year-old patient group (94.74%) than in the other two age
groups (P<0.05). The positive rate of OPGL in the STCs was
significantly higher in the 21 to 40-year-old patient group
(84.21%) than in the other two age groups (P<0.05). The positive
rate of OPGL in the MGCs was significantly higher in the
≤20-year-old patient group (100.00%) than in the other two age
groups (P<0.05). These results indicated that the MGCs were the
main cause of bone destruction during the course of the GCT before
the age of 20 years, while the STCs were the key reason for the
bone destruction between the ages of 21 and 40 years.
Secondly, the expression of OPG and OPGL in
different types of cells in the GCT was able to affect the
prognosis. The positive rate of OPG in the MGCs was significantly
higher for the non-recurrence group (91.30%) than for the
recurrence group (50.00%; P<0.05). The expression level of OPG
in the MGCs and STCs was negatively correlated with prognosis
(rs=−0.397, P= 0.027; rs=−0.390, P= 0.030, respectively). Notably,
the higher the OPG expression level in the MGCs and STCs, the
higher the recurrence probability observed. The positive rate of
OPGL in the MGCs was significantly higher for the recurrence group
than for the non-recurrence group (P<0.05), indicating that the
expression of OPG in the MGCs may be used as an important indicator
for the prognosis.
Thirdly, the expression of OPGL in different types
of cells in the GCT was correlated with classification. The OPGL
positive expression rate of the STCs was significantly higher in
the Jaffe’s class I GCT (91.67%) than in the Jaffe’s class II and
III GCT (P<0.05). In the MGCs, the expression level of OPGL was
positively correlated with Campanicci’s classification (rs= 0.377,
P= 0.037); whereas in the STCs, the expression level of OPGL was
negatively correlated to the Jaffe’s classification (rs=−0.534,
P=0.002). These results indicated that MGCs and STCs have different
biological functions. Although it has been suggested that GCT is
mainly composed of STCs and the MGCs are only responsive cells, the
origin, properties and functions of MGCs remain unclear. It has
been suggested that MGCs play the role of osteoclasts. Thompson
et al(14) proposed that
MGCs are foreign body giant cells. Liu et al(15), found that MGCs are functionally
analogous to osteoclasts, using immunohistochemical staining and
enzyme staining assays, and suggested that MGCs are a type of
osteoclast-like multinucleated giant cell that has bone resorption
activity. In the present study, our results further suggested that
MGCs are likely to directly induce osteolytic bone destruction.
Furthermore, RANKL was able to regulate the differentiation and
maturation of the MGCs, to a certain extent, indicating that RANKL
is closely associated with bone destruction. Our observation is
consistent with that of Atkins et al, in that the osteolytic
bone destruction of GCTs is mediated by the OPG/RANK/RANKL
signaling system (16).
References
|
1
|
Wülling M, Delling G and Kaiser E: The
origin of the neoplastic stromal cell in giant cell tumor of bone.
Hum Pathol. 34:983–993. 2003.PubMed/NCBI
|
|
2
|
Turcotte RE, Wunder JS, Isler MH, Bell RS,
Schachar N, Masri BA, Moreau G and Davis AM: Giant cell tumor of
long bone: a Canadian Sarcoma Group study. Clin Orthop Relat Res.
397:248–258. 2002. View Article : Google Scholar : PubMed/NCBI
|
|
3
|
Yasuda H, Shima N, Nakagawa N, Yamaguchi
K, Kinosaki M, Goto M, Mochizuki SI, Tsuda E, Morinaga T, Udagawa
N, et al: A novel molecular mechanism modulating osteoclast
differentiation and function. Bone. 25:109–113. 1999. View Article : Google Scholar : PubMed/NCBI
|
|
4
|
Takahashi N, Udagawa N and Suda T: A new
member of tumor necrosis factor ligand family,
ODFI/OPGL/TRANCE/RANKL, regulates osteoclast differentiation and
function. Biochem Biophys Res Comm. 256:449–455. 1999. View Article : Google Scholar : PubMed/NCBI
|
|
5
|
Xu LZ and Yang WT: The criteria of
immunohistochemistry reaction results. China Oncology. 6:229–231.
1996.
|
|
6
|
Guo J, Wang Y, Ni J, Yang ZY, Huang JX and
Bai JZ: Expression and role of osteoclast differentiation
associated cytokine in giant cell tumors. Chinese J of CRTER.
11:242–246. 2007.
|
|
7
|
Meng XM, Yu SF and Wei MJ: Expression of
receptor activator of NF-kappa B ligand and osteoprotegerin protein
in the giant cell lesions of jaw. Chinese J of Stomatology.
40:294–297. 2005.(In Chinese).
|
|
8
|
Hu Y and Yu S: Gene expression of
osteoprotegerin and osteoclast differentiation factor in giant cell
tumor. Chinese J of Pathology. 31:128–131. 2002.PubMed/NCBI
|
|
9
|
Liu B, Yu SF and Li TJ: Multinucleated
giant cells in various forms of giant cell containing lesions of
the jaws express features of osteoclasts. J Oral Pathol Med.
32:367–375. 2003. View Article : Google Scholar : PubMed/NCBI
|
|
10
|
Atkins GJ, Haynes DR, Graves SE, Evdokiou
A, Hay S, Bouralexis S and Findlay DM: Expression of osteoclast
differentiation signals by stromal elements of giant cell tumor. J
Bone Miner Res. 15:640–649. 2000. View Article : Google Scholar : PubMed/NCBI
|
|
11
|
Huang L, Xu J, Wood DJ and Zheng MH: Gene
expression of osteoprotegerin ligand, osteoprotegerin, and receptor
activator of NF-kappaB in giant cell tumor of bone: possible
involvement in tumor cell-induced osteoclast-like cell formation.
Am J Pathol. 156:761–767. 2000. View Article : Google Scholar : PubMed/NCBI
|
|
12
|
Roux S, Amazit L, Meduri G,
Guiochon-Mantel A, Milgrom E and Mariette X: RANK (receptor
activator of nuclear factor kappa B) and RANK ligand are expressed
in giant cell tumors of bone. Am J Clin Pathol. 117:210–216. 2002.
View Article : Google Scholar : PubMed/NCBI
|
|
13
|
Zhu Y, Dong SK and Fan QH: Expression of
osteoclast differentiation factor and its receptor and decoy
receptor in giant cell tumor of bone. J Southeast Univ (Medical
Science Edition). 24:330–333. 2005.
|
|
14
|
Thompson SH, Bischoff P and Bender S:
Central giant cell granuloma of the mandible. J Oral Maxillofac
Surg. 41:743–746. 1983. View Article : Google Scholar : PubMed/NCBI
|
|
15
|
Liu B, Yu SF and Pang SZ: Purification and
study of the characteristics of the multinucleated giant cells of
the giant cell tumor. Journal of Peking University (Health
Sciences). 35:23–27. 2003.(In Chinese).
|
|
16
|
Atkins GJ, Kostakis P, Vincent C, Farrugia
AN, Houchins JP, Findlay DM, Evdokiou A and Zannettino AC: RANK
expression as a cell surface marker of human osteoclast precursors
in peripheral blood, bone marrow, and giant cell tumors of bone. J
Bone Miner Res. 21:1339–1349. 2006. View Article : Google Scholar : PubMed/NCBI
|