Introduction
Forkhead box P3 (Foxp3), a forkhead transcription
factor family member implicated in T cell regulation, activation
and differentiation, is a nuclear protein that is thought to
function as a transcriptional repressor. The lack of a functional
Foxp3 gene product has been demonstrated to lead to the defective
production of regulatory T cells (Tregs), a subpopulation of T
cells specialized in maintaining the balance between immunity and
autotolerance (1). Increased Foxp3
expression in T cells (2),
peripheral blood and tumors has been associated with disease
progression and a worse prognosis in cancer patients, including
melanoma patients. For a number of years, Foxp3 expression has been
exclusively linked to the T cell lineage, but, recently, Foxp3 has
been reported to be expressed in a variety of cancer cell lines
(2–5). In a previous study, Foxp3 expression
in primary breast cancer was associated with a worse overall
survival probability, and this risk was correlated with increased
Foxp3 immunostaining (6). Foxp3
expression in cancer cells may have a number of functions related
to the evasion of the immune response, including the modulation of
cytokines, chemokines, hormones and other proteins related to
invasion and metastasis, but this remains to be examined.
Understanding Foxp3 function is important for developing assays on
the basis of using Foxp3 for disease prognosis, drug monitoring and
treatment (2). In the present
study, the levels of Foxp3, CD25 and interleukin (IL)-2 expression
were investigated in the B16F10 cancer cell line in vitro
and the expression levels of these factors were correlated with
tumor growth in a murine model of melanoma.
Materials and methods
Animals and cell lines
The B16F10 murine melanoma cell line (American Type
Culture Collection, Manassas, VA, USA) was cultured at 37°C in 5%
CO2 in complete media consisting of Dulbecco’s modified
Eagle’s medium (DMEM/F-12; Life Technologies, Invitrogen,
Burlington, ON, Canada) and 10% fetal bovine serum (Gibco, Grand
Island, NY, USA). C57/BL6 mice (5–6 weeks old) were acquired from
Harlan Laboratories (Mexico). The mice were housed in a specific
pathogen-free environment. All experimental protocols were approved
by the Institutional Animal Care and Use Committee of the
Department of Immunology and Virology of the University Autonoma of
Nuevo León (UANL; Nuevo León, México).
Foxp3 mRNA expression
Foxp3 mRNA expression was examined by quantitative
(q)PCR. After total RNA isolation from the tumor cell line B16F10
and reverse transcription into cDNA, qPCR was performed using the
Chromo4™ Real-Time PCR Detector (Bio-Rad, Hercules, CA, USA), the
SYBR Supermix kit (Invitrogen, Paisley, UK), the RT2PCR
Primer Set for Foxp3 (SuperArray Biosciences, Frederick, MD, USA)
and β-actin as a reference gene (RT2PCR Primer Set;
SuperArray Biosciences). The qPCR thermocycling conditions for
Foxp3 were 10 min at 95°C for an initial hold, followed by 40
cycles of denaturation at 95°C, annealing at 60°C and extension at
72°C, all for 15 sec. The qPCR thermocycling conditions for β-actin
were 10 min at 95°C for an initial hold, followed by 40 cycles of
denaturation at 95°C for 15 sec and annealing/extension at 60°C for
60 sec. Relative expression was analyzed using Opticon Monitor™
software (Bio-Rad). For the PCR amplification, 20 μM of forward,
5′-GGCATCGTGATGGACTCCG-3′ and reverse, 5′-GCTGGAAGGTGGACAGCGA-3′
primers were used for β-actin, and the RT2PCR Primer Set
was used for Foxp3 (SuperArray Biosciences) in a total reaction
volume of 25 μl.
Flow cytometry analysis
To analyze the cellular expression levels of CD25
and Foxp3, 1×10⁶ B16F10 cells obtained from culture or
tumors were stained using an anti-mouse CD25 antibody (eBioscience,
San Diego, CA, USA) in a final volume of 100 μl flow cytometry
staining buffer and incubated at 4°C for 30 min. An Fc block was
added to the incubation buffer with the anti-mouse CD25, and the
cells were then washed in cold flow cytometry staining buffer. The
cells were pelleted by centrifugation at 220 × g, then the
supernatant was discarded and the cells were resuspended with a
vortex pulse. Freshly prepared fixation/permeabilization working
solution (1 ml) was added to the cells, which were then incubated
at 4°C for 30 min, washed twice with 2 ml 1X permeabilization
buffer and centrifuged at 440 × g to pellet the cells. The
supernatant was then discarded, and Fc block in 1X permeabilization
buffer was added to the cells in a final volume of 100 μl prior to
incubation at 4°C for 15 min. An anti-mouse/rat Foxp3 (FJK-16s)
antibody (eBioscience) in 1X permeabilization buffer was added
without washing after the blocking step and incubated at 4°C for 30
min in the dark. Subsequently, the cells were washed once with 2 ml
1X permeabilization buffer. The stained cells were collected by
centrifugation at 220 × g after discarding the supernatant and
resuspended in 1% paraformaldehyde. The data were analyzed using a
flow cytometer (Epics Altra; Beckman Coulter, Fullerton, CA,
USA).
Foxp3 detection by confocal
microscopy
The B16F10 cells (1×10⁶) were treated
with permeabilization solution (eBioscience) for 30 min at 4°C in
the dark. Subsequently, the cells were centrifuged at 600 × g for
10 min and resuspended in 100 ml permeabilization buffer containing
FITC-anti-mouse Foxp3 antibody (eBioscience) and incubated for 30
min. Subsequent to centrifugation, the cells were resuspended in 20
ml paraformaldehyde and mounted on the cover slide using
Vectashield® Mounting Medium with DAPI (Vector
Laboratories, Burlingame, CA, USA) and immediately visualized by
confocal microscopy.
Tumor inoculation and B16F10
isolation
The B16F10 melanoma cells (5×10⁵) were
resuspended in 200 μl phosphate-buffered saline (PBS) and
subcutaneously inoculated into the right flank of 6-week-old
C57BL/6 mice. The mice were sacrificed at 7, 14 and 21 days
following a visible tumor appearance, and the tumor was removed.
The B16F10 cells were obtained from the tumor by washing the tumor
tissues with DMEM/F12 using a sterile syringe. Subsequent to being
washed several times, 15 ml ammonia-chloride-potassium (ACK lysis
buffer: 0.15 M NH4Cl; 0.1 mM KHCO3; 0.1 mM
Na2EDTA, pH 7.2) was added to the collected cells to
remove any red blood cells, and the cells were centrifuged at 440 ×
g. To eliminate the T cells and only obtain the intratumoral B16F10
cells, the cells were resuspended in isolation buffer from the
Dynabeads® FlowComp™ Mouse Pan T (CD90.2) kit
(Invitrogen, Carlsbad, CA, USA) at a concentration of
1×10⁸ cells/ml. The FlowComp mouse CD90.2 antibody from
the kit was added to the cell suspension at a ratio of 25 μl
antibodies/500 μl cell suspension (5×10⁷ cells), then
mixed and incubated for 10 min at 2–8°C. Following incubation, the
cells were washed by adding 2 ml isolation buffer, then centrifuged
at 440 × g for 8 min and resuspended in 1 ml isolation buffer.
Resuspended Dynabeads FlowComp (75 μl) were added to the tube,
mixed and incubated for 15 min at room temperature with rolling and
tilting. The tube was then placed on a magnet for a minimum of 1
min. The supernatant was carefully collected while the tube
remained on the magnet. The washing step was repeated once and the
supernatant was collected again. Finally, the supernatant was
cultured in a 25-cm2 cell culture flask and incubated in
an atmosphere of 37°C and 5% CO2 for 3 h. Once the
intratumoral B16F10 cells adhered to the flask, they were washed
with PBS to remove any cell debris and unwanted cell types. The
concentration of the intratumoral B16F10 melanoma cells was
adjusted to 1×10⁶ cells in a final volume of 100 μl flow
cytometry staining buffer (eBioscience). These cells were analyzed
for Foxp3 and CD25 expression as described above.
Isolation of intratumoral B16F10 melanoma
cells
B16F10 melanoma cells (5×10⁵) resuspended
in 200 μl PBS were subcutaneously inoculated into the right flank
of 6-week-old C57BL/6 mice. Tumors were surgically removed at 7, 14
and 21 days after tumor appearance. The cells were collected after
washing the tumor several times with DMEM/F12 using a sterile
syringe. To lyse the red blood cells, ammonium-chloride-potassium
(ACK) lysis buffer (0.15 M NH4Cl; 0.1 mM
KHCO3; 0.1 mM Na2EDTA; pH 7.2) was added to
the suspension of collected tumor cells, as previously described,
in order to eliminate cell types that were not B16F10 cells. T
lymphocytes from each pool of tumor cells were positively selected
and removed using anti-CD90.2 mAb-coated Dynabeads, according to
the standard immunoselection protocol recommended by the
manufacturer (Dynal®, Invitrogen).
Finally, the cellular suspension was cultured in a
25-cm2 cell culture flask and incubated in an atmosphere
of 37°C and 5% CO2 for 3 h. Once the intratumoral B16F10
cells had adhered to the flask, they were washed with PBS to remove
any cell debris and other contaminating cells. The intratumoral
B16F10 melanoma cells were adjusted to a concentration of
1×10⁶ cells in a final volume of 100 μl flow cytometry
staining buffer (eBioscience). The cells were analyzed for Foxp3
expression as described previously.
Cytokine production
The B16F10 melanoma cells (5×10³
cells/200 μl DMEM/F12 supplemented with 10% serum fetal bovine)
were cultured for 48 h in an atmosphere of 37°C and 5%
CO2, and the supernatants were collected and stored at
−20°C for the subsequent analysis of cytokine production with ELISA
[interferon (IFN)-γ, IL-2, transforming growth factor (TGF)-β and
IL-10; Invitrogen]. The tumors induced by the B16F10 melanoma cells
were collected by surgical means at 7, 14 and 21 days after tumor
appearance and macerated by adding 1X PBS at a proportion of 400 mg
tumor:1 ml PBS. The supernatants were collected and stored at −20°C
until use in an ELISA for cytokine production (IFN-γ, IL-2, TGF-β
and IL-10; Invitrogen) according to the manufacturer’s
instructions. The absorbance was determined at 450 nm with a
microplate autoreader (EL311; Bio Tek Instruments, Winooski, VT,
USA). A commercial BD™ Cytometric Bead Array Mouse Th1/Th2 Cytokine
kit (CBA; lot: 3817; BD Biosciences, San Diego, CA, USA) was used
to determine the levels of IL-2, IFN-γ, IL-4, IL-5 and tumor
necrosis factor (TNF)-α (pg/ml) in supernatants of the B16F10
melanoma and tumor cells, according to the manufacturer’s
instructions. Fluorescence was analyzed using a flow cytometer (BD
Accuri C6; Becton-Dickinson Biosciences, Ann Arbor, MI, USA), and
the cytokine level was determined using FCAP Array Software V 3.0
(Soft Flow Hungary, Ltd., Pécs, Hungary). The parameters were
determined in the supernatants obtained after 48 h of B16F10 cell
culture and in the tumors of the mice with melanoma, which were
collected at 7, 14 and 21 days after the appearance of the
tumor.
Results
Foxp3 detection in B16F10 cells
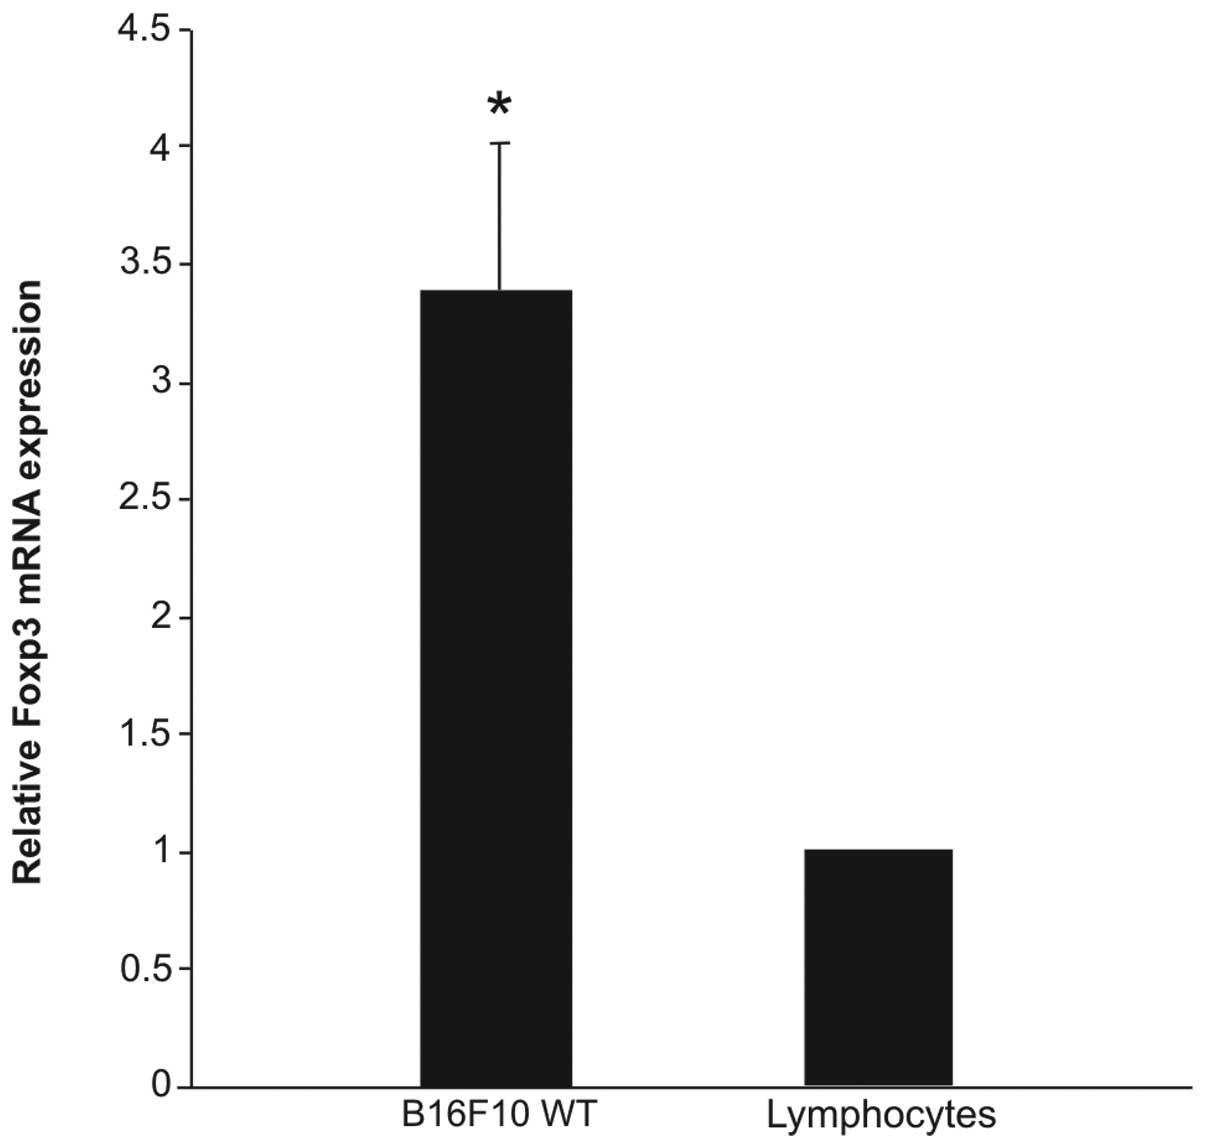
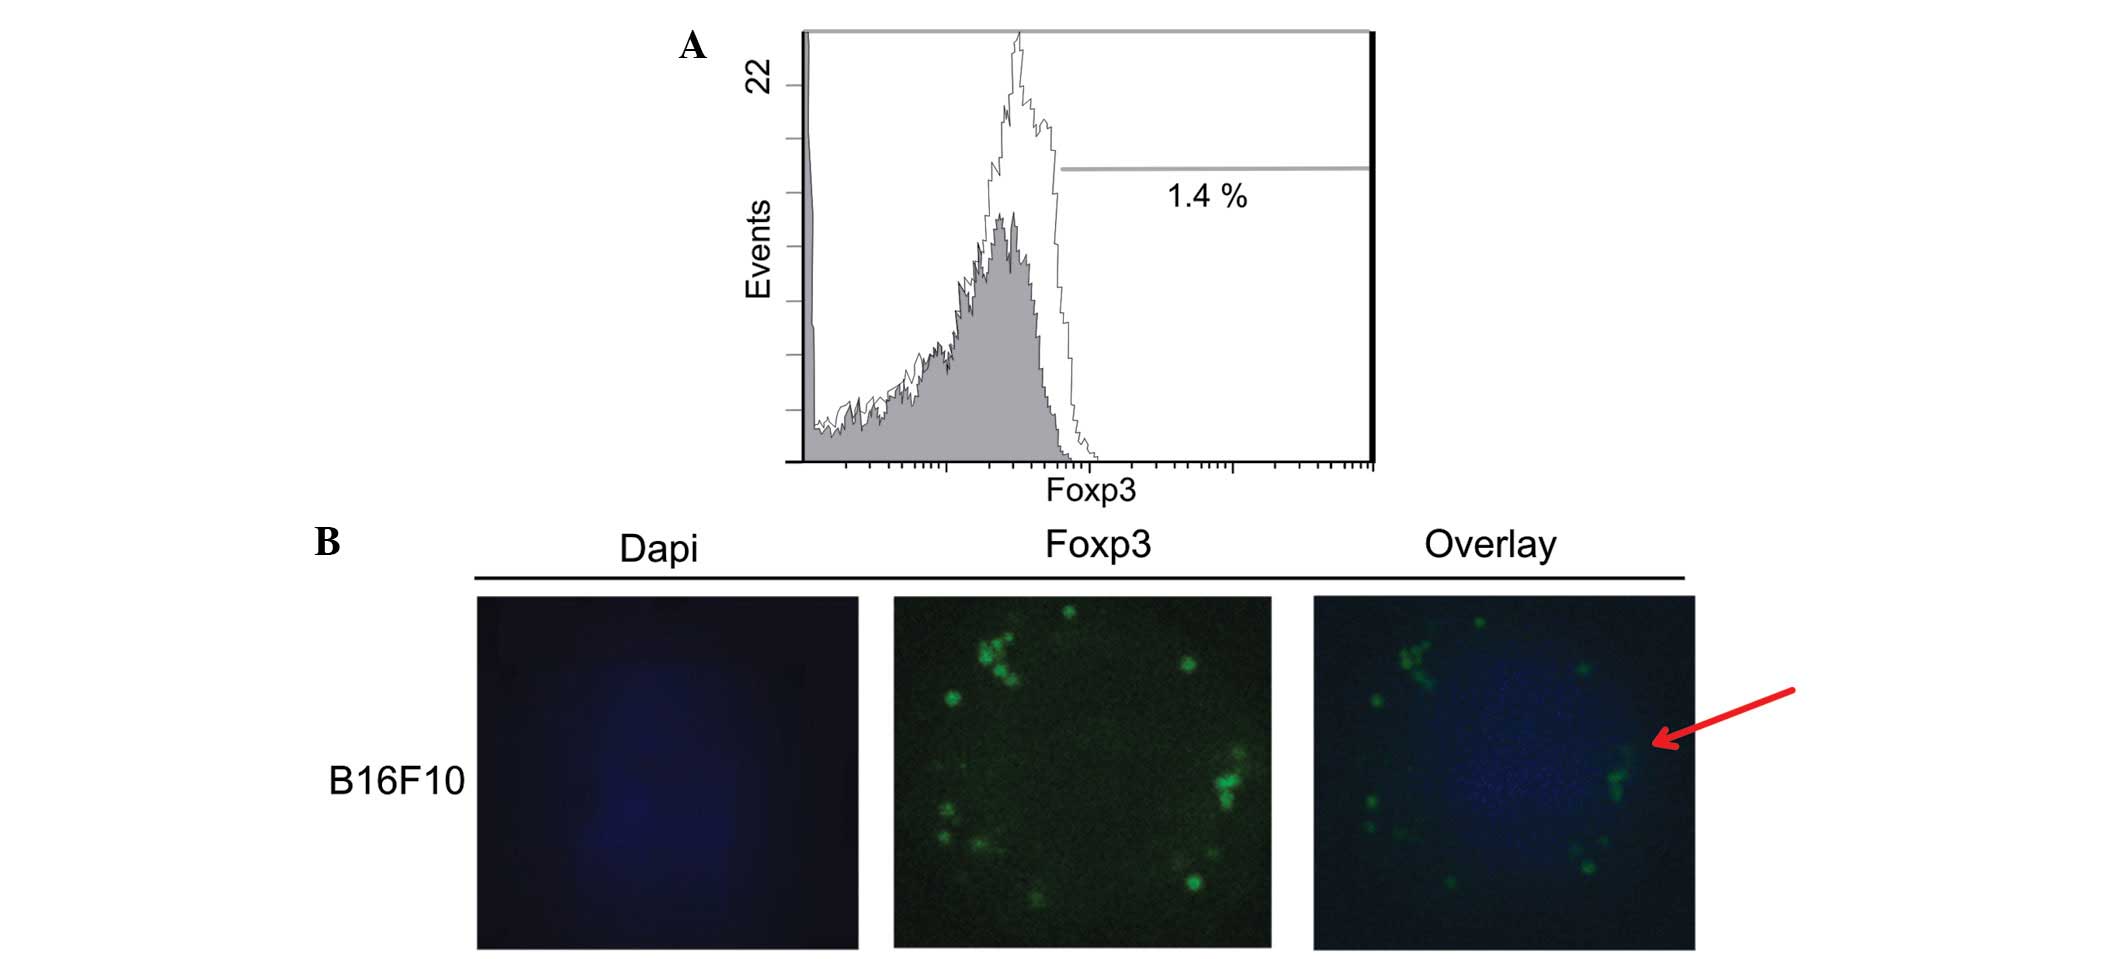
The expression of Foxp3 was detected in the B16F10
melanoma cells at the mRNA (Fig. 1)
and protein (Fig. 2) levels. The
results of qPCR demonstrated that the Foxp3 expression was 2.5-fold
higher in B16F10 cells than in the murine lymphocytes used as a
positive control (Fig. 1) and flow
cytometry revealed that the protein expression level was 1.4%
(Fig. 2A). These results were
confirmed with double-label immunofluorescence confocal microscopy
analysis (Fig. 2B).
Cytokine production
The production of the following cytokines was
detected in the cultured B16F10 cells by ELISA: IL-10 (1.75 pg/ml),
IL-2 (86.41 pg/ml), IFN-γ (2.45 pg/ml) and TGF-β (2.85 pg/ml).
The cytokine production from tumors at 7, 14 and 21
days demonstrated increasing amounts of IL-10 (0.53, 1.36 and 3.90
pg/ml, respectively) and IL-2 (4.06, 9.93 and 18.89 pg/ml,
respectively), whereas IFN-γ production decreased (20.38, 13.65 and
4.45 pg/ml, respectively) and the production of TGF-β was not
affected (1.27, 1.18 and 1.89 pg/ml, respectively; P<0.05;
Table I). When cytokine production
was examined by flow cytometry, the IL-2 levels in the B16F10 cell
line and at 7, 14 and 21 days of tumor growth were 45.72 pg/ml and
4.88, 7.37 and 13.55 pg/ml, respectively, and the IFN-γ levels were
1.05 pg/ml and 7.02, 3.75 and 0.95 pg/ml, respectively. TNF-α was
not detected in the B16F10 cell line, but was detected in the tumor
at 1.92, 2.32 and 3.77 pg/ml, respectively. IL-4 and IL-5 were not
detected in the cell line or the tumor (P<0.05; Table I).
 | Table ICytokine production in B16F10 murine
melanoma cells in vitro and from tumor supernatants of
murine melanoma. |
Table I
Cytokine production in B16F10 murine
melanoma cells in vitro and from tumor supernatants of
murine melanoma.
| Assay | Cytokines | Cytokine
production |
|---|
|
|---|
| B16F10 cell
supernantants in vitro 48 h | B16F10 tumor
supernatants |
|---|
|
|---|
| 7 days | 14 days | 21 days |
|---|
| ELISA | IL-10 | 1.750±0.002 | 0.530±0.007 | 1.360±0.0073 | 3.901±0.435 |
| IL-2 | 86.410±5.080a | 4.060±0.233 | 9.933±2.053a | 18.893±2.438a |
| TGF-β | 2.850±0.305 | 1.270±0.410 | 1.180±0.862 | 1.895±0.196 |
| INF-γ | 2.450±0.001 | 20.384±1.200 | 13.653±1.796a | 4.450±1.990a |
| Flow cytometry | IL-2 | 45.720±1.740 | 4.883±0.174 | 7.370±1.241 | 13.550±1.148a |
| INF-γ | 1.050±0.212 | 7.020±0.530 | 3.754±0.742a | 0.953±0.092a |
| TNF-α | ND | 1.922±0.084 | 2.322±0.183 | 3.778±0.160a |
| IL-4 | ND | ND | ND | ND |
| IL-5 | ND | ND | ND | ND |
Foxp3 and CD25 expression in intratumoral
B16F10 cells
An increase was observed in Foxp3 expression during
tumor growth in a time-dependent manner by flow cytometry at 7
(1.47%), 14 (21.57%) and 21 (89.25%) days (Fig. 3A and Table II). Due to the high production of
IL-2 in the B16F10 cells in vitro, the expression of CD25
was evaluated. It was demonstrated that 0.69% of the cellular
population expressed this marker in vitro (Fig. 4), while in vivo, CD25
expression was detected at 7 (0.90%), 14 (4.44%) and 21 (93.20%)
days of tumor growth in the B16F10 cells (Fig. 3B and Table II).
| Table IIDetermination of IL-2 production, CD25
and Foxp3 expression in intratumoral B16F10 cells during tumor
growth in a murine melanoma model in vivo. |
Table II
Determination of IL-2 production, CD25
and Foxp3 expression in intratumoral B16F10 cells during tumor
growth in a murine melanoma model in vivo.
| Tumor development,
days | IL-2 production,
pg/ml | CD25 expression,
% | Foxp3 expression,
% |
|---|
| 7 | 4.06±0.24 | 0.90 | 1.47 |
| 14 | 9.93±2.05a | 4.44a | 21.51a |
| 21 | 18.89±2.43a | 93.20a | 89.25a |
Correlation between days of tumor growth,
Foxp3, IL-2, CD25 and tumor weight
A significant correlation was observed between the
tumor weight (Fig. 5), Foxp3
expression, IL-2 production and CD25 expression, which was
dependent on the days of tumor growth, with the exception of the
correlation of IL-2 production with CD25 expression at 14 days
(r2=0.832) and IL-2 production with tumor weight at 21
days (r2=0.688) (Table
III).
| Table IIICorrelation coefficients of
intratumoral B16F10 Foxp3 expression, IL-2 production, B16F10 CD25
surface expression and tumor weight (g) during murine melanoma
development. |
Table III
Correlation coefficients of
intratumoral B16F10 Foxp3 expression, IL-2 production, B16F10 CD25
surface expression and tumor weight (g) during murine melanoma
development.
| Correlation
coefficient at 14 days | Correlation
coefficient at 21 days |
|---|
|
|
|
|---|
| 7 days | Intratumoral
Foxp3 | IL-2 | CD25 | Tumor weight, g | Intratumoral
Foxp3 | IL-2 | CD25 | Tumor weight,
g |
|---|
| Intratumoral
Foxp3 | 0.998a | 0.887 | 0.997a | 0.998a | 0.999a | 0.870 | 0.998a | 0.995 |
| IL-2 | 0.893 | 1.000b | 0.832 | 0.949 | 0.893 | 1.000b | 0.982a | 0.688a |
| CD25 | 0.998a | 0.923a | 0.982 | 0.997a | 0.995a | 0.951a | 0.999a | 0.915 |
| Tumor weight | 0.999a | 0.873 | 0.993a | 0.982a | 0.961a | 0.870 | 0.998a | 0.955a |
Discussion
Melanoma is a highly aggressive form of cancer. A
tumor thickness approaching 4 mm presents a high risk of
metastasis, and patients diagnosed with metastatic melanoma have a
median survival of 6–9 months (7).
Surgery eradicates so-called thin melanomas, but in a significant
number of patients with cutaneous melanomas that are 2–4 mm-thick,
the melanomas recur at local or distant sites post-surgery.
Therefore, the development of strategies aimed at identifying
biochemical markers, which indicate potentially early lesions that
may develop into highly metastatic tumors, and the appropriate
targets for drug intervention, is of crucial clinical importance.
Previous studies indicated that Foxp3 is expressed in breast cancer
cells, and that the expression level was associated with patient
survival (6). The expression of
Foxp3 in tumor cells has also been recently reported in pancreatic
cancer, melanoma and other tumor cell lines. Hinz et
al(8) reported that Foxp3 is
expressed in pancreatic cancer cells, and that Foxp3-expressing
cancer cells inhibited the proliferation of
CD4+CD25− T cells, potentially contributing
to the immune evasion of the tumor cells. Ebert et
al(9) reported the expression
of Foxp3 in not only Tregs, but also in melanoma cells in
metastatic melanoma tissue and tumor cell lines derived from
melanoma (SK-Mel-1 and SK-Mel-28) and other solid tumors [A172 and
U-87 MG (glioma); DU 145, PC-3 and LN-CaP (prostate cancer); A549,
CaLu-6 and NCI-H460 (lung cancer); HCT116, Caco-2 and SW480
(colorectal cancer); HT-1376, HT-1197 and HT-5637 (bladder cancer);
and MCF7, MDA-MB-231 and MDA-MD-468 (breast cancer)] (10). The present study showed that the
FoxP3 transcription factor is expressed by the B16F10 cell line and
B16F10 intratumoral cells. This observation is particularly
notable, as the present data corroborate the findings by Ebert
et al(9) in melanoma
cutaneous tissues, cell lines and the studies mentioned above.
These results from B16F10 melanoma cells suggest a major role of
Foxp3 in melanoma growth and may support the design of experimental
strategies using RNA interference to inhibit tumor growth and
enhance immunogenicity or, alternatively, to vaccinate against the
Foxp3 Δ3,4 isoform. This hypothesis should be examined in
experiments in which Foxp3 expression is knocked down in a B16F10
cell line. These cells may subsequently be used to inoculate a
murine model to corroborate this approach. The B16F10 cell line was
also demonstrated to produce IL-2, IL-10, IFN-γ and TGF-β cytokines
in the present study, and this cytokine production was also
detected in the tumoral microenvironment in a cytokine-dependent
(IL-2 increase and IFN-γ decrease) and time-dependent manner
induced by inoculation of these cells in mice. A previous study
observed the production of cytokines in cancer cell lines (PANC-89
expresses IL-6 but not TGF-β, whereas PANC-1 expresses TGF-β but
not IL-6) (10). The present study
corroborated the production of IL-2 and IFN-γ by flow cytometry in
the B16F10 cells in culture and also analyzed CD25 expression. This
receptor was expressed in B16F10 cells and B16F10 cells derived
from the tumor, and its expression was increased in a manner
dependent on tumor growth. The role of Foxp3 in human tumor cells
may vary among different tumor cell types. This variation may be as
Foxp3, as a suppressive transcription factor, represses different
molecular targets in various cells, and the fact that Foxp3 may
regulate the expression of several cytokines and their receptors,
including IL-2 and CD25 in B16F10 cells. These factors play
important roles in the immunosuppression of cancer as the decreased
production of cytokines that play roles in enhancing tumor immunity
and the increased production of cytokines that participate in
immunosuppression, including IL-10 and IL-2, play a role in the
generation of Treg cells. However, this hypothesis requires
experimental studies in which antibodies against IL-2 and CD25 and
cyclosporine are added to B16F10 cells to determine the level of
cellular proliferation. From the present data, it may be suggested
that Foxp3 participates in tumor growth and the modulation of the
IL-2, IFN-γ and TNF-α cytokines and CD25, and that it may play a
role in the immunosuppression of melanomas, possibly via this
pathway.
Acknowledgements
This study was supported by the Laboratory of
Immunology and Virology, Faculty of Biological Sciences, University
Autonoma of Nuevo León (UANL). Acknowledgement to Becton-Dickinson
for technical support with the use of the BD Accuri™ C6 Flow
Cytometer.
Abbreviations:
|
Tregs
|
regulatory T cells
|
|
IL
|
interleukin
|
|
IFN
|
interferon
|
|
TGF
|
transforming growth factor
|
|
TNF
|
tumor necrosis factor
|
References
|
1
|
Roncador G, Garcia JF, Garcia JF, Maestre
L, Lucas E, Menarguez J, Ohshima K, Nakamura S, Banham AH and Piris
MA: Foxp3, a selective marker for a subset of adult T-cell
leukemia/lymphoma. Leukemia. 19:2247–2253. 2005. View Article : Google Scholar : PubMed/NCBI
|
|
2
|
Lu H: FOXP3 expression and prognosis: role
of both the tumor and T cells. J Clin Oncol. 27:1735–1736. 2009.
View Article : Google Scholar : PubMed/NCBI
|
|
3
|
von Boehmer H: Mechanisms of suppression
by suppressor T cells. Nat Immunol. 6:338–344. 2005.PubMed/NCBI
|
|
4
|
Niu J, Jiang C, Li C, Liu L, Li K, Jian Z
and Gao T: Foxp3 expression in melanoma cells as a possible
mechanism of resistance to immune destruction. Cancer Immunol
Immunother. 60:1109–1118. 2011. View Article : Google Scholar : PubMed/NCBI
|
|
5
|
Karanikas V, Speletas M, Zamanakou M,
Kalala F, Loules G, Kerenidi T, Barda AK, Gourgoulianis KI and
Germenis AE: Foxp3 expression in human cancer cells. J Transl Med.
6:192008. View Article : Google Scholar : PubMed/NCBI
|
|
6
|
Merlo A, Casalini P, Carcangiu ML,
Malventano C, Triulzi T, Ménard S, Tagliabue E and Balsari A: FOXP3
expression and overall survival in breast cancer. J Clin Oncol.
27:1746–1752. 2009. View Article : Google Scholar : PubMed/NCBI
|
|
7
|
Chin L, Garraway LA and Fisher DE:
Malignant melanoma: genetics and therapeutics in the genomic era.
Genes Dev. 20:2149–2182. 2006. View Article : Google Scholar : PubMed/NCBI
|
|
8
|
Hinz S, Pagerols-Raluy L, Oberg HH,
Ammerpohl O, Grüssel S, Sipos B, Grützmann R, Pilarsky C,
Ungefroren H, Saeger HD, Klöppel G, Kabelitz D and Kalthoff H:
Foxp3 expression in pancreatic carcinoma cells as a novel mechanism
of immune evasion in cancer. Cancer Res. 67:8344–8350. 2007.
View Article : Google Scholar : PubMed/NCBI
|
|
9
|
Ebert LM, Tan BS, Browning J, Svobodova S,
Russell SE, Kirkpatrick N, Gedye C, Moss D, Ng SP, MacGregor D,
Davis ID, Cebon J and Chen W: The regulatory T cell-associated
transcription factor FoxP3 is expressed by tumor cells. Cancer Res.
68:3001–3009. 2008. View Article : Google Scholar : PubMed/NCBI
|
|
10
|
Monti P, Marchesi F, Reni M, Mercalli A,
Sordi V, Zerbi A, Balzano G, Di Carlo V, Allavena P and Piemonti L:
A comprehensive in vitro characterization of pancreatic ductal
carcinoma cell line biological behavior and its correlation with
the structural and genetic profile. Virchows Arch. 445:236–247.
2004. View Article : Google Scholar : PubMed/NCBI
|