Introduction
Gastric cancer is a malignant disease with high
incidence and mortality rates, particularly in Asian populations
(1,2). The oncogenesis and development of
gastric cancer are influenced by genetic and epigenetic factors.
DNA methylation is the most studied epigenetic mechanism. At
present, the focus of the majority of studies is the inactivation
of gene expression by hypermethylation of DNA located in tumor
suppressor gene promoter regions. The observation that promoter CG
island methylation inactivates a number of tumor suppressor genes
in gastric cancer, such as RASSF1A, P16 and
E-cadherin, has increased the understanding of the mechanism
of gastric carcinogenesis (3). For
technical reasons, the majority of previous studies have focused on
only a few genes. With the development of sequencing and microarray
technology, a large-scale study of the pattern of DNA methylation,
which is also called the methylome, became possible (4,5). The
present study analyzed DNA methylation characteristics of the
gastric cancer genome using the Infinium 450K methylation
microarray to further understand the pathogenesis of gastric cancer
and identify potential therapeutic targets and diagnostic markers
for gastric cancer.
Materials and methods
Clinical samples
In total, 40 patients with gastric cancer from the
Wuhan General Hospital of the Guangzhou Command (Wuhan, China)
during the period between March 2011 and June 2012 were included.
Each tumor sample was matched with adjacent apparently normal
mucosa (3–5 cm from the tumor margin) removed during the same
surgery. All samples were collected by one surgical pathology
fellow from the operating room immediately following the surgical
resection and frozen in the liquid nitrogen. Pathological diagnosis
was determined independently by two pathologists and disagreement
was resolved by consensus. The study protocol was approved by the
ethics committee of Wuhan General Hospital of Guangzhou Command
(Wuhan, China).
Genomic DNA extraction and quality
control
DNA was extracted from ~25 mg of tissue using a DNA
extraction kit (Quick-gDNA MiniPrep; Zymo Research Corporation,
Orange, CA, USA) according to the manufacturer’s instructions, and
DNA quality was assessed using spectrophotometry (UV-100, Shanghai
Precision Instrument Co., Ltd., Shanghai, China) and agarose gel
electrophoresis (Amresco LLC, Solon, OH, USA).
DNA methylation profiling with Infinium
450K methylation assay
In total, six paired samples were processed on the
chip (12 samples/chip). Genomic DNA (500 ng) was treated with
sodium bisulfite using the Zymo EZ DNA Methylation Kit™ (Zymo
Research Corporation) according to the manufacturer’s instructions,
with the alternative incubation conditions recommended for the
Illumina Infinium 450K methylation assay (Illumina Inc., San Diego,
CA, USA). The methylation assay was performed on 4 μl of
bisulfite-converted genomic DNA at 50 ng/μl according to the
Infinium HD methylation assay (Illumina Inc.) instructions. The
quality of the results was assessed using the GenomeStudio™
Methylation Module v1.8 software (Illumina, Inc., San Diego, CA,
USA) and all samples passed this quality control. β-values were
extracted using the same software.
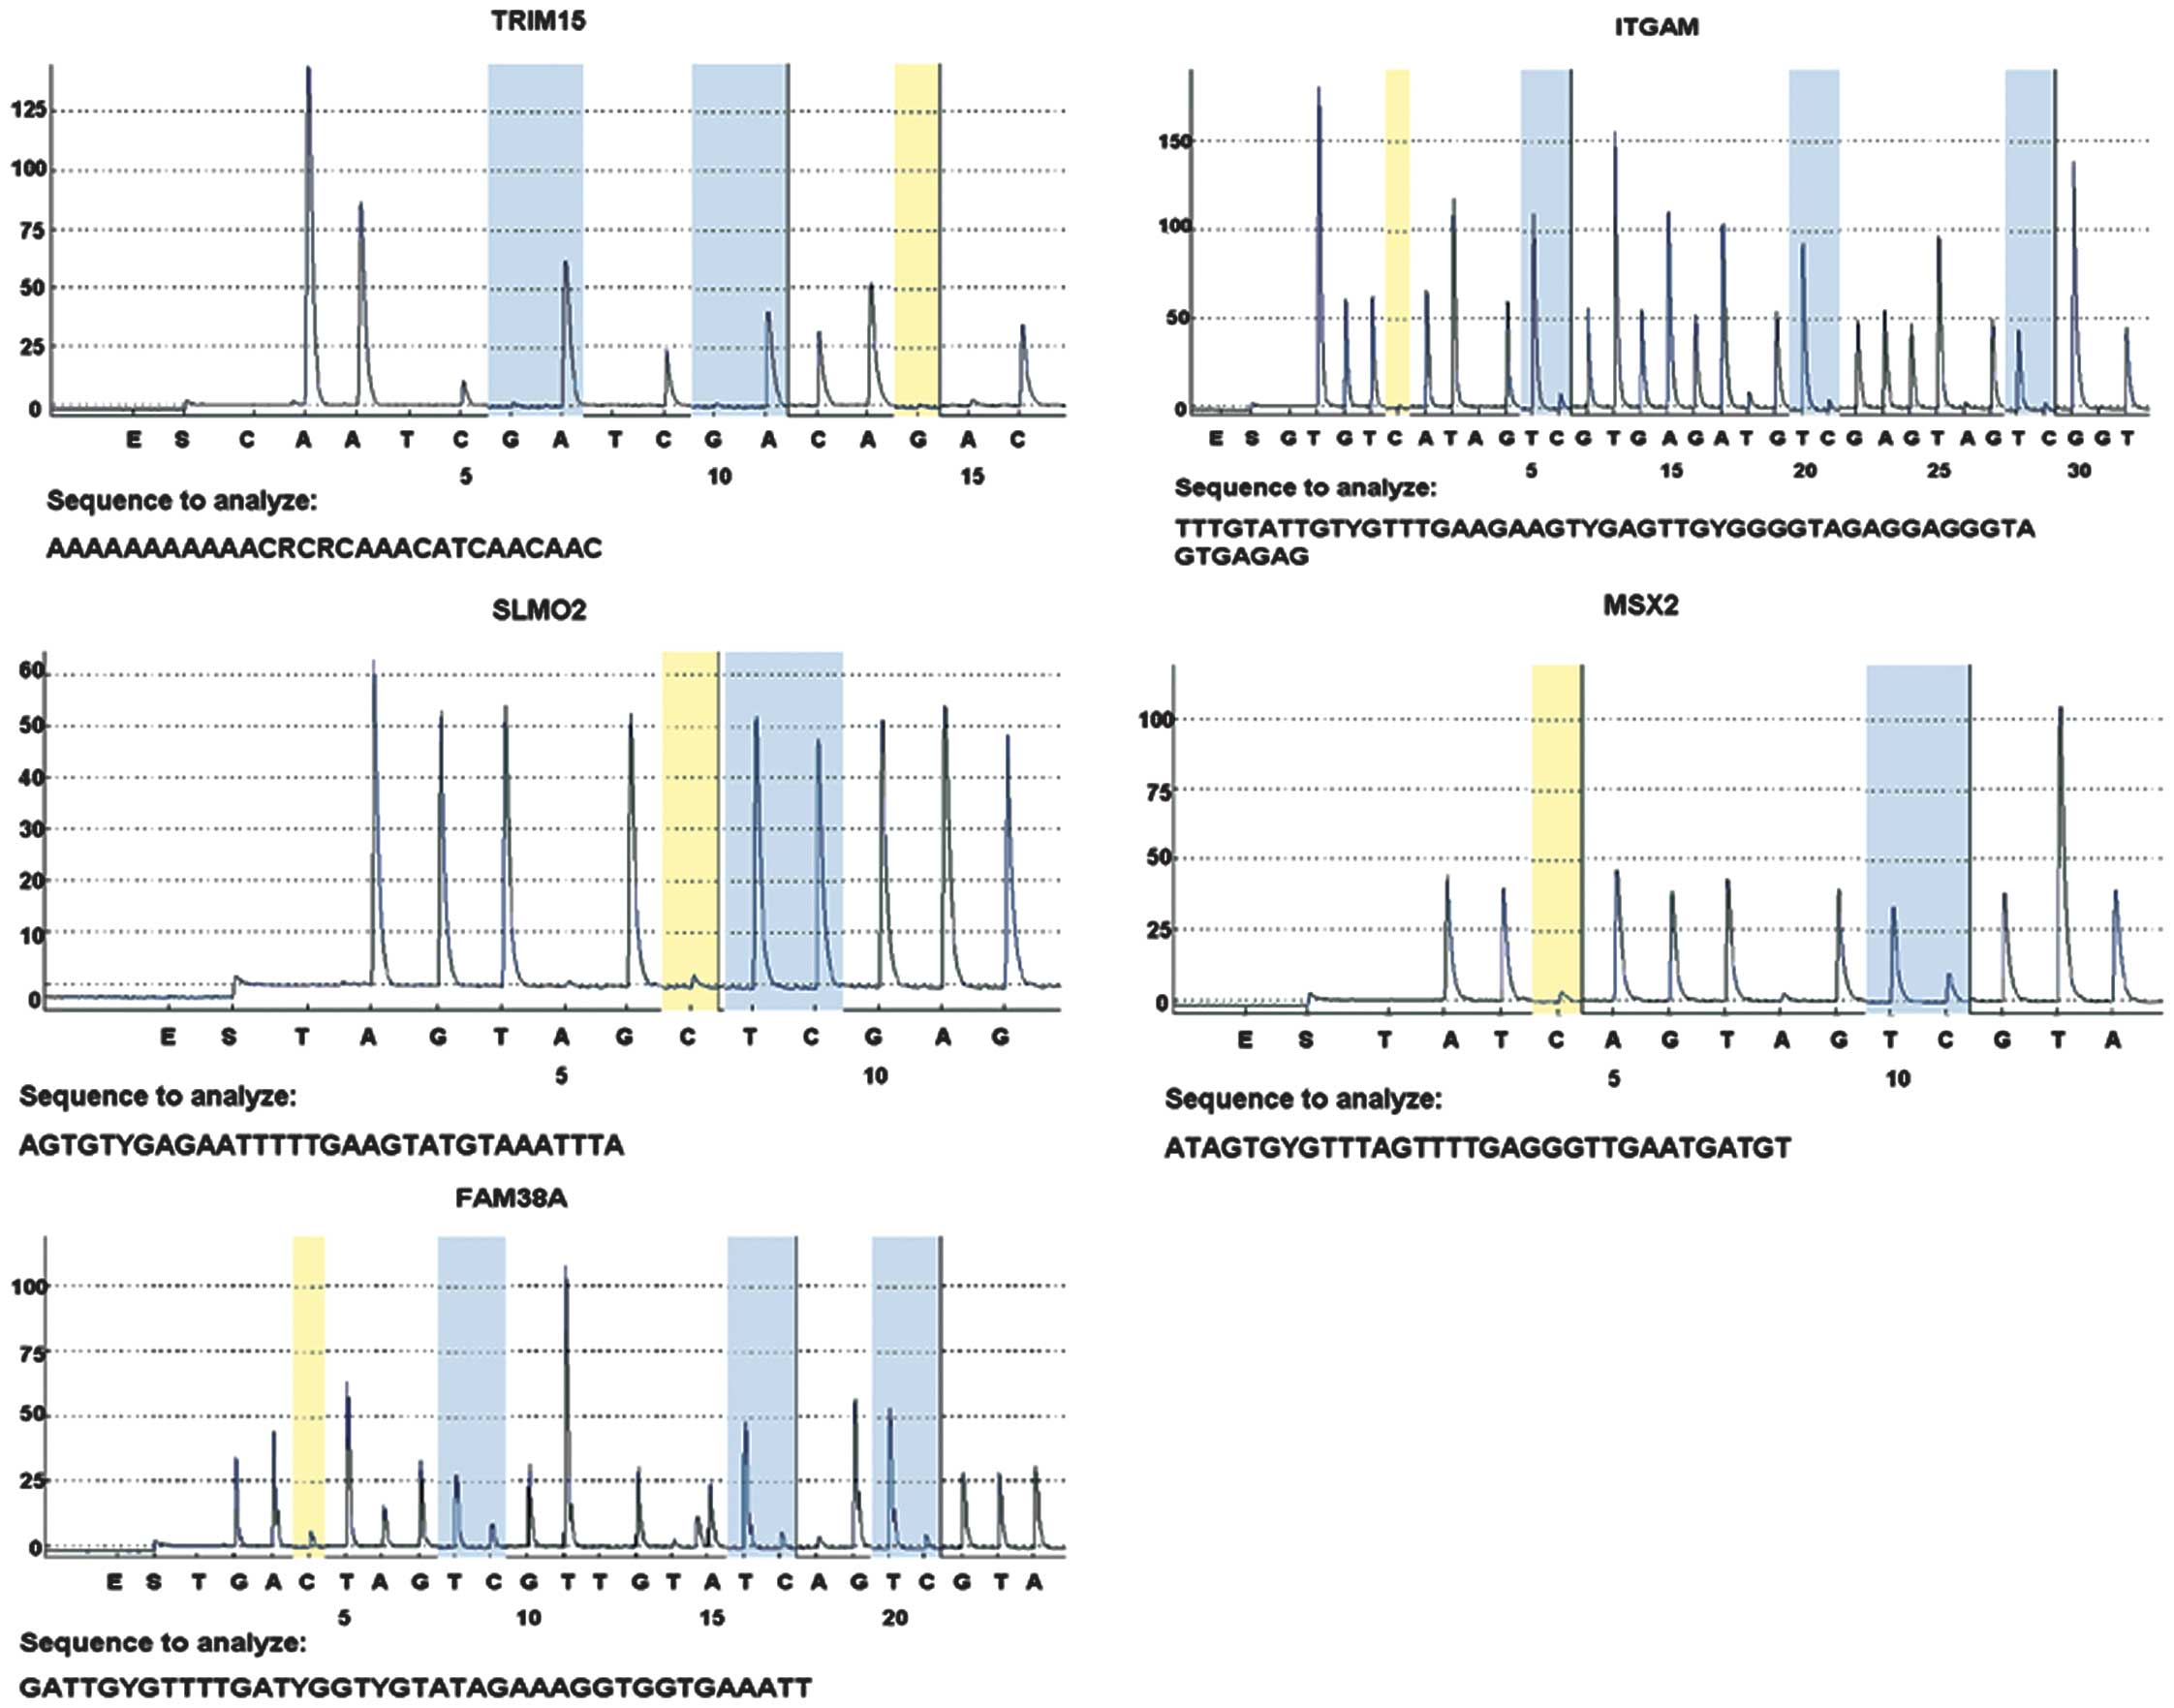
Bisulfite pyrosequencing
A total of six CpGs sites were selected for
technical validation of Infinium 450K methylation by the bisulfate
pyrosequencing technique on 40 paired samples (cancer and normal
tissues). One candidate site in each of the five genes (TRIM15,
ITGAM, SLMO2, MSX2 and FAM38A) was selected and all were
located in the gene body. Primers for polymerase chain reaction
(PCR) amplification and sequencing were deduced using the PyroMark
Assay Design 2.0 software (Qiagen, Hilden, Germany) and all primer
sequences are shown in Table I.
Bisulfite conversion of genomic DNA was performed, followed by PCR.
PCRs were performed under the following conditions: 95°C for 15
min; 45 cycles of 94°C for 30 sec, 56°C for 30 sec, 72°C for 30
sec; and 72°C for 10 min. The success of amplification was assessed
by agarose gel electrophoresis and pyrosequencing of the PCR
products was performed using the PyromarkID system (Qiagen). Only
blue values (perfect calls) were considered for subsequent
analyses.
 | Table IPrimers for bisulfite
pyrosequencing. |
Table I
Primers for bisulfite
pyrosequencing.
| Gene | Sequence | Nt | Tm, °C | GC, % |
|---|
| TRIM15 | F:
GGTTTAATGGTAGGTTGTTTAAGT | 24 | 58.4 | 33.3 |
| R:
ATATACCTCACTAACTTCCTATCTT | 25 | 58.2 | 32.0 |
| S:
ATCCAAAATAATAACCCCT | 9 | 45.2 | 31.6 |
| ITGAM | F:
GTTAAGTGTGGTTTGGGTAGAGTTT | 25 | 59.1 | 40.0 |
| R:
ACTACTATCCCTCTCACTACCCTCCTCTA | 29 | 60.3 | 48.3 |
| S:
GGGGATTTTTTTTATTTATTATGTT | 25 | 45.0 | 20.0 |
| SLMO2 | F:
GGGGATGAGTTAGGAAGAAGAGT | 23 | 62.6 | 47.8 |
| R:
AATCCCATTCATCACTAATCCATTTCAACT | 30 | 58.9 | 33.3 |
| S:
AGATAGTTTTAGGGAGATTG | 20 | 46.3 | 35.0 |
| MSX2 | F:
GTTTTTAATAGGGTGGAGAGAGATTG | 26 | 60.3 | 38.5 |
| R:
TACCCCCTAATTTCCCACC | 19 | 58.4 | 52.6 |
| S:
ATGGTTTTGTTTTGTTAATAAAAT | 24 | 44.2 | 16.7 |
| FAM38A | F:
TGGGGTTTTTTGATTGTAAAAGT | 23 | 58.3 | 30.4 |
| R:
CTAAAAAATCTTCCCCAAATTTCACC | 26 | 60.6 | 34.6 |
| S:
GTTTGTTTGAGGTTTTTAGATA | 22 | 44.1 | 27.3 |
RNA extraction and quantitative PCR
(qPCR)
Total cellular RNA was extracted using the TRIzol
method. RNA quality was assessed by spectrophotometry and agarose
gel electrophoresis. A total of 5 μg of RNA was reverse transcribed
using the All-in-One™ First Strand cDNA synthesis kit (AORT-100;
GeneCopoeia™, Rockville, MD, USA). Quantitative qPCR amplification
reactions were performed using the All-in-One qPCR master mix
(AOPR-1200; GeneCopoeia) with a Real-Time PCR system (ABI StepOne
plus; Applied Biosystems, Carlsbad, CA, USA). The expression levels
of the genes were normalized to the expression of actin. Primer
sequences and PCR conditions are shown in Table II.
| Table IIPrimers for quantitative polymerase
chain reaction. |
Table II
Primers for quantitative polymerase
chain reaction.
| Gene | Forward primer | Reverse primer | Product, bp | Tm, °C |
|---|
| Actin |
GTCCACCGCAAATGCTTCTA |
TGCTGTCACCTTCACCGTTC | 190 | 59 |
| TRIM15 |
AGCAAGAAGCATCAGGTGGA |
GACAAGGTCAGGAGAAATGGC | 294 | 59 |
| ITGAM |
CCTTGTGGTTCCTCAGTGGT |
CTTGGAAGGTCATTGCGTTT | 154 | 59 |
| MSX2 |
AAGATGGAGCGGCGTGGAT |
CGAGGAGCTGGGATGTGGT | 138 | 59 |
| FAM38A |
ATCCACTCCGGGGACTACTT |
GGTAGCTGTCCTGCCTGTTC | 197 | 59 |
Bioinformatics analysis
Integrated gene ontology and pathway analysis
database MAS3.0 (http://www.capitalbio.com) were to investigate
potential molecular function and the pathway of the candidate
biomarkers.
Statistical analysis
All statistical analyses were performed using SPSS
13.0 for Windows (SPSS, Inc., Chicago, IL, USA). Group comparisons
were performed using a paired samples t-test. Two-sided P<0.05
was considered to indicate a statistically significant
difference.
Results
Patients
The present study was conducted on 40 patients (23
male and 17 female) with gastric cancer, with a mean age of 56
years. The methylation microarray procedure was performed on
specimens from six patients. The tumors were all
adenocarcinomas.
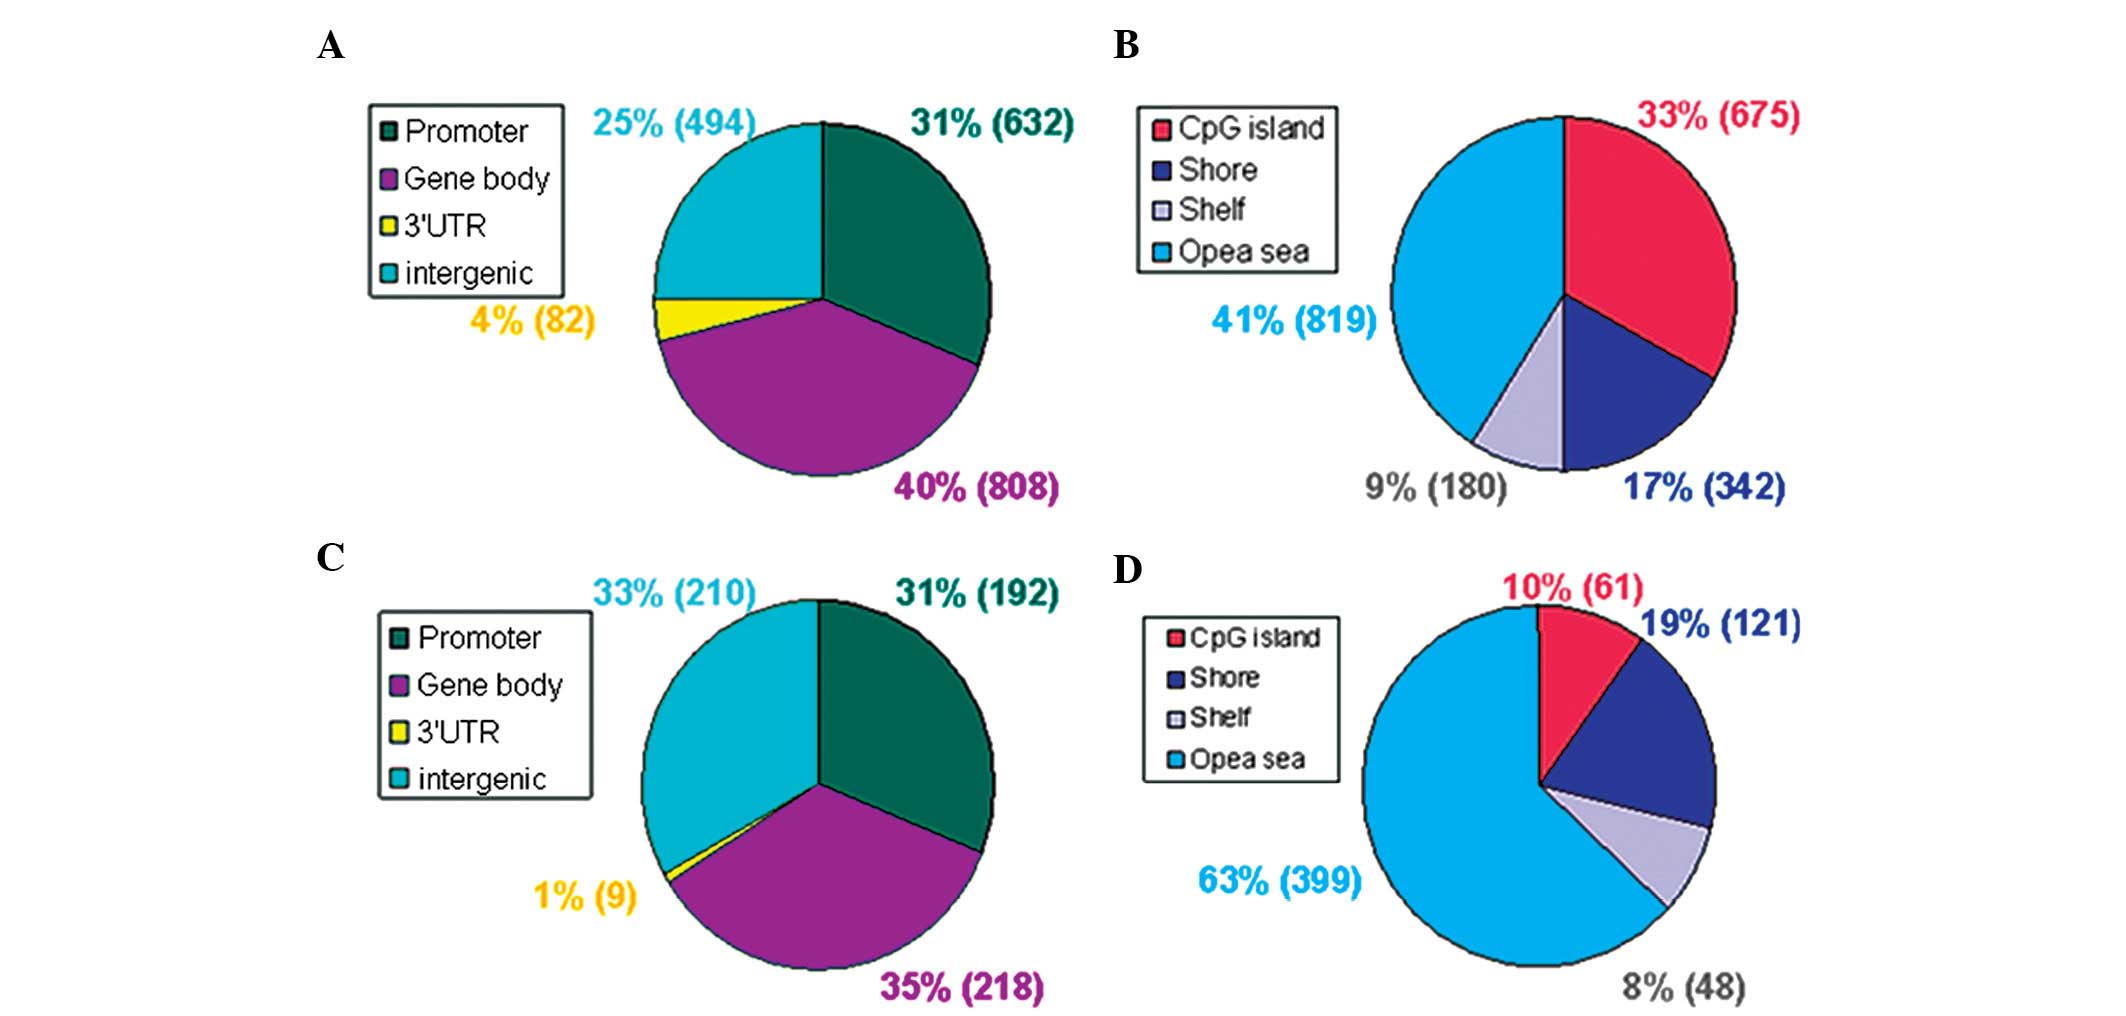
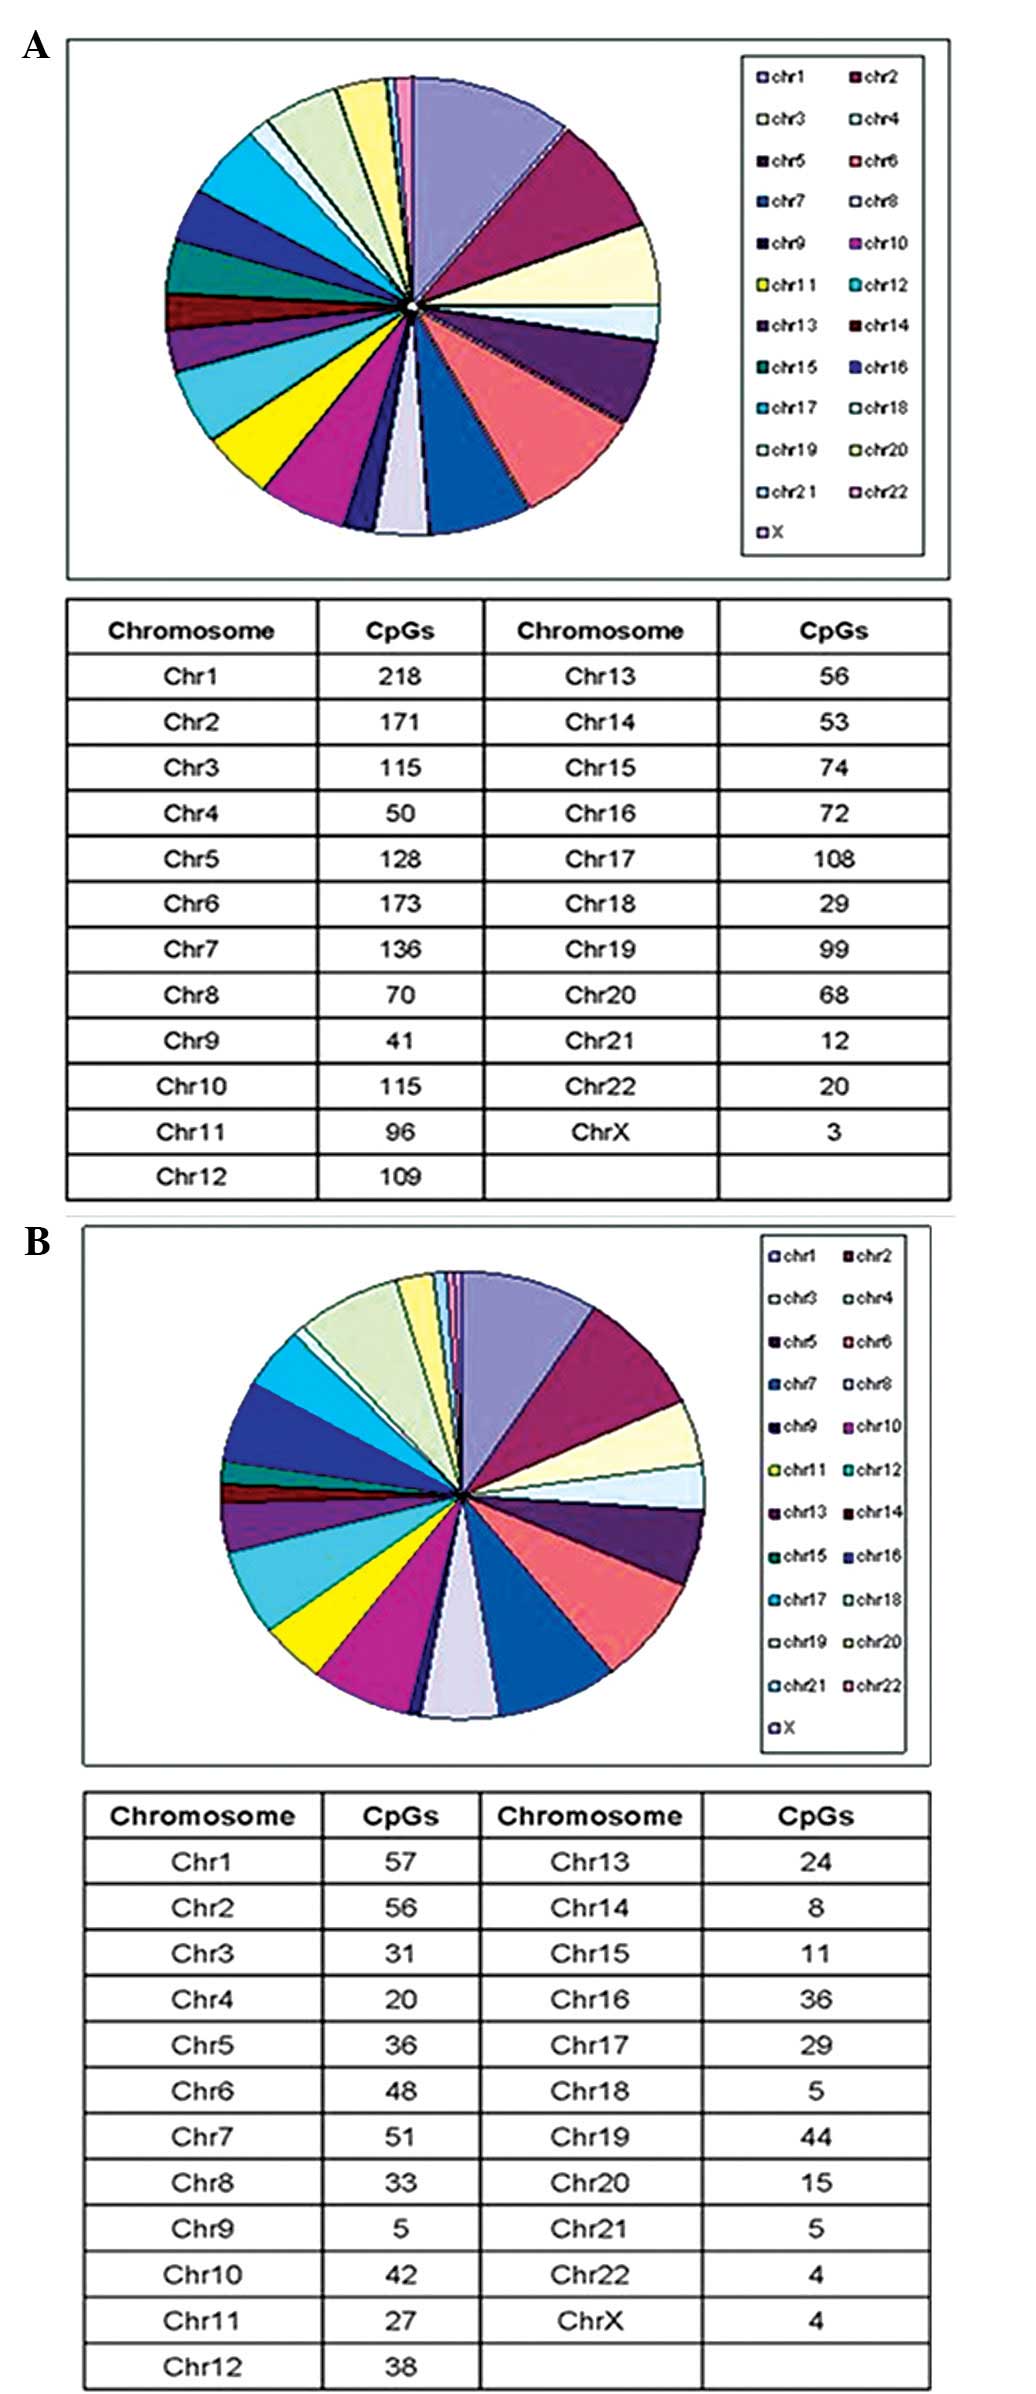
Pyrosequencing
Pyrosequencing was performed on specimens from 40
patients. In total, 2,645 methylation differential sites (covering
1,352 genes) were detected in the gastric cancer tissues compared
with the normal tissues. In the gastric cancer tissue, 2,016 sites
(covering 1,008 genes) were hypermethylated and 629 sites (covering
344 genes) were hypomethylated (Table
III). From the functional genome distribution standpoint, 824
sites (31%) were located in promoters and 1,026 sites (39%) are
located in the gene body. In addition, 91 sites (3%) and 704 sites
(27%) corresponded to the 3′-untranslated regions and intergenic
sequences, respectively. From the CpG content and neighborhood
context, 736 CpG sites (28%) were in CpG islands, 463 (17%) were in
CpG shores, 228 (9%) were in CpG shelves and 1,218 (46%) were in
the ‘open sea’ (isolated CpGs in the genome). The methylation
differential sites were distributed among all 22 autosomal
chromosomes and one sex chromosome. The majority of positions were
harbored in chromosome one (9.1%), followed by chromosomes two
(8.9%) and six (7.7%). The distribution of these sites is shown in
Figs. 1 and 2.
| Table IIIHypermethylated and hypomethylated
sites (partly). |
Table III
Hypermethylated and hypomethylated
sites (partly).
| A,
Hypermethylated |
|---|
|
|---|
| Target ID | UCSC name | UCSC refGene
group | Chromosome |
|---|
| cg08977390 | TRIM15 | Body | 6 |
| cg21678445 | ZNF521 | Body | 18 |
| cg02256631 | ITGAM | Body | 16 |
| cg01192077 | EBF1 | Body | 5 |
| cg18369516 | ZBTB46 | Body | 20 |
| cg06445348 | ILDR2 | Body | 1 |
| cg18125573 | RARA | Body | 17 |
| cg04407470 | NR2E1 | Body | 6 |
| cg22388634 | VSX1 | Body | 20 |
| cg14063008 | DAB2IP | Body | 9 |
| cg24171907 | CNRIP1 | 5′UTR | 2 |
| cg16306190 | LRRC34 | 1st exon | 3 |
| cg11595545 | KCNA3 | 1st exon | 1 |
| cg08048222 | ZNF671 | TSS200 | 19 |
| cg09734791 | MSC | 1st exon | 8 |
| cg25024074 | ITGA4 | 1st exon | 2 |
| cg16964348 | NPY | TSS200 | 7 |
| cg17508991 | HCK | TSS1500 | 20 |
| cg18372896 | JDP2 | 5′UTR | 14 |
| cg17219660 | GPR37L1 | TSS200 | 1 |
|
| B,
Hypomethylated |
|
| Target ID | UCSC name | UCSC refGene
group | Chromosome |
|
| cg20726575 | SLMO2 | Body | 20 |
| cg06013117 | MSX2 | Body | 5 |
| cg06007201 | FAM38A | Body | 16 |
| cg21499869 | ELL | Body | 19 |
| cg16499677 | C14ORF37 | Body | 14 |
| cg23263641 | CADM4 | Body | 19 |
| cg18847089 | PRKAR1B | Body | 7 |
| cg27341866 | C19orf35 | Body | 19 |
| cg13826564 | LTBP3 | Body | 11 |
| cg04529865 | GALNT9 | Body | 12 |
| cg01515802 | LATR1 | TSS200 | 19 |
| cg22888958 | CREB5 | 5′UTR | 7 |
| cg23264429 | STAMBPL1 | 5′UTR | 10 |
| cg19060371 | LCP1 | 5′UTR | 13 |
| cg01318557 | LAT2 | 5′UTR | 7 |
| cg22274117 | ATXN1 | 5′UTR | 6 |
| cg06442489 | ZSCAN18 | TSS1500 | 19 |
| cg02829601 | SYTL3 | TSS200 | 6 |
| cg06523556 | CHRNA6 | TSS200 | 8 |
| cg20117742 | LAIR1 | TSS200 | 19 |
Gene regulation
A total of 979 genes were upregulated and 314 genes
were downregulated in gastric cancer samples compared with the
normal samples. Signaling pathway analyses showed that the majority
of the genes that were upregulated and downregulated in gastric
cancer were involved in the same pathways, including apoptosis,
cell cycle, ErbB, Janus kinase-signal transducer and activator of
transcription, mitogen-activated protein kinases, p53, transforming
growth factor-β, Toll-like receptor, vascular endothelial growth
factor and Wnt signaling pathways. We proposed that these pathway
alterations may be associated with the clinical pathological
features and outcome of GC patients. An integrated gene ontology
database was used to annotate the molecular function of the
differentially expressed genes. The results showed that genes that
were upregulated and downregulated in gastric cancer were involved
in the majority of the important biological process associated with
human cancer, including regulation of the inhibitor-κB
kinase/nuclear factor-κB cascade, cell differentiation, cell cycle
arrest, caspase activation and cell proliferation (Table IV).
| Table IVSignaling pathway analyses. |
Table IV
Signaling pathway analyses.
| Pathway | Upregulated | P-value | Downregulated | P-value |
|---|
| Apoptosis | BCL2, CAPN2,
ENDOD1, NFKBIA, NTRK1 and PRKACB | 9.77E-04 | CASP8, IL1A, IL1B,
PRKACA and TNFRSF10A | 4.44E-05 |
| Cell cycle | ANAPC5, CDH1 and
MYT1 | 0.193209 | CDC2, CDK1 and
LAT | 0.094077 |
| ErbB | CAMK2B, GAB1, GRB2
and NRG2 | 0.02511 | PRKACA and
STAT5A | 0.054748 |
| Jak-STAT | CNTFR, CSF3R, GHR,
GRB2, IFNK, IL22RA1, IL2RA, IL7 and PIAS4 | 1.77E-04 | IL12B, IL21R,
SOCS2, SOCS5 and STAT5A | 5.93E-04 |
| MAPK | CACNA2D2, CACNA2D3,
DUSP16, FGF12, GNG12, GRB2, MAPKAPK2, MRAS, NTRK1, PDGFA, PRKACB
and RASGRF1 | 2.37E-04 | CACNA1C, CACNA1H,
CACNA1I, DUSP14, HSPA1A, HSPA1A, IL1A, IL1B, IL1R2, MEF2C, NF1,
PRKACA, PRKACA, RPS6KA2 and SCT | 1.52E-12 |
| p53 | SESN1, SESN3 and
TSC2 | 0.057786 | CASP8, CDC2, CDK1
and RRM2 | 0.00338 |
| TGF-β | BMP2, CHRD, GDF6,
SMAD6, SMAD7, SMAD9 and SMURF2 | 1.25E-04 | BMPR1B and
INHBA | 0.054748 |
| Toll-like
receptor | NFKBIA, TOLLIP and
TRAF3 | 0.140739 | CASP8, IL12B, IL1B
and TLR6 | 0.001034 |
| VEGF | MAPKAPK2 and
NFATC1 | 0.251502 | NFATC1 and
PRKACA | 0.043002 |
| Wnt | CAMK2B, CTBP2,
LRP5, NFATC1, POR, PPP2R5C, PRICKLE1, PRKACE, SFRP1, SOX17, TCF4,
WNT11 and WNT6 | 8.63E-08 | APC, NFATC1, PRKACA
and PRKACA | 0.004401 |
Methylation levels
In total, five differential sites (TRIM15, ITGAM,
SLMO2, MSX2 and FAM38A) were selected and verified in 40
samples by pyrosequencing. The mean methylation levels of gastric
cancer tissues were higher than those of normal gastric tissues for
two sites (TRIM15 and ITGAM) and lower for two sites
(MSX2 and FAM38A), which were consistent with the
results of the microarray analysis. The mean methylation level of
SLMO2 was not different between normal and cancer tissues
(Table V, Fig. 3).
| Table VLevel of methylation of five
sites. |
Table V
Level of methylation of five
sites.
| Level of
methylation, % | |
|---|
|
| |
|---|
| Gene | GC tissues | Normal tissues | P-value |
|---|
| TRIM15 | 10.71±3.08 | 5.86±1.65 | <0.0001 |
| ITGAM | 44.23±17.68 | 26.34±9.41 | <0.0001 |
| SLMO2 | 74.72±17.01 | 71.73±10.77 | 0.561 |
| MSX2 | 21.34±7.49 | 38.20±6.49 | <0.0001 |
| FAM38A | 18.21±5.43 | 32.92±6.71 | <0.0001 |
Transcriptional levels
To examine the transcriptional level of the four
genes (TRIM15, IGTAM, MSX2 and FAM38A), qPCR was
performed using primers specific for these genes. qPCR results
showed that the expression levels of ITGAM, MSX2 and FAM38A were
upregulated in gastric cancer tissues, while the expression level
of TRIM15 was downregulated (P<0.05).
Discussion
DNA methylation is important in the development of
gastric cancer. Previously, it has been found that hypermethylation
inactivates a number of gene promoters. However, previous studies
have been limited by technology that only allows analysis of a few
genes. In addition, the majority of studies have paid close
attention to the CpG island in the promoter region. According to
current knowledge, only a few CpG dinucleotides have been
identified at the promoter CpG islands, mostly scattered in the
genome. In tumorigenesis, the importance of scattered CpG
dinucleotide methylation remains poorly understood (6,7).
Therefore, understanding genome-wide DNA methylation changes is
necessary for the in-depth investigation of tumor occurrence.
The latest generation of methylation microarrays
includes the Infinium 450K methylation microarray. This microarray
detects >450,000 methylation sites per sample. It includes
methylation regions, such as CpG islands, CpG shores, CpG sites
outside of CpG islands, non-CpG methylated sites identified in
human stem cells, differentially methylated sites identified in
tumor versus normal tissues (multiple forms of cancer), across
several tissue types, CpG islands outside of coding regions, miRNA
promoter regions and disease-associated regions identified through
genome-wide association study (8).
To date, the Infinium 450K methylation microarray is the most
attractive, powerful and cost-effective tool available for
generating quantitative DNA methylomes in healthy and diseased
individuals (9,10). Using the Infinium 450K methylation
microarray, the present study compared the genomic DNA methylation
of gastric cancer with that of normal gastric tissue, screened
2,645 differential sites, showed the detailed distribution of these
differential sites and established a gastric cancer DNA methylation
profile. Verification of the microarray results by pyrosequencing
showed that these results were reliable.
A considerable number of differentially methylated
sites are located in the promoter region. However, the majority of
them appear within the gene body. A number of previous studies have
shown abnormal methylation of the CpG island in the promoter region
and increasing attention has been paid to methylation of the gene
body (11,12). Unlike the correlation between
promoter DNA methylation and gene transcription inhibition, the
correlation between gene body methylation and gene expression is
more complicated. A meta-analysis of this correlation by Jjingo
et al (13) suggested that
the gene body DNA methylation is highest when gene expression is
moderate. Additionally, when gene expression is high or low, the
degree of gene body DNA methylation is extremely low. In the
current study of the correlation between methylation changes in
four selected differentially methylated sites in the genome and
gene expression, the effects of DNA methylation on gene expression
varied between genes.
The current study found that the methylation changes
in certain genes occurred in multiple sites, some in the promoter
and some in the gene itself; certain sites became hypermethylated
and others hypomethylated, which suggested that gene expression is
regulated by complicated patterns of multi-site methylation.
Bioinformatics analysis suggested no difference between genes with
hypermethylated sites and genes with hypomethylated sites in
associated signaling pathways, which included signaling pathways
involved in apoptosis, cell proliferation and cell cycle
control.
The present relatively large-scale investigation of
methylation changes of gastric cancer, covering a relatively large
genomic area, found a number of new differentially methylated
sites, including hypermethylation and hypomethylation sites.
Analysis of the results identified TRIM15, ITGAM, MSX2 and
FAM38A as possible candidate sites clinically useful for the
diagnosis and treatment of gastric cancer. In addition, a number of
differentially methylated sites were identified in the microRNA
gene. Further studies must be performed to explain this
phenomenon.
References
|
1
|
Leung WK, Wu MS, Kakugawa Y, et al; Asia
Pacific Working Group on Gastric Cancer. Screening for gastric
cancer in Asia: current evidence and practice. Lancet Oncol.
9:279–287. 2008. View Article : Google Scholar : PubMed/NCBI
|
|
2
|
Brenner H, Rothenbacher D and Arndt V:
Epidemiology of stomach cancer. Methods Mol Biol. 472:467–477.
2009. View Article : Google Scholar
|
|
3
|
Sapari NS, Loh M, Vaithilingam A and Soong
R: Clinical potential of DNA methylation in gastric cancer: a
meta-analysis. PLoS One. 7:e362752012. View Article : Google Scholar : PubMed/NCBI
|
|
4
|
Laird PW: Principles and challenges of
genomewide DNA methylation analysis. Nat Rev Genet. 11:191–203.
2010. View
Article : Google Scholar : PubMed/NCBI
|
|
5
|
Ku CS, Naidoo N, Wu M and Soong R:
Studying the epigenome using next generation sequencing. J Med
Genet. 48:721–730. 2011. View Article : Google Scholar : PubMed/NCBI
|
|
6
|
Shenker N and Flanagan JM: Intragenic DNA
methylation: implication of this epigenetic mechanism for cancer
research. Br J Cancer. 106:248–253. 2012. View Article : Google Scholar
|
|
7
|
Lister R, Pelizzola M, Dowen RH, et al:
Human DNA methylomes at base resolution show widespread epigenomic
differences. Nature. 462:315–322. 2009. View Article : Google Scholar : PubMed/NCBI
|
|
8
|
Sandoval J, Heyn HA, Moran S, et al:
Validation of a DNA methylation microarray for 450,000 CpG sites in
the human genome. Epigenomics. 6:692–702. 2011.PubMed/NCBI
|
|
9
|
Dedeurwaerder S, Defrance M, Calonne E, et
al: Evaluation of the Infinium Methylation 450K technology.
Epigenetics. 3:771–784. 2011.PubMed/NCBI
|
|
10
|
Rakyan VK, Down TA, Balding DJ and Beck S:
Epigenome-wide association studies for common human diseases. Nat
Rev Genet. 12:529–541. 2011. View
Article : Google Scholar : PubMed/NCBI
|
|
11
|
Maunakea AK, Nagarajan RP, Bilenky M, et
al: Conserved role of intragenic DNA methylation in regulating
alternative promoters. Nature. 466:253–257. 2010. View Article : Google Scholar
|
|
12
|
Ball MP, Li JB, Gao Y, et al: Targeted and
genome-scale strategies reveal gene-body methylation signatures in
human cells. Nat Biotechnol. 27:361–368. 2009. View Article : Google Scholar : PubMed/NCBI
|
|
13
|
Jjingo D, Conley AB, Yi S, et al: On the
presence and role of human gene-body DNA methylation. Oncotarget.
3:462–474. 2012.PubMed/NCBI
|