Introduction
Bladder cancer is the most common urinary tract
malignant tumor and accounts for 5% of all diagnosed cancers
(1). Although the majority of cases
are not clinically advanced at presentation, the disease eventually
recurs or develops metastases. Urothelial carcinoma of the bladder,
the most common histopathological type of bladder cancer, has a
variety of genetic and phenotypic characteristics. Numerous
factors, including chromosomal anomalies, genetic polymorphisms,
and genetic and epigenetic alterations, contribute to tumorigenesis
and progression of urothelial carcinoma of the bladder (2). Therefore, revealing the molecular
mechanism for bladder cancer development is required for developing
effective therapy.
With the development of high-throughput DNA
sequencing and array-based technologies, various classes of
noncoding RNAs (ncRNAs) have recently been shown to function as
regulators of protein-coding genes (3). Emerging data strongly suggest that
long noncoding RNAs (lncRNAs; length >200 bp) are important in
the basal regulation of protein coding genes, at the
transcriptional and the posttranscriptional levels (3). Dysregulation of lncRNAs, such as
HOTAIR, H19, MALAT-1 and PCA3, has been regarded as a primary
feature of several human cancers, including prostate cancer, breast
cancer, gastric cancer and hepatocellular carcinoma (4–7).
Certain recent studies have reported that several lncRNAs,
including UCA1, MALAT-1 and ncRAN, show marked potential in the
field of bladder cancer progression (8–10).
However, the genome-wide expression and functional significance of
lncRNAs in bladder cancer remains unclear.
In this study, we present the lncRNA expression
profiles in four pairs of bladder cancer samples and matched
histologically normal urothelium samples by lncRNA microarray. We
observed that a collection of lncRNAs were aberrantly expressed in
bladder cancer compared with matched normal tissue, several of
which were evaluated by quantitative PCR (qPCR) in a total of 51
pairs of tissues.
Materials and methods
Patient samples
Fifty-six patients with urothelial carcinoma of the
bladder who received radical cystectomy at the Fudan University
Shanghai Cancer Center (Shanghai, China) were included in the
study. Urothelial carcinoma of the bladder was diagnosed
histopathologically. Written informed consent was obtained from all
patients and the study was approved by the Institutional Review
Board of Fudan University Shanghai Cancer Center (Shanghai, China).
Of the 56 pairs of samples, five pairs were used in lncRNA
microarray analysis [one pair was excluded from analysis according
to three dimension principal component analysis (3D-PCA)] and 51
pairs were analyzed by qPCR. The tumor sample and matched normal
bladder tissue from each subject were snap-frozen in RNA ladder
immediately after resection and stored in the tissue bank.
RNA extraction
If the proportion of cancer cells in a tissue
section was >80% then the frozen block was subjected to RNA
extraction. Total RNA was extracted from 56 pairs of snap-frozen
urothelial carcinoma and matched normal bladder tissues using
TRIzol reagent (Invitrogen Life Technologies, Carlsbad, CA, USA)
according to the manufacturer’s instructions. The RNA integrity was
evaluated by a NanoDrop ND-1000 spectrophotometer (NanoDrop
products, Wilmington, DE, USA).
Microarray and computational
analysis
RNA purified from total RNA following the removal of
rRNA was amplified and transcribed into fluorescent cRNA along the
entire length of the transcripts without 3′ bias utilizing a random
priming method and cDNA was labeled and hybridized to the Human
LncRNA Array V2.0 (8×60 K, Arraystar Inc., Rockville, MD, USA). A
total of 33,045 lncRNAs and 30,215 coding transcripts, which were
collected from the most authoritative databases, including RefSeq,
UCSC Known Genes, Ensembl and the associated literature, were
detected by the microarray.
The microarray work was performed by KangChen
Bio-tech (Shanghai, China). In brief, the Arraystar lncRNA array
protocol was as follows: i) the RNA sample, kit and reagents were
prepared, including TRIzol reagent, Biopulverizer (Biospec,
Bartlesville, OK, USA) and Mini-Bead-Beater-16 (Biospec); ii) Total
RNA Clean-up and RNA quality control; iii) labeling reaction was
prepared; iv) labeled/amplified RNA and labeled cRNA QC were
purified; v) hybridization was performed; vi) microarray wash was
conducted; vii) scanning was performed; and viii) the data were
extracted using Agilent feature extraction software (Agilent
Technologies, Santa Clara, CA, USA).
The arrays were scanned by the Agilent Scanner
G2505B (Agilent Technologies) and the acquired array images were
analyzed by Agilent Feature Extraction software (version 10.7.3.1;
Agilent Technologies). Quantile normalization and subsequent data
processing were performed using the GeneSpring GX v11.5.1 software
package (Agilent Technologies).
Gene ontology (GO) and pathway
analysis
To discover the function and associated pathways of
differentially expressed mRNAs, GO and pathway analyses were
performed. GO annotations of microarray genes were downloaded from
NCBI (http://www.ncbi.nlm.nih.gov/),
UniProt (http://www.uniprot.org/) and the Gene
Ontology (http://www.geneontology.org/). The elim Fisher
algorithm was used to perform a GO enrichment test and GO
categories with P<0.05 were reported. Pathway annotations of
microarray genes were download from KEGG (http://www.genome.jp/kegg/) and a Fisher exact test
was performed in order to locate the significant enrichment
pathway. The resulting P values were adjusted using the Benjamini
Hochberg false discovery rate (BH FDR) algorithm. Pathway
categories with a FDR<0.05 were reported.
Construction of the lncRNA-mRNA
co-expression network
The network construction procedures included the
following: i) preprocessing of data: if one coding gene has
different transcripts the median value is taken to represent the
gene expression values, without special treatment of lncRNA
expression values; ii) data were screened and the subset of data
were removed according to the lists of the differential expression
of lncRNA and mRNA obtained from the GO and pathway analyses; iii)
the Pearson correlation coefficient was calculated and the R value
was used to calculate the correlation coefficient between lncRNA
and coding genes; and iv) Pearson’s correlation coefficient was
used for screening; RNAs with a Pearson’s correlation coefficient
of ≥0.99 were considered significant and the lncRNA-mRNA
co-expression network was constructed by Cytoscape software (The
Cytoscape Consortium, San Diego, CA, USA).
qPCR confirmation
To validate the microarray results, qPCR was
performed. Total RNA was extracted from frozen tumor specimens
using TRIzol reagent and then reverse transcribed using the Maxima
Probe qPCR Master mix (Fermentas, Waltham, MA, USA) according to
the manufacturer’s instructions. lncRNA expression levels in
bladder cancer tissues were measured by qPCR using a GeneAmp PCR
System 9700 (Applied Biosystems, Waltham, MA, USA). The primers
used in this study are shown in Table
I. Four lncRNAs that were significantly deregulated (TNXA,
CTA-134P22.2, CTC-276P9.1 and KRT19P3) were evaluated in the
patients included in this study.
 | Table IOligonucleotide primer sequences. |
Table I
Oligonucleotide primer sequences.
| Quantitative PCR
primer (5′ to 3′) | |
|---|
|
| |
|---|
| Primer set name | Forward | Reverse | Probe no.
(Roche) |
|---|
| TNXA |
acgtgttttgggacatgga |
caaaaccatgggcatagtcc | 20 |
| CTA-134P22.2 |
ggggatggaagatggtgtc |
aagggtgggctctcatctg | 49 |
| CTC-276P9.1 |
ccgaaacctgagccagag |
cctctctcctgcccacttc | 44 |
| KRT19P3 |
agctcgccacctacctcag |
ggaggtggacaggctattgt | 72 |
Total RNA (2 μg) was converted to cDNA according to
the manufacturer’s instructions. PCR was performed in a total
reaction volume of 20 μl, including 10 μl Master Premix (2X, with
ROX Reference Dye II), 1 μl of PCR Forward Primer (10 μM), 1 μl of
PCR Reverse Primer (10 μM), 0.2 μl Roche probe (100X), 2 μl of cDNA
and 5.8 μl of double-distilled water. The qPCR reaction was set at
an initial denaturation step of 10 min at 95°C; and 95°C (15 sec),
57°C (30 sec), 72°C (30 sec) for a total 40 cycles. The experiments
were performed in triplicate. The samples were normalized to
β-actin. The median in each triplicate was used to calculate
relative lncRNA concentrations (ΔCt = Ct median lncRNAs - Ct median
β-actin). Expression fold changes were calculated using the
2−ΔΔCt method.
Statistical analysis
Statistical analysis was performed using Student’s
t-test for the comparison of the two groups in microarray, and
analysis of variance for multiple comparisons. P<0.05 was
considered to indicate a statistically significant result. The
statistical significance of the microarray result was analyzed by
fold change and Student’s t-test. The FDR was calculated to correct
the P-value. The threshold value used to screen differentially
expressed mRNAs was a fold change of ≥2.0, and a fold change of
≥8.0 for differentially expressed lncRNAs.
Results
Overview of lncRNA profiles
The expression profiles of lncRNAs in paired samples
were shown by calculating the log2 fold-change
tumor/normal (T/N). The agreement was formulated as follows: Fold
change (FC) cut-off: 2.0. Positive fold change values indicated
upregulation and negative values indicated downregulation. Log fold
change means log2 of absolute fold-change
(log2FC). The fold change and P-value were calculated
from the normalized expression. One pair of samples was excluded
from analysis according to 3D-PCA. We finally identified 3,324
differentially expressed human lncRNAs in four bladder cancer
patients (≥2-fold).
A total of 110 lncRNAs were significantly
differentially expressed between the tumor and control groups
(≥8-fold). Twenty-two lncRNAs were upregulated and 88 lncRNAs were
downregulated in the tumor group compared with the controls
(Table II). Log2FC of
upregulated lncRNAs in the tumor group ranged between 3.017291 to
4.581319, and −3.00191 to −6.10723 of downregulated lncRNAs.
RP11-58A12.3 (log2FC=−6.10723) was the most
significantly downregulated lncRNA and RNU12
(log2FC=4.581319) was the most significantly upregulated
lncRNA. We observed that downregulated lncRNAs were more common
than upregulated lncRNAs.
| Table IIDeregulated lncRNAs detected using
microarray in four bladder cancer patients. |
Table II
Deregulated lncRNAs detected using
microarray in four bladder cancer patients.
| Downregulated in
cancer | Upregulated in
cancer |
|---|
|
|
|---|
| lncRNAs | Log2 fold
change (T/N) | lncRNAs | Log2 fold
change (T/N) |
|---|
| RP11-58A12.3 | −6.10723 | RNU12 | 4.58132 |
| LOC572558 | −5.95465 | KRT42P | 4.56141 |
| TNXA | −5.34750 | COTL1P1 | 4.23520 |
| LOC100302650 | −5.26266 | lincRNA-RCN2 | 4.11605 |
| ADCY5 | −5.24113 | RP11-263F15.1 | 3.72144 |
| DCLK1 | −5.07589 | LOC400879 | 3.70993 |
| RP11-14D22.5 | −4.97210 | KRT19P3 | 3.58818 |
| ADCYAP1R1 | −4.92745 | DUXAP10 | 3.54649 |
| CTA-134P22.2 | −4.76654 | uc.30 | 3.48551 |
| AB074188 | −4.49578 | keratin 19 | 3.47475 |
| AL390170 | −4.34162 | RP5-1100H13.3 | 3.22775 |
| ADAM22 | −4.20736 | GATA3 | 3.17360 |
| CR621436 | −4.06665 | lincRNA-ZNF672 | 3.16483 |
| AP1S2 | −4.06335 | KRT8P10 | 3.14700 |
| LPHN3 | −4.04289 | RP11-133K18.1 | 3.13581 |
| LOC284276 | −4.03413 | RP11-184B22.2 | 3.07165 |
| XIST | −3.96822 | KRT8P25 | 3.04478 |
| LOC400550 | −3.95690 | KRT8P18 | 3.03897 |
| CR605298 | −3.91532 | HMGA1P2 | 3.02231 |
| C10orf108 | −3.88202 | KRT16P1 | 3.01729 |
Overview of mRNA profiles
Up to 17,069 coding transcripts were detected in
four pairs of samples using 30,215 coding transcripts probes. Among
the four pairs of samples, 1,269 mRNAs were upregulated in tumor
samples compared with the matched normal tissues, while 851 mRNAs
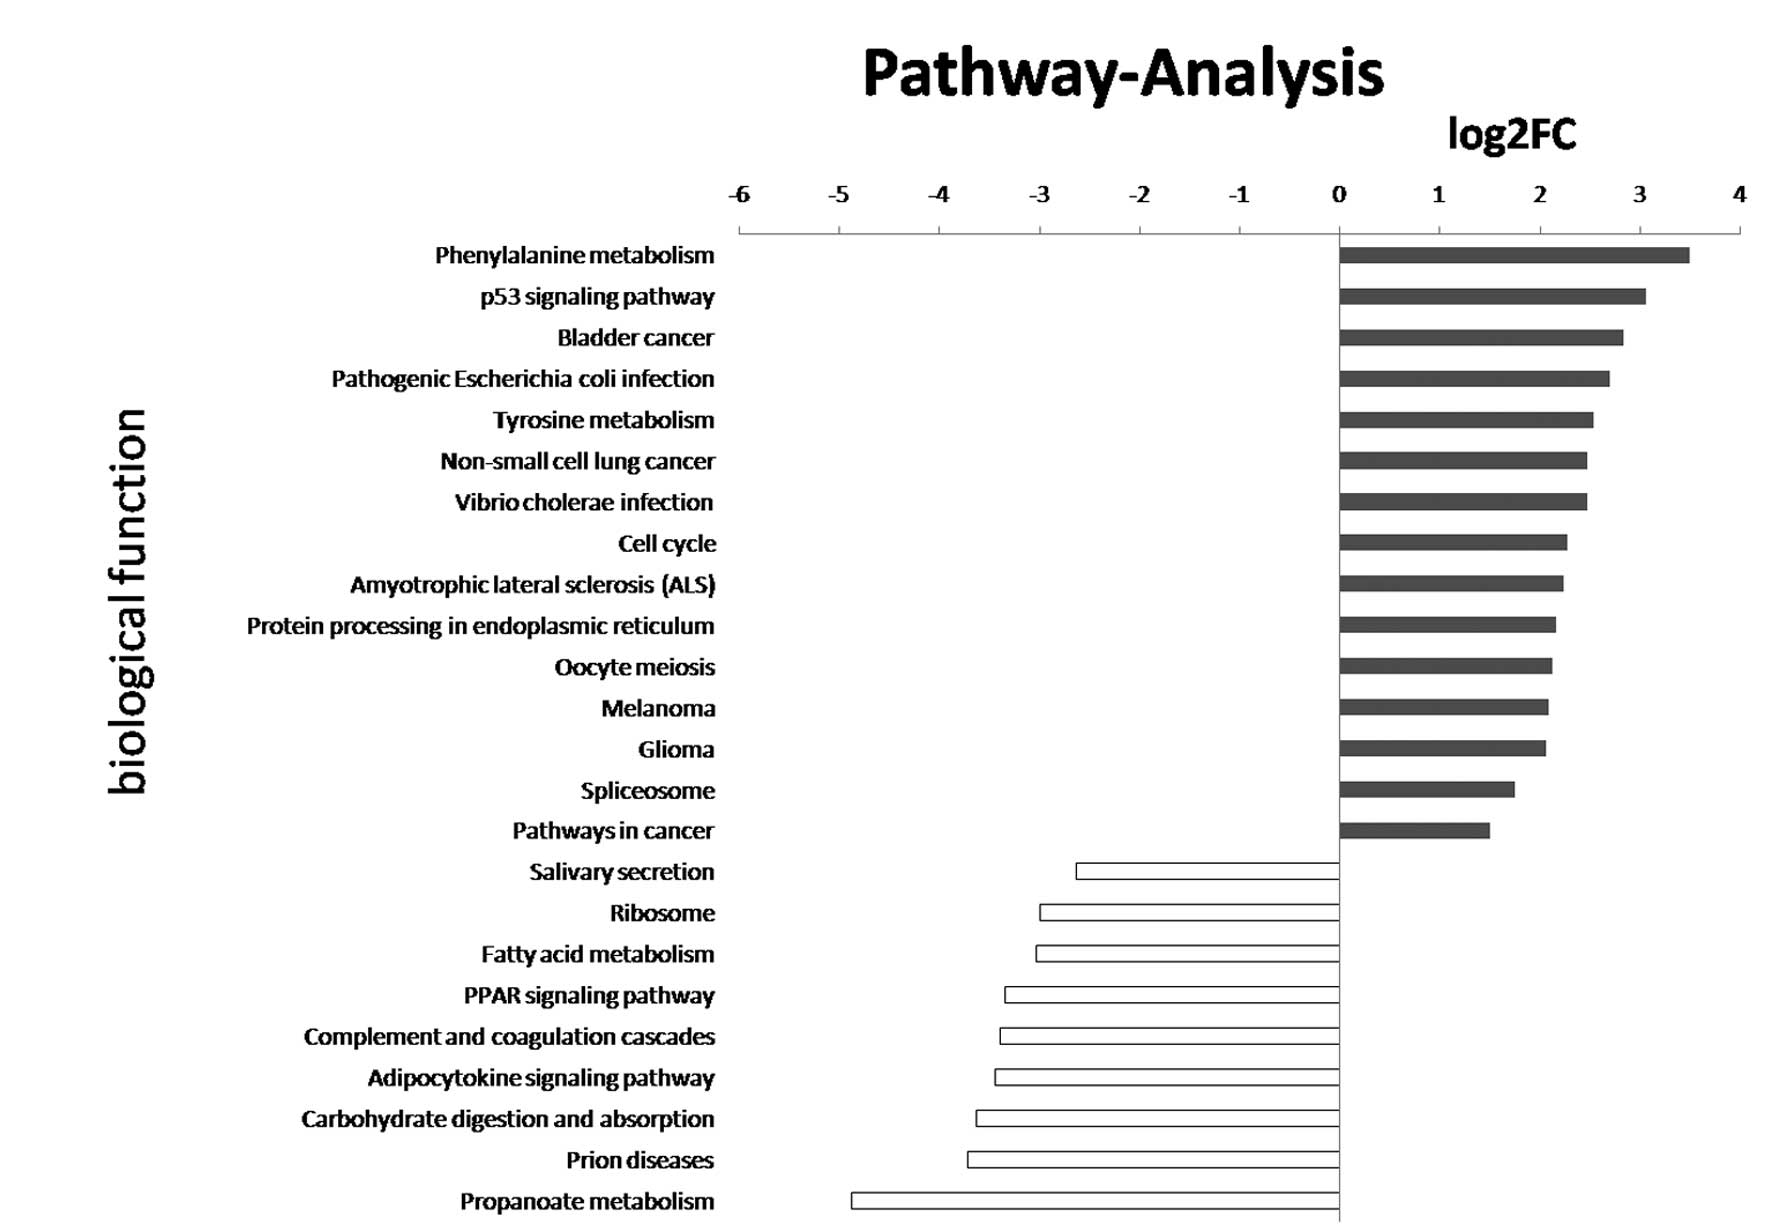
were downregulated. Kyoto Encyclopedia of Genes and Genomes (KEGG)
pathway analysis showed that the differentially expressed mRNAs may
be associated with p53, bladder cancer, cell cycle and propanoate
metabolism pathways (Fig. 1). These
results suggest that bladder cancer has a variety of genetic and
phenotypic characteristics.
Confirmation of microarray results by
qPCR
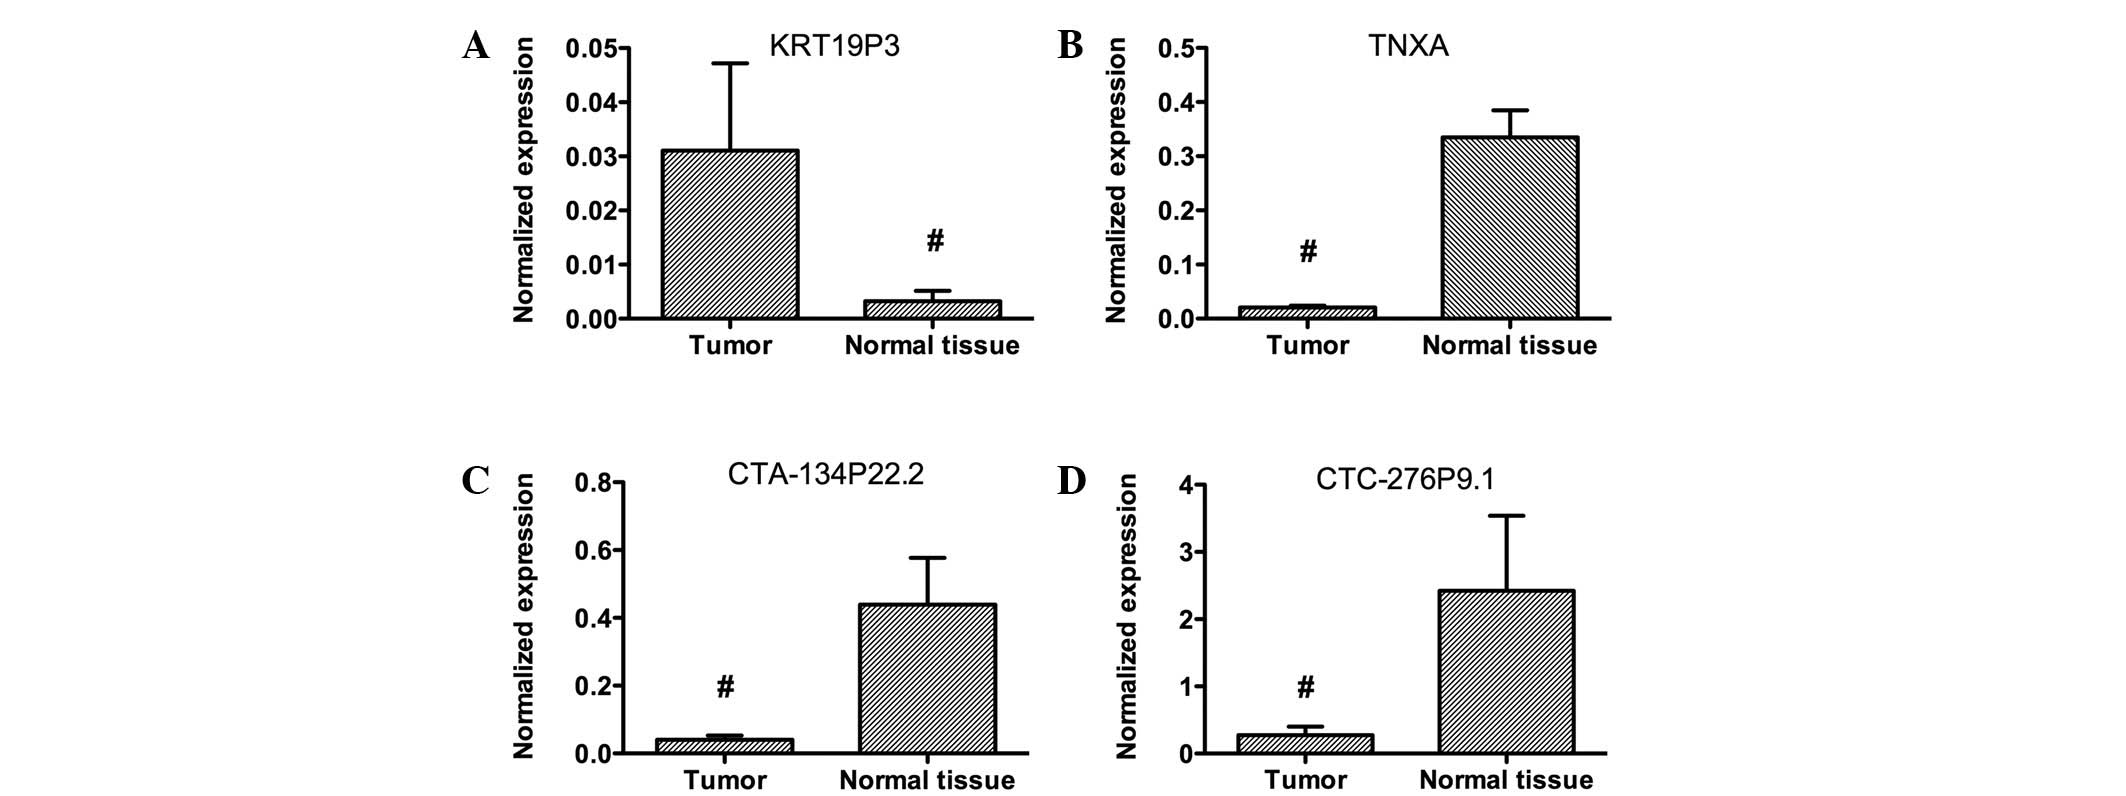
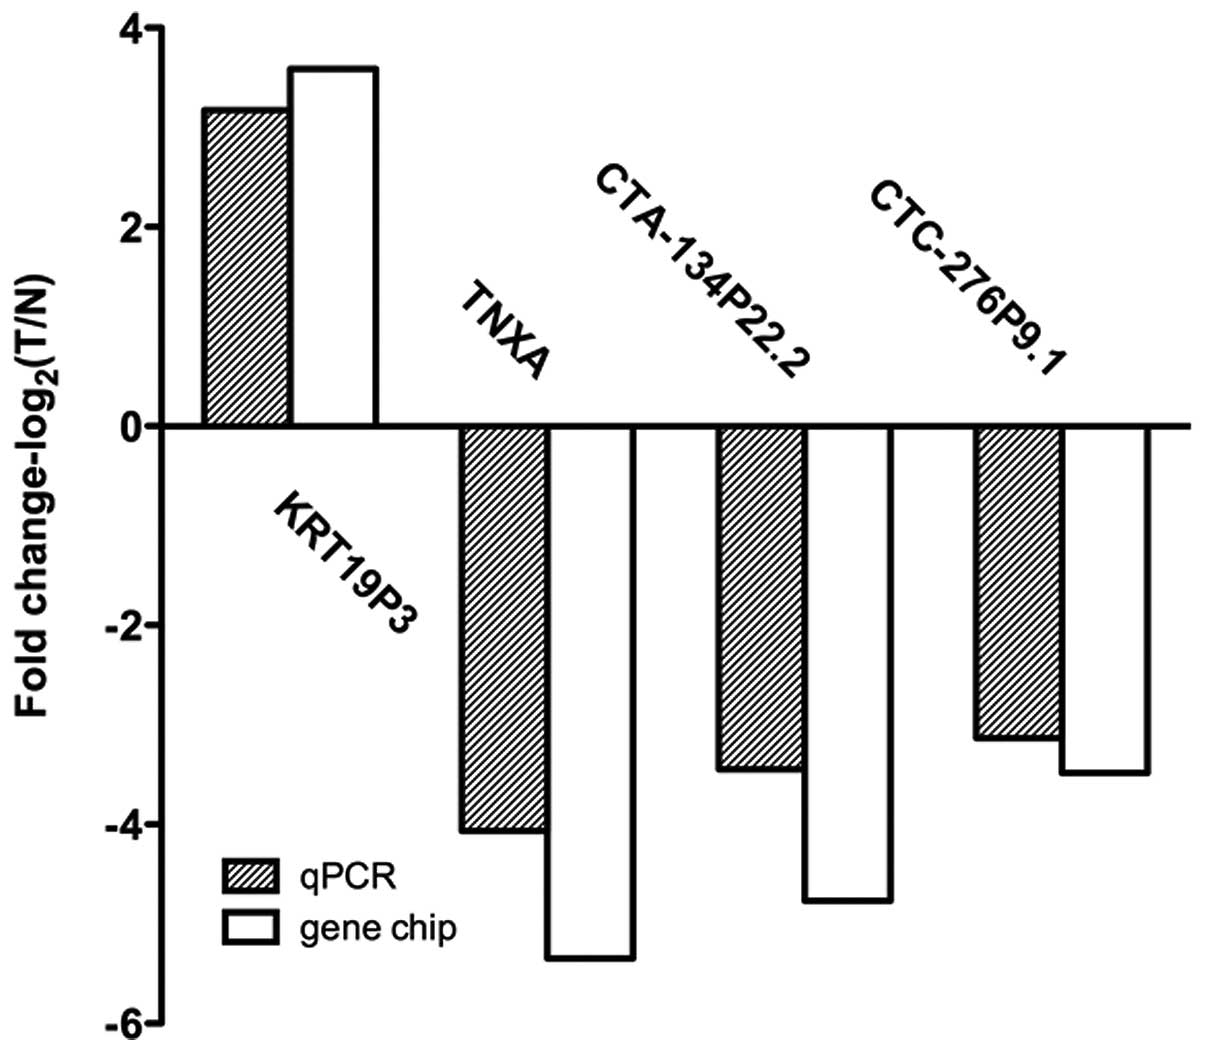
Four lncRNAs were selected for further confirmation
of microarray results using qPCR. These lncRNAs were among the most
downregulated or upregulated lncRNAs. Data analysis showed that
KRT19P3 was upregulated and TNXA, CTA-134P22.2 and CTC-276P9.1 were
downregulated in bladder cancer samples compared with matched
normal tissues (Fig. 2). These data
support a strong correlation between the qPCR result and the
microarray data (Fig. 3).
Construction of the lncRNA-mRNA
co-expression network
We constructed a coding-non-coding gene
co-expression network based on the correlation analysis between the
differentially expressed lncRNA and mRNA. We used lncRNAs and mRNAs
with Pearson’s correlation coefficients of no less than 0.99 to
construct the network. In total, 79 lncRNAs and 103 mRNAs were
included in the co-expression network. The co-expression network
indicated that one mRNA or lncRNA may correlate with one to tens of
lncRNAs. The co-expression network may suggest that the
inter-regulation of lncRNAs and mRNAs is involved in bladder
cancer.
Discussion
The human transcriptome is more complex than a
collection of protein-coding genes and their splice variants
(11–13). With the advent of whole-genome and
transcriptome sequencing technologies, it was shown that at least
90% of the genome is actively transcribed (13). Although lncRNA was initially
suggested to be transcriptional noise, recent evidence suggests
that this part of the genome may play a major biological role in
cellular development and human diseases (14,15).
The newly discovered lncRNAs demonstrate developmental and
tissue-specific expression patterns, and aberrant regulation in a
variety of diseases, including cancer (16–18).
However, the function of lncRNAs in tumor pathogenesis and growth
is less well characterized.
Recent studies have started to reveal the importance
of lncRNAs in tumorigenesis in bladder cancer. Yang et al
demonstrated that UCA1 regulates cell cycle progression through
CREB via PI3K-AKT-dependent signaling pathways and may serve as a
new diagnostic and therapeutic target in bladder cancer (8). Ying et al demonstrated that
MALAT-1 expression levels were upregulated in bladder cancer that
subsequently metastasized, and that increased expression of MALAT-1
activated the Wnt pathway to promote epithelial-mesenchymal
transition and human bladder cancer cell metastasis (9). However, the genome-wide expression and
functional significance of lncRNAs in bladder cancer remains
unclear.
In this study, we evaluated the lncRNA expression
profile in the tissue of four bladder cancer patients to reveal the
potential role of lncRNAs in the pathogenesis of bladder cancer.
Microarray techniques revealed a set of significantly
differentially expressed lncRNAs, with 22 upregulated and 88
downregulated lncRNAs in bladder cancer tissue compared with
matched normal tissue (fold change ≥8). For further validation of
microarray results, qPCR was performed to evaluate the expression
patterns of TNXA, CTA-134P22.2, CTC-276P9.1 and KRT19P3 in a total
of 51 patients with bladder cancer. The qPCR results matched well
with the data from the microarray.
A major function of lncRNAs is to modulate the
epigenetic status of proximal or distal protein-coding genes via
cis- and trans-acting mechanisms (19,20).
We also observed that numerous lncRNA expression levels were
significantly correlated with the expression of tens of protein
coding genes by construction of the lncRNA-mRNA co-expression
network. For example, RUNX1T1 and SLC25A4 were correlated with 21
and 28 mRNAs respectively.
In order to gain insight into the function of
targets of lncRNAs, GO term and KEGG pathway annotation were
applied to the target gene pool. KEGG annotation showed a
significant association with the p53, bladder cancer, cell cycle
and propanoate metabolism pathway gene expression in the bladder
cancer group compared with the normal tissue group, indicating that
deregulated lncRNAs may act by regulating protein-coding genes in
these pathways.
We demonstrated for the first time the expression
profiles of human lncRNAs in bladder cancer by microarray. We
identified a collection of aberrantly expressed lncRNAs in bladder
cancer compared to matched normal tissue. It is likely that these
deregulated lncRNAs play a key or partial role in the development
and/or progression of bladder cancer. Further study is required to
determine whether these lncRNAs may serve as new therapeutic
targets and diagnostic biomarkers in bladder cancer.
Acknowledgements
This study was supported by the National Natural
Science Foundation of China (no. 81302216) and the Specialized
Research Fund for the Doctoral Program of Higher Education of China
(no. 20130071110056).
References
|
1
|
Jemal A, Siegel R, Ward E, et al: Cancer
statistics, 2008. CA Cancer J Clin. 76:71–96. 2008. View Article : Google Scholar
|
|
2
|
Kim WJ and Bae SC: Molecular biomarkers in
urothelial bladder cancer. Cancer Sci. 99:646–652. 2008. View Article : Google Scholar : PubMed/NCBI
|
|
3
|
Ponting CP, Oliver PL and Reik W:
Evolution and functions of long noncoding RNAs. Cell. 136:629–641.
2009. View Article : Google Scholar : PubMed/NCBI
|
|
4
|
Gupta RA, Shah N, Wang KC, et al: Long
non-coding RNA HOTAIR reprograms chromatin state to promote cancer
metastasis. Nature. 464:1071–1076. 2010. View Article : Google Scholar : PubMed/NCBI
|
|
5
|
Yang F, Bi J, Xue X, et al: Up-regulated
long non-coding RNA H19 contributes to proliferation of gastric
cancer cells. FEBS J. 279:3159–3165. 2012. View Article : Google Scholar : PubMed/NCBI
|
|
6
|
Lai MC, Yang Z, Zhou L, et al: Long
non-coding RNA MALAT-1 overexpression predicts tumor recurrence of
hepatocellular carcinoma after liver transplantation. Med Oncol.
29:1810–1816. 2012. View Article : Google Scholar
|
|
7
|
Cao DL, Ye DW, Zhang HL, et al: A
multiplex model of combining gene-based, protein-based, and
metabolite-based with positive and negative markers in urine for
the early diagnosis of prostate cancer. Prostate. 15:700–710.
2011.
|
|
8
|
Yang C, Li X, Wang Y, Zhao L and Chen W:
Long non-coding RNA UCA1 regulated cell cycle distribution via CREB
through PI3-K dependent pathway in bladder carcinoma cells. Gene.
15:8–16. 2012. View Article : Google Scholar
|
|
9
|
Ying L, Chen Q, Wang Y, et al: Upregulated
MALAT-1 contributes to bladder cancer cell migration by inducing
epithelial-to-mesenchymal transition. Mol Biosyst. 8:2289–2294.
2012. View Article : Google Scholar : PubMed/NCBI
|
|
10
|
Zhu Y, Yu M, Li Z, et al: ncRAN, a newly
identified long noncoding RNA, enhances human bladder tumor growth,
invasion, and survival. Urology. 77:510.e1–e5. 2011.PubMed/NCBI
|
|
11
|
Kapranov P, Willingham AT and Gingeras TR:
Genome-wide transcription and the implications for genomic
organization. Nat Rev Genet. 8:413–423. 2007. View Article : Google Scholar : PubMed/NCBI
|
|
12
|
Washietl S, Hofacker IL, Lukasser M,
Hüttenhofer A and Stadler PF: Mapping of conserved RNA secondary
structures predicts thousands of functional noncoding RNAs in the
human genome. Nat Biotechnol. 23:1383–1390. 2005. View Article : Google Scholar : PubMed/NCBI
|
|
13
|
Gibb EA, Brown CJ and Lam WL: The
functional role of long non-coding RNA in human carcinomas. Mol
Cancer. 10:382011. View Article : Google Scholar : PubMed/NCBI
|
|
14
|
Mercer TR, Dinger ME and Mattick JS: Long
non-coding RNAs: insights into functions. Nat Rev Genet.
10:155–159. 2009. View
Article : Google Scholar : PubMed/NCBI
|
|
15
|
Wilusz JE, Sunwoo H and Spector DL: Long
noncoding RNAs: functional surprises from the RNA world. Genes Dev.
23:1494–1504. 2009. View Article : Google Scholar : PubMed/NCBI
|
|
16
|
Zong X, Tripathi V and Prasanth KV: RNA
splicing control: yet another gene regulatory role for long nuclear
noncoding RNAs. RNA Biol. 8:968–977. 2011. View Article : Google Scholar : PubMed/NCBI
|
|
17
|
Pauli A, Rinn JL and Schier AF: Non-coding
RNAs as regulators of embryogenesis. Nat Rev Genet. 2:136–149.
2011. View
Article : Google Scholar : PubMed/NCBI
|
|
18
|
Han L, Zhang K, Shi Z, et al: LncRNA
profile of glioblastoma reveals the potential role of lncRNAs in
contributing to glioblastoma pathogenesis. Int J Oncol.
40:2004–2012. 2012.
|
|
19
|
Qureshi IA, Mattick JS and Mehler MF: Long
non-coding RNAs in nervous system function and disease. Brain Res.
1338:20–35. 2010. View Article : Google Scholar : PubMed/NCBI
|
|
20
|
Ørom UA, Derrien T, Beringer M, et al:
Long noncoding RNAs with enhancer-like function in human cells.
Cell. 143:46–58. 2010.
|