Introduction
The incidence of gastric cancer (GC) is decreasing
worldwide, however, it is the third leading cause of cancer-related
mortality in China and was responsible for the mortality of 320,000
patients between 2004 and 2005 (1).
Although great improvements have been made in diagnostic techniques
and treatments for GC, the five-year survival rate for GC remains
as low as 20 to 30% (2). It is of
particular concern that GC is a multifactorial and multistep
disease that involves the activation of oncogenes and inactivation
of tumor suppressor genes at different stages (3,4). The
GC stage at diagnosis is a significant prognostic factor. However,
distant and locoregional relapses frequently occur despite surgical
resection and multimodality therapy. Thus, well-characterized
biomarkers are necessary for the screening, diagnosis or prognostic
prediction of GC.
Astrocyte elevated gene-1 (AEG-1), also termed
metadherin and LYRIC, was originally identified as a human
immunodeficiency virus-inducible gene in primary human fetal
astrocytes (5,6). Using phage display strategy, Brown and
Ruoslahti (7) established an
AEG-1-mediated metastases of mouse breast cancer cells to the
lungs, which demonstrated the involvement of AEG-1 in cancer.
Further studies have shown that elevated AEG-1 expression is
detected in subsets of malignant tumors, including esophageal
squamous cell carcinoma (8),
hepatocellular carcinoma (9),
non-small cell lung cancer (10),
neuroblastoma (11), breast cancer
(12), prostate cancer (13), and renal cancer (14), compared with normal cells and
matched non-neoplastic tissues. AEG-1 is vital in the biological
functions of cancer by influencing invasion, metastasis (15), chemoresistance (16), autophagy (17) and tumor growth (18). In addition, Emdad et al
(19) reported that representative
angiogenic markers, including angiopoietin 1 and hypoxia-inducible
factor (HIF)-1α, correlate with AEG-1 upregulation in rat embryo
fibroblasts that were transduced by AEG-1. Furthermore,
AEG-1-induced angiogenesis involved the activation of
phosphoinositide 3-kinase/Akt signaling and the ectopic expression
of AEG-1 in human umbilical vein endothelial cells promoted tube
formation.
The aim of the present study was to analyze AEG-1
expression levels in GC using immunohistochemistry, western
blotting and real-time reverse transcription-polymerase chain
reaction (qPCR). In addition, the possible correlation between
AEG-1 expression and clinicopathological variables was investigated
and its prognostic value was determined. Furthermore, the
functional role of AEG-1 in the angiogenesis of GC was
evaluated.
Materials and methods
Case selection
In the present study, a total of 216 paired
cancerous and matched adjacent non-cancerous gastric mucosa tissues
were selected consecutively from the surgical pathology archives of
the First Affiliated Hospital of Sun Yat-Sen University (Guangzhou,
China) between 2004 and 2005. The previous histological diagnosis
was confirmed by a pathologist. Clinicopathological variables,
including age, gender, histological type and pathological stage,
were collected by reviewing medical charts and pathology records.
Among these patients, 80 were males and 136 were females, and the
age of these patients ranged between 26 and 81 years at the time of
surgery (mean age, 61.9 years). All patients had follow-up records
for over five years. All cases were selected for the present study
on the basis of a paraffin-embedded, formalin-fixed tissue block.
Approval for this study was provided by the Medical Ethics
Committee of Sun Yat-Sen University (Guangzhou, China), and all
specimens were anonymous and handled according to the ethical and
legal standards.
Immunohistochemistry for AEG-1, vascular
endothelial growth factor (VEGF) and cluster of differentiation
(CD)34
Unstained 4-μm sections were cut from the selected
paraffin block and deparaffinized by routine techniques. The slides
were steamed for 20 min in sodium citrate buffer (diluted to 1X
from 10X heat-induced epitope retrieval buffer). After cooling for
5 min, the slides were labeled for 2 h at room temperature with a
1:100 dilution of rabbit monoclonal antibody against AEG-1, 1:200
dilution of rabbit monoclonal antibody against VEGF or 1:200
dilution of mouse monoclonal antibody against CD34 (all Maxim-Bio,
Fuzhou, China). Labeling was detected by adding biotinylated
secondary antibodies, avidin-biotin complex and
3,3′-diaminobenzidine. The sections were counterstained with
hematoxylin. AEG-1, VEGF and CD34 immunolabeling were evaluated
jointly by two of the authors using a multi-headed microscope
(Olympus Corporation, Tokyo, Japan), with agreement on all cases.
In the negative control, phsophate-buffered saline was used to
replace AEG-1, VEGF and CD34. The known positive slice in the
streptavidin-peroxidase kit (Maxim-Bio) was used as the positive
control.
Evaluation of immunohistochemistry
The scoring criteria were determined during a
preliminary evaluation using a multi-headed microscope in order to
reach a consensus. The staining results for each antibody were
interpreted by two of the authors independently, without prior
knowledge of the clinicopathological parameters. Discordant cases
were reviewed and agreed upon prior to statistical analysis of the
data. For each sample, at least five fields (magnification, ×400)
and >500 cells were analyzed. Under a microscope, the
distribution, positive intensity and positive ratio of AEG-1 and
VEGF protein expression were observed. The number of immunopositive
cells was semi-quantitatively estimated. Firstly, a scoring system
according to the staining intensity was determined as follows: 0,
colorless; 1, light yellow; 2, brown-yellow; and 3, dark brown.
Scoring according to the percentage of positive cells was
determined as follows: 0, no positive cells; 1, <10% positive
stained cells; 2, 11–50% positive stained cells; 3, 51–75% positive
stained cells; and 4, >75% positive stained cells. If the
product of multiplication between staining intensity and the
percentage of positive cells was ≥2, the sample was considered to
be immunopositive (+). A known positive control was included with
each run of staining to monitor the batch-to-batch consistency.
Microvessel density (MVD) counting
The previously mentioned pathologist performed the
MVD scoring. MVD was determined by light microscopy in the regions
of invasive tumor containing the highest numbers of capillaries and
small venules (microvessels) per area (i.e. areas with the most
intense neovascularization). Tumor sections were scanned first at a
low power (magnifications, ×40 and ×100) to identify areas of
invasive carcinoma with the greatest numbers of distinct
CD34-stained microvessels per area (brown), usually at the margins
of the carcinoma. Individual microvessel counts were performed on a
×200 field within the area of the most intense tumor
neovascularization. Any endothelial cell or endothelial cell
cluster that was positive for CD34 and clearly separate from an
adjacent cluster was considered to be a single countable
microvessel. Data are presented as the highest number of
microvessels identified within any single ×200 field. The review
was performed without any knowledge of the clinical outcome.
Cell culture and RNA interference
The MGC-803 cell line was purchased from the Wuhan
Cell Bank of Wuhan University (Wuhan, China). The cells were
cultured in RPMI medium supplemented with 10% heat-inactivated
fetal calf serum at 37°C under 5% CO2 atmosphere in a
humidified incubator. Lipofectamine 2000 was used for siRNA
transfections. MGC-803 cells in the exponential phase of growth
were grown for 24 h, plated in antibiotic-free RPMI at a density of
2×10⁴ cells/ml and then transfected with siRNA (AEG-1
siRNA, >97% purity). The ion-exchange high-performance liquid
chromatography-purified siRNA (AEG-1 siRNA) was purchased from
Ruibo (Guangzhou, China). For selection of the AEG-1 siRNA, a homo
sapiens AEG-1 mRNA sequence was subjected to the National Center
for Biotechnology Information Basic Local Alignment Search Tool
search against the Bos taurus expressed sequence tag cDNA
library. The following base pair duplexes of siRNA were used:
Sense, 5′-GGUCUCAGAUGAUGAUAAATT-3′ and antisense,
5′-UUUAUCAUCAUCUGAGACCTT-3′ for AEG-1. In addition to the medium
control, the cells were transfected with negative control siRNA and
following 24, 48 and 72 h of transfection, the cells were harvested
and used for the experiments.
Western blotting
Protein extracts were prepared using a lysis buffer
(10 mM Tris-HCl [pH 7.5], 1% Triton X-100, 20% glycerol, 1 mM EDTA,
50 mM NaCl and 1 mM phenylmethylsulfonyl fluoride). In total, 90 μg
protein was loaded onto SDS-polyacrylamide gels, subjected to
electrophoresis and transferred onto nitrocellulose membranes
(Millipore, Billerica, MA, USA). Blotted membranes were incubated
with a 1:2,000 dilution of the anti-AEG-1, -VEGF and -HIF-1α
antibodies (Sigma-Aldrich, St. Louis, MO, USA) in 5%
milk/Tris-buffered saline with Tween-20 (TBST) for 24 h. Following
three 10-min washes in TBST, the membranes were incubated with a
1:1,000 dilution of goat horseradish peroxidase-conjugated
secondary antibody (Sigma-Aldrich) in 5% milk/phosphate-buffered
saline with Tween-20 (PBST) for 3 h. Finally, membranes were
subjected to three 10-min washes in PBST and the immunocomplexes
were visualized using an enhanced chemiluminescence system
(Amersham Pharmacia Biotech, Amersham, UK). The same membrane was
reprobed with β-actin-specific antibody to ensure equal
control.
qPCR
For qPCR, total RNA was extracted using the RNA easy
kit (Qiagen, Valencia, CA, USA). Briefly, total RNA (1 μg) was
reverse transcribed in 20 μl reaction using 0.5 μg oligo dT and 200
units of Superscript II RT (Invitrogen Life Technologies, Carlsbad,
CA, USA). The amplification was performed in a total volume of 20
μl, containing 0.5 μM of each primer, 4 mM MgCl2, 2 μl
LightCycler™ FastStart DNA Master SYBR Green I (Roche Diagnostics,
Indianapolis, IN, USA) and 2 μl of cDNA (1:10). The Ct value
(initial amplification cycle) of each standard dilution was plotted
against the standard cDNA copy numbers. The sample cDNA copy number
was calculated according to the sample Ct value and on the basis of
the standard curves for each gene. Standard curves and PCR results
were analyzed using ABI 7000 software (Applied Biosystems, Foster
City, CA, USA). The results were normalized against those of the
housekeeping gene, glyceraldehyde-3-phosphate dehydrogenase
(GAPDH), in the same sample. The target gene primers used were:
Forward, 5′-CGAGAAGCCCAAACCAAATG-3′ and reverse,
5′-TGGTGGCTGCTTTGCTGTT for AEG-1; forward,
5′-CAAGGCCAGCACATAGGAGA-3′ and reverse, 5′-ACGCGAGTCTGTGTTTTTGC-3′
for VEGF; forward, 5′-AAGTCAGCAACGTGGAAGGT-3′ and reverse,
5′-TTCATATCGAGGCTGTGTCG-3′ for HIF-1α; and forward,
5′-GACTCATGACCACAGTCCATGC-3′ and reverse,
5′-AGAGGCAGGGATGATGTTCTG-3′ for GAPDH. All of the PCR reactions
were performed in duplicate.
Statistical analyses
Statistical analysis was performed using the one- or
two-way analysis of variance test followed by Tukey’s test or
Student’s t-test, and Spearman’s rho correlation analysis in SPSS
11.5 (SPSS, Inc., Chicago, IL, USA). The probability of survival in
the different subgroups was calculated using the Kaplan-Meier
method and statistical significance was analyzed using the log-rank
test. P<0.05 was considered to indicate a statistically
significant difference.
Results
Analysis of AEG-1 mRNA expression by qPCR
and protein expression by western blotting
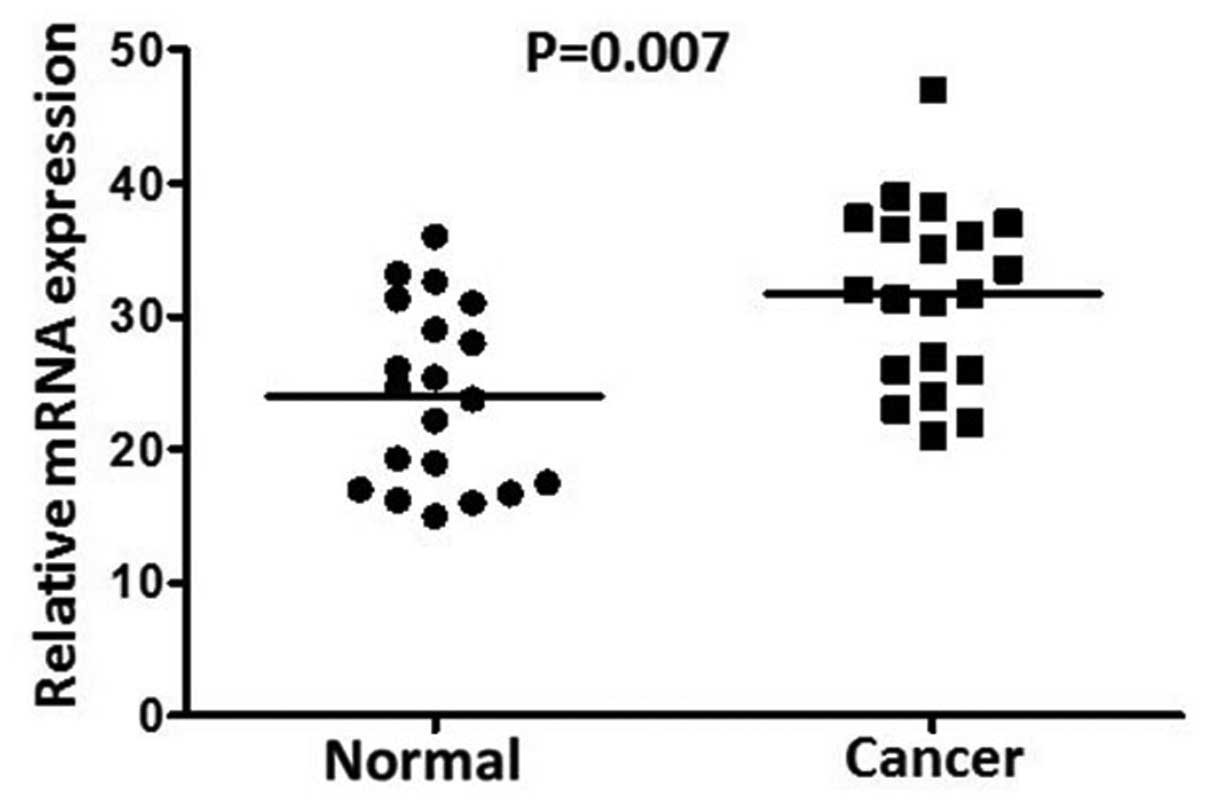
To determine whether AEG-1 expression is associated
with the progression of GC, qPCR and western blotting were
performed on the 20 pairs of primary GC tissues and matched
adjacent non-cancerous gastric mucosa tissues. The AEG-1 expression
levels in the tumor-bearing tissues were significantly higher than
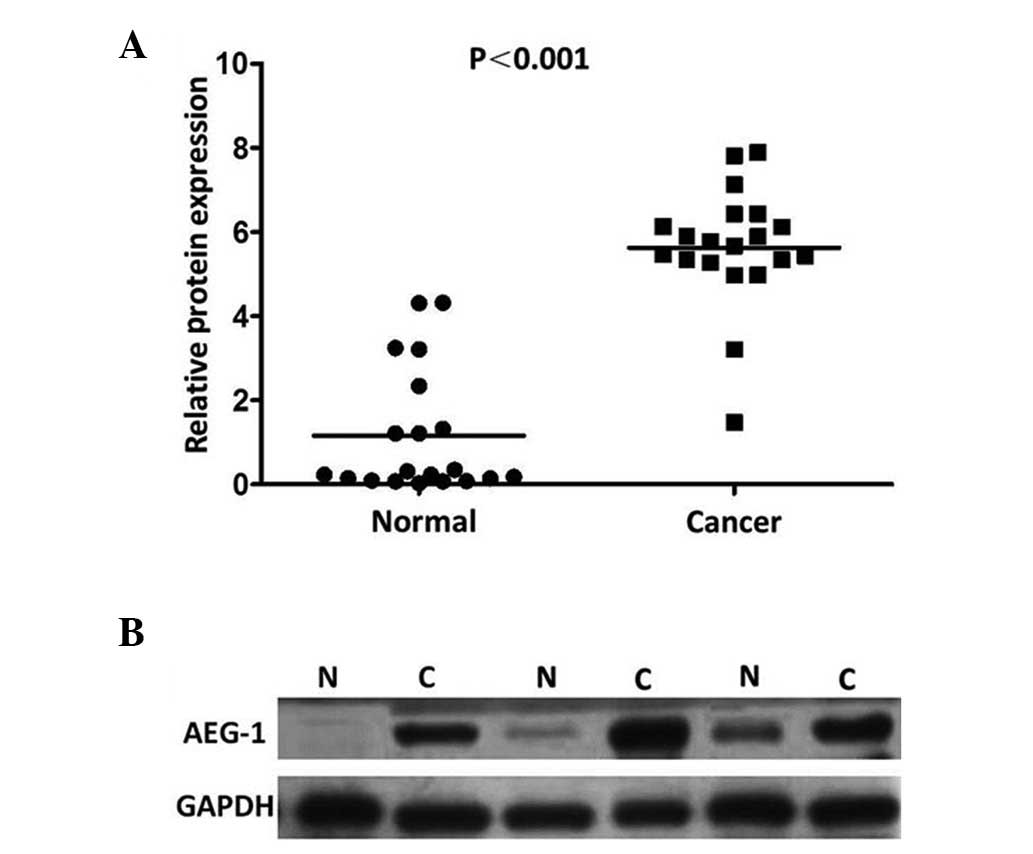
those in the adjacent non-tumor tissues (P=0.007; Fig. 1). The results showed an AEG-1 band
with a predicted size of 82 kDa and the relative amount of AEG-1
protein was measured further via densitometry. Consistent with the
qPCR results, an increase in AEG-1 protein expression was observed
in 19 (95.0%) of the gastric tumor tissues, compared with the
matched adjacent non-tumor tissues (P<0.001; Fig. 2).
AEG-1 expression in GC and its
correlation with clinicopathological features
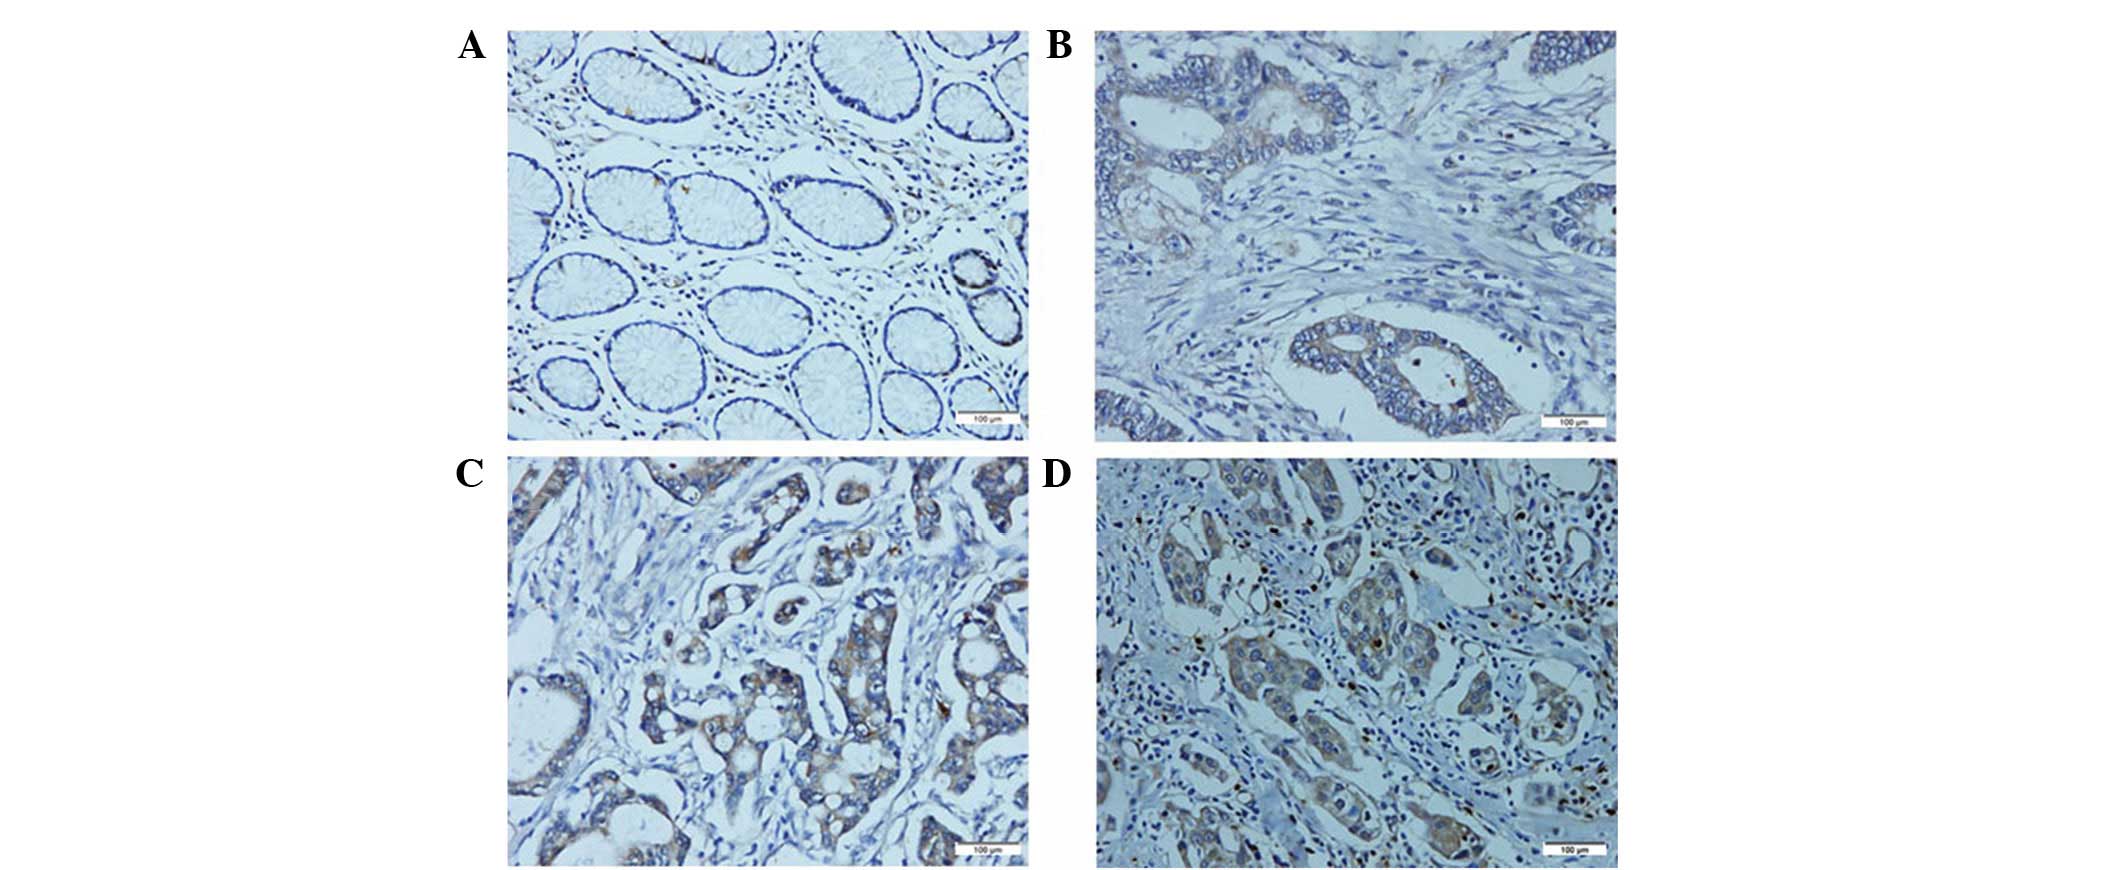
To further investigate the clinicopathological and
prognostic roles of AEG-1 expression, immunohistochemical analyses
was performed on the 216 paraffin-embedded GC tissue blocks. In
total, 143 of the 216 (66.2%) cases showed high AEG-1 expression in
cancerous tissues, whereas 34 of the 216 (15.7%) cases showed high
AEG-1 expression in the normal gastric mucosa (Fig. 3). The correlation between the
expression of AEG-1 and various clinicopathological parameters are
listed in Table I. The results
indicated that increased expression of AEG-1 was significantly
correlated with the differentiation degree (P<0.001), depth of
tumor infiltration (T stage; P<0.001), the N stage (P=0.003) and
the M stage (P=0.013), whereas AEG-1 was not found to correlate
with age, gender, tumor size or histological type.
 | Table ICorrelation between AEG-1 expression
and clinicopathological variables of 216 GC cases. |
Table I
Correlation between AEG-1 expression
and clinicopathological variables of 216 GC cases.
| AEG-1 expression | χ2
test |
|---|
|
|
|
|---|
| Characteristic | High, n | Low, n | P-value |
|---|
| Normal gastric
mucosa | 34 | 182 | <0.001 |
| GC tissues | 143 | 73 | |
| Age, years | | | 0.687 |
| ≤50 | 49 | 34 | |
| >50 | 94 | 39 | |
| Gender | | | 0.101 |
| Male | 47 | 33 | |
| Female | 96 | 40 | |
| Tumor size, cm | | | 0.401 |
| <3 | 17 | 12 | |
| ≥3 | 126 | 61 | |
| Histological
type | | | 0.191 |
| Intestinal | 71 | 27 | |
| Diffuse | 51 | 31 | |
| Mixed | 21 | 15 | |
| Differentiation
degree | | | <0.001 |
| Well to
moderate | 31 | 47 | |
| Poor | 97 | 24 | |
| Other | 15 | 2 | |
| T
classification | | | <0.001 |
| T1 | 6 | 27 | |
| T2 | 9 | 24 | |
| T3 | 14 | 12 | |
| T4 | 114 | 10 | |
| N
classification | | | 0.003 |
| N0 | 41 | 34 | |
| N1 | 27 | 17 | |
| N2 | 28 | 13 | |
| N3 | 47 | 9 | |
| M
classification | | | 0.013 |
| M0 | 112 | 67 | |
| M1 | 31 | 6 | |
Correlation between AEG-1 expression and
GC survival
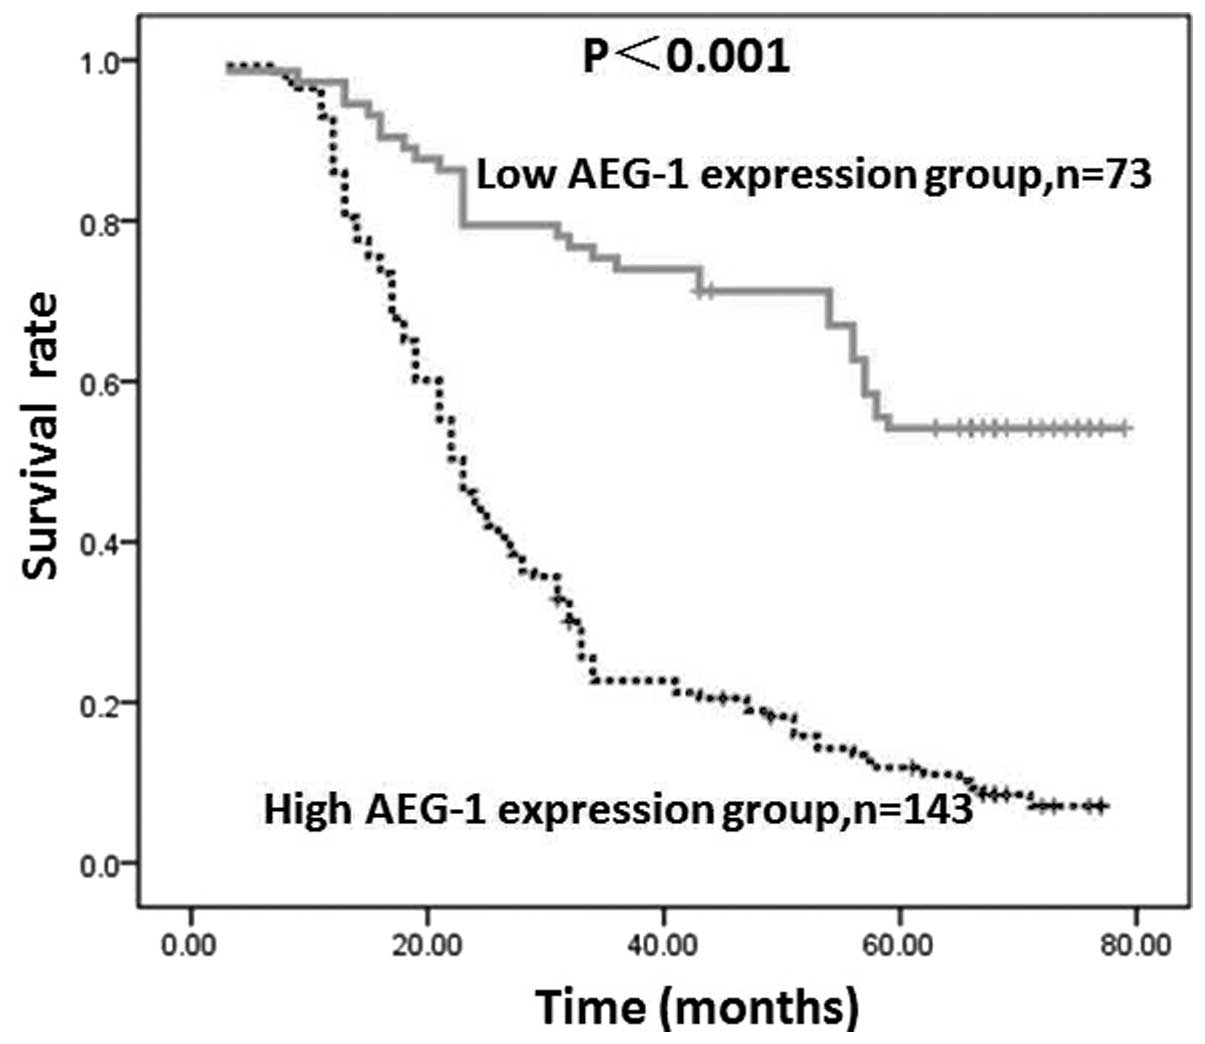
AEG-1 expression by GC cells in tumor lesions was
found to inversely correlate with patient survival, which was
revealed by Kaplan-Meier analysis and the log-rank test. The
five-year overall survival rates in patients with high and low
AEG-1 expression were 9.8 and 50.7%, respectively. As shown in
Fig. 4, the two survival curves
were significantly different and the survival rate in the group
with low AEG-1 expression was higher than that in the group with
high AEG-1 expression (P<0.001).
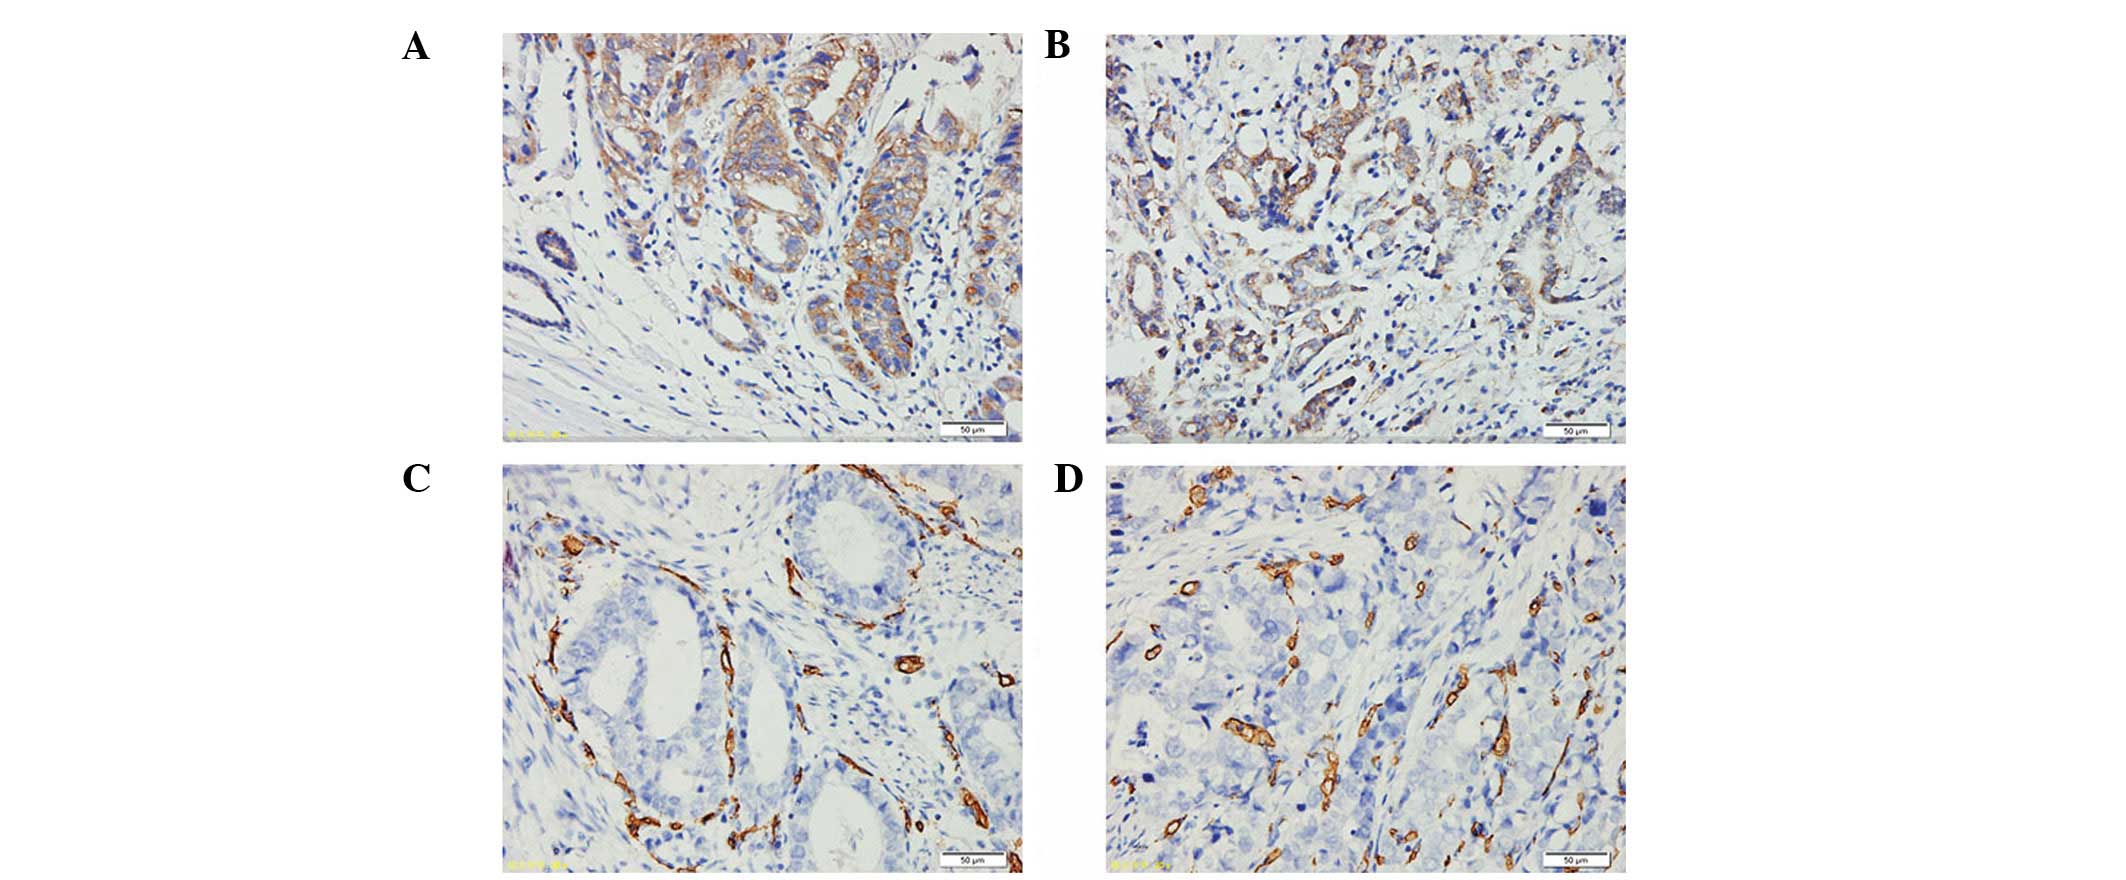
Correlation between AEG-1, and VEGF and
MVD
AEG-1 and VEGF protein expression was examined in
the 216 cases of primary GC samples. The results revealed a
positive correlation between AEG-1 and VEGF protein expression in
the GC samples (P<0.001). VEGF was expressed in the cytoplasm of
tumor cells with a homogenous or granular pattern (Fig. 5A and B). In all GC patients, 111 of
the 143 cases with high AEG-1 expression showed VEGF positivity
(77.6%). Of the 73 cases with reduced AEG-1, nine cases were also
found to exhibit VEGF positivity (12.3%). CD34-positive granules
were located in the vascular endothelial cells (Fig. 5C and D) and MVD in the
AEG-1-positive group was 78.06±6.79, which was markedly higher than
that in the AEG-1-negative group (17.72±3.31). AEG-1 staining was
found to positively correlate with MVD (P<0.001; Table II).
| Table IICorrelation between AEG-1, and VEGF
and MVD. |
Table II
Correlation between AEG-1, and VEGF
and MVD.
| | VEGFa | |
|---|
| |
| |
|---|
| AEG-1 | n | + (n) | − (n) | MVDa (mean ± SD) |
|---|
| + | 143 | 111 | 32 | 78.06±6.79 |
| − | 73 | 9 | 64 | 17.72±3.31 |
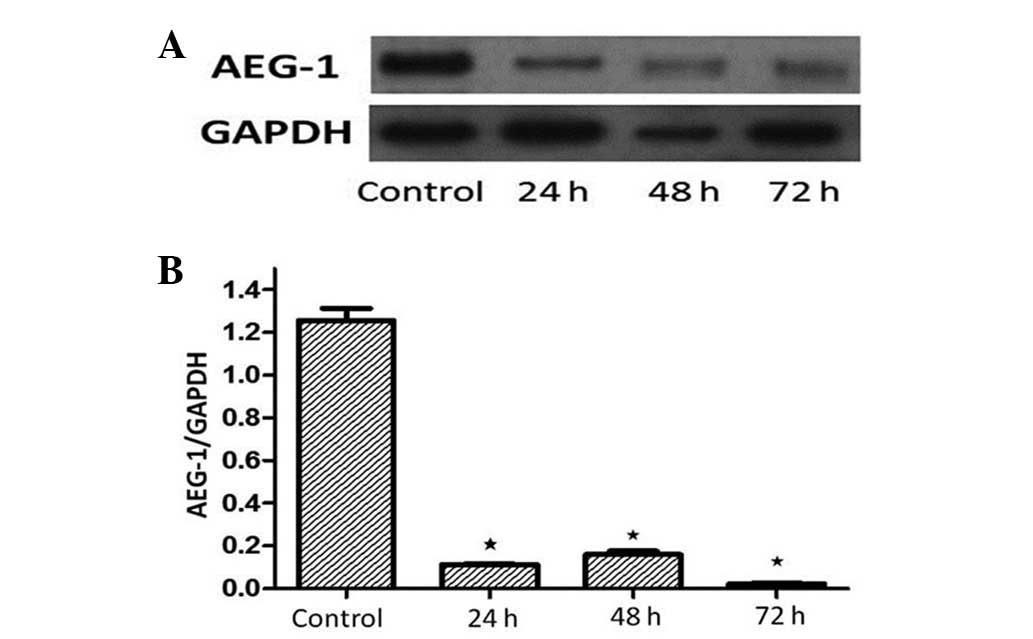
AEG-1 siRNA inhibits the expression of
AEG-1 in MGC-803 cells
To investigate the role of AEG-1 on VEGF and HIF-1α
expression in MGC-803 cells, siRNA was used to specifically
knockdown AEG-1 expression. The efficacy of AEG-1 siRNA on the
AEG-1 protein was confirmed by western blotting at 24, 48 and 72 h
following siRNA transfection. As shown in Fig. 6, treatment with AEG-1 siRNA
significantly decreased AEG-1 protein expression by ~80% in the
MGC-803 cells at 48 and 72 h when compared with the siRNA control
(P<0.01). This indicated that the AEG-1 siRNA achieved a
successful knockdown.
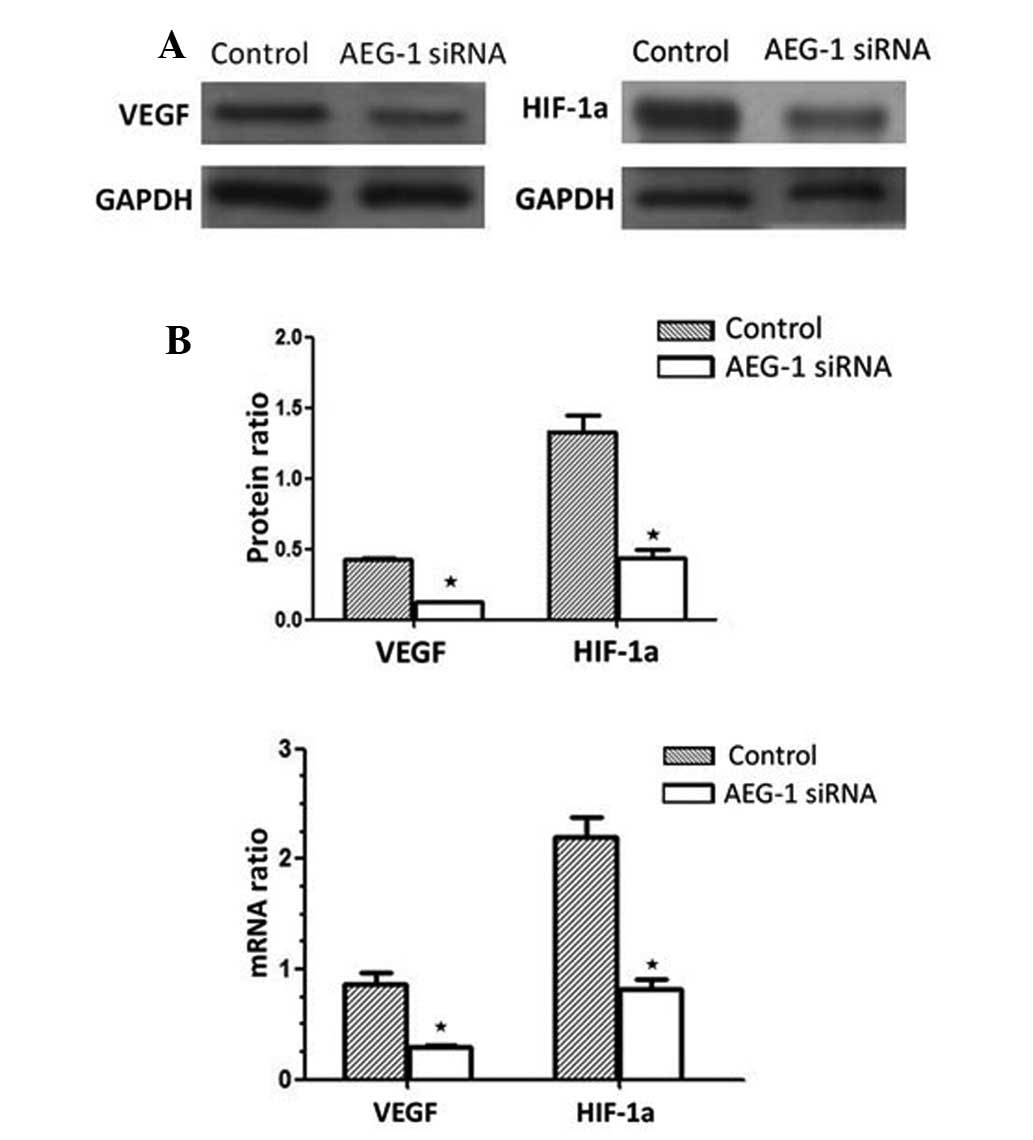
Role of AEG-1 in VEGF, and HIF-1α mRNA
and protein expression in MGC-803 cells
In response to AEG-1 siRNA, VEGF protein expression
decreased by 67.23% following AEG-1 siRNA transfection, compared
with the siRNA-transfected control group (P<0.01). Furthermore,
HIF-1α protein expression decreased by 69.37% compared with the
siRNA-transfected control group (P<0.01; Fig. 7A). These results were associated
with a significant decrease in VEGF and HIF-1α mRNA expression in
AEG-1 siRNA-transfected MGC-803 cells (Fig. 7B), and indicated that AEG-1
signaling induces VEGF and HIF-1α upregulation in MGC-803
cells.
Discussion
GC is one of the most frequently diagnosed malignant
neoplasms and has a poor prognosis despite curative surgery and
postoperative adjuvant therapy (20). It has long been known that the
tumorigenesis and progression of GC is the result of a combination
of environmental factors, and the accumulation of generalized and
specific genetic alterations. A number of genetic or epigenetic
alterations have previously been reported in GC, including loss of
heterozygosity, microsatellite and chromosomal instability, as well
as hypermethylation (21). Due to
the early metastasis and marked invasion, the identification of
GC-specific biomarkers, which are involved in these processes is
significanct for the diagnosis, therapy and prognostic prediction
of GC in clinics.
Previously, AEG-1 overexpression has been found in a
spectrum of cancer types, including breast cancer, glioma and
prostate cancer. Furthermore, elevation of AEG-1 expression has
been found to markedly correlate with the clinical characteristics
of these tumors (12,22,23).
In addition, high expression of AEG-1 has been demonstrated to
promote cell proliferation, cell transformation and tumor
progression (24). The previously
described reports indicated that AEG-1 may be closely involved in
promoting tumorigenesis or progression. However, thus far, few
studies have analyzed the expression and clinical significance of
AEG-1 in primary GC. Therefore, the present study detected AEG-1
expression in GC by qPCR, western blotting and
immunohistochemistry, and analyzed the clinicopathological and
prognostic significance of AEG-1 in a large number of patient
samples.
AEG-1 mRNA expression was investigated by qPCR, and
protein expression was investigated by western blotting detection
in 20 pairs of primary GC tissues and matched adjacent
non-cancerous gastric mucosa tissues. The results showed that the
AEG-1 mRNA and protein levels were significantly upregulated in the
tumor tissue samples, compared with the levels observed in the
adjacent non-tumor tissue samples, which is consistent with the
observations made by Gnosa et al (25). In addition, the immunohistochemical
results demonstrated high AEG-1 expression in 66.2% (143/216) of GC
patients, which was significantly higher than that identified in
the adjacent non-tumor tissue samples. These results were
consistent with an earlier hypothesis by Lee et al (24) that AEG-1 may be an oncogene;
furthermore, it was hypothesized that AEG-1 activation may be
important in the tumorigenesis or progression of GC.
Additionally, activation of the nuclear factor-κB
signal by AEG-1 may be a key molecular mechanism by which AEG-1
promotes anchorage-independent growth and invasion, two typical
features of the neoplastic phenotype (26). In the current relatively large
series of GC patients (n=216), high AEG-1 expression significantly
correlated with a higher T stage of GC, implying that AEG-1
regulates tumor growth and invasion. Further analysis concerning
the correlation between AEG-1 expression and clinical
characteristics also showed a significant correlation the with N
and M classifications, although, AEG-1 expression was not found to
correlate with the age, gender, tumor size and histological type.
This indicated that AEG-1 may be useful as an independent marker to
identify subsets of GC patients with greater certainty. In
addition, enhanced AEG-1 immunoreactivity was detected in the
poorly differentiated GC tissues compared with the normal gastric
tissues and the well-differentiated GC tissues, which suggested
that high AEG-1 expression may be involved in tumor progression.
These results were consistent with the observation made by Li et
al (12), describing a
correlation between high AEG-1 expression and breast carcinomas.
The results obtained from the Kaplan-Meier survival analysis of the
current study showed that patients with high AEG-1 expression
exhibited significantly shorter overall survival times than
patients with low AEG-1 expression. These results indicated that
COP1 may serve as a valuable prognostic biomarker for GC patients
following surgery and as a potential target for gene therapy in the
treatment of GC.
The malignant potential of cancer involves
multifactor and multistep processes that occur in a specific manner
during tumor progression (27).
This ‘angiogenic switch’, as it is termed, is necessary for tumors
to obtain the required nutrients and oxygen to grow, and its
importance in the growth of solid tumors has been well established
(28). New vessels, that are
produced by the primary tumor and secondary distant metastases,
reflect a net balance between positive and negative regulators of
angiogenesis (29). The
abovementioned observations emphasize that any genetic change in a
cancer cell that culminates in tumor growth and metastasis are
likely to be inexorably bound to angiogenesis. The results of the
current study also showed that MVD in the AEG-1-positive group was
78.06±6.79, which was markedly higher than that observed in the
AEG-1-negative group (17.72±3.31; P<0.001). In addition, the GC
cases with high AEG-1 expression exhibited high levels of
additional angiogenic markers, including VEGF, which indicated that
AEG-1 may promote angiogenesis and be important in tumor
angiogenesis. HIF-1 is expressed in hypoxic tumor cells and
activates various hypoxia-responsive genes, which enhance tumor
growth, invasion and metastasis (30). To elucidate the detailed molecular
mechanism underlying AEG-1 function as an angiogenesis promoter,
the focus of the present study was on the expression of HIF-1α and
VEGF in MGC-803 cells that were treated with AEG-1 siRNA. In these
contexts, AEG-1 was shown to enhance HIF-1α expression in MGC-803
cells. In addition, HIF-1 activates proangiogenic cytokines, such
as VEGF, which increase the regrowth of tumor blood vessels
(31). In the present study, AEG-1
was found to upregulate VEGF expression in MGC-803 cells, which is
consistent with the observations of Yoo et al (9). In addition, the results further
demonstrated that HIF-1α and VEGF may be vital downstream genes of
AEG-1, which are important in angiogenesis that is mediated by
AEG-1. However, the observation of an ~70–80% reduction of HIF-1α
and VEGF expression in MGC-803 cells treated with AEG-1 siRNA
indicated that other signaling molecules may partially contribute
to increased hypoxia-induced angiogenesis. Further studies are
required to clarify the complex mechanisms involved in GC
angiogenesis.
In conclusion, the results of the present study,
which are based on immunohistochemical and molecular genetic
methods, indicate a frequent and complex role of AEG-1 in the
pathogenesis of GC. Furthermore, the results indicate that AEG-1 is
involved in the complex regulatory mechanism of angiogenesis,
potentially by the upregulation of HIF-1α and VEGF expression.
Acknowledgements
The current study was supported by the National
Natural Science Foundation of China (grant nos. 30900650/H1615,
81172232/H1615 and 81172564/H1625), the Fund for the Preceptorial
Program of Higher Education (grant no. 2009 0171120070), the
Technology Project Foundation of Guangdong (grant nos.
S2012010008378 and 2011B031800 104) and the National 863 High-Tech
R&D Program of China (grant no. 2012AA02A603).
References
|
1
|
Chen WQ: Estimation of cancer incidence
and mortality in China in 2004–2005. Zhonghua Zhong Liu Za Zhi.
31:664–668. 2009.(In Chinese).
|
|
2
|
Dudeja V, Habermann EB, Zhong W, et al:
Guideline recommended gastric cancer care in the elderly: insights
into the applicability of cancer trials to real world. Ann Surg
Oncol. 18:26–33. 2011. View Article : Google Scholar
|
|
3
|
Park MO and Park HA: Development of a
nursing practice guideline for pre and post-operative care of
gastric cancer patients. Healthc Inform Res. 16:215–223. 2010.
View Article : Google Scholar
|
|
4
|
Chen CN, Lin JJ, Chen JJ, et al: Gene
expression profile predicts patient survival of gastric cancer
after surgical resection. J Clin Oncol. 23:7286–7295. 2005.
View Article : Google Scholar : PubMed/NCBI
|
|
5
|
Kang DC, Su ZZ, Sarkar D, et al: Cloning
and characterization of HIV-1-inducible astrocyte elevated gene-1,
AEG-1. Gene. 353:8–15. 2005. View Article : Google Scholar : PubMed/NCBI
|
|
6
|
Su ZZ, Chen Y, Kang DC, et al: Customized
rapid subtraction hybridization (RaSH) gene microarrays identify
overlapping expression changes in human fetal astrocytes resulting
from human immunodeficiency virus-1 infection or tumor necrosis
factor-alpha treatment. Gene. 306:67–78. 2003. View Article : Google Scholar
|
|
7
|
Brown DM and Ruoslahti E: Metadherin, a
cell surface protein in breast tumors that mediates lung
metastasis. Cancer Cell. 5:365–374. 2004. View Article : Google Scholar
|
|
8
|
Yu C, Chen K, Zheng H, et al:
Overexpression of astrocyte elevated gene-1 (AEG-1) is associated
with esophageal squamous cell carcinoma (ESCC) progression and
pathogenesis. Carcinogenesis. 30:894–901. 2009. View Article : Google Scholar
|
|
9
|
Yoo BK, Emdad L, Su ZZ, et al: Astrocyte
elevated gene-1 regulates hepatocellular carcinoma development and
progression. J Clin Invest. 119:465–477. 2009. View Article : Google Scholar
|
|
10
|
Song L, Li W, Zhang H, et al:
Over-expression of AEG-1 significantly associates with tumour
aggressiveness and poor prognosis in human non-small cell lung
cancer. J Pathol. 219:317–326. 2009. View Article : Google Scholar
|
|
11
|
Lee SG, Jeon HY, Su ZZ, et al: Astrocyte
elevated gene-1 contributes to the pathogenesis of neuroblastoma.
Oncogene. 28:2476–2484. 2009. View Article : Google Scholar : PubMed/NCBI
|
|
12
|
Li J, Zhang N, Song LB, et al: Astrocyte
elevated gene-1 is a novel prognostic marker for breast cancer
progression and overall patient survival. Clin Cancer Res.
14:3319–3326. 2008. View Article : Google Scholar : PubMed/NCBI
|
|
13
|
Thirkettle HJ, Girling J, Warren AY, et
al: LYRIC/AEG-1 is targeted to different subcellular compartments
by ubiquitinylation and intrinsic nuclear localization signals.
Clin Cancer Res. 15:3003–3013. 2009. View Article : Google Scholar
|
|
14
|
Chen W, Ke Z, Shi H, et al: Overexpression
of AEG-1 in renal cell carcinoma and its correlation with tumor
nuclear grade and progression. Neoplasma. 57:522–529. 2010.
View Article : Google Scholar : PubMed/NCBI
|
|
15
|
Liu L, Wu J, Ying Z, et al: Astrocyte
elevated gene-1 upregulates matrix metalloproteinase-9 and induces
human glioma invasion. Cancer Res. 70:3750–3759. 2010. View Article : Google Scholar : PubMed/NCBI
|
|
16
|
Hanahan D and Weinberg RA: Hallmarks of
cancer: the next generation. Cell. 144:646–674. 2011. View Article : Google Scholar : PubMed/NCBI
|
|
17
|
Bhutia SK, Kegelman TP, Das SK, et al:
Astrocyte elevated gene-1 induces protective autophagy. Proc Natl
Acad Sci USA. 107:22243–22248. 2010. View Article : Google Scholar : PubMed/NCBI
|
|
18
|
Li J, Yang L, Song L, et al: Astrocyte
elevated gene-1 is a proliferation promoter in breast cancer via
suppressing transcriptional factor FOXO1. Oncogene. 28:3188–3196.
2009. View Article : Google Scholar : PubMed/NCBI
|
|
19
|
Emdad L, Lee SG, Su ZZ, et al: Astrocyte
elevated gene-1 (AEG-1) functions as an oncogene and regulates
angiogenesis. Proc Natl Acad Sci USA. 106:21300–21305. 2009.
View Article : Google Scholar : PubMed/NCBI
|
|
20
|
Jemal A, Bray F, Center MM, et al: Global
cancer statistics. CA Cancer J Clin. 61:69–90. 2011. View Article : Google Scholar
|
|
21
|
Nobili S, Bruno L, Landini I, et al:
Genomic and genetic alterations influence the progression of
gastric cancer. World J Gastroenterol. 17:290–299. 2011. View Article : Google Scholar : PubMed/NCBI
|
|
22
|
Emdad L, Sarkar D, Su ZZ, et al: Astrocyte
elevated gene-1: recent insights into a novel gene involved in
tumor progression, metastasis and neurodegeneration. Pharmacol
Ther. 114:155–170. 2007. View Article : Google Scholar
|
|
23
|
Kikuno N, Shiina H, Urakami S, et al:
Knockdown of astrocyte-elevated gene-1 inhibits prostate cancer
progression through upregulation of FOXO3a activity. Oncogene.
26:7647–7655. 2007. View Article : Google Scholar : PubMed/NCBI
|
|
24
|
Lee SG, Su ZZ, Emdad L, et al: Astrocyte
elevated gene-1 activates cell survival pathways through PI3K-Akt
signaling. Oncogene. 27:1114–1121. 2008. View Article : Google Scholar : PubMed/NCBI
|
|
25
|
Gnosa S, Shen YM, Wang CJ, et al:
Expression of AEG-1 mRNA and protein in colorectal cancer patients
and colon cancer cell lines. J Transl Med. 10:1092012. View Article : Google Scholar : PubMed/NCBI
|
|
26
|
Emdad L, Sarkar D, Su ZZ, et al:
Activation of the nuclear factor kappaB pathway by astrocyte
elevated gene-1: implications for tumor progression and metastasis.
Cancer Res. 66:1509–1516. 2006. View Article : Google Scholar : PubMed/NCBI
|
|
27
|
Hahn WC and Weinberg RA: Modelling the
molecular circuitry of cancer. Nat Rev Cancer. 2:331–341. 2002.
View Article : Google Scholar : PubMed/NCBI
|
|
28
|
Fidler IJ and Ellis LM: The implications
of angiogenesis for the biology and therapy of cancer metastasis.
Cell. 79:185–188. 1994. View Article : Google Scholar
|
|
29
|
Kumar R and Fidler IJ: Angiogenic
molecules and cancer metastasis. In Vivo. 12:27–34. 1998.
|
|
30
|
Semenza GL: Targeting HIF-1 for cancer
therapy. Nat Rev Cancer. 3:721–732. 2003. View Article : Google Scholar
|
|
31
|
Semenza GL: HIF-1 and tumor progression:
pathophysiology and therapeutics. Trends Mol Med. 8(Suppl 4):
S62–S67. 2002. View Article : Google Scholar : PubMed/NCBI
|