Introduction
Breast cancer is the most common type of malignancy
in females and remains a therapeutic challenge (1). Early-stage breast cancer is normally
associated with a good prognosis. However, a considerable number of
patients suffer from distant metastases which are usually
life-limiting. It is therefore essential to identify these
high-risk patients. Going beyond clinical and histopathological
staging and grading, molecular markers correlating with prognosis
have become increasingly important and are decisive factors in
deciding upon adjuvant therapies (2).
The special AT-rich sequence binding protein 1
(SATB1) binds to matrix attachment regions and has regulatory
effects on gene expression (3–6). SATB1
binds to heterochromatin and functions by recruiting
chromatin-modifying enzymes and transcription factors (6,4). SATB1
is an important factor in the development of thymocytes and T-cells
(7). It has also been identified as
a silencing factor contributing to the initiation of X-inactivation
(8), which makes it particularly
interesting in terms of X-linked tumor suppressor genes (9).
In addition, the expression of SATB1 has been found
to correlate with diminished overall survival in breast cancer
patients (10). SATB1 appears to
play an important role in transforming the gene expression profile
of tumor cells to have invasive and metastasizing properties, and
knockdown of SATB1 has been demonstrated to result in the
reversion of distant metastases (10). The BCL2 gene, which is
crucial in the regulation of apoptosis, appears to be partly
regulated by interactions with SATB1 (11). Direct impact of SATB1 inhibition on
tumor growth in breast cancer has been observed in vitro
(12). Thus, SATB1 may also be an
attractive therapeutic target in future.
In this study, the promoter region of the
SATB1 gene was screened for polymorphisms, the corresponding
haplotypes regarding alterations in promoter activity in
vitro were evaluated, and the impact of these haplotypes on the
clinical course of breast cancer patients was analyzed.
Patients and methods
Patients
A cohort of 241 Caucasian female breast cancer
patients who had been treated for thier first diagnosis of breast
cancer between 1989 and 1993 at the Department of Obstetrics and
Gynaecology, University Hospital of Essen (Essen, Germany), was
enrolled in this retrospective analysis, and their clinical data
were documented. Overall survival data were obtained from the local
municipal registry. The median follow-up time was 93 months (range,
4–155 months). Tumor stages were classified according to the TNM
and World Health Organization classifications of breast tumors
(13,14). The control cohort consisted of
healthy, Caucasian, age-matched female voluntary blood donors.
Approval for this study was obtained from the ethics committee of
the Medical Faculty, University of Duisburg-Essen (Essen, Germany)
and patients gave their informed consent.
Identification of single nucleotide
polymorphisms (SNPs)
PCR products from DNA of 10 healthy, unrelated
volunteers were used to identify new polymorphisms within the
promoter region. Using available reference sequences of human
SATB1, primer pairs were designed to amplify overlapping PCR
products of the assumed promoter region from -3807 up to -2828 bp
upstream of ATG.
DNA sequencing was performed by a third party (MWG
Eurofins Medigenomix, Ebersberg, Germany). Reference sequences and
sequenced fragments were analyzed using DNASTAR
MegAlign® (DNASTAR, Inc., Madison, WI, USA) for
Windows®.
Genotyping
Healthy voluntary blood donors and patients were
retrospectively genotyped for SATB1 polymorphisms. DNA was
extracted from whole blood or paraffinum-embedded tumor-free tissue
using a QIAamp kit (Qiagen, Hilden, Germany).
For -3600T>C, PCR was performed with the forward
primer 5′-AGGCGGTGGAGGTGGCTG-3′ and the reverse primer
5′-GCGGGGCTGTGAGCGTCT-3′, resulting in a 107 bp fragment (Eurofins
MWG Operon, Ebersberg, Germany). Following denaturation at 95°C, 38
cycles of DNA amplification were performed using Taq PCR
Mastermix (Eppendorf, Hamburg, Germany) at 95°C for 40 sec, 62°C
for 40 sec and 72°C for 40 sec. Digestion with BsaXI (New
England Biolabs, Inc., Ipswich, MA, USA) at 37°C resulted in
fragments of 50, 30 and 27 bp for the C-allele versus 107 bp for
the TT-genotype (no digestion). Electrophoresis was performed in
2.8% agarose gels using SYBR Safe® DNA gel stain
(Invitrogen Life Technologies, Carlsbad, CA, USA) for visualization
under ultraviolet light.
Genotyping of -3363A>G was carried out by PCR
with the forward primer 5′-GGCTGTGGGGAAAAGTTTAAGGTT-3′ and the
biotinylated reverse primer 5′-CCGAATAACGCGCATTGG-3′. The annealing
temperature was 62°C, and the remaining PCR conditions were as
described above. The 111-bp PCR products were analyzed by
pyrosequencing using the sequencing primer
5′-ATATTAGTCGCGATTGTTG-3′ on the PSQ96 system, according to the
manufacturer’s instructions, and results were analyzed using the
PSQ96 SNP software (Biotage AB, Uppsala, Sweden).
For -2984C>T, PCR was performed with the forward
primer 5′-TTTTACGATTTCCCCCCAAC-3′ and the biotinylated reverse
primer 5′-TGTAAAATGTCTAACCTCAGAGAA-3′ with an annealing temperature
of 67°C and accordant PCR conditions. Pyrosequencing of the 122 bp
product was performed using the sequencing primer
5′-TCCCCATCGCAAACC-3′ as described above.
For each genotyping assay, the certainty of the
method was confirmed by comparison with the sequence analyses of
ten healthy blood donors.
Cloning
Primers were designed to amplify the region from
-3801 up to -2801 bp upstream of ATG. The corresponding PCR
products were sequenced by an external service to ensure
correctness. Constructs with the respective alleles from the four
most frequent haplotypes were cloned into the pGEM®-T
Easy vector (Promega Corporation, Madison, WI, USA) and then
subcloned into the luc2-containing reporter vector, pGl
4.10® (Promega), for transfection of HEK293 cells. The
pGl 4.73® vector (Promega), containing hRluc, was
used for normalizing the transfection rates.
Transfection
Human embryonic kidney cells (HEK293) were routinely
maintained in Dulbecco’s modified Eagle’s medium supplemented with
10% fetal bovine serum.
For transfection, ~20,000 HEK293 cells were seeded
into 96-well dishes, and transfected by Lipofectamine 2000
(Invitrogen Life Technologies). Cells were cotransfected with 150
ng firefly reporter vector pGL 4.10® containing the
SATB1 promoter fragment, and 50 ng Renilla luciferase
vector pGL 4.73® to control for transfection efficiency.
After 6 h, the cell culture medium was replaced by 75 ml cell
culture medium without FBS. Untransfected HEK293 cells, as well as
HEK293 cells transfected with an empty pGl 4.10® vector,
were included as means of control.
Dual Glo™ luciferase assay
The Dual Glo™ luciferase assay system (Promega) is
designed for the functional analysis of promoter or 3′UTR regions.
Regulation deriving from transcription factors as well as from
posttranscriptional modifications by micro-RNAs can be detected. It
is based on dual transfection with two luciferase-active vectors,
one containing the corresponding construct and one untransfected
vector for the purpose of transfection normalization. The reagents
Dual Glo® and Stop&Glo® (Promega) are
added sequentially to measure the activity of luc2 and
hRluc.
Luciferase activity was measured 24 h after
transfection using a 96-well luminometer (Berthold Technologies
GmbH & Co. KG, Bad Wildbad, Germany). Measurement periods were
1 sec for luc2 activity and 5 sec for hRluc activity.
The background activity was subtracted prior to evaluation. Firefly
luciferase activity was normalized for Renilla luciferase
activity as recommended by the manufacturer (Promega).
The assessment was performed in duplicate for each
construct and control. In total, six runs were carried out.
Statistical analysis
Deviations from the Hardy-Weinberg equilibrium (HWE)
were tested for using Pearson’s χ2 test. Haplotype
analysis was conducted with Haploview 4.0® for Windows
(Broad Institute, Cambridge, MA, USA) as previously described
(15). Genotype frequencies of
patients and controls were compared using the χ2 test.
Kaplan-Meier analysis was applied to examine the prognostic
importance of the genotypes on overall survival and
progression-free survival. Progression-free survival was calculated
from the time of initial diagnosis to the time of diagnosed
progressive disease. Overall survival was calculated from the date
of first diagnosis to the date of death. Comparison of clinical and
laboratory parameters between patient subgroups was performed using
the Kruskal-Wallis and the Mann-Whitney U test for continuous
variables and the χ2 test for categorical data. The
log-rank test was used to compare the survival distributions of
subgroups. Differences were regarded as statistically significant
when P<0.05. Statistical analyses were performed using SPSS 15.0
for Windows (SPSS, Inc., Chicago, IL, USA).
Results
Detection of polymorphisms
Sequencing the region -3807 to -2828 bp upstream of
ATG in 10 healthy blood donors identified three SNPs consisting of
the base exchanges -3600T>C, -3363A>G and -2984C>T.
While -2984C>T (rs6762753) and -3600T>C
(rs73040343) were already accessible in available reference
sequences, -3363A>G is a novel polymorphism which was analyzed
for the first time in this study.
Distribution of genotypes and haplotypes
in patients and controls
Genotyping patients and healthy controls revealed
that the distribution of genotypes was compatible with the HWE for
patients as well as for controls. Genotype analysis using the
χ2 test and haplotype analysis did not reveal
significant differences between patients and controls, suggesting
that no genotype or haplotype is associated with an increased risk
of breast cancer. Table I
summarizes the genotyping results, including minor allele
frequencies.
 | Table IHaplotype and genotype distribution in
patients and controls. |
Table I
Haplotype and genotype distribution in
patients and controls.
| A, Genotypes |
|---|
|
|---|
| Genotype | Controls, n=121 | Patients, n=241 | P-value |
|---|
| -3600T>C | | | 0.813 |
| TT | 48 | 88 | |
| TC | 57 | 117 | |
| CC | 16 | 36 | |
| C frequency | 0.37 | 0.39 | |
| -3363A>G | | | 0.187 |
| AA | 63 | 133 | |
| AG | 51 | 83 | |
| GG | 7 | 25 | |
| G frequency | 0.27 | 0.28 | |
| -2984C>T | | | 0.849 |
| CC | 80 | 165 | |
| CT | 38 | 69 | |
| TT | 3 | 7 | |
| T frequency | 0.18 | 0.17 | |
|
| B, Haplotype
frequency in cohort |
|
| Haplotype | Controls | Patients | P-value |
|
| -3600 T/-3363 A/-2984
C | 0.409 | 0.359 | 0.272 |
| -3600 C/-3363
G/-2984 C | 0.227 | 0.199 | 0.470 |
| -3600 T/-3363
A/-2984 T | 0.182 | 0.195 | 0.117 |
| -3600 C/-3363
A/-2984 C | 0.141 | 0.166 | 0.668 |
| -3600 T/-3363
G/-2984 C | 0.042 | 0.076 | 0.157 |
Haplotype analysis revealed linkage disequilibrium
between the polymorphisms, as described in Table II.
| Table IILinkage of SATB1 polymorphisms
in healthy controls. |
Table II
Linkage of SATB1 polymorphisms
in healthy controls.
| -3363A>G | -2984C>T |
|---|
| -3600T>C |
| D′ | 0.744 | 1.000 |
| r2 | 0.149 | 0.129 |
| -2984C>T |
| D′ | 1.000 | |
| r2 | 0.744 | |
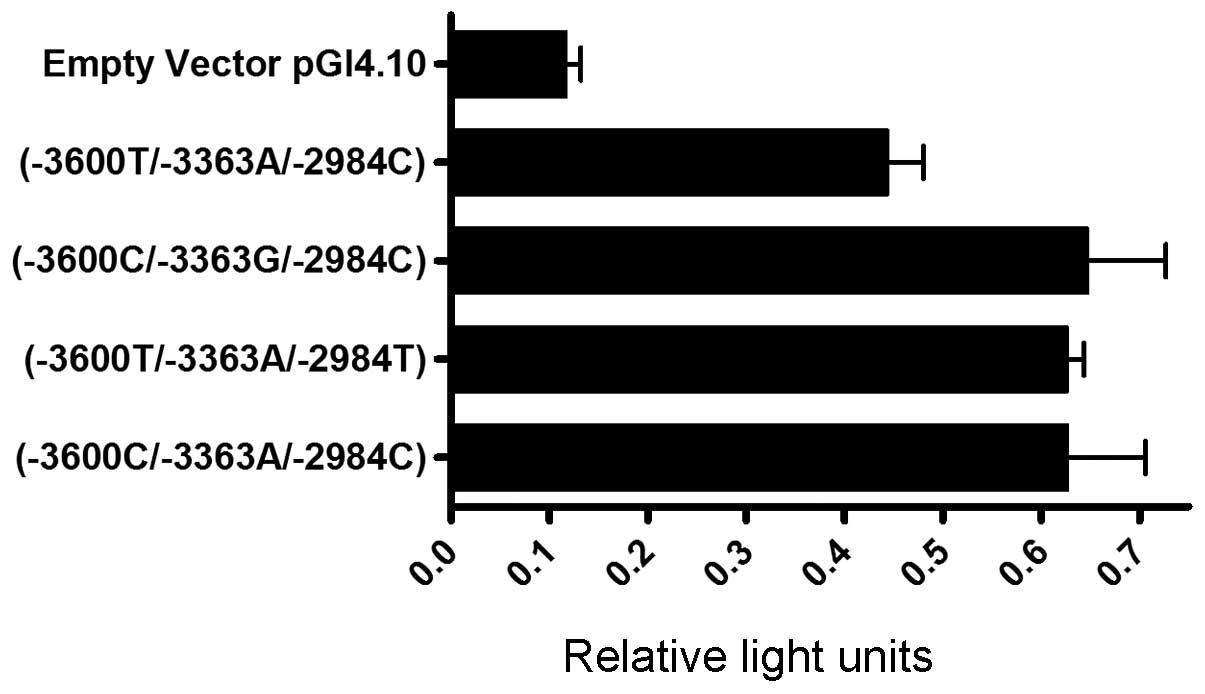
Functional assessment of haplotypes
Analysis of luciferase activity revealed promoter
activity for all haplotypes compared with the empty vector. The
SATB1 -3600T/-3363A/-2984C haplotype exhibited lower
promoter activity than all other constructs (Fig. 1). Comparing the haplotypes, the
observed differences in promoter activity were statistically
significant (P=0.034) using the Kruskal-Wallis test for continuous
variables.
Association of genotypes and haplotypes
with clinical data
Demographic and clinical data of the analyzed breast
cancer patients are summarized in Table III. The median age of the patients
was 56 years (range, 27–82 years) and the median follow-up time was
93 months (range, 4–155 months).
| Table IIIClinical data and haplotype
distribution. |
Table III
Clinical data and haplotype
distribution.
| |
SATB1-3600T/-3363A/-2984C
haplotype | | |
|---|
| |
| | |
|---|
| All, n=241 | Homozygous,
n=30 | Heterozygous,
n=158 | Other haplotypes,
n=53 | P-value |
|---|
| Median age at first
diagnosis, years | 56.3 | 55.9 | 56.1 | 56.9 | 0.877 |
| Histopathological
tumor type | | | | | 0.532 |
| Ductal | 131 (54.4) | 16 (53.3) | 84 (53.2) | 31 (58.5) | |
| Lobular | 47 (19.5) | 3 (10.0) | 32 (20.3) | 12 (22.6) | |
| Mixed
lobular/ductal | 38 (15.8) | 6 (20.0) | 27 (17.1) | 5 (9.4) | |
| Other | 25 (10.4) | 5 (16.7) | 15 (9.5) | 5 (9.4) | |
| Median tumor size,
mm | 24.9 | 19.0 | 26.3 | 24.5 | 0.073 |
| TNM status |
| T | | | | | 0.511 |
| pT1 | 118 (49.4) | 18 (60.0) | 73 (46.8) | 27 (50.9) | |
| pT2 | 94 (39.3) | 11 (36.7) | 61 (39.1) | 22 (41.5) | |
| pT3 | 15 (6.3) | 0 | 12 (7.7) | 3 (5.7) | |
| pT4 | 12 (5.0) | 1 (3.3) | 10 (6.4) | 1 (1.9) | |
| N | | | | | 0.049 |
| pN0 | 127 (52.7) | 21 (70.0) | 75 (47.5) | 31 (58.5) | |
| pN+ | 114 (47.3) | 9 (30.0) | 83 (52.5) | 22 (41.5) | |
| M | | | | | 0.668 |
| pM0 | 236 (97.9) | 30 (100) | 154 (97.5) | 52 (98.1) | |
| pM1 | 5 (2.1) | 0 | 4 (2.5) | 1 (1.9) | |
| Grading | | | | | 0.216 |
| 1 | 87 (37.3) | 15 (51.7) | 54 (35.3) | 18 (35.3) | |
| 2 | 93 (39.9) | 10 (34.5) | 66 (43.1) | 17 (33.3) | |
| 3 | 53 (22.7) | 4 (13.8) | 33 (21.6) | 16 (31.4) | |
| Estrogen receptor
status | | | | | 0.839 |
| Positive | 132 (66.3) | 14 (60.9) | 88 (67.2) | 15 (33.3) | |
| Negative | 67 (33.7) | 9 (39.1) | 43 (32.8) | 30 (66.7) | |
| Her2/neu
status | | | | | 0.493 |
|
Overexpression | 26 (13.3) | 3 (12.0) | 19 (15.3) | 4 (8.5) | |
| No
overexpression | 170 (86.7) | 22 (88.0) | 105 (84.7) | 43 (91.5) | |
| Treatment |
| Surgical | | | | | 0.201 |
|
Breast-conserving | 55 (22.8) | 4 (13.3) | 35 (22.2) | 16 (30.2) | |
| Mastectomy | 186 (77.2) | 26 (86.7) | 123 (77.8) | 37 (70.8) | |
| Adjuvant | | | | | 0.065 |
| No
medication | 126 (52.3) | 19 (63.3) | 74 (46.8) | 33 (62.3) | |
| Tamoxifen and/or
CMF | 115 (47.7) | 11 (36.7) | 84 (53.2) | 20 (37.7) | |
| Median follow-up
(months) | 93.2 | 108.5 | 91.3 | 90.5 | 0.214 |
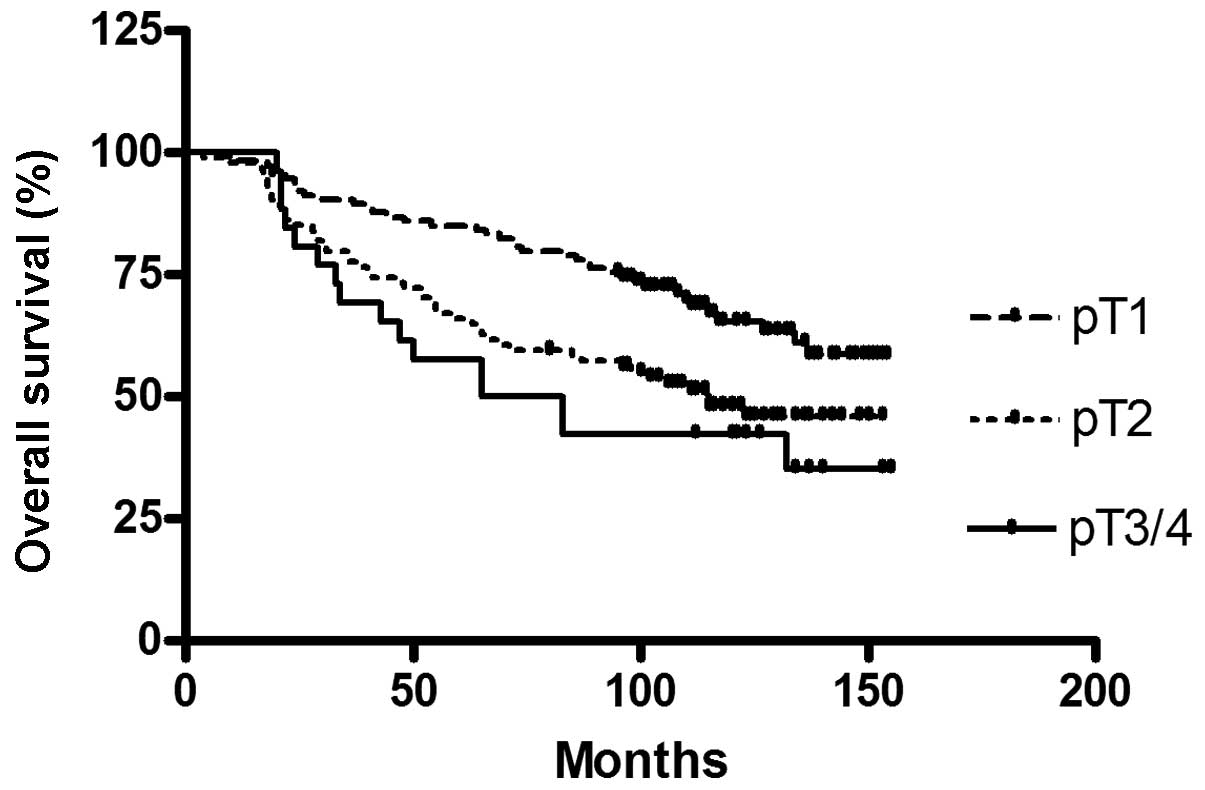
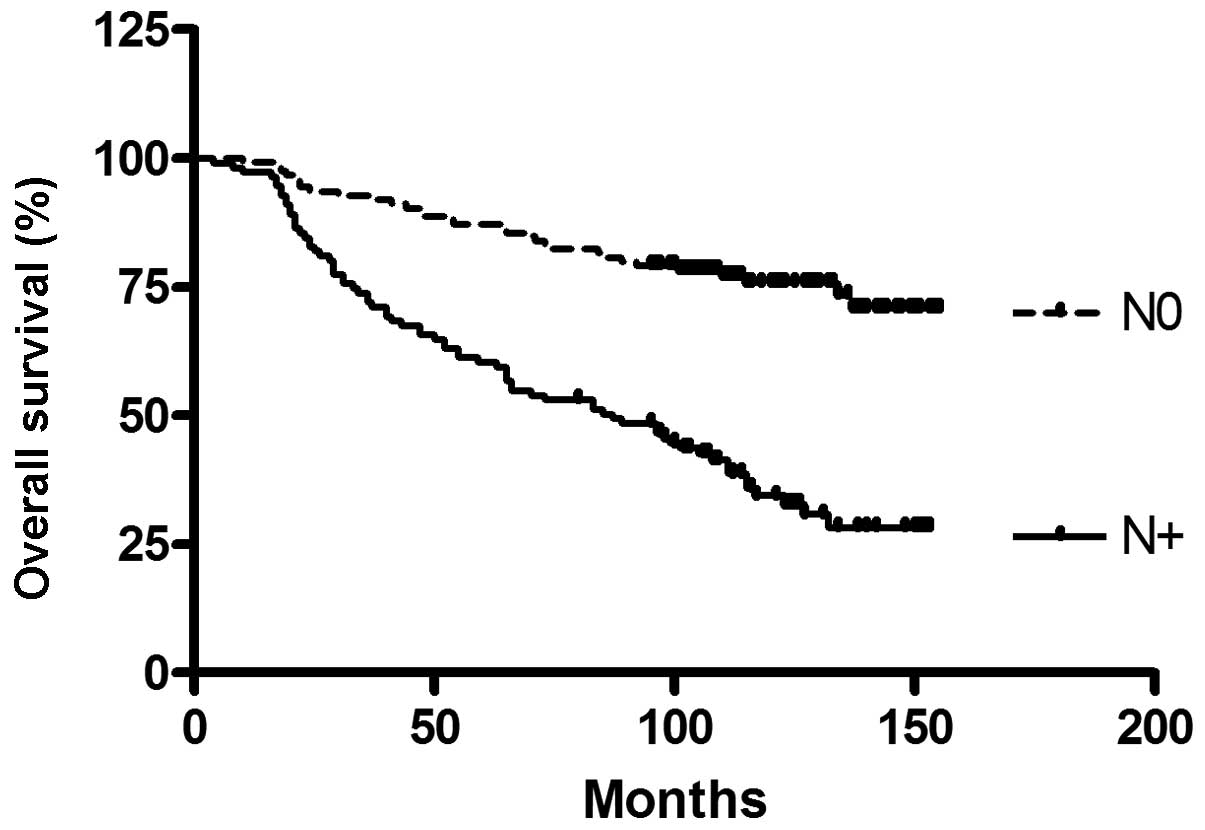
To confirm the established prognostic factors, of
the breast cancer patient cohort, a survival analysis for tumor
stage and nodal status, which are known to be predictive for
survival, was conducted (Figs. 2
and 3).
The genotypes were each tested for association with
clinical data, including age, tumor size, tumor stage, grading,
histopathological tumor type, estrogen receptor and Her2 status,
and overall survival. No significant associations regarding the
solitary SNP genotypes were noted (not shown).
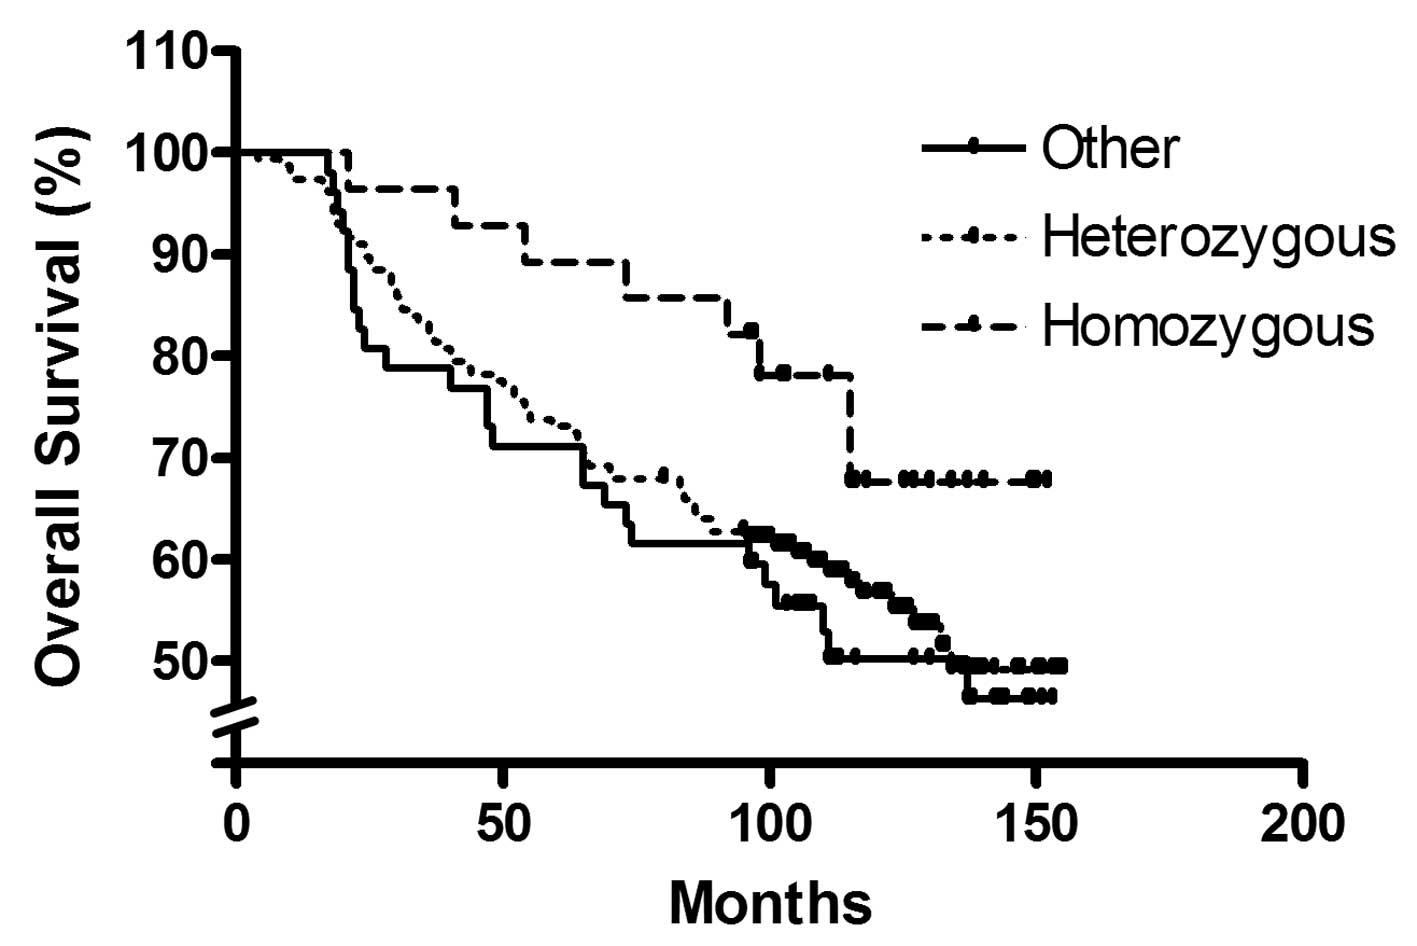
The functional haplotype assessment revealed
significantly reduced promoter activity in the -3600T/-3363A/-2984C
construct, and so further analyses were made to test associations
of the SATB1 -3600T/-3363A/-2984C haplotype with clinical
data. Significantly different distributions of nodal status were
identified between homozygous haplotype carriers, heterozygous
haplotype carriers and non-carriers (Table III).
Kaplan-Meier survival analysis revealed
significantly improved overall survival for homozygous SATB1
-3600T/-3363A/-2984C haplotype carriers compared with heterozygous
carriers or other haplotypes (P=0.033, corrected for nodal status;
Fig. 4).
Discussion
SATB1 has high prognostic relevance in breast cancer
patients. Therefore, it appeared probable that genetic variations
resulting in altered promoter activity may influence the course of
disease in these patients.
Several polymorphisms in the SATB1 promoter
region were identified, and the accordant haplotypes were found to
alter the promoter activity and overall survival rates of breast
cancer patients. Regarding the functional promoter assay, the
clinical results fit well into what is currently known about
SATB1. As the -3600T/-3363A/-2984C haplotype demonstrates
lower activity, it would therefore lead to a diminished
transcription rate. The association of this haplotype with improved
prognosis is thus what would be expected from these experimental
findings.
A significant correlation between the
-3600T/-3363A/-2984C haplotype and the nodal status of breast
cancer patients was identified, although this association was weak.
However, SATB1 may influence other prognostic parameters, as
previous authors have reported associations with tumor stage and
tumor grading (16).
Considering that the haplotype associated with
improved prognosis is also the most common one, it could be argued
that these findings are of minor interest compared with other
prognostic markers. However, the majority of patients had at least
heterozygous status, which in itself resulted in diminished overall
survival. The consequences for the affected patients are not yet
clear. However, we are currently in an era of molecular therapeutic
approaches, which may focus on SATB1 in the near future. If
there were attempts at therapeutic inhibition, patients who do not
carry the SNP may be the ones who would benefit the most from these
efforts.
One of the limitations of the present study is the
fact that that the promoter region of SATB1 has not yet been
functionally described. However, the experimental and clinical
findings of the study support the hypothesis that the analyzed
sequence is part of the promoter. Notably, the -3600T/-3363A/-2984C
haplotype is associated with nodal status. This association may be
explained, as the observed effect of the haplotype on promoter
activity may alter the risk of early lymphangio-invasion in the
primary tumor.
In future, SATB1 may be of interest in terms
of adjuvant, neoadjuvant or palliative chemotherapy. In
vitro analyses suggest that SATB1 may play a role in
mechanisms of multidrug resistance, as its depletion results in
enhanced drug sensitivity to cytostatic drugs (17).
SATB1 is a relatively new prognostic
parameter, and its significance in breast cancer is controversial
(9,18). However, previous data suggest a role
of SATB1 in the progression and metastasis of other tumor
types, including non-small-cell lung cancer, gastric cancer and
melanoma (19–21).
It is of interest whether the prognostic impact of
the described haplotype also applies for other tumor entities. In
breast cancer patients, the association with nodal status, as well
as significant impact upon overall survival, highlights the
clinical relevance of SATB1. Small molecules targeting
SATB1 may thus be a promising approach in treating breast
cancer patients.
Acknowledgements
The abstract was presented at the 2013 ASCO Annual
Meeting and published in J Clin Oncol 31 (Suppl; abstr 584):
2013.
References
|
1
|
Hortobagyi GN, de la Garza Salazar J,
Pritchard K, Amadori D, et al: The global breast cancer burden:
variations in epidemiology and survival. Clin Breast Cancer.
6:391–401. 2005. View Article : Google Scholar : PubMed/NCBI
|
|
2
|
Dowsett M and Dunbier AK: Emerging
biomarkers and new understanding of traditional markers in
personalized therapy for breast cancer. Clin Cancer Res.
14:8019–8026. 2008. View Article : Google Scholar : PubMed/NCBI
|
|
3
|
Alvarez JD, Yasui DH, Niida H, Joh T, Loh
DY and Kohwi-Shigematsu T: The MAR-binding protein SATB1
orchestrates temporal and spatial expression of multiple genes
during T-cell development. Genes Dev. 14:521–535. 2000.
|
|
4
|
Cai S, Han HJ and Kohwi-Shigematsu T:
Tissue-specific nuclear architecture and gene expression regulated
by SATB1. Nat Genet. 34:42–51. 2003. View Article : Google Scholar : PubMed/NCBI
|
|
5
|
Dickinson LA, Joh T, Kohwi Y and
Kohwi-Shigematsu T: A tissue-specific MAR/SAR DNA-binding protein
with unusual binding site recognition. Cell. 70:631–645. 1992.
View Article : Google Scholar : PubMed/NCBI
|
|
6
|
Yasui D, Miyano M, Cai S, Varga-Weisz P
and Kohwi-Shigematsu T: SATB1 targets chromatin remodelling
to regulate genes over long distances. Nature. 419:641–645. 2002.
View Article : Google Scholar
|
|
7
|
Nie H, Maika SD, Tucker PW and Gottlieb
PD: A role for SATB1, a nuclear matrix association
region-binding protein, in the development of CD8SP thymocytes and
peripheral T lymphocytes. J Immunol. 174:4745–4752. 2005.
|
|
8
|
Agrelo R, Souabni A, Novatchkova M,
Haslinger C, Leeb M, Komnenovic V, Kishimoto H, Gresh L,
Kohwi-Shigematsu T, Kenner L and Wutz A: SATB1 defines the
developmental context for gene silencing by Xist in lymphoma and
embryonic cells. Dev Cell. 16:507–516. 2009. View Article : Google Scholar
|
|
9
|
Medema RH and Burgering BM: The X factor:
skewing X inactivation towards cancer. Cell. 129:1253–1254. 2007.
View Article : Google Scholar : PubMed/NCBI
|
|
10
|
Han HJ, Russo J, Kohwi Y and
Kohwi-Shigematsu T: SATB1 reprogrammes gene expression to
promote breast tumour growth and metastasis. Nature. 452:187–193.
2008. View Article : Google Scholar
|
|
11
|
Gong F, Sun L, Wang Z, Shi J, Li W, Wang
S, Han X and Sun Y: The BCL2 gene is regulated by a special AT-rich
sequence binding protein 1- mediated long range chromosomal
interaction between the promoter and the distal element located
within the 3′-UTR. Nucleic Acids Res. 39:4640–4652. 2011.PubMed/NCBI
|
|
12
|
Yamayoshi A, Yashuhara M, Galande S,
Kobori A and Murakami A: Decoy-DNA against special AT-rich sequence
binding protein 1 inhibits the growth and invasive ability of human
breast cancer. Oligonucleotides. 21:115–121. 2011. View Article : Google Scholar : PubMed/NCBI
|
|
13
|
Sobin LH and Wittekind Ch: TNM
Classification of Malignant Tumours. 6th edition. Wiley-Liss; New
York, NY: pp. 131–142. 2002
|
|
14
|
Ellis I: SSS-GXBGTFEV. Pathology and
Genetics of Tumours of the Breast and Female Genital Organs.
Tavassoéli FA and Devilee P: 5th edition. IARC Press; Lyon: pp.
13–59. 2003
|
|
15
|
Barrett JC, Fry B, Maller J and Daly MJ:
Haploview: analysis and visualization of LD and haplotype maps.
Bioinformatics. 21:263–265. 2005. View Article : Google Scholar : PubMed/NCBI
|
|
16
|
Patani N, Jiang W, Mansel R, Newbold R and
Mokbel K: The mRNA expression of SATB1 and SATB2 in human
breast cancer. Cancer Cell Int. 9:182009.
|
|
17
|
Li QQ, Chen ZQ, Xu JD, Cao XX, Chen Q, Liu
XP and Xu ZD: Overexpression and involvement of special AT-rich
binding sequence protein 1 in multidrug resistance in human breast
carcinoma cells. Cancer Sci. 101:80–86. 2010. View Article : Google Scholar : PubMed/NCBI
|
|
18
|
Hanker LC, Karn T, Mavrova-Risteska L,
Ruckhäberle E, Gaetje R, Holtrich R, Kaufmann M, Rody A and
Wiegratz I: SATB1 gene expression and breast cancer
prognosis. Breast. 20:309–313. 2011. View Article : Google Scholar
|
|
19
|
Selinger CI, Cooper WA, Al-Sohaily S,
Mladenova DN, Pangon L, Kennedy CW, McCaughan BC, Stirzaker C and
Kohonen-Corish MR: Loss of special AT-rich binding protein 1
expression is a marker of poor survival in lung cancer. J Thorac
Oncol. 6:1179–1189. 2011. View Article : Google Scholar : PubMed/NCBI
|
|
20
|
Sun F, Lu X, Li H, Peng Z, Wu K, Wang G
and Tong Q: Special AT-rich sequence binding protein 1 regulates
the multidrug resistance and invasion of human gastric cancer
cells. Oncol Lett. 4:156–162. 2012.PubMed/NCBI
|
|
21
|
Chen H, Takahara M, Oba J, Xie L, Chiba T,
Takeuchi S, Tu Y, Nakahara T, Uchi H, Moroi Y and Furue M:
Clinicopathologic and prognostic significance of SATB1 in
cutaneous malignant melanoma. J Dermatol Sci. 64:39–44. 2011.
View Article : Google Scholar
|