Introduction
Oral cancer is the sixth most common cancer
worldwide, with a high prevalence in regions where individuals
habitually smoke cigarettes and consume alcohol (1). In addition, the five-year relative
survival rate of distant metastasis for oral cancer is ~30–40%
(2). In the USA, ~41,380
individuals are diagnosed with oral cancer annually and ~7,890
individuals succumbed to the disease in 2012 (3).
MicroRNAs (miRNAs) are a family of endogenous,
non-coding, 22–25 nt RNAs that regulate target mRNA. Accumulating
evidence indicates that miRNAs are involved in important biological
processes associated with apoptosis, proliferation,
differentiation, angiogenesis and metastasis. Therefore, the
deregulation of such processes may exhibit an effect on cancer
initiation, progression and treatment outcome (4,5).
It is hypothesized that miRNAs may serve as valuable
tools in cancer diagnosis. Previous studies using miRNA microarray
analysis have identified statistically unique profiles, which may
discriminate cancer samples from healthy control samples (6). Siow et al (7) used an miRNA microarray to identify the
differentially expressed miRNAs (DE-miRNAs) between oral squamous
cell carcinoma and non-cancer cells, and miR-31 and miR-375 were
found to significantly correlate with clinicopathological
parameters.
The aim of the present study was to identify the
miRNAs, which may be important in the progression of oral cancer
and to analyze their involvement in this process. An independent
sample t-test was used to analyze the raw data in order to obtain
credible data of the DE-miRNAs. In addition, an interaction network
was constructed using the Search Tools for the Retrieval of
Interacting Genes (STRING) database and Cytoscape software. The
results of the current study support the hypothesis that miRNA
expression is deregulated in oral cancer patients compared with
healthy individuals.
Materials and methods
Microarray analysis
The miRNA expression profile of GSE28100 [the Gene
Expression Omnibus (GEO) accession number] was downloaded from the
GEO database, which was collected by Jung et al (8). The expression data of miRNAs was
obtained using the GEO accession number, GSE28100, with the purpose
of identifying aberrantly expressed miRNAs in oral squamous cell
carcinomas. The expression profiles of miRNAs in 17 patients with
oral cancer and three healthy control subjects were available.
Identification of DE-miRNAs
The raw data were transformed into identifiable
expression data and the missing data was completed. Background
corrections and quartile data normalization were performed with the
robust multi-array average using the default parameters in the affy
package. In addition, the data were analyzed using BRB-ArrayTools
version 4.2 (National Cancer Institute; http://linus.nci.nih.gov/BRB-ArrayTools.html).
Predicting the target genes of
DE-miRNAs
The miRecords database (http://miRecords.umn.edu/miRecords), which is a
resource for animal miRNA-target interactions, was used to analyze
the target genes of the DE-miRNAs. miRecords integrates the
predicted targets of the following miRNA target prediction tools:
DIANA-microT (http://diana.csla-b.ece.ntua.gr/microT),
MicroInspector (http://bioinfo.uni-plovdiv.bg/microinspector), miRanda
(http://www.microrna.org/microrna/home.do), MirTarget2
(http://mirdb.org/miRDB), miTarget™ (http://cbit.snu.ac.kr/~miTarget), NBmiRTar
(http://wotan.wistar.upenn.edu/NBmiRTar/login.php),
PicTar (http://pictar.bio.nyu.edu), PITA
(http://genie.weizmann.ac.il/index.html), RNA22
(http:/cbcsrv.watson.ibm.com/rna22.html), RNAhybrid
(http://bibiserv.techfak.uni-bielefeld.de/rnahybrid)
and TargetScan (http://www.targetscan.org). The genes that were
predicted by at least five of the 10 databases were selected as
DE-miRNA targets for subsequent analysis to reduce the quantity of
false-positive results.
Network analysis and functional
annotation
The STRING database includes experimental and
predicted interaction information and STRING version 9.1 comprises
of >1,100 completely sequenced organisms (9). To identify the interactive
associations between the target genes and other genes, the target
genes of DE-miRNAs were input into STRING. The Cytoscape software
was used to visualize these associations and the mined modules.
The Database for Annotation, Visualization and
Integrated Discovery (DAVID) includes a broad selection of
functional annotation tools for understanding the biological
significance of numerous genes. In the current study, DAVID was
used to label the function of genes within the modules and the Gene
Ontology (GO) terms with an adjusted P-value of <0.05 and a
count >2 were selected.
Statistical analysis
An independent sample t-test was used to identify
the DE-miRNAs between the oral cancer patients and healthy control
subjects, and P<0.001 was considered to indicate a statistically
significant difference.
Results
Identification of DE-miRNAs
miRNA expression data was obtained using the
accession number, GSE28100, and included 17 patients with oral
cancers and three healthy control subjects. The miRNA expression
data was analyzed by BRB-ArrayTools and 15 miRNAs exhibited
significant differential expression (P<0.001; Table I).
 | Table IDifferentially expressed miRNAs
obtained using Gene Expression Omnibus accession number,
GSE28100. |
Table I
Differentially expressed miRNAs
obtained using Gene Expression Omnibus accession number,
GSE28100.
| n | miRNA | Fold change | P-value |
|---|
| 1 | hsa-miR-424 | 10.31 | 0.0000650 |
| 2 | hsa-miR-21 | 6.34 | 0.0002210 |
| 3 | hsa-miR-15b | 7.81 | 0.0006760 |
| 4 | hsa-miR-923 | 0.21 | 0.0001064 |
| 5 | hsa-miR-146b-5p | 5.54 | 0.0001082 |
| 6 | hsa-miR-331-3p | 2.92 | 0.0001400 |
| 7 | hsa-miR-15a | 3.58 | 0.0001929 |
| 8 | hsa-miR-26b | 5.99 | 0.0003248 |
| 9 | hsa-miR-455-3p | 5.18 | 0.0003526 |
| 10 | hsa-let-7f | 6.49 | 0.0003598 |
| 11 | hsa-miR-27a | 2.83 | 0.0005683 |
| 12 | hsa-miR-96 | 5.08 | 0.0006193 |
| 13 | hsa-miR-590-5p | 3.00 | 0.0007849 |
| 14 | hsa-miR-28-5p | 4.68 | 0.0008894 |
| 15 | hsa-let-7a | 4.16 | 0.0009845 |
Target gene prediction
Since miRNAs regulate the post-transcriptional
regression of target genes, the putative target genes of DE-miRNAs
were retrieved from miRecords, which selects the target genes that
have been retrieved by at least five databases. Furthermore, these
target genes were searched for using PubMed and a large list of
target genes were confirmed to be associated with oral cancer
(Table II). Among these genes,
hsa-miR-15a had the greatest number of target genes associated with
oral cancer.
| Table IITarget genes of differentially
expressed miRNA. |
Table II
Target genes of differentially
expressed miRNA.
| n | hsa-let-7a | hsa-let-7f | hsa-miR-15a | hsa-miR-15b | hsa-miR-21 | hsa-miR-26b | hsa-miR-27a | hsa-miR-28-5p | hsa-miR-96 | hsa-miR-146b-5p | hsa-miR-424 | hsa-miR-590-5p |
|---|
| 1 | ABCC5 | ABCC5 | ABCC5 | ABCC5 | SMAD7 | APC | BMI1 | HOXA1 | CAV1 | SMAD4 | ABCC5 | PLAG1 |
| 2 | ADRB2 | ADRB2 | ADRB2 | ADRB2 | CDC25A | ATM | CD28 | | HOXA5 | | ADRB2 | SOX2 |
| 3 | CASP3 | CASP3 | | BCL2 | PDCD4 | CDK6 | CD44 | | KRAS | | BDNF | STAT3 |
| 4 | CCR7 | CCR7 | BDNF | BDNF | PDCD4 | GSK3B | CYP1B1 | | MTMR3 | | CD28 | WWP1 |
| 5 | CDC25A | CDC25A | CCND1 | CCND1 | PLAG1 | HMGA2 | EGFR | | PAK1 | | CDC25A | |
| 6 | COL1A1 | COL1A1 | CD28 | CD28 | SOX2 | HOXA5 | HOXA10 | | RAC1 | | CYP26B1 | |
| 7 | ERCC6 | ERCC6 | CDC25A | CDC25A | STAT3 | HOXA9 | ING5 | | SMAD7 | | FGF2 | |
| 8 | FASLG | HMGA2 | CYP26B1 | CYP26B1 | STAT3 | MAP2 | KRAS | | ZIC2 | | FGFR1 | |
| 9 | HMGA2 | HOXA1 | FGF2 | FGF2 | STAT3 | PIM1 | MSI1 | | | | HOXA10 | |
| 10 | HOXA1 | HOXA9 | FGFR1 | FGFR1 | WWP1 | PTEN | PLAG1 | | | | MYB | |
| 11 | HOXA9 | IGF1R | HMGA2 | HOXA10 | | SENP5 | SFRP1 | | | | PLAG1 | |
| 12 | IGF1R | IGF2BP3 | HOXA10 | MYB | | SMAD4 | | | | | SMAD3 | |
| 13 | IGF2BP3 | IKBKE | IGF2R | PDCD4 | | | | | | | SMAD7 | |
| 14 | IKBKE | IL10 | MYB | PIM1 | | | | | | | TGFBR3 | |
| 15 | IL10 | SENP5 | PDCD4 | PLAG1 | | | | | | | WWP1 | |
| 16 | KRAS | | PIM1 | SMAD3 | | | | | | | | |
| 17 | PAK1 | | PLAG1 | SMAD7 | | | | | | | | |
| 18 | SENP5 | | SMAD3 | TGFBR3 | | | | | | | | |
| 19 | | | SMAD7 | WWP1 | | | | | | | | |
| 20 | | | TGFBR3 | | | | | | | | | |
| 21 | | | WWP1 | | | | | | | | | |
Interaction network construction and
module analysis
The target genes of 12 DE-miRNAs were input into the
STRING database, which identified the significant interactions with
a confidence score of >0.9. In addition, a protein-protein
interaction (PPI) network was constructed using Cytoscape software
(Fig. 1).
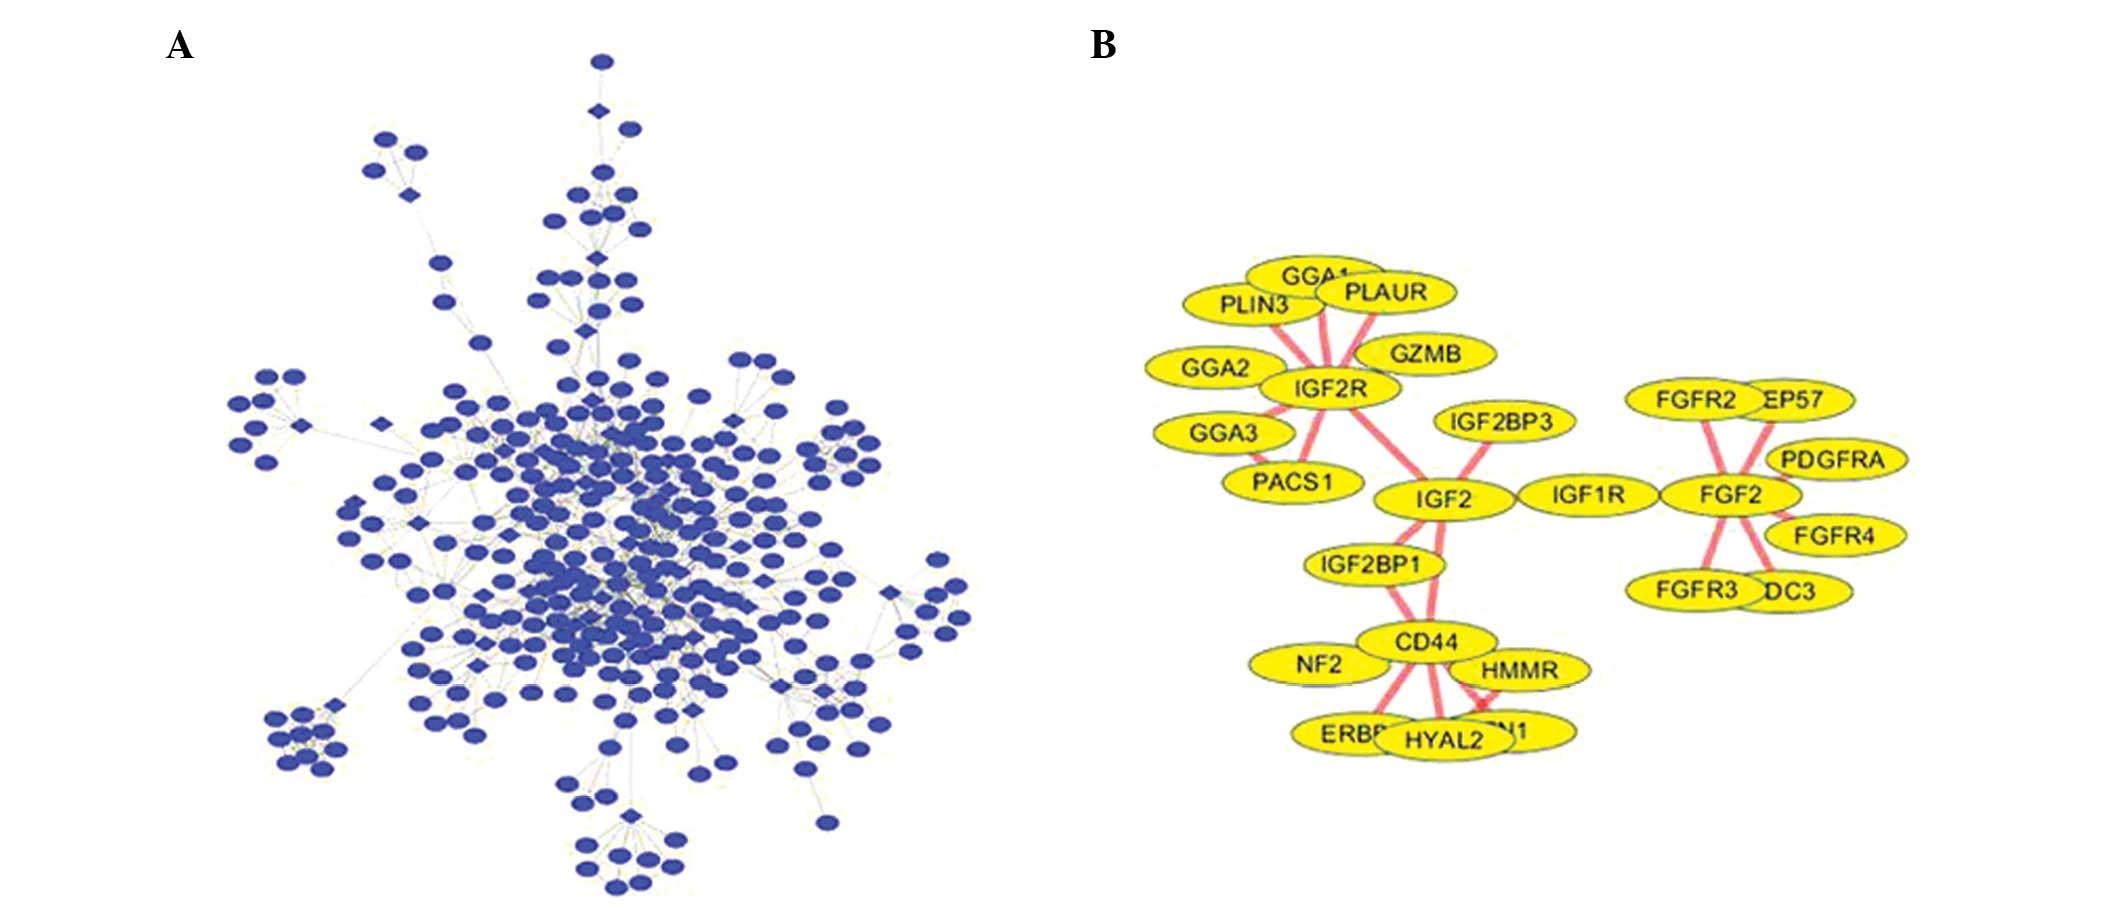 | Figure 1(A) PPI network construction. (B) The
module identified from the PPI network. PPI, protein-protein
interaction; PLAUR, plasminogen activator urokinase receptor; GGA,
golgi-associated, γ adaptin ear containing, ARF binding protein;
PLIN3, perilipin 3; IGF2R, insulin-like growth factor 2 receptor;
GZMB, granzyme B; PACS1, phosphofurin acidic cluster sorting
protein 1; IGF2BP, insulin-like growth factor 2 mRNA binding
protein; IGF2, insulin-like growth factor 2; NF2, neurofibromin 2;
HYAL2, hyaluronoglucosaminidase 2; HMMR, hyaluronan-mediated
motility receptor; IGF1R, insulin-like growth factor 1 receptor;
FGF2, fibroblast growth factor 2; FGFR, fibroblast growth factor
receptor; PDGFRA, platelet-derived growth factor receptor, α
polypeptide. |
The PPI network reveals the molecular mechanisms of
oral cancer, however, it contains numerous nodes and interactions,
which makes it difficult to select the useful information.
Therefore, the modules were mined in the PPI network to include
insulin-like growth factor (IGF)2-receptor (R), cluster of
differentiation 44, IGF2, IGF1-R and fibroblast growth factor
(FGF)2. Functional analysis demonstrated that the genes in this
module could be divided into 21 functional GO terms (the 10 most
significant terms are shown in Table
III). Among these functional nodes, the most significant GO
category was identified to be the FGF-R signaling pathway.
| Table IIIGene Ontology analysis of the 10 most
significant target genes (False discovery rate, P<0.05). |
Table III
Gene Ontology analysis of the 10 most
significant target genes (False discovery rate, P<0.05).
| n | Description | P-value | Genes in test
set |
|---|
| 1 | Fibroblast growth
factor receptor signaling pathway | 0.000004 | CEP5, FGF2, FGFR3
and FGFR4 |
| 2 | Transmembrane
receptor protein tyrosine kinase signaling pathway | 0.000087 | CEP57, FGF2, FGFR3,
FGFR4 and IGF1R |
| 3 | Enzyme-linked
receptor protein signaling pathway | 0.000440 | CEP57, FGF2, FGFR3,
FGFR4 and IGF1R |
| 4 | Phosphate metabolic
process | 0.003100 | FGFR2, FGF2, FGFR2,
FGF4, IGF1R, SDC3 |
| 5 | Phosphorus
metabolic process | 0.003100 | FGFR2, FGF2, FGFR2,
FGF4, IGF1R, SDC3 |
| 6 |
Phosphorylation | 0.009800 | FGF2, FGFR3, FGFR4,
IGF1R |
| 7 | Positive regulation
of cell proliferation | 0.009800 | FGF2, FGFR3, FGFR4,
IGF1R |
| 8 | Cell surface
receptor-linked signal transduction | 0.011000 | CEP57, IGF2BP3,
FGF2, FGFR3, FGFR4, IGF1R and PLAUR |
| 9 | Wound healing | 0.018000 | CD44, FGF2 and
FN1 |
| 10 | Response to
wounding | 0.019000 | CD44, IGF2BP3, FGF2
and FN1 |
The target genes of FGF2 were identified to be
associated with the GO categories of apoptosis, programmed cell
death, cell migration, cell death and cell motility.
Discussion
In the present study, 15 DE-miRNAs were identified
to exhibit a regulatory function in the progression of oral cancer.
As a result of retrieving the target genes of the DE-miRNAs from
miRecords, the target genes of 12 DE-miRNAs were found to be
associated with oral cancer. Through PPI network construction and
module analysis, an FGF2 module was formed and was identified to be
significant in the progression of oral cancer. Furthermore,
functional analysis showed that the module was significantly
associated with the FGF-R signaling pathway.
The expression of 12 DE-miRNAs, including
hsa-miR-15a, was identified as a possible biomarker to monitor oral
cancer progression and early diagnosis. In addition, hsa-miR-15a
was found to be downregulated in certain hematological tumors and
is considered to regulate cancer-associated genes that influence
apoptosis, the cell cycle, proliferation and survival (10,11).
In addition, hsa-miR-15a is frequently downregulated in chronic
lymphocytic leukemia, prostate cancer and non-small cell lung
cancer (12–14), and the inhibition of hsa-miR-15a
significantly increases the secreted matrix metalloproteinase-9
expression in neuroblastoma (15).
However, Ricieri et al (16)
identified that hsa-miR-15a expression levels were upregulated in
the majority of oral cancers samples. The results of the current
study using the accession number, GSE28100 revealed a 3.58-fold
change in hsa-miR-15a expression, compared with that of the healthy
control subjects, which indicated that hsa-miR-15a is involved in
the progression of oral cancer.
In addition, FGF2 formed a module in the PPI network
that was constructed based on oral cancer samples, which indicated
that FGF2 has an important function in the progression of oral
cancer. FGF2 is an 18-kDa non-glycosylated polypeptide consisting
of 146 amino acids (17), which
mediates various cellular events, including migration,
angiogenesis, motility, proliferation and differentiation (18,19).
In addition, FGF2 promotes tumor progression and
previous studies indicate that the upregulation of FGF2 is
important in prostate carcinogenesis and malignant progression
(20). FGF2 is one of the most
well-studied factors involved in angiogenesis (21). Lau et al (22) identified that the expression of FGF2
decreases E-cadherin levels by upregulating its transcriptional
repressors, Slug and ZEB1, in human ovarian cancer cells.
The FGF-R, a sub-family of the superfamily of
receptor tyrosine kinases, may regulate human development and
metabolism. Previous studies have shown that FGF-R may be important
in carcinogenesis (23,24). Furthermore, studies have indicated
that FGF-R1 is amplified in 20% of squamous non-small cell lung
cancers (25) and mutations of
FGF-R2 have been described in 12% of endometrial carcinomas
(26). Furthermore, ~10% of gastric
cancer cases exhibit FGF-R2 amplification and mutations (27).
In conclusion, the current study identified 15
DE-miRNAs, which may be important in the progression of oral cancer
and hsa-miR-15a demonstrated the greatest quantity of target genes.
In addition, FGF2 expression was identified to be significantly
associated with the presentation of oral cancer. However, further
investigation regarding the function of FGF2 is required.
References
|
1
|
Zygogianni AG, Kyrgias G, Karakitsos P, et
al: Oral squamous cell cancer: early detection and the role of
alcohol and smoking. Head Neck Oncol. 3:22011.
|
|
2
|
Zini A, Czerninski R and Sgan-Cohen HD:
Oral cancer over four decades: epidemiology, trends, histology, and
survival by anatomical sites. J Oral Pathol Med. 39:299–305.
2010.
|
|
3
|
Siegel R, Naishadham D and Jemal A: Cancer
statistics, 2013. CA Cancer J Clin. 63:11–30. 2013.
|
|
4
|
Mirnezami AH, Pickard K, Zhang L, Primrose
JN and Packham G: MicroRNAs: key players in carcinogenesis and
novel therapeutic targets. Eur J Surg Oncol. 35:339–347. 2009.
|
|
5
|
Ruan K, Fang X and Ouyang G: MicroRNAs:
novel regulators in the hallmarks of human cancer. Cancer Lett.
285:116–126. 2009.
|
|
6
|
Cicatiello L, Mutarelli M, Grober OM, et
al: Estrogen receptor alpha controls a gene network in luminal-like
breast cancer cells comprising multiple transcription factors and
microRNAs. Am J Pathol. 176:2113–2130. 2010.
|
|
7
|
Siow M, Karen Ng L, Vincent Chong V, et
al: Dysregulation of miR-31 and miR-375 expression is associated
with clinical outcomes in oral carcinoma. Oral Dis. Apr
17–2013.(Epub ahead of print). DOI: 10.1111/odi.12118
|
|
8
|
Jung HM, Phillips BL, Patel RS, et al:
Keratinization-associated miR-7 and miR-21 regulate tumor
suppressor reversion-inducing cysteine-rich protein with kazal
motifs (RECK) in oral cancer. J Biol Chem. 287:29261–29272.
2012.
|
|
9
|
Franceschini A, Szklarczyk D, Frankild S,
et al: STRING v9.1: protein-protein interaction networks, with
increased coverage and integration. Nucleic Acids Res.
41:D808–D815. 2013.
|
|
10
|
Cimmino A, Calin GA, Fabbri M, et al:
miR-15 and miR-16 induce apoptosis by targeting BCL2. Proc Natl
Acad Sci USA. 102:13944–13949. 2005.
|
|
11
|
Calin GA, Cimmino A, Fabbri M, et al:
MiR-15a and miR-16-1 cluster functions in human leukemia. Proc Natl
Acad Sci USA. 105:5166–5171. 2008.
|
|
12
|
Urbich C, Kuehbacher A and Dimmeler S:
Role of microRNAs in vascular diseases, inflammation, and
angiogenesis. Cardiovasc Res. 79:581–588. 2008.
|
|
13
|
Bonci D, Coppola V, Musumeci M, et al: The
miR-15a-miR-16-1 cluster controls prostate cancer by targeting
multiple oncogenic activities. Nat Med. 14:1271–1277. 2008.
|
|
14
|
Bandi N, Zbinden S, Gugger M, et al:
miR-15a and miR-16 are implicated in cell cycle regulation in a
Rb-dependent manner and are frequently deleted or down-regulated in
non-small cell lung cancer. Cancer Res. 69:5553–5559. 2009.
|
|
15
|
Xin C, Buhe B, Hongting L, et al:
MicroRNA-15a promotes neuroblastoma migration by targeting
reversion-inducing cysteine-rich protein with Kazal motifs (RECK)
and regulating matrix metalloproteinase-9 expression. FEBS J.
280:855–866. 2013.
|
|
16
|
Ricieri Brito JA, Gomes CC, Santos Pimenta
FJ, et al: Reduced expression of mir15a in the blood of patients
with oral squamous cell carcinoma is associated with tumor staging.
Exp Ther Med. 1:217–221. 2010.
|
|
17
|
Okada-Ban M, Thiery JP and Jouanneau J:
Fibroblast growth factor-2. Int J Biochem Cell Biol. 32:263–267.
2000.
|
|
18
|
Dow JK and deVere White RW: Fibroblast
growth factor 2: its structure and property, paracrine function,
tumor angiogenesis, and prostate-related mitogenic and oncogenic
functions. Urology. 55:800–806. 2000.
|
|
19
|
Chalkiadaki G, Nikitovic D, Berdiaki A, et
al: Fibroblast growth factor-2 modulates melanoma adhesion and
migration through a syndecan-4-dependent mechanism. Int J Biochem
Cell Biol. 41:1323–1331. 2009.
|
|
20
|
Giri D, Ropiquet F and Ittmann M:
Alterations in expression of basic fibroblast growth factor (FGF) 2
and its receptor FGFR-1 in human prostate cancer. Clin Cancer Res.
5:1063–1071. 1999.
|
|
21
|
Cross MJ and Claesson-Welsh L: FGF and
VEGF function in angiogenesis: signalling pathways, biological
responses and therapeutic inhibition. Trends Pharmacol Sci.
22:201–207. 2001.
|
|
22
|
Lau MT, So WK and Leung PC: Fibroblast
growth factor 2 induces E-cadherin down-regulation via
PI3K/Akt/mTOR and MAPK/ERK signaling in ovarian cancer cells. PLoS
One. 8:e590832013.
|
|
23
|
Kelleher FC, O’Sullivan H, Smyth E,
McDermott R and Viterbo A: Fibroblast growth factor receptors,
developmental corruption and malignant disease. Carcinogenesis.
34:2198–2205. 2013.
|
|
24
|
Liang G, Chen G, Wei X, Zhao Y and Li X:
Small molecule inhibition of fibroblast growth factor receptors in
cancer. Cytokine Growth Factor Rev. 24:467–475. 2013.
|
|
25
|
Weiss J, Sos ML, Seidel D, et al: Frequent
and focal FGFR1 amplification associates with therapeutically
tractable FGFR1 dependency in squamous cell lung cancer. Sci Transl
Med. 2:62ra932010.
|
|
26
|
Dutt A, Salvesen HB, Chen TH, et al:
Drug-sensitive FGFR2 mutations in endometrial carcinoma. Proc Natl
Acad Sci USA. 105:8713–8717. 2008.
|
|
27
|
Kunii K, Davis L, Gorenstein J, et al:
FGFR2-amplified gastric cancer cell lines require FGFR2 and Erbb3
signaling for growth and survival. Cancer Res. 68:2340–2348.
2008.
|


