Introduction
Liver cancer is one of the most frequently diagnosed
cancers worldwide, with figures for 2008 estimating 748,300 new
liver cancer cases and 695,900 cancer mortalities (1). Furthermore, 50% of these cases and
mortalities were estimated to have occurred in China.
Hepatocellular carcinoma (HCC) represents the major histological
subtype of primary liver cancer, accounting for between 70 and 85%
of the worldwide total liver cancer burden (1). The main curative treatment for HCC is
considered to be surgical resection, although a number of studies
have analyzed the efficacy and safety of a wide array of
locoregional therapies (2).
Transarterial chemoembolization (TACE) is one such therapy. The
technique prolongs patient survival by the arterial injection of
anticancer drugs and embolizing agents, resulting in the induction
of ischemic necrosis (2). The
assessment of the treatment efficacy is vital in determining
whether the chemoembolization has been a success and aids in
guiding future therapy. Since histological evaluation of each
nodule is not feasible or reasonable for patients, the daily
practice of monitoring treatment is restricted to the use of
radiological imaging to evaluate tumor viability and to reach a
conclusion (3). Multidetector
computed tomography (MDCT) and magnetic resonance imaging (MRI) are
widely used for treatment monitoring. In addition, computed
tomography (CT) is commonly used as the standard imaging technique
to evaluate the therapeutic response in patients with HCC following
TACE. The pattern and distribution of iodized oil in the tumor
observed on CT are useful for assessing the effects of TACE.
However, the widely used embolizing agent, lipiodol, has the
ability to generate considerable artifacts on CT and may therefore
change the diagnostic result (4).
MRI is more efficient than MDCT in the detection of viable residual
tumor elements following lipiodol-based TACE. In addition, with
regard to the decision making process following lipiodol-based TACE
protocols, the use of MRI is compulsory during the follow-up
(4).
Diffusion-weighted imaging (DWI) provides unique
information associated with tumor cellularity and cell membrane
integrity. Therefore, DWI may be sensitive to the changes that
occur in the tumor microenvironment following treatment (5), which can be evaluated quantitatively
for the calculation of the apparent diffusion coefficient (ADC). In
particular, the degree of tumor necrosis of large HCC following
TACE may be predicted by DWI, and patient management may be guided
by the results (6). The ADC value
may also be used to predict the survival of patients with HCC
following TACE (7).
The purpose of the current study was to investigate
the ability of DWI to evaluate treatment results with respect to
the extent of tumor necrosis and viable tumor tissue following
TACE, with a special focus on the feasibility of DWI for the
short-term follow-up of HCC following chemoembolization.
Materials and methods
Patient characteristics
This study was approved by the Shanghai Cancer
Center institutional review board (Shanghai, China) and written
informed consent was obtained from all patients. A total of 41
consecutive patients (34 males and seven females; age range, 23–78
years; median age, 56.2±12.5 years) with biopsy-proven HCC (mean
diameter, 6.1±2.4 cm; diameter range, 2.5–14.5 cm) were included in
this prospective study and treated according to TACE protocols. The
demographic, clinical and procedural data is shown in Table I. The follow-up examinations were
performed between six and eight weeks post-chemoembolization by
MDCT (or enhanced MRI) and diffusion-weighted (DW)-MRI on the same
day. Enhanced MRI was performed if the CT showed uncertainties
concerning the residual or recurrent metastatic lesions.
 | Table IDemographic, clinical and procedural
data. |
Table I
Demographic, clinical and procedural
data.
| Data | Value |
|---|
| Age, years |
| Mean ± SD | 56.2±12.5 |
| Range | 23–78 |
| Gender, n (%) |
| Male | 34 (83) |
| Female | 7 (17) |
| Child-Pugh class, n
(%) |
| A | 15 (37) |
| B | 26 (63) |
| C | 0 (0) |
| Morphology, n
(%) |
| Unifocal | 32 (78) |
| Multifocal | 9 (22) |
| Cirrhosis, n (%) |
| No | 5 (12) |
| Yes | 36 (88) |
| Tumor size, cm |
| Mean ± SD | 6.1±2.4 |
| Range | 2.5–14.5 |
| Tumor margins, n
(%) |
| Capsulated | 38 (73) |
| Infiltrative | 14 (27) |
Chemoembolization
Selective chemoembolization was performed with a
microcatheter positioned at the hepatic artery branches supplying
the tumors. The chemoembolic mixture contained cisplatin (150–300
mg Platinol; Bristol-Myers Squibb, Princeton, NJ, USA), epirubicin
(40–50 mg Pharmorubicin; Pharmacia & Upjohn, Milan, Italy),
mitomycin (6–10 mg mitomycin-C; Kyowa Hakko Kirin Co., Ltd., Tokyo,
Japan) and non-ionic contrast material (6–30 ml Ultravist;
Schering, Berlin, Germany) in iodized oil (Lipiodol Ultra Fluide;
Laboratoires Guerbet, Aulnay-sous-Bois, France). The dose
administered was dependent on the tumor size, hepatic function and
health status of the patient. Gelatin sponge particles saturated
with contrast medium [5–10 ml of 300 mg/ml iohexol (Omnipaque 300);
GE Healthcare, Shanghai, China] were injected into the tumor to
slow down blood flow to the tumor following the lipiodol injection.
The amount of particulate embolization also varied with underlying
factors, such as the presence of the main branch portal or hepatic
venous tumor invasion.
DW-MRI technique
All DW-MRI was performed on a 1.5-T system (GE Signa
HD scanner at 1.5 T; GE Healthcare, Amersham, UK) with an
eight-channel phased-array body coil. Axial DWI of the liver was
performed using the breath-hold single-shot spin-echo echo-planar
technique. In total, 18 sections were acquired during each 24 sec
breath-hold on inhalation. The image parameters for the DWI images
were as follows: Repetition time (TR)/echo time (TE), 1,500/51.6
msec; section thickness, 7 mm; slice gap, 1 mm; number of
acquisitions, 2; matrix size, 128×128; field of view, 38 cm; and
receiver bandwidth, 166.67 kHz. The diffusion weighting was applied
in all directions, with b=0 and 500 sec/mm2. The ADC
values were calculated by commercially available software and an
imaging workstation (both AW4.2; GE Healthcare).
Enhanced CT and MRI examination
CT evaluation was based on a triphasic (native,
arterial and portal venous phases) contrast-enhanced protocol using
a 64-row MDCT scanner (LightSpeed VCT, GE Healthcare) at 120 kV,
200 mAs, 0.625-mm collimation and 0.625 pitch in all 41 patients.
Arterial-phase scanning was initiated by a bolus trigger technique
using a 150 Hounsfield unit threshold, with the region of interest
(ROI) placed in the supraceliac abdominal aorta and an additional
start delay of 10 sec. The portal venous phase was initiated with a
total delay of 50 sec subsequent to achieving the trigger
threshold. Non-ionic contrast material (Ultravist 350; Schering) at
a dose 80–100 ml was injected via a power injector at a rate 3
ml/sec. Axial images were reconstructed with a 7-mm slice thickness
and at 0.5-mm intervals.
Enhanced MRI was performed on 10 patients due to the
CT showing uncertainties concerning the residual or recurrent
metastatic lesions. MRI was performed with a 1.5T scanner (GE
Healthcare), using a sequential acquisition of a 7-mm section
thickness. Pulse sequences included a non-enhanced breath-hold
T1-weighted gradient echo sequence (TR/TE, 120/1.5 msec; an 80°
flip angle; a 320×224 matrix; and a 1–2-mm intersection gap) and a
respiratory-triggered fat-saturated T2-weighted fast spin-echo
sequence (TR/TE, 4,000–6,000/102–108 msec; four acquired signals; a
384×224 matrix; and a 1–2 mm intersection gap). Contrast-enhanced
T1-weighted breath-hold gradient-echo images were acquired in the
transverse plane with and without fat saturation using the same
technical parameters described for the non-enhanced sequence. For
MRI, an intravenous contrast agent (gadodiamide; Omniscan; Nycomed
Amersham, Princeton, NJ, USA) was used during dynamic post-contrast
imaging.
Imaging and statistical analysis
The follow-up was performed between six and eight
weeks post-chemoembolization. In the follow-up study, responsive
lesions were defined as complete and partial response tumors
(>50% decrease in the product of the longest diameter and length
of the perpendicular diameter of the lesion, or >50% increased
necrosis), while non-responsive lesions were defined as stable and
progressive disease. Residual viable tumor tissue was considered to
be present on enhanced CT or MRI assessment if uptake of the
contrast agent was observed in the arterial phase of imaging. In
addition, the tumor necrosis response criteria were evaluated based
on the modified European Association for the Study of the Liver
(EASL) conference (8) by enhanced
CT or MRI, while the percentage of tumor necrosis was calculated
separately. Lipiodol deposits were defined as constant
high-attenuation artifacts in MDCT, without any density changes
during the three imaging phases (native, arterial and portal
venous) and were rated as tumor necrosis. Qualitative visual
assessment was performed blindly by two independent observers (with
nine and 30 years of experience, respectively). In the case of a
discrepancy in the assessment, the images were reviewed together by
the reporting radiologists and a consensus decision was
reached.
ADC maps were generated from the DWI, and values
were recorded by placing an ROI over the entire area of the treated
mass, as observed on the axial image with the maximum lesion size.
The ADC values in the viable and necrotic tumor tissue regions of
the treated mass were measured by drawing an ROI (≥50 pixels).
Correlation coefficients were also calculated to compare the
percentage of necrosis on contrast-enhanced CT or MRI and the ADC
values. The ADC values of the viable and necrotic tumor tissue
regions of the treated mass on the axial image with the maximum
lesion size were also recorded.
All statistical analyses were performed with SPSS
software (version 10.0; SPSS, Inc., Chicago, IL, USA). Due to
unequal variance between the two groups, the ADC values were
compared between the viable and necrotic tumor tissues using the
Mann-Whitney U test. Receiver operating characteristic analysis was
performed to determine a threshold to differentiate the necrotic
tumor tissues from the viable tumor tissues. Two-sided tests were
used and P<0.05 was considered to indicate a statistically
significant difference.
Results
Follow-up
Of the 52 target lesions evaluated quantitatively,
follow-up examinations were performed between six and eight weeks
post-chemoembolization; 36 treated masses were responsive to
chemoembolization, whereas 16 lesions were not.
Qualitative visual assessment following
treatment on DWI
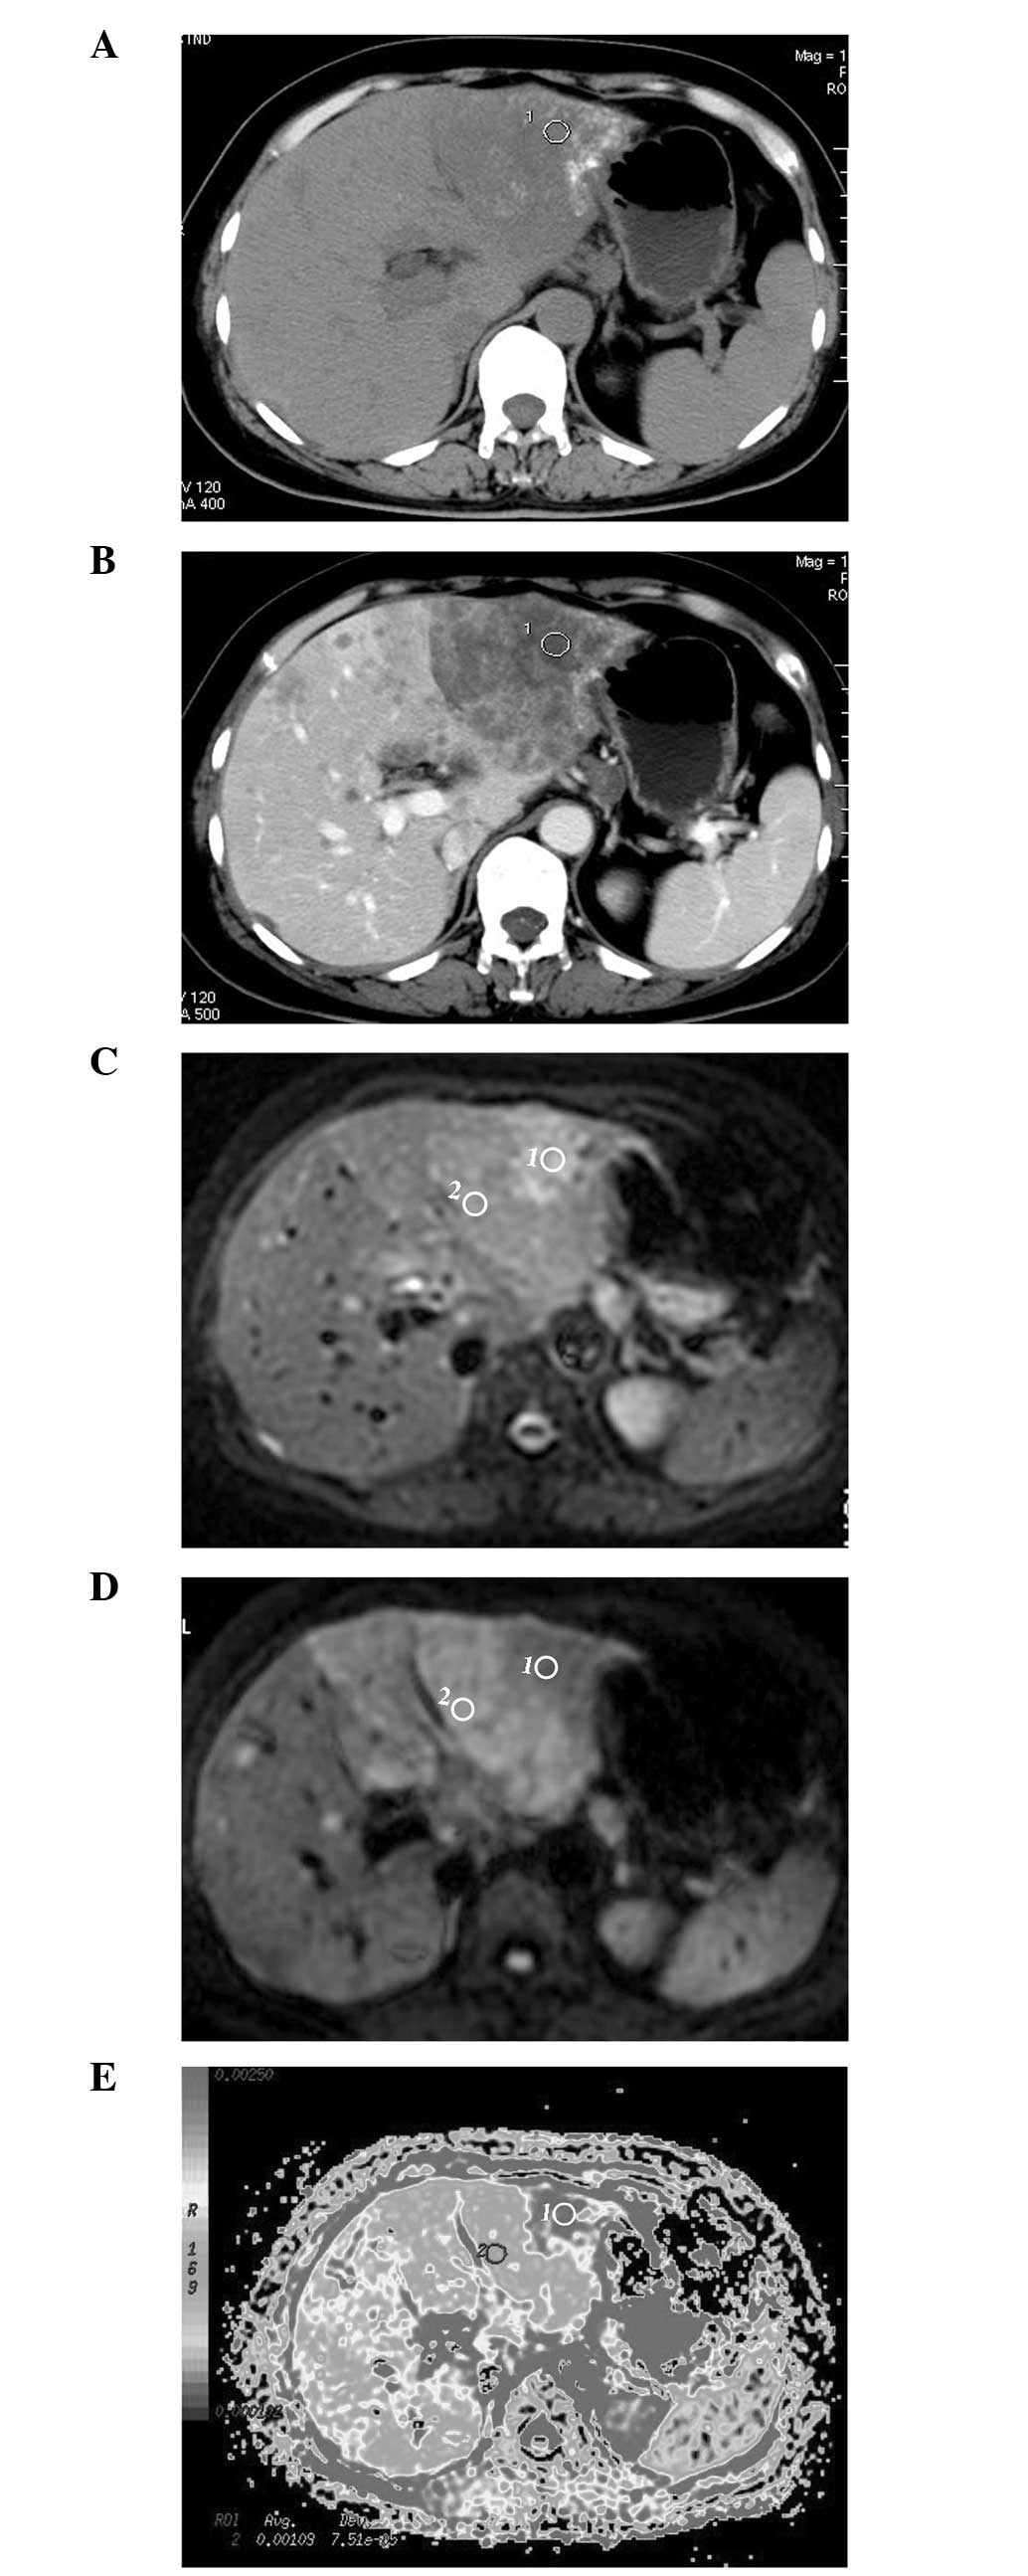
HCC following chemoembolization exhibits variable
signal intensities on DWI. Of the 52 treated lesions, six were
observed with homogeneous accumulation of the iodized oil on CT
images (type I) (9), without any
density changes during the three imaging phases or uptake of
contrast agent in the arterial phase of the contrast-enhanced
examination, which had a decreased uniform signal intensity on DWI
obtained with a b value of 500 sec/mm2. The other 46
lesions did not show homogeneous accumulation of the iodized oil. A
partial defect of the accumulation of the iodized oil (type II) was
observed in 28 lesions; faint accumulation (type III) was observed
in 10 lesions; and no or slight accumulation (type IV) was observed
in eight lesions. In the treated lesions, reduced or increased
enhancement (presumed viable) was observed, which demonstrated
restricted diffusion (high signal intensity) on the image obtained
with a b value of 500 sec/mm2, as well as lower ADC
values compared with the liver. By contrast, non-enhancing
(presumed necrotic) tumors showed higher signal intensities on
images obtained with a b value of 0 sec/mm2, and greater
signal attenuation on images obtained with a b value of 500
sec/mm2, with higher ADC values compared with the
enhancing tumor (presumed viable; Table II; Fig.
1).
| Table IICharacteristics of treated
hepatocellular carcinoma on DWI. |
Table II
Characteristics of treated
hepatocellular carcinoma on DWI.
| Tumor type | Enhanced CT or
MRI | DWI (b=500
sec/mm2) | ADC map |
|---|
| Viable tumor | Uptake of contrast
agent | Higher signal
intensity | Lower ADC |
| Necrotic tumor | No uptake of contrast
agent | Lower signal
intensity | Higher ADC |
| Iodized oil
accumulation tumor | No uptake of contrast
agent | Lower signal
intensity | Higher ADC |
ADC quantification for viable and
necrotic tumors
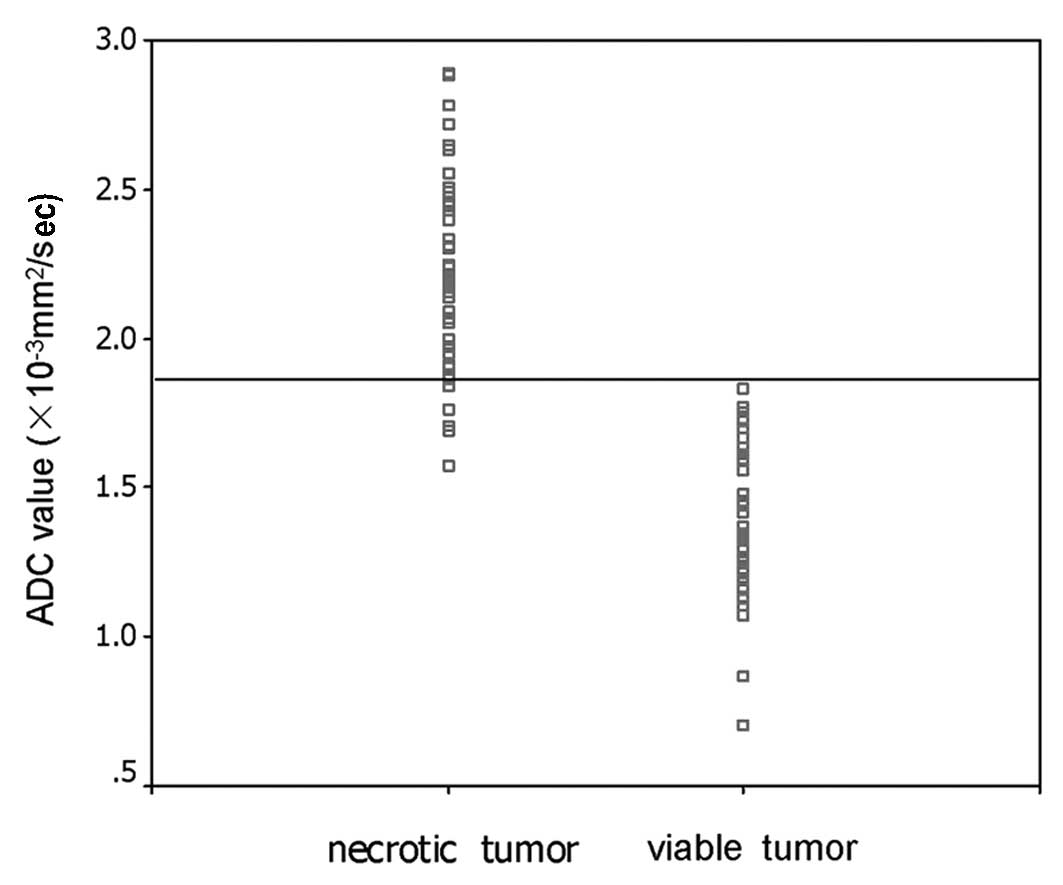
The mean ADC value of non-enhancing (presumed
necrotic) tumors was 2.22±0.31×10⁻³ mm2/sec
(range, 1.57–2.89×10⁻³ mm2/sec; median,
2.21×10⁻³ mm2/sec), which was greater than
that of the enhancing (presumed viable) tumors (mean,
1.42±0.25×10⁻³ mm2/sec; range,
0.71–1.83×10⁻³ mm2/sec; median,
1.37×10⁻³ mm2/sec) (Mann-Whitney U test,
P<0.001). The results from the receiver operating characteristic
analysis showed that the threshold ADC value was
1.84×10⁻³ mm2/sec, with 92.3% sensitivity and
100% specificity for identifying necrotic tumor tissues (area under
the curve, 0.985; P<0.001) (Fig.
2).
Correlation between tumor enhancement and
ADC values
The mean ADC value of the entire area of the treated
mass on the axial image with the maximum lesion size was
1.92±0.29×10⁻³ mm2/sec (range,
1.01–2.57×10⁻³ mm2/sec; median,
1.93×10⁻³ mm2/sec), while the mean extent of
tumor necrosis on contrast-enhanced CT or MRI was 62.6±0.181%
(range, 30–95%; median, 65%). A linear regression correlation was
identified between the ADC value of the entire area of the treated
mass and the extent of tumor necrosis (r=0.58; P<0.001).
Discussion
In the current study, a significant difference was
identified between the mean ADC values of the necrotic and vital
tumor tissues (Mann-Whitney U test, P<0.001). In addition, a
significant linear regression correlation was identified between
the ADC value of the entire area of the treated mass and the extent
of tumor necrosis on contrast-enhanced CT or MRI (r=0.58;
P<0.001). These results are consistent with previous studies
(6,10).
The assessment of the efficacy of HCC following
chemoembolization is essential for making therapeutic decisions,
such as whether to repeat, interrupt or completely terminate
chemoembolization. DW-MRI has the unique ability of being able to
provide information that reflects tissue cellularity and cellular
membrane integrity (11); this
makes it an attractive and useful technique, particularly in those
patients with severe renal dysfunction who are at risk from
nephrogenic systemic fibrosis (12). Previous studies analyzing the DW-MRI
of patients with breast cancer and colorectal patients with hepatic
metastases or HCC have shown quantitative DW-MRI findings
predictive of the response to chemotherapy (13,14). A
study by Kamel et al (15)
showed that maximum changes in tumor enhancement and ADC values
occur between one and two weeks post-therapy. However, the tumor
size remained unchanged for up to four weeks post-therapy. In the
present study, the preprocedural DWI findings and ADC values were
not analyzed. The focus was on the ability of DWI to evaluate
responsive and non-responsive tumors during the short-term
follow-up. The follow-up was performed between six and eight weeks
post-treatment to evaluate the response to treatment by the product
of the longest diameter and the length of the perpendicular
diameter of the lesion, or according to the modified EASL
conference (8) by enhanced CT or
MRI.
On DW-MRI, the observation of differential signal
attenuation between tissues is useful for the detection and
characterization of disease; restricted diffusion (high signal
intensity) on higher b value (≥500 sec/mm2) images and
lower ADC values are demonstrated by cellular tissues, such as
tumors or abscesses, whereas greater degrees of signal attenuation
on higher b value diffusion images and the return of higher ADC
values are shown by cystic or necrotic tissues (16). The visual assessment of DW-MRI,
which includes images at higher b values (≥500 sec/mm2),
may aid to distinguish the different components of HCC (viable and
necrotic components) following chemoembolization. As a general
observation, necrotic HCC tissues (liquefaction or coagulation
necrosis) secondary to chemoembolization typically show a lower
signal intensity on higher b value (500 sec/mm2) images
than viable tissues. However, on diffusion images, the signal
intensities observed are dependent on the water proton diffusion
and the T2-relaxation time of the tissue, which are possible
confounding factors (17). In the
current study, on visual inspection of the diffusion images alone,
the false-positive identification of necrotic tissue may result
from well-differentiated HCC. Therefore, viable and necrotic tumor
tissues may occasionally be difficult to characterize with the
visual assessment of the DW-MRI alone. As a result, diffusion
images must be interpreted concurrently with the ADC measurements
to prevent misinterpretation. The diagnostic performance of ADC
quantification for the viable and necrotic components of HCC
following chemoembolization are also reported in this study.
Following chemoembolization, the ADC values of the necrotic tumor
tissue were greater than those of the viable tumor tissue (median,
2.21×10⁻³ mm2/sec vs. 1.37×10⁻³
mm2/sec; Mann-Whitney U test, P<0.001). In viable
tumor tissues that are highly cellular, the tortuosity of the
extracellular space and the higher density of hydrophobic cellular
membranes restrict the apparent diffusion of water protons
(18). By contrast, in necrotic
tumor tissues, the apparent diffusion of water protons is increased
due to cell membrane disruption. Using receiver operating
characteristic curves, the current study determined that a mean ADC
value of 1.84×10⁻³ mm2/sec as the threshold
had 92.3% sensitivity and 100% specificity to distinguish the
necrotic regions from the viable regions in patients with HCC
following chemoembolization.
In this study, with enhanced CT or MRI confirmation
of the degree of HCC tumor necrosis following chemoembolization,
the ADC value of the treated mass was found to quantify tumor
necrosis secondary to treatment. A significant linear regression
correlation was also identified between the ADC value of the
treated mass and the percentage of tumor necrosis (r=0.58;
P<0.001). Kamel et al (6)
reported that DWI quantifies tumor necrosis following
chemoembolization to a greater degree than gadolinium-enhanced MRI.
In addition, the ADC values exhibited a higher correlation with the
degree of tumor necrosis at pathology (r=0.95; P<0.05) than on
gadolinium-enhanced MRI (r=0.55; P=0.12). However, Manelli et
al (10) showed that compared
with DWI, contrast-enhanced MRI with subtraction technique
exhibited a more significant correlation with the histopathological
findings in the evaluation of HCC necrosis following TACE. In
addition, Goshima et al (17) stated that DWI was not a reliable
predictor of local HCC recurrence following TACE when compared with
gadolinium-enhanced MRI. The present study did not evaluate the
correlation between ADC values and the degree of tumor necrosis at
pathology due to the lack of histopathological examination, which
is a limitation of the study.
A number of imaging sequences exist to examine the
liver, however, the breath-hold single-shot spin-echo echo-planar
technique was used in the present study. The imaging of the liver
using this technique is rapid and, dependent on liver size and
sequence parameters, it allows the evaluation of the whole liver
usually within one or two breath holds of 20–30 sec each. However,
a poorer signal-to-noise ratio (SNR), greater sensitivity to
distortion and ghosting artifacts, and lower spatial resolution are
disadvantages of the breath-hold imaging technique, along with the
limitation on the number of b value measurements.
Respiratory-triggered DW-MRI has also been shown to improve liver
detection in comparison with the breath-hold DW-MRI technique (93.7
vs. 84.3% sensitivity, respectively) (19), with improved image quality, SNR and
ADC quantification (20). Spin
dephasing occurs as a result of cardiac motion in the left lobe of
the liver, which results in the generation of artifacts,
particularly at high b values. Furthermore, the use of breath-hold
imaging results in artificially high ADC values over the left
hepatic lobe (21). Methods of
minimizing the occurrence of such artifacts include the use of
pulse (22) or cardiac triggering
(23) at image acquisition.
However, these advanced DW-MRI acquisition techniques were not used
in the present study.
Finally, in the process of the follow-up of HCC
patients following chemoembolization, the detection of novel tumor
nodules and extrahepatic tumor spread are also essential for making
therapeutic decisions. In the present study, the ability of DWI for
detecting novel HCC and extrahepatic tumor spread was not
evaluated. However, several studies have reported that the use of
DW-MRI generally results in improved liver lesion detection
(24,25).
In conclusion, DWI can quantify HCC tumor necrosis
following chemoembolization, and the ADC value may be useful to
determine necrotic and viable tumor tissues. Additionally, DW-MRI
shows improved liver lesion detection. Therefore, DWI may be an
option for the short-term follow-up of HCC patients following
chemoembolization and may guide patient management for reducing
radiation exposure of CT examination and the risk of contrast
material-induced nephropathy.
Acknowledgements
This study was supported by the Science Technology
Commission of Shanghai Municipality (grant nos. 0952nm03400,
11nm0504000 and 124119a0100) and the National Natural Science
Foundation of China (grant nos. 81301218 and 81301262).
References
|
1
|
Jemal A, Bray F, Center MM, et al: Global
cancer statistics. CA Cancer J Clin. 61:69–90. 2011.
|
|
2
|
Llovet JM, Real MI, Montaña X, et al:
Arterial embolization or chemoembolisation versus symptomatic
treatment in patients with unresectable hepatocellular carcinoma: a
randomized controlled trial. Lancet. 359:1734–1739. 2002.
|
|
3
|
Takayama T, Makuuchi M, Hirohashi S, et
al: Malignant transformation of adenomatous hyperplasia to
hepatocellular carcinoma. Lancet. 336:1150–1153. 1990.
|
|
4
|
Kloeckner R, Otto G, Biesterfeld S, et al:
MDCT versus MRI assessment of tumor response after transarterial
chemoembolization for the treatment of hepatocellular carcinoma.
Cardiovasc Intervent Radiol. 33:532–540. 2010.
|
|
5
|
Yuan Z, Ye XD, Dong S, et al: Role of
magnetic resonance diffusion-weighted imaging in evaluating
response after chemoembolization of hepatocellular carcinoma. Eur J
Radiol. 75:e9–e14. 2010.
|
|
6
|
Kamel IR, Bluemke DA, Ramsey D, et al:
Role of diffusion-weighted imaging in estimating tumor necrosis
after chemoembolization of hepatocellular carcinoma. AJR Am J
Roentgenol. 181:708–710. 2003.
|
|
7
|
Dong S, Ye XD, Yuan Z, Xu LC and Xiao XS:
Relationship of apparent diffusion coefficient to survival for
patients with unresectable primary hepatocellular carcinoma after
chemoembolization. Eur J Radiol. 81:472–477. 2012.
|
|
8
|
Bruix J, Sherman M, Llovet JM, et al:
Clinical management of hepatocellular carcinoma: conclusions of the
Barcelona 2000 EASL Conference. European Association for the Study
of the Liver. J Hepatol. 35:421–430. 2001.
|
|
9
|
Lim HS, Jeong YY, Kang HK, Kim JK and Park
JG: Imaging features of hepatocellular carcinoma after
transcatheter arterial chemoembolization and radiofrequency
ablation. AJR Am J Roentgenol. 187:W341–W349. 2006.
|
|
10
|
Mannelli L, Kim S, Hajdu CH, et al:
Assessment of tumor necrosis of hepatocellular carcinoma after
chemoembolization: diffusion-weighted and contrast-enhanced MRI
with histopathologic correlation of the explanted liver. AJR Am J
Roentgenol. 193:1044–1052. 2009.
|
|
11
|
Koh DM and Collins DJ: Diffusion-weighted
MRI in the body: applications and challenges in oncology. AJR Am J
Roentgenol. 188:1622–1635. 2007.
|
|
12
|
Sadowski EA, Bennett LK, Chan MR, et al:
Nephrogenic systemic fibrosis: risk factors and incidence
estimation. Radiology. 243:148–157. 2007.
|
|
13
|
Koh DM, Scurr E, Collins D, et al:
Predicting response of colorectal hepatic metastasis: value of
pretreatment apparent diffusion coefficients. AJR Am J Roentgenol.
188:1001–1008. 2007.
|
|
14
|
Theilmann RJ, Borders R, Trouard TP, et
al: Changes in water mobility measured by diffusion MRI predict
response of metastatic breast cancer to chemotherapy. Neoplasia.
6:831–837. 2004.
|
|
15
|
Kamel IR, Liapi E, Reyes DK, et al:
Unresectable hepatocellular carcinoma: serial early vascular and
cellular changes after transarterial chemoembolization as detected
with MR imaging. Radiology. 250:466–473. 2009.
|
|
16
|
Galea N, Cantisani V and Taouli B: Liver
lesion detection and characterization: role of diffusion-weighted
imaging. J Magn Reson Imaging. 37:1260–1276. 2013.
|
|
17
|
Goshima S, Kanematsu M, Kondo H, et al:
Evaluating local hepatocellular carcinoma recurrence
post-transcatheter arterial chemoembolization: is
diffusion-weighted MRI reliable as an indicator? J Magn Reson
Imaging. 27:834–839. 2008.
|
|
18
|
Szafer A, Zhong J, Anderson AW and Gore
JC: Diffusion-weighted imaging in tissues: theoretical models. NMR
Biomed. 8:289–296. 1995.
|
|
19
|
Parikh T, Drew SJ, Lee VS, et al: Focal
liver lesion detection and characterization with diffusion-weighted
MR imaging: comparison with standard breath-hold T2-weighted
imaging. Radiology. 246:812–822. 2008.
|
|
20
|
Taouli B, Sandberg A, Stemmer A, et al:
Diffusion-weighted imaging of the liver: comparison of navigator
triggered and breath-hold acquisitions. J Magn Reson Imaging.
30:561–568. 2009.
|
|
21
|
Nasu K, Kuroki Y, Nawano S, et al: Hepatic
metastases: diffusion-weighted sensitivity-encoding versus
SPIO-enhanced MR Imaging. Radiology. 239:122–130. 2006.
|
|
22
|
Murtz P, Flacke S, Traber F, et al:
Abdomen: diffusion-weighted MR imaging with pulse-triggered
single-shot sequences. Radiology. 224:258–264. 2002.
|
|
23
|
Koh DM, Takahara T, Imai Y and Collins DJ:
Practical aspects of assessing tumors using clinical
diffusion-weighted imaging in the body. Magn Reson Med Sci.
6:211–224. 2007.
|
|
24
|
Coenegrachts K, Delanote J, Ter Beek L, et
al: Improved focal liver lesion detection: comparison of
single-shot diffusion-weighted echoplanar and single-shot T2
weighted turbo spin echo techniques. Br J Radiol. 80:524–531.
2007.
|
|
25
|
Zech CJ, Herrmann KA, Dietrich O, et al:
Black-blood diffusion-weighted EPI acquisition of the liver with
parallel imaging: comparison with a standard T2-weighted sequence
for detection of focal liver lesions. Invest Radiol. 43:261–266.
2008.
|