Introduction
Ewing’s sarcoma is the second most common type of
solid bone and soft-tissue malignancy in children and young adults,
and has low cure rates, indicating the requirement to identify
further prognostic markers. It has been widely accepted that the
acquisition of genetic changes is essential in the development of
malignancies. Such alterations include irreversible changes in the
DNA sequence, including mutations, translocations, deletions and
amplifications, which result in gene activation or inactivation.
Epigenetic changes, which represent reversible modifications that
affect gene expression without altering the DNA sequence itself,
are also a hallmark of cancer (1).
The field of epigenetics describes information
transmission through the cell division of heritable changes in a
phenotype that does not involve DNA sequence changes and is
transferred by cell division. CpG island hypermethylation, histone
modification and transmitted chromatin structures are mechanisms
underlying epigenetic transmission, and among these, CpG island
hypermethylation is a key component for altered gene expression
associated with human cancer (2).
Although the causes are unclear, promoter CpG island
hypermethylation may be associated with aging and cancer
development (2). Promoter CpG
island hypermethylation is found in virtually all human cancer
tissue types and acts as an important mechanism for the
inactivation of tumor suppressor and tumor-related genes (3).
Aberrant DNA methylation has been recognized as an
early event in tumorigenesis (4,5) and
therefore, variations in the methylation patterns identified
between normal and tumor cells may aid in the detection of tumor
cells in biopsy specimens or tumor-derived DNA in body fluids
(6). The advent of high-throughput
microarray technology allows for the simultaneous evaluation of
genome-wide DNA methylation patterns and RNA expression levels in
tumor specimens, and also allows for the identification of
molecular targets or gene classifiers that are specific to tumor
cells (7).
The number of genes demonstrated to be inactivated
by promoter CpG island hypermethylation has abruptly increased with
the application of array-based genome-scale DNA methylation
analysis. The GoldenGate assay for methylation has successfully
analyzed the methylation profiles of 1,536 CpG sites from 371 genes
identified in cancer cell lines, lung cancer and normal tissues,
and has identified a panel of markers specific for adenocarcinoma
methylation (8,9). The assay has also been used to assess
the epigenetic specificity of the loss of IGF2 imprinting in
Wilms’ tumors and to identify the unique epigenetic signature of
human embryonic stem cells (10,11).
However, there is little information concerning similar broad-based
studies of Ewing’s sarcoma. The objective of the present
study was to analyze methylation patterns and to assess their
clinical significance in Ewing’s sarcomas.
Materials and methods
Ewing’s sarcoma samples and controls
This study was approved by the Institutional Review
Board of Kyung Hee University Hospital (Seoul, Korea). A total of
69 samples from patients with Ewing’s sarcomas were analyzed. The
disease was diagnosed based on the World Health Organization
criteria (12). Briefly, Ewing’s
sarcoma is a small round cell sarcoma, with diffuse membranous CD99
immunostaining, cytoplasmic periodic acid-Schiff staining and
EWSR1 gene translocation, as determined using Zytolight SPEC
ROS1 and RET Dual color break apart probes and
demonstrated with fluorescence in situ hybridization,
according to the manufacturer’s instructions (Zytovision,
Bremerhaven, Germany). The clinical features of the patients are
summarized in Table I. The age at
diagnosis ranged between one and 57 years, and 39 patients were
male and 30 were female. The primary sites were the long bones
(n=31) and the flat, small bones and spine (n=38). Metastasis at
diagnosis was present in five patients. The follow-up data were
only available for 37 patients and the follow-up durations ranged
between six and 240 months. As control samples, 14 tissue specimens
were used that were obtained from the cancellous bone during total
hip or knee joint replacement surgeries due to degenerative
osteoarthritis. These included the marrow components of the tibia
or femur.
 | Table IOverall methylation mean values of
Ewing’s sarcoma samples according to the clinical parameters. |
Table I
Overall methylation mean values of
Ewing’s sarcoma samples according to the clinical parameters.
| Parameter | Overall methylation
mean | P-value |
|---|
| Age, years | | 0.3659 |
| <20 (n=46) | 0.23±0.04 | |
| ≥20 (n=23) | 0.24±0.04 | |
| Gender | | 0.3304 |
| Male (n=39) | 0.24±0.04 | |
| Female (n=30) | 0.23±0.04 | |
| Location | | 0.0761 |
| Long bone
(n=31) | 0.23±0.04 | |
| Flat, small bone,
spine (n=38) | 0.24±0.04 | |
| Survival | | 0.0322a |
| Not alive
(n=18) | 0.25±0.03 | |
| Alive (n=19) | 0.22±0.05 | |
Preparation of DNA samples
DNA extraction was performed as described previously
(13). Genomic DNA was extracted
from the formalin-fixed, paraffin-embedded (FFPE) tissue sections
of each sample by a Magna Pure LC instrument (Roche Diagnostics
GmbH, Mannheim, Germany). Briefly, 10-μm paraffin sections were
mixed gently with 800 μl xylol and 400 μl absolute ethyl alcohol by
inverting the tube several times. The supernatant was discarded
following brief centrifugation at 12,000 × g for 10 mins, and the
pellet was washed with 1 ml absolute ethyl alcohol. The pellet was
dried for 10 min at 55°C following removal of the supernatant. The
tissue pellet was vortexed with 80 μl of a tissue lysis buffer
(Roche diagnostics GmbH) and 20 μl proteinase K, followed by
overnight incubation at 55°C. The digested samples were loaded into
the Magna Pure LC instrument. All DNA samples were stored at −70°C
prior to use. The DNA concentrations derived from the FFPE samples
were determined on a fluorophotometer (Victor3; Perkin-Elmer,
Waltham, MA, USA), using the PicoGreen nucleic acid quantification
kit (PicoGreen; Molecular Probes, Eugene, OR, USA), which allows
accurate and reproducible DNA quantification at low concentrations,
including DNA extracted from archival FFPE samples (14).
Bisulfite conversion and methylation chip
assay
Bisulfite conversions of all DNA samples were
performed using an EZ-96 DNA methylation kit (Zymo Research
Corporation, Orange, CA, USA) according to the manufacturer’s
instructions. In total, 500 ng of genomic DNA was used for each
bisulfite conversion. Following bisulfite treatment, the
quantification of the methylcytosine content was performed using
the Illumina GoldenGate Methylation Cancer Panel I microarray, as
described previously (3). The
GoldenGate Methylation Cancer Panel I product was used to process
1,505 CpG sites from a panel of 807 cancer-related genes, which
included oncogenes and genes associated with DNA repair, tumor
suppression, cell cycle, differentiation and apoptosis. Of these
1,505 CpG sites, 1,044 were located within CpG islands and 461 were
located outside CpG islands. Briefly, the bisulfite-converted DNA
was reacted with biotin and hybridized to assay oligos. Next,
specific extensions and ligations were performed at 45°C for 15
min. The ligated products were amplified by polymerase chain
reaction (PCR) and conditioned as follows: 10 min at 37°C; then 34
cycles of 35 sec at 95°C, 35 sec at 56°C, 2 min at 72°C; 10 min at
72°C; and cooling for 5 min at 4°C. Single-stranded PCR products
were prepared by denaturation and hybridized to a Sentrix Array
Matrix (GoldenGate Methylation Cancer Panel I). The array
hybridization was conducted overnight under a temperature gradient
program ranging from 45 to 60°C, and arrays were imaged using a
Bead Array Reader scanner (Illumina, San Diego, CA, USA). The raw
methylation ratios were calculated using the Illumina BeadStudio
Methylation Module (Illumina) following background normalization,
which was derived by averaging the signals of the built-in negative
control (15). Each sample was
examined in a duplicate manner in the chip assay.
Statistical analysis
Data were analyzed using SAS version 4 (SAS
Institute, Cary, NC, USA). The two-sample t-test and a one-way
analysis of variance were performed to estimate the methylation
profiles on clinical parameters and survival rate. P<0.05 was
considered to indicate a statistically significant difference.
Results
The DNA methylation status of 69 Ewing’s sarcoma
samples was examined using the Illumina GoldenGate Methylation
Cancer Panel I microarray. The GoldenGate DNA methylation assay
measures the DNA methylation levels of a given locus as β-values
ranging from 0 (no DNA methylation detected) to 1 (complete DNA
methylation). The methylation patterns of the Ewing’s sarcoma
samples were extremely heterogeneous with respect to total DNA
methylation. The criteria for differentially-methylated genes were
applied to detect the genes whose DNA methylation levels (β)
differed by at least 0.15 between the Ewing’s sarcoma and control
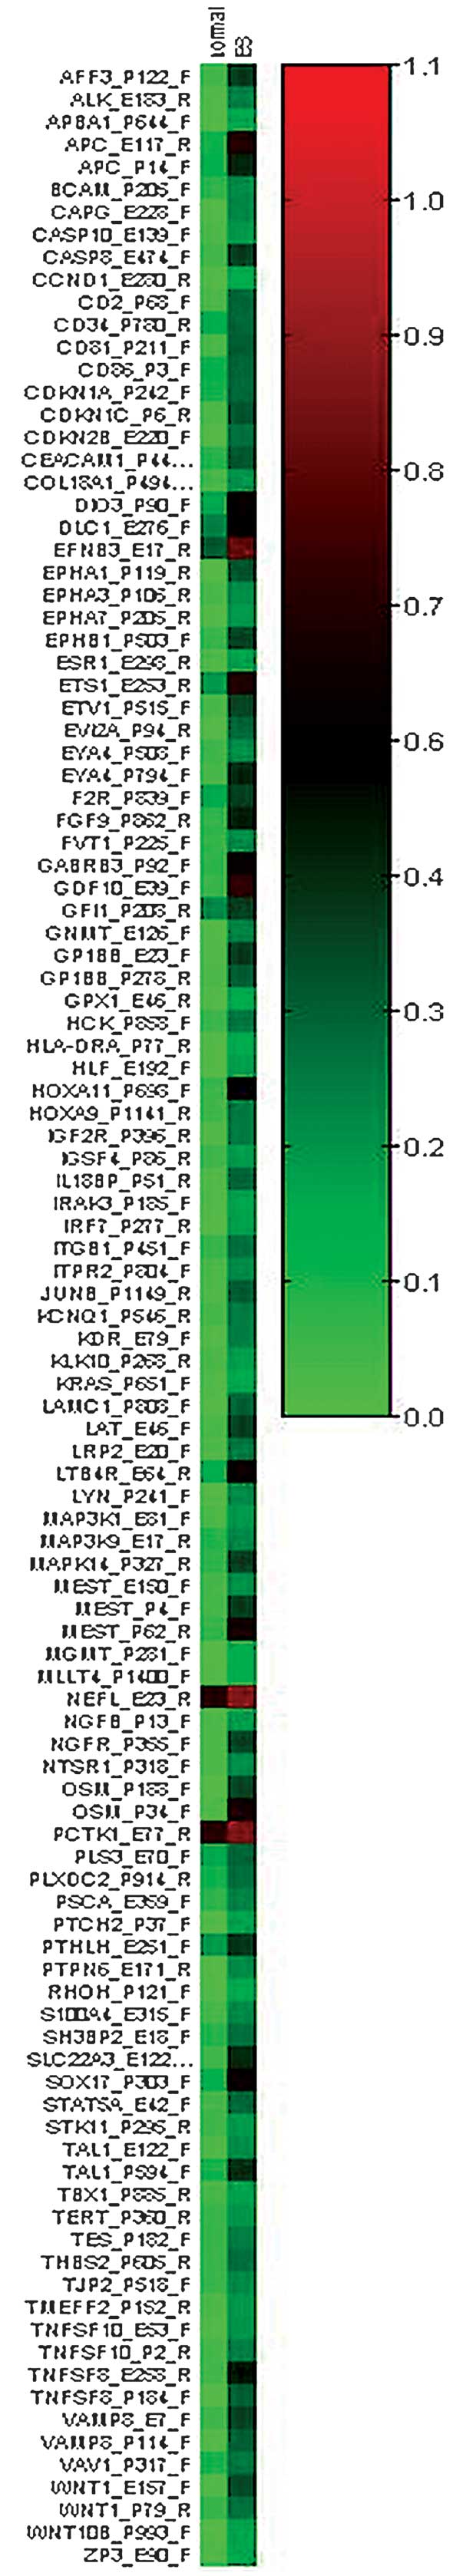
samples (8). Therefore, a list of
92 differentially-methylated genes was obtained from the Ewing’s
sarcoma samples. The 92 genes were classified into nine groups
based on their biological functions: i) Cell adhesion (n=10); ii)
cell cycles (n=4); iii) cell regulation (n=22); iv) development
(n=13); v) immune response (n=4); vi) metabolism (n=4); vii)
protein regulation (n=5); viii) signal transduction (n=25); and ix)
transcription regulation (n=5). A list of the methylated genes
identified in Ewing’s sarcoma is shown in Table II. Fig.
1 shows a heat map of the differentially-methylated CpGs in the
Ewing’s sarcoma samples.
| Table IIList of methylated genes in Ewing’s
sarcoma. |
Table II
List of methylated genes in Ewing’s
sarcoma.
| Function | Genes |
|---|
| Cell adhesion
(n=10) | APC, GP1BB, LAMC1,
CD2, THBS2, ITGB1, COL18A1, APBA1, CD34, BCAM |
| Cell cycle (n=4) | CDKN, KLK10, PCTK1,
KRAS |
| Cell regulation
(n=22) | OSM, TNFSF8, ETS1,
EFNB3, LTB4R, FGF9, NGFR, WNT1, CASP8, TAL1, MAPK14, DLC1, KDR,
CEACAM1, LYN, PTPN6, F2R, TNFSF10, PTHLH, CD86, CASP10, ESR1 |
| Development
(n=13) | GDF10, MEST, AFF3,
EPHB1, ALK, HOXA9, HLF, PLXDC2, PTCH2, WNT10B, PSCA, ZP3, TBX1 |
| Immune response
(n=4) | IL18BP, STAT5A, IRF7,
HLA-DRA |
| Metabolism (n=4) | EYA4, LRP2, FVT1,
GPX1 |
| Protein regulation
(n=5) | DIO3, VAMP8, GNMT,
CAPG, TJP2 |
| Signal transduction
(n=25) | GABRB3, SLC22A3, LAT,
EPHA1, GP1BB, EVI2A, CD81, IGF2R, KCNQ1, HCK, NTSR1, ITPR2, S100A4,
SH3BP2, EPHA7, EPHA3, TES, NEFL, TMEFF2, MAP3K1, VAV1, NGFB, IRAK3,
RHOH, STK11 |
| Transcription
regulation (n=5) | HOXA11, SOX17, ETV1,
JUNB, TERT |
The overall methylation mean of each tumor was
compared according to survival status. The overall methylation mean
was significantly higher in the patients who did not survive
(0.25±0.03) compared with the surviving patients (0.22±0.05)
(P=0.0322). However, no significant correlation was identified
between the overall methylation mean and the clinical parameters of
age, gender and tumor location (Table
I).
Using a highly stringent selection criteria (a β
difference of <0.5), four unique genes (GDF, OSM, APC and
HOXA11) were selected that were the most significantly
differentially-methylated genes in the Ewing’s sarcoma samples. The
methylation of these top four genes was confirmed to be common,
occurring in 82.5% (GDF), 65% (OSM), 87.5%
(APC) and 45% (HOXA11) of the Ewing’s sarcoma
samples. However, their methylation levels were not found to
significantly correlate with the survival rate (Table III).
| Table IIIMethylation profiles of four unique
genes in Ewing’s sarcoma samples according to survival rate. |
Table III
Methylation profiles of four unique
genes in Ewing’s sarcoma samples according to survival rate.
| Gene | Not alive (n=18) | Alive (n=19) | P-value |
|---|
| GDF10 | 0.53±0.34 | 0.52±0.35 | 0.4528 |
| OSM | 0.46±0.38 | 0.44±0.37 | 0.4475 |
| APC | 0.51±0.35 | 0.55±0.28 | 0.3305 |
| HOXA11 | 0.29±0.37 | 0.38±0.40 | 0.2336 |
Discussion
Ewing’s sarcoma is comprised of morphologically
heterogeneous tumors that are themselves characterized by
non-random chromosomal translocations of the EWS gene and
one of the members of the ETS family of transcription factors. The
(11;22)(q24;q12) translocation is the most frequently occurring,
and results in the formation of the EWS-FLI1 fusion protein. This
protein aids Ewing’s sarcoma pathogenesis by modulating target gene
expression (16). However, only a
few studies have analyzed gene methylation in Ewing’s
sarcoma. These studies have reported that the
hypermethylation of HIC1, MGMT, CDH1, p15 and p16 in
tumors, as well as the hypermethylation of CASPASE 8, occurs
only in Ewing’s sarcoma cell lines (6,17–19).
The number of genes that have been shown to be inactivated by
promoter CpG island hypermethylation has abruptly increased with
the application of array-based genome-scale DNA methylation
analysis. However, there is little information concerning similar
broad-based methylation studies on Ewing’s sarcoma. The main goal
of the present study was to provide a general overview of the
changes in DNA methylation associated with Ewing’s
sarcoma.
The GoldenGate Cancer Panel I used in this study
offers the ability to analyze 1,505 single CpG loci corresponding
to 807 genes in parallel. The reproducibility and accuracy of this
array-based approach have been extensively demonstrated (15,20).
Using the aforementioned criteria, 92
differentially-hypermethylated genes were identified in Ewing’s
sarcoma. These included numerous genes known to affect
tumorigenesis by affecting cell regulation, signal transduction and
differentiation. These results demonstrated that the GoldenGate
assay offers a high-throughput method to identify novel genes with
promoter DNA methylation.
Promoter CpG island hypermethylation can be used as
a tumor biomarker that is able to detect tumor cells in serum or to
predict clinical outcome. The simultaneous hypermethylation of
multiple CpG island loci, particularly the CpG island methylator
phenotype (CIMP), may be associated with survival rather than
individual gene hypermethylation. The widespread hypermethylation
of multiple promoter CpG island loci characterizes a subset of
malignancies, designated as CIMP (2). The clinicopathological features of
CIMP-positive Ewing’s sarcoma remain obscure, and marker panels for
diagnosing CIMP-positive Ewing’s sarcoma have not yet been
established.
The overall methylation mean of the tumor samples
was compared with survival rate, and the overall methylation mean
was significantly higher in the patients who did not survive
compared with those who did. A trend towards a more aggressive
behavior was identified in the methylated samples. However, no
significant correlation was identified between the overall
methylation mean and the clinical parameters of age, gender and
tumor location. Thus, four unique genes (GDF10, OSM,
APC, and HOXA11) were selected that were the most
significantly differentially methylated in the Ewing’s sarcoma
samples. The top four hypermethylated genes may function as
differential epigenetic biomarkers between Ewing’s sarcoma and
control samples. However, their methylation levels were not found
to significantly correlate with the survival rate.
Among these genes, GDF10 has been reported to
have a gender-dependent effect on glioblastoma progression and
survival (21). The location of the
OSM gene has been found to be distal to the translocation
breakpoint on chromosome 22 of Ewing’s sarcoma (22). Higher levels of OSM have also
been reported in metastasizing prostate cancer compared with
non-metastasizing prostate cancer and benign prostatic hyperplasia
(23). Furthermore, APC promoter
hypermethylation has been shown to be an early event in endometrial
tumorigenesis (24). HOX
genes are important members of the homeobox superfamily, encoding
transcription factors and contributing to oncogenesis through the
activation of anti-apoptotic pathways (25). Fiegl et al (26) revealed that HOXA11 gene DNA
methylation frequently occurs in ovarian cancer and that
consequently, HOXA11 methylation status is a prognostic marker.
Avigad et al (27) analyzed the aberrant methylation of
RASSF1A in Ewing’s sarcoma using methylation-specific PCR.
The study stated that Ewing’s sarcoma patients with methylated
RASSF1A showed poorer prognoses than those without. However,
contrasting results were identified in the current study. In
addition, Harada et al (28)
reported that there is no methylation of RASSF1A in Ewing’s
sarcoma. These discordant results may be due to differences
in the detection method or in the study population.
The results of the present study not only provide
novel insights into the biology of Ewing’s sarcoma, but also have
potential therapeutic implications. DNA methylation inhibitors,
such as decitabine and 5-azacitidine, are currently used in
clinical studies to treat myelodysplastic syndrome or acute myeloid
leukemia patients (29). If DNA
methylation inhibitors exert therapeutic effects on the
demethylation of hypermethylated genes, Ewing’s sarcoma with a
higher level of DNA hypermethylation may theoretically be a better
target for such drugs. Thus, DNA methylation profiling may be a
useful approach to monitoring the association between epigenetic
and clinical responses, and to stratify patients for treatment with
demethylating agents.
In conclusion, the current study identified the
hypermethylation of 92 genes in Ewing’s sarcoma and a trend toward
more aggressive behaviors in samples with methylation. The top four
hypermethylated genes can be used as differential epigenetic
biomarkers for Ewing’s sarcoma. However, further studies on their
clinical implications with a larger scale sample are required to
confirm these results.
Acknowledgements
The authors would like to thank Ye Won Bang and the
Clinical Research Coordinating Center for the statistical analysis
consultations.
References
|
1
|
Esteller M: Epigenetics in cancer. N Engl
J Med. 358:1148–1159. 2008.
|
|
2
|
Kang GH: CpG island hypermethylation in
gastric carcinoma and its premalignant lesions. Korean J Pathol.
46:1–9. 2012.
|
|
3
|
Esteller M, Com PG, Baylin SB and Herman
JG: A gene hypermethylation profile of human cancer. Cancer Res.
61:3225–3229. 2001.
|
|
4
|
Suzuki H, Watkins DN, Jair KW, et al:
Epigenetic inactivation of SFRP genes allows constitutive WNT
signaling in colorectal cancer. Nat Genet. 36:417–422. 2004.
|
|
5
|
Ushijima T: Detection and interpretation
of altered methylation patterns in cancer cells. Nat Rev Cancer.
5:223–231. 2005.
|
|
6
|
Tsuchiya T, Sekine K, Hinohara S, Namiki
T, Nobori T and Kaneko Y: Analysis of the p16INK4, p14ARF, p15,
TP53, and MDM2 genes and their prognostic implications in
osteosarcoma and Ewing sarcoma. Cancer Genet Cytogenet. 120:91–98.
2000.
|
|
7
|
Hoque MO, Kim MS, Ostrow KL, et al:
Genome-wide promoter analysis uncovers portions of the cancer
methylome. Cancer Res. 68:2661–2670. 2008.
|
|
8
|
Bibikova M, Lin Z, Zhou L, et al:
High-throughput DNA methylation profiling using universal bead
arrays. Genome Res. 16:383–393. 2006.
|
|
9
|
Lin Z, Thomas NJ, Bibikova M, et al: DNA
methylation markers of surfactant proteins in lung cancer. Int J
Oncol. 31:181–191. 2007.
|
|
10
|
Bibikova M, Chudin E, Wu B, et al: Human
embryonic stem cells have a unique epigenetic signature. Genome
Res. 16:1075–1083. 2006.
|
|
11
|
Bjornsson HT, Brown LJ, Fallin MD, et al:
Epigenetic specificity of loss of imprinting of the IGF2 gene in
Wilms tumors. J Natl Cancer Inst. 99:1270–1273. 2007.
|
|
12
|
de Alvia E, Lessnick SL and Sorensen PH:
Ewing sarcoma. WHO Classification of Tumors of Soft Tissue and
Bone. Fletcher CDM, Bridge JA, Hogendoorn PCW and Mertens F: IARC
Press; Lyon: pp. 305–310. 2013
|
|
13
|
Kim GY, Park JH, Kim YW, Jung WW, Unni KK
and Park YK: Absence of amplification of HER-2/neu (c-erbB-2) gene
in Ewing’s sarcoma: a real-time polymerase chain reaction method.
Pathol Res Pract. 200:663–667. 2004.
|
|
14
|
Farrand K, Jovanovic L, Delahunt B, et al:
Loss of heterozygosity studies revisited: prior quantification of
the amplifiable DNA content of archival samples improves efficiency
and reliability. J Mol Diagn. 4:150–158. 2002.
|
|
15
|
Bibikova M and Fan JB: GoldenGate assay
for DNA methylation profiling. Methods Mol Biol. 507:149–163.
2009.
|
|
16
|
Khoury JD: Ewing sarcoma family of tumors.
Adv Anat Pathol. 12:212–220. 2005.
|
|
17
|
Fulda S, Küfer MU, Meyer E, van Valen F,
Dockhorn-Dworniczak B and Debatin KM: Sensitization for death
receptor- or drug-induced apoptosis by re-expression of caspase-8
through demethylation or gene transfer. Oncogene. 20:5865–5877.
2001.
|
|
18
|
López-Guerrero JA, Pellín A, Noguera R,
Carda C and Llombart-Bosch A: Molecular analysis of the 9p21 locus
and p53 genes in Ewing family tumors. Lab Invest. 81:803–814.
2001.
|
|
19
|
Rathi A, Virmani AK, Harada K, et al:
Aberrant hypermethylation of the HIC1 promoter is a frequent event
in specific pediatric neoplasms. Clin Cancer Res. 9:3674–3678.
2003.
|
|
20
|
Martín-Subero JI, Kreuz M, Bibikova M, et
al; Molecular Mechanisms in Malignant Lymphomas Network Project of
the Deutsche Krebshilfe. New insights into the biology and origin
of mature aggressive B-cell lymphomas by combined epigenomic,
genomic, and transcriptional profiling. Blood. 113:2488–2497.
2009.
|
|
21
|
Serao NV, Delfino KR, Southey BR, Beever
JE and Rodriguez-Zas SL: Cell cycle and aging, morphogenesis, and
response to stimuli genes are individualized biomarkers of
glioblastoma progression and survival. BMC Med Genomics.
4:492011.
|
|
22
|
Giovannini M, Selleri L, Hermanson GG and
Evans GA: Localization of the human oncostatin M gene (OSM) to
chromosome 22q12, distal to the Ewing’s sarcoma breakpoint.
Cytogenet Cell Genet. 62:32–34. 1993.
|
|
23
|
Weiss TW, Simak R, Kaun C, et al:
Oncostatin M and IL-6 induce u-PA and VEGF in prostate cancer cells
and correlate in vivo. Anticancer Res. 31:3273–3278. 2011.
|
|
24
|
Ignatov A, Bischoff J, Ignatov T, et al:
APC promoter hypermethylation is an early event in endometrial
tumorigenesis. Cancer Sci. 101:321–327. 2010.
|
|
25
|
Shu Y, Wang B, Wang J, Wang JM and Zou SQ:
Identification of methylation profile of HOX genes in extrahepatic
cholangiocarcinoma. World J Gastroenterol. 17:3407–3419. 2011.
|
|
26
|
Fiegl H, Windbichler G, Mueller-Holzner E,
et al: HOXA11 DNA methylation - a novel prognostic biomarker in
ovarian cancer. Int J Cancer. 123:725–729. 2008.
|
|
27
|
Avigad S, Shukla S, Naumov I, et al:
Aberrant methylation and reduced expression of RASSF1A in Ewing
sarcoma. Pediatr Blood Cancer. 53:1023–1028. 2009.
|
|
28
|
Harada K, Toyooka S, Maitra A, et al:
Aberrant promoter hypermethylation and silencing of the RASSF1A
gene in pediatric tumors and cell lines. Oncogene. 21:4345–4349.
2002.
|
|
29
|
Garcia-Manero G: Demethylating agents in
myeloid malignancies. Curr Opin Oncol. 20:705–710. 2008.
|