Introduction
Colorectal cancer (CRC) is the second leading cause
of cancer-related mortality worldwide (1). In China, CRC accounted for 10.56 and
7.80% of the total cancer incidence and mortality, ranking third
and fifth, respectively. The incidence and mortality rate of CRC
has continued to increase steadily (2).
Fluorouracil (5-FU) has been the mainstay of
treatment for CRC for almost half a century (3). As an oral fluoropyrimidine,
capecitabine has been rationally designed to simulate infusional
5-FU (4). Various phase III trials
have demonstrated that capecitabine is at least equivalent to 5-FU
with respect to progression-free survival (PFS) and overall
survival in the first-line treatment of metastatic CRC (mCRC), and
exhibits a superior safety profile (5–7).
FOLFIRI, the combination of irinotecan plus
fluoropyrimidines, leucovorin (LV) and 5-FU, is a standard
second-line treatment option for advanced CRC (8–10).
XELIRI is a combination of irinotecan plus capecitabine; therefore,
XELIRI includes capecitabine in place of the 5-FU and LV used in
the FOLFIRI regimen. As a result, XELIRI may simplify the treatment
process and reduce the complications of the central venous catheter
that is required for treatment with 5-FU in the FOLFIRI regimen
(11–13). However, XELIRI is less commonly
used, and is not recognized as a standard chemotherapy regimen.
Furthermore, the clinical results available for the XELIRI regimen
are limited.
Randomized controlled trials comparing XELIRI with
FOLFIRI in the treatment of mCRC have revealed various results. In
the BICC-C study, a significantly shorter PFS was noted for the
XELIRI regimen, which was also associated with higher toxicity
(10). By contrast, in a randomized
prospective phase II trial, no significant differences were
observed between PFS and toxicity for the XELIRI and FOLFIRI
regimens (14). However, the
genetic background of patients has been neglected in the majority
of clinical trials and, therefore, it is possible that these
conflicting results are associated with genetic variations.
Any administered drug may have a therapeutic effect
in certain patients but be ineffective in others. Furthermore,
certain patients may suffer adverse effects, where others are
unaffected. Personalized medicine is tailored to provide an
individualized treatment and to predict the clinical outcome of a
variety of treatment regimens. The use of genetic information is
one of the core elements in personalized medicine.
The interindividual variability, efficacy and
toxicity of irinotecan, which is the common drug in the FOLFIRI and
XELIRI regimens, has been attributed predominantly to inherited
genetic variations in the UGT1A gene. UGT1A1,
UGT1A7 and UGT1A9 are three significant members of
the UGT1A subfamily; each isoform comprises a typical exon 1
and four identical downstream exons, and exon 1 is regulated by its
own promoter (15). In 2005, the US
Food and Drug Administration amended the direction of irinotecan,
by appending additional toxicity and dosing warnings relating to
the UGT1A1*28 allele (16).
Whilst the frequency of UGT1A1*28 is low in East Asian
populations, UGT1A1*6, which has only been identified in
Asian populations, has been associated with toxicity in patients
treated with irinotecan (17,18).
UGT1A7 and UGT1A9 genotypes have also been reported
to be predictors of response and toxicity in patients treated with
irinotecan-based regimens (19).
However, the toxicity and efficacy of irinotecan remains
unpredictable.
The aim of the current study was to compare the
efficacy, safety and survival rate of the XELIRI regimen to those
of the standard FOLFIRI regimen. The functional regions of
UGT1A1, UGT1A7 and UGT1A9 were sequenced and
comprehensively analyzed for genetic polymorphisms, to determine
the correlation between inherited genetic variations, and the
efficacy and safety of these irinotecan-based regimens.
Patients and methods
Patients
Between 2009 and 2013 at the Cancer Institute and
Hospital, Chinese Academy of Medical Sciences (Beijing, China), a
total of 84 consecutive patients with histologically confirmed mCRC
were included in the study. Each patient provided written informed
consent. All patients were treated with FOLFIRI or XELIRI. The
study was approved by the ethics committee of Beijing Chao-Yang
Sanhuan Cancer Hospital (Beijing, China).
Eligibility criteria
The following inclusion criteria were used in this
study: Age, >18 years; Eastern Cooperative Oncology Group (ECOG)
performance status (PS) of 0–2; adequate bone marrow, hepatic and
renal function (absolute neutrophil count, >1,500/μl; hemoglobin
levels, >9.0 g/dl; platelet count, >75,000/μl; total serum
bilirubin levels, <1.5-fold the upper normal limit (UNL);
alanine aminotransferase/aspartate aminotransferase ratio,
<2.5-fold the UNL; and serum creatinine levels, <1.6 mg/dl or
creatinine clearance, >40 ml/min).
Exclusion criteria
The exclusion criteria included the following:
Inadequately controlled hypertension; unstable angina pectoris; and
history of myocardial infarction, stroke or transient ischemic
attack, pulmonary embolism, or deep vein thrombosis within six
months prior to treatment.
Chemotherapy
The FOLFIRI or XELIRI regimen was administered until
progressive disease (PD), unacceptable toxicity, patient refusal or
a medical decision to discontinue treatment. The FOLFIRI regimen
consisted of 180 mg/m2 irinotecan intravenously (IV)
over 90 min, 400 mg/m2 LV IV over 2 h, and 400
mg/m2 5-FU IV bolus, followed by 2,400 mg/m2
5-FU IV over a 46-h infusion, all administered on day one, every
two weeks. The XELIRI regimen consisted of 120 mg/m2
irinotecan IV on days one and eight, and 800 mg/m2 oral
capecitabine twice per day on days one to 14, repeated every three
weeks.
Evaluation and statistical analysis
Baseline evaluations consisted of physical
examination, complete medical history, electrocardiography, ECOG
PS, a complete blood count, hepatic and renal function tests, and
assessment of serum carcinoembryonic antigen levels. All patients
received an abdominopelvic computed tomography (CT) or magnetic
resonance imaging (MRI) scan, and chest X-ray or CT/MRI of the
chest. During treatment, a follow-up CT/MRI of the abdomen and
pelvis, and chest X-ray or chest CT/MRI were performed every six
weeks. Assessments were performed every three courses until PD or
upon the discontinuation of chemotherapy. Tumor response
classification was based on the Response Evaluation Criteria in
Solid Tumors guidelines (20),
while toxicity was graded according to the National Cancer
Institute Common Toxicity Criteria, version 3.0 (21).
The primary efficacy endpoint was PFS, which was
defined as the time from initiation of treatment to the first
documentation of PD, or to the date of mortality or loss to
follow-up. The secondary efficacy endpoint included overall
response (complete + partial response) and toxicity.
For the comparison of the two chemotherapy regimens,
Fisher’s exact test and Student’s t-test were used. Kaplan-Meier
method was used for PFS analysis. The hazard ratio (HR) and 95%
confidence interval (CI) for the treatment comparisons were
obtained from a Cox proportional hazards model. All statistical
tests were two-sided, and P<0.05 was considered to indicate a
statistically significant difference between the two treatment
regimens. All results were analyzed using IBM SPSS 19.0 software
(IBM, Armonk, NY, USA).
Genotyping and genetic analysis
Blood samples were obtained from 22 mCRC patients
(10 placed into the FOLFIRI group and 12 into the XELIRI group) for
isolation of genomic DNA at least one week prior to commencing
chemotherapy. Genomic DNA was isolated from peripheral blood
samples using the QIAamp DNA blood mini kit (Qiagen, Valencia, CA,
USA). To screen the single nucleotide polymorphisms (SNPs) in
UGT1A1, UGT1A7 and UGT1A9, the gene regions
were sequenced, including its promoter and exon 1, using the
DYEnamic ET terminator cycle sequencing kit (GE Healthcare,
Chalfont St. Giles, UK) on the ABI Prism 3730xl DNA analyzer
(Applied Biosystems, Foster City, CA, USA). Following
pre-denaturation at 93°C for 3 min, amplification was performed
under the following conditions for 32 cycles: Denaturation at 95°C
for 30 sec; annealing at 58°C for 40 sec; and extension at 72°C for
2 min. The primer sequences used are shown in Table I.
 | Table IPrimer sequences. |
Table I
Primer sequences.
| Genes | Primer ID | Primer sequences |
|---|
| UGT1A1 | U1_E1AF |
TCGTCCTTCTTCCTCTCTGG |
| U1_E1AR |
GCAGTGCATGCAAGAAGAAT |
| U1_E1BF |
TGTCTGGCTGTTCCCACTTA |
| U1_E1BR |
CCAGAAGATGATGCCAAAGA |
| U1_PF |
GGTCATTCTCTACCCCAGCA |
| U1_PR |
AAAGCTGTCAGTCCACAAAGG |
| UGT1A7 | U7_E1AF |
AAACTCATATTGCAGCACAGG |
| U7_E1AR |
AAGTCAAAAATACCATTGGATGAA |
| U7_E1BF |
GGAAGATCACTGAATTGCACAG |
| U7_E1BR |
TTCCTCTGGGGGTAGTGTAGAA |
| U7_PF |
TCTTTCCGTCGAACATGAGA |
| U7_PR |
CACATTCACTGCCAATGATTTA |
| UGT1A9 | U9_E1AF |
CCAAGGCAAAGACCATAAGCTA |
| U9_E1AR |
CAAACTCCTGCAATTTGAAAAA |
| U9_E1BF |
CATATACCCTGGAGGATCTGGA |
| U9_E1BR |
CTGACGAGTACACGCATTGG |
| U9_PF |
CCTCTGACCTCAAGGAGTGC |
| U9_PR |
CAATGATTTACCCAAAAGAACAAG |
All sequences were analyzed with Phred, Phrap,
Consed and Polyphred programs (University of California, Oakland,
CA, USA; http://elcapitan.ucsd.edu/hyper/polyphred.usage.html)
and were compared with the reference sequence NC_000002.11 to
evaluate genetic variations. Estimating allele frequencies, testing
the Hardy-Weinberg equilibrium, measuring pairwise linkage
disequilibrium (LD) and estimating haplotype frequency were
performed using Haploview 4.2 (Broad Institute of MIT and Harvard,
Cambridge, MA, USA; http://www.broad.mit.edu/mpg/haploview/). Correlations
between the SNPs or haplotypes and toxicity or response were
analyzed by Pearson’s χ2 test. On account of the
exploratory nature of this study, no adjustments were made for
multiple comparisons.
Results
Patient characteristics
Between 2009 and 2013 at the Cancer Institute and
Hospital, Chinese Academy of Medical Sciences, a total of 84
consecutive patients with histologically confirmed mCRC were
included in this study. In total, 46 patients were treated with the
FOLFIRI regimen and 38 patients received the XELIRI regimen. The
patient baseline characteristics of the two chemotherapy regimens
are summarized in Table II. No
statistically significant differences were observed between the
baseline characteristics for the two regimens.
| Table IIBaseline patient characteristics. |
Table II
Baseline patient characteristics.
| FOLFIRI (n=46) | XELIRI (n=38) | |
|---|
|
|
| |
|---|
| Characteristics | n | % | n | % | P-value |
|---|
| Age, years | | | | | 0.49 |
| Median | 54 | 53 | |
| Range | 29–77 | 30–72 | |
| BSA,
m2 | | | | | 0.21 |
| Median | 1.78 | 1.73 | |
| Range | 1.42–2.10 | 1.40–2.00 | |
| Gender | | | | | 0.17 |
| Male | 33 | 71.74 | 21 | 55.26 | |
| Female | 13 | 28.26 | 17 | 44.74 | |
| Primary tumor
site | | | | | 0.66 |
| Colon | 28 | 60.87 | 25 | 65.79 | |
|
Rectum/rectosigmoid | 18 | 39.13 | 13 | 34.21 | |
| Metastatic
sites | | | | | 0.41 |
| 1 | 18 | 39.13 | 11 | 28.95 | |
| 2 | 21 | 45.65 | 17 | 44.74 | |
| ≥3 | 7 | 15.22 | 10 | 26.32 | |
| ECOG PS | | | | | 0.33 |
| 0 | 12 | 26.09 | 11 | 28.95 | |
| 1 | 34 | 73.91 | 25 | 65.79 | |
| 2 | 0 | 0.00 | 2 | 5.26 | |
| TNM stage | | | | | 0.27 |
| IIIB | 4 | 8.70 | 1 | 2.63 | |
| IIIC | 0 | 0.00 | 1 | 2.63 | |
| IV | 42 | 91.30 | 36 | 94.74 | |
Efficacy
The efficacy of the treatment groups is shown in
Table III. The disease control
rates did not differ significantly between the two chemotherapy
arms (69.57% for FOLFIRI and 61.11% for XELIRI; P=0.49). Although
the overall response rate of the FOLFIRI group was markedly higher
than that of the XELIRI group (21.74% for FOLFIRI and 13.89% for
XELIRI), the differences in the overall response rate between the
two groups did not appear to be statistically significant (P=0.40).
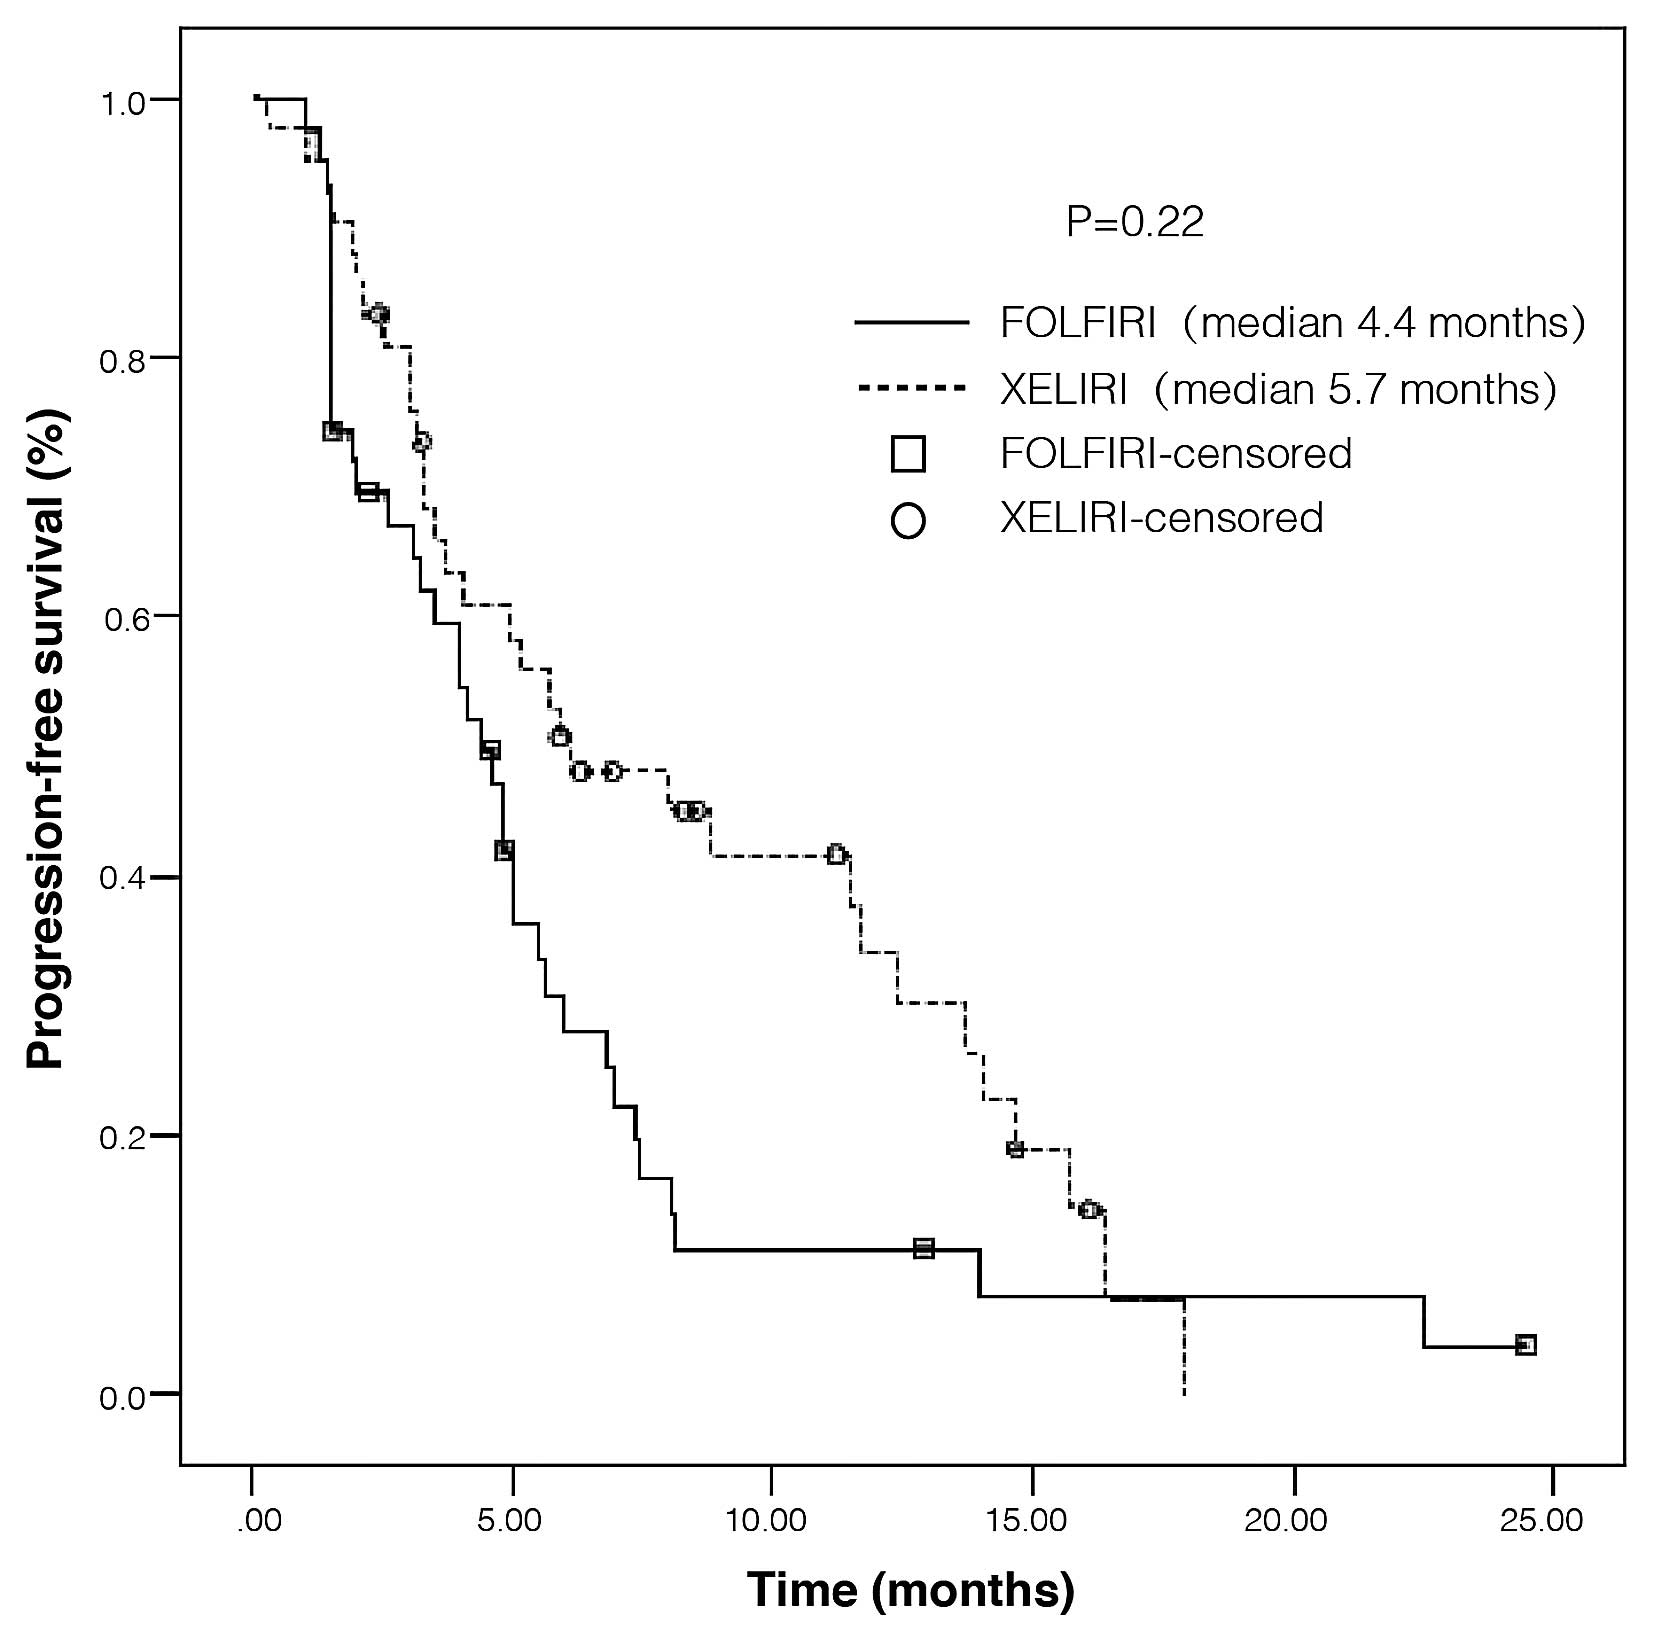
The PFS of patients in the FOLFIRI and XELIRI groups is presented
in Fig. 1. The median PFS time for
the patients in the FOLFIRI group was 4.4 months, and 5.7 months in
the XELIRI group. Although PFS improved for patients who received
XELIRI when compared with FOLFIRI, no statistically significant
differences were observed in PFS between the two groups (HR=1.35
for disease progression or mortality; 95% CI, 0.83–2.21;
P=0.22).
| Table IIIResponses to treatment. |
Table III
Responses to treatment.
| FOLFIRI (n=46) | XELIRI (n=38) | |
|---|
|
|
| |
|---|
| Response | n | % | n | % | P-value |
|---|
| CR | 0 | 0.00 | 0 | 0.00 | 0.59a |
| PR | 10 | 21.74 | 5 | 13.89 | |
| SD | 22 | 47.83 | 17 | 47.22 | |
| PD | 14 | 30.43 | 14 | 38.89 | |
| Not assessable | 0 | 0.00 | 2 | 5.56 | |
| Overall
responsea | 10 | 21.74 | 5 | 13.89 | 0.40 |
| Disease
controlb | 32 | 69.57 | 22 | 61.11 | 0.49 |
Tolerability
Adverse events of any grade in the FOLFIRI and
XELIRI treatment groups are shown in Table IV. The most common grade 3/4
adverse events associated with FOLFIRI and XELIRI were neutropenia
(26.09% in the FOLFIRI group and 5.26% in the XELIRI group) and
leukopenia (17.39% in the FOLFIRI groups and 10.53% in the XELIRI
group). FOLFIRI was associated with higher rates of grade 3/4
leukopenia, neutropenia, thrombocytopenia, nausea and vomiting.
However, these differences were not statistically significant, with
the exception of neutropenia, which was the most frequently
reported grade 3/4 hematological toxicity (P=0.03). Hand-foot
syndrome is the most common adverse event associated with
capecitabine; however, no hand-foot syndrome of grade 3/4 occurred
in either of these two groups.
| Table IVDrug-related adverse events. |
Table IV
Drug-related adverse events.
| FOLFIRI (n=46) | XELIRI (n=38) | |
|---|
|
|
| |
|---|
| Grade 1/2 | Grade 3/4 | Grade 1/2 | Grade 3/4 | |
|---|
|
|
|
|
| |
|---|
| Response | n | % | n | % | n | % | n | % | P-value |
|---|
| Hematological
events |
| Anemia | 20 | 43.48 | 1 | 2.17 | 19 | 50.00 | 2 | 5.26 | 0.58 |
| Leukopenia | 22 | 47.83 | 8 | 17.39 | 18 | 47.37 | 4 | 10.53 | 0.66 |
| Neutropenia | 14 | 30.43 | 12 | 26.09 | 18 | 47.37 | 2 | 5.26 | 0.03 |
|
Thrombocytopenia | 9 | 19.57 | 2 | 4.35 | 9 | 23.68 | 0 | 0.00 | 0.59 |
| Non-hematological
events |
| Asthenia | 1 | 2.17 | 0 | 0.00 | 3 | 7.89 | 0 | 0.00 | 0.32 |
| Nausea | 39 | 84.78 | 5 | 10.87 | 33 | 86.84 | 2 | 5.26 | 0.58 |
| Vomiting | 28 | 60.87 | 5 | 10.87 | 27 | 71.05 | 2 | 5.26 | 0.54 |
| Mucositis | 1 | 2.17 | 0 | 0.00 | 1 | 2.63 | 0 | 0.00 | 1.00 |
| Diarrhea | 10 | 21.74 | 2 | 4.35 | 13 | 34.21 | 2 | 5.26 | 0.39 |
| Neurotoxicity | 2 | 4.35 | 0 | 0.00 | 3 | 7.89 | 0 | 0.00 | 0.65 |
| Hand-foot
syndrome | 0 | 0.00 | 0 | 0.00 | 1 | 2.63 | 0 | 0.00 | 0.45 |
| Allergies | 0 | 0.00 | 0 | 0.00 | 1 | 2.63 | 1 | 2.63 | 0.20 |
Inherited genetic variations in UGT1A
gene
In total, 17 SNPs were identified across the
sequencing regions of the UGT1A1, UGT1A7 and
UGT1A9 genes; all of the SNPs under investigation were in
Hardy-Weinberg equilibrium (P>0.05). However, no significant
correlation was observed for efficacy (Table V). Certain SNPs exhibited an
association with severe toxicity; however, UGT1A1*28 and
UGT1A1*6, which have been previously reported (17,18),
were not significant (Table
VI).
| Table VAssociation of UGT1A polymorphisms
with efficacy. |
Table V
Association of UGT1A polymorphisms
with efficacy.
| | | | P-valueb |
|---|
| | | |
|
|---|
| Genes | SNP ID | Allelea | MAF | Overall
response | Disease
control |
|---|
| UGTIA9 | rs3806598 | | 0.295 | 0.605 | 0.605 |
| rs45440791 | | 0.023 | 0.613 | 0.613 |
| rs59870334 |
UGTIA9*22 | 0.429 | 0.767 | 0.670 |
| UGTIA7 | rs4530361 | | 0.295 | 0.605 | 0.605 |
| rs28946877 | | 0.167 | 0.168 | 0.949 |
| rs7586110 | | 0.310 | 0.685 | 0.290 |
| rs7577677 | | 0.295 | 0.605 | 0.605 |
| rs17868323 | UGTIA7*2 and
*3 | 0.432 | 0.749 | 0.749 |
| rs66534818 | UGTIA7*2 and
*3 | 0.432 | 0.749 | 0.749 |
| rs17868324 | UGTIA7*2 and
*3 | 0.432 | 0.749 | 0.749 |
| rs11692021 | UGTIA7*3 and
*4 | 0.295 | 0.605 | 0.605 |
| rs45462096 | | 0.023 | 0.000 | 0.000 |
| rs17864686 | | 0.159 | 0.184 | 0.825 |
| UGTIA1 | rs887829 | | 0.091 | 0.368 | 0.548 |
| rs873478 | | 0.045 | 0.468 | 0.468 |
| rs34815109 |
UGTIA1*28 | 0.114 | 0.292 | 0.792 |
| rs4148323 |
UGTIA1*6 | 0.250 | 0.361 | 0.068 |
| Table VICorrelation between UGT1A
polymorphisms and severe toxicity. |
Table VI
Correlation between UGT1A
polymorphisms and severe toxicity.
| | | | P-valueb |
|---|
| | | |
|
|---|
| Genes | SNP ID | Allelea | MAF | Anemia | Neutropenia | Leukopenia |
Thrombo-cytopenia | Nausea | Vomiting | Diarrhea | Allergies | Severetoxicity |
|---|
| UGTIA9 | rs3806598 | | 0.295 | 0.349 | 0.032 | 0.237 | 0.516 | 0.516 | 0.516 | 0.347 | 0.516 | 0.119 |
| rs45440791 | | 0.023 | 0.825 | 0.688 | 0.688 | 0.825 | 0.825 | 0.825 | 0.749 | 0.825 | 0.445 |
| rs59870334 |
UGTIA9*22 | 0.429 | 0.834 | 0.203 | 0.203 | 0.834 | 0.000 | 0.000 | 0.762 | 0.834 | 0.186 |
| UGTIA7 | rs4530361 | | 0.295 | 0.349 | 0.032 | 0.237 | 0.516 | 0.516 | 0.516 | 0.347 | 0.516 | 0.119 |
| rs28946877 | | 0.167 | 0.195 | 0.237 | 1.000 | 0.517 | 0.000 | 0.000 | 0.347 | 0.517 | 0.770 |
| rs7586110 | | 0.310 | 0.332 | 0.041 | 0.276 | 0.551 | 0.000 | 0.000 | 0.386 | 0.551 | 0.238 |
| rs7577677 | | 0.295 | 0.349 | 0.032 | 0.237 | 0.516 | 0.349 | 0.349 | 0.347 | 0.516 | 0.382 |
| rs17868323 | UGTIA7*2 and
*3 | 0.432 | 0.842 | 0.211 | 0.211 | 0.842 | 0.207 | 0.207 | 0.773 | 0.842 | 0.490 |
| rs66534818 | UGTIA7*2
and*3 | 0.432 | 0.842 | 0.211 | 0.211 | 0.842 | 0.207 | 0.207 | 0.773 | 0.842 | 0.490 |
| rs17868324 | UGTIA7*2
and*3 | 0.432 | 0.842 | 0.211 | 0.211 | 0.842 | 0.207 | 0.207 | 0.773 | 0.842 | 0.490 |
| rs11692021 | UGTIA7*3
and*4 | 0.295 | 0.349 | 0.032 | 0.237 | 0.516 | 0.516 | 0.516 | 0.347 | 0.516 | 0.119 |
| rs45462096 | | 0.023 | 0.825 | 0.688 | 0.011 | 0.825 | 0.825 | 0.825 | 0.749 | 0.825 | 0.181 |
| rs17864686 | | 0.159 | 0.177 | 0.252 | 0.957 | 0.529 | 0.529 | 0.529 | 0.362 | 0.529 | 0.640 |
| UGTIA1 | rs887829 | | 0.091 | 0.647 | 0.405 | 0.487 | 0.647 | 0.647 | 0.647 | 0.507 | 0.647 | 0.620 |
| rs873478 | | 0.045 | 0.002 | 0.565 | 0.565 | 0.752 | 0.752 | 0.752 | 0.647 | 0.752 | 0.682 |
| rs34815109 |
UGTIA1*28 | 0.114 | 0.604 | 0.660 | 0.660 | 0.604 | 0.604 | 0.604 | 0.453 | 0.604 | 0.858 |
| rs4148323 |
UGTIA1*6 | 0.250 | 0.403 | 0.128 | 0.612 | 0.403 | 0.403 | 0.403 | 1.000 | 0.403 | 0.469 |
Among the detected variants, only the common SNPs
with a minor allele frequency (MAF) of >10% were tested for
pairwise LD. Two main linkage blocks were observed across the
sequenced region, while two major haplotypes were identified by
haplotype analysis using Haploview; ATA in block one (56.4%) and
TCTCGT in block two (54.5%). Haplotype H7, which includes
UGT1A7*2, UGT1A7*3 and UGT1A7*4, was found to
correlate with the disease control rate (P=0.045) (Table VII); while haplotypes H2 and H5
were observed to correlate with a higher risk of severe neutropenia
(Table VIII).
| Table VIICorrelation between UGT1A haplotypes
and efficacy |
Table VII
Correlation between UGT1A haplotypes
and efficacy
| | | | P-valuea |
|---|
| | | |
|
|---|
| Block | ID | Haplotype | MAF | Overall
response | Disease
control |
|---|
| 1 | H1 | ATA | 0.564 | 0.725 | 0.544 |
| H2 | CAG | 0.295 | 0.605 | 0.605 |
| H3 | AAA | 0.141 | 0.222 | 0.851 |
| 2 | H4 | TCTCGT | 0.545 | 0.633 | 0.753 |
| H5 | GAGAAC | 0.272 | 0.478 | 0.862 |
| H6 | TCGAAT | 0.136 | 0.232 | 0.232 |
| H7 | GAGAAT | 0.023 | 0.614 | 0.045 |
| H8 | TCTCGC | 0.015 | 0.692 | 0.118 |
| Table VIIICorrelation between UGT1A haplotypes
and severe toxicity. |
Table VIII
Correlation between UGT1A haplotypes
and severe toxicity.
| | | | P-valuea |
|---|
| | | |
|
|---|
| Block | ID | Haplotype | MAF | Anemia | Neutropenia | Leukopenia | Thrombo-
cytopenia | Nausea | Vomiting | Diarrhea | Allergies | Severe
toxicity |
|---|
| 1 | H1 | ATA | 0.564 | 0.853 | 0.221 | 0.221 | 0.853 | 0.633 | 0.633 | 0.788 | 0.853 | 0.161 |
| H2 | CAG | 0.295 | 0.349 | 0.032 | 0.237 | 0.516 | 0.516 | 0.516 | 0.347 | 0.516 | 0.119 |
| H3 | AAA | 0.141 | 0.135 | 0.286 | 0.845 | 0.558 | 0.865 | 0.865 | 0.396 | 0.558 | 0.961 |
| 2 | H4 | TCTCGT | 0.545 | 0.896 | 0.261 | 0.262 | 0.893 | 0.896 | 0.896 | 0.846 | 0.893 | 0.276 |
| H5 | GAGAAC | 0.272 | 0.376 | 0.020 | 0.178 | 0.461 | 0.376 | 0.376 | 0.286 | 0.461 | 0.250 |
| H6 | TCGAAT | 0.136 | 0.125 | 0.295 | 0.816 | 0.565 | 0.565 | 0.565 | 0.405 | 0.565 | 0.868 |
| H7 | GAGAAT | 0.023 | 0.824 | 0.695 | 0.690 | 0.832 | 0.824 | 0.824 | 0.759 | 0.832 | 0.452 |
| H8 | TCTCGC | 0.015 | 0.860 | 0.761 | 0.754 | 0.871 | 0.000 | 0.000 | 0.814 | 0.871 | 0.296 |
Discussion
A number of phase II studies on XELIRI have
suggested acceptable response rates and tolerability (22,23).
However, in the phase III study by Fuchs et al (10), a significantly shorter PFS was noted
for the XELIRI regimen, which was also associated with higher rates
of severe vomiting, diarrhea and dehydration.
The present study investigated the second-line
treatment of mCRC, and demonstrated that the XELIRI regimen, which
is composed of irinotecan with oral capecitabine, offers similar
disease control rates (69.57% for FOLFIRI and 61.11% for XELIRI;
P=0.49) and longer PFS (median, 4.4 months for FOLFIRI and 5.7
months for XELIRI) when compared with FOLFIRI. Additionally, grade
3/4 leukopenia, neutropenia, thrombocytopenia, nausea and vomiting
were less frequently observed in patients treated with the XELIRI
regimen when compared with the FOLFIRI regimen; however, these were
not significant, with the exception of neutropenia (P=0.03).
Furthermore, no occurrence of hand-foot syndrome of grade 3/4 was
observed in the XELIRI treatment group, which is the most common
adverse event associated with capecitabine.
Taking the physical health of the patients into
account, the dose of oral capecitabine was reduced to 800
mg/m2 twice a day on days 1–14. The lower overall
response rate (21.74% for FOLFIRI and 13.89% for XELIRI; P=0.40)
and reduced toxicity may result from the lower doses of the
combination of capecitabine and irinotecan. Alternatively, another
reason for this may be that the patients neglect one or more doses
of the regular dosing schedule, as capecitabine is an oral drug
that must be self-taken by the patient at home.
In conclusion, the present study demonstrated that
XELIRI is an effective treatment regimen with acceptable response
rates and tolerability for mCRC patients as a second-line treatment
in addition to FOLFIRI.
Irinotecan, which is the common drug in FOLFIRI and
XELIRI regimens, has a narrow therapeutic range, and severe
toxicity may limit the dose that can be safely administered
(24). The increasing knowledge of
human genetic variations is likely to aid with personalized
treatment.
The current study is different from previous
studies, which have concentrated more on several specific alleles,
including UGT1A1*28, UGT1A1*6, UGT1A7*2 and
UGT1A9*22 (17,18,25,26).
In order to obtain further information, the promoter and exon 1 of
UGT1A1, UGT1A7 and UGT1A9 were screened, and
17 SNPs as well as two main linkage blocks were identified. When
only the SNPs and haplotypes with MAF of >10% were considered to
minimize the statistical discrepancy, no significant correlation
with treatment efficacy was observed. In total, five SNPs were
identified to reveal a correlation with grade 3/4 neutropenia,
including UGT1A7*4; however, the correlation with
UGT1A1*28 and UGT1A1*6, which has been repeatedly
reported, was not significant. Furthermore, the H2 haplotype, which
includes UGT1A9*22, and the H5 and H7 haplotypes, which
include UGT1A7*2, UGT1A7*3 and UGT1A7*4, were
associated with an increased risk of severe neutropenia. The
limitations of this study are the exploratory nature and the
limited sample size. Therefore, the results must be confirmed by
additional studies comprising a larger number of patients and a
more comprehensive assessment of variations in UGT1A in the
future.
References
|
1
|
Jemal A, Bray F, Center MM, Ferlay J, Ward
E and Forman D: Global Cancer Statistics. CA Cancer J Clin.
61:69–90. 2011.
|
|
2
|
Chen Q, Liu ZC, Cheng LP, et al: An
analysis of incidence and mortality of colorectal cancer in China,
2003–2007. China Cancer. 21:179–182. 2012.(In Chinese).
|
|
3
|
Meropol NJ: Oral fluoropyrimidines in the
treatment of colorectal cancer. Eur J Cancer. 34:1509–1513.
1998.
|
|
4
|
Mayer RJ: Oral versus intravenous
fluoropyrimidines for advanced colorectal cancer: by either route,
it’s all the same. J Clin Oncol. 19:4093–4096. 2001.
|
|
5
|
Massuti B, Gómez A, Sastre J, et al:
Randomized phase III trial of the TTD Group comparing capecitabine
and oxaliplatin (XELOX) vs. oxaliplatin and 5-fluorouracil in
continuous infusion (FUFOX) as first line treatment in advanced or
metastatic colorectal cancer (CRC). J Clin Oncol. 24(Suppl 18):
S1652006.
|
|
6
|
Díaz-Rubio E, Tabernero J, Gómez-España A,
et al; Spanish Cooperative Group for the Treatment of Digestive
Tumors Trial. Phase III study of capecitabine plus oxaliplatin
compared with continuous-infusion fluorouracil plus oxaliplatin as
first-line therapy in metastatic colorectal cancer: final report of
the Spanish Cooperative Group for the Treatment of Digestive Tumors
Trial. J Clin Oncol. 25:4224–4230. 2007.
|
|
7
|
Tol J, Koopman M, Rodenburg CJ, et al: A
randomised phase III study on capecitabine, oxaliplatin and
bevacizumab with or without cetuximab in first-line advanced
colorectal cancer, the CAIRO2 study of the Dutch Colorectal Cancer
Group (DCCG). An interim analysis of toxicity. Ann Oncol.
19:734–738. 2008.
|
|
8
|
Cunningham D, Pyrhönen S, James RD, et al:
Randomised trial of irinotecan plus supportive care versus
supportive care alone after fluorouracil failure for patients with
metastatic colorectal cancer. Lancet. 352:1413–1418. 1998.
|
|
9
|
Rougier P, Van Cutsem E, Bajetta E, et al:
Randomised trial of irinotecan versus fluorouracil by continuous
infusion after fluorouracil failure in patients with metastatic
colorectal cancer. Lancet. 352:1407–1412. 1998.
|
|
10
|
Fuchs CS, Moore MR, Harker G, et al: Phase
III comparison of two irinotecan dosing regimens in second-line
therapy of metastatic colorectal cancer. J Clin Oncol. 21:807–814.
2003.
|
|
11
|
Munoz A, Salud A, Giron CG, et al:
Randomised phase III trial comparing irinotecan plus capecitabine
(XELIRI regimen) vs. irinotecan, 5-Fu and folinic acid (Saltz
regimen) as first-line treatment in patients (pts) with metastatic
colorectal cancer (MCRC). Ann Oncol. 17(Suppl 9): S1202006.
|
|
12
|
Koopman M, Antonini NF, Douma J, et al:
3015 ORAL Sequential vs. combination chemotherapy with
capecitabine, irinotecan, and oxaliplatin in advanced colorectal
cancer (ACC). A Dutch Colorectal Cancer Group (DCCG) phase III
study. Eur J Cancer. (Suppl 5): S239–S240. 2007.
|
|
13
|
Pectasides D, Papaxoinis G, Kalogeras KT,
et al: XELIRI-bevacizumab versus FOLFIRI-bevacizumab as first-line
treatment in patients with metastatic colorectal cancer: a Hellenic
Cooperative Oncology Group phase III trial with collateral
biomarker analysis. BMC Cancer. 12:2712012.
|
|
14
|
Skof E, Rebersek M, Hlebanja Z and Ocvirk
J: Capecitabine plus Irinotecan (XELIRI regimen) compared to
5-FU/LV plus Irinotecan (FOLFIRI regimen) as neoadjuvant treatment
for patients with unresectable liver-only metastases of metastatic
colorectal cancer: a randomised prospective phase II trial. BMC
Cancer. 9:1202009.
|
|
15
|
Lévesque E, Bélanger AS, Harvey M, et al:
Refining the UGT1A haplotype associated with irinotecan-induced
hematological toxicity in metastatic colorectal cancer patients
treated with 5-fluorouracil/irinotecan-based regimens. J Pharmacol
Exp Ther. 345:95–101. 2013.
|
|
16
|
Ratain MJ: From bedside to bench to
bedside to clinical practice: an odyssey with irinotecan. Clin
Cancer Res. 12:1658–1660. 2006.
|
|
17
|
Han JY, Lim HS, Shin ES, et al:
Comprehensive analysis of UGT1A polymorphisms predictive for
pharmacokinetics and treatment outcome in patients with
non-small-cell lung cancer treated with irinotecan and cisplatin. J
Clin Oncol. 24:2237–2244. 2006.
|
|
18
|
Takano M, Kato M, Yoshikawa T, et al:
Clinical significance of UDP-glucuronosyltransferase 1A1*6 for
toxicities of combination chemotherapy with irinotecan and
cisplatin in gynecologic cancers: a prospective multi-institutional
study. Oncology. 76:315–321. 2009.
|
|
19
|
Carlini LE, Meropol NJ, Bever J, et al:
UGT1A7 and UGT1A9 polymorphisms predict response and toxicity in
colorectal cancer patients treated with capecitabine/irinotecan.
Clin Cancer Res. 11:1226–1236. 2005.
|
|
20
|
Eisenhauer EA, Therasse P, Bogaerts J, et
al: New response evaluation criteria in solid tumours: revised
RECIST guideline (version 1.1). Eur J Cancer. 45:228–247. 2009.
|
|
21
|
Ajani JA, Welch SR, Raber MN, Fields WS
and Krakoff IH: Comprehensive criteria for assessing
therapy-induced toxicity. Cancer Invest. 8:147–159. 1990.
|
|
22
|
Borner MM, Bernhard J, Dietrich D, et al;
Swiss Group for Clinical Cancer Research (SAKK), Berne,
Switzerland. A randomized phase II trial of capecitabine and two
different schedules of irinotecan in first-line treatment of
metastatic colorectal cancer: efficacy, quality-of-life and
toxicity. Ann Oncol. 16:282–288. 2005.
|
|
23
|
Rea DW, Nortier JW, Ten Bokkel Huinink WW,
et al: A phase I/II and pharmacokinetic study of irinotecan in
combination with capecitabine as first-line therapy for advanced
colorectal cancer. Ann Oncol. 16:1123–1132. 2005.
|
|
24
|
Mathijssen RH and Gurney H: Irinogenetics:
how many stars are there in the sky? J Clin Oncol. 27:2578–2579.
2009.
|
|
25
|
Innocenti F, Undevia SD, Iyer L, et al:
Genetic variants in the UDP-glucuronosyltransferase 1A1 gene
predict the risk of severe neutropenia of irinotecan. J Clin Oncol.
22:1382–1388. 2004.
|
|
26
|
Cecchin E, Innocenti F, D’Andrea M, et al:
Predictive role of the UGT1A1, UGT1A7, and UGT1A9 genetic variants
and their haplotypes on the outcome of metastatic colorectal cancer
patients treated with fluorouracil, leucovorin, and irinotecan. J
Clin Oncol. 27:2457–2465. 2009.
|